Road transportation emission inventories and projections – Case study of Belgium: Methodology and pitfalls Marlies Vanhulsel ⇑ , Bart Degraeuwe, Carolien Beckx, Jean Vankerkom, Ina De Vlieger VITO, Boeretang 200, 2400 Mol, Belgium article info Keywords: Road transportation Vehicle emissions Emissions inventories Pollution projections abstract This paper quantifies the effect of a number of input parameters on the emission levels of road transport emissions calculated by means of a bottom-up methodology. The input parameters considered cover small diesel cars, calculation of additional fuel consumption due to the use of mobile air conditioning in passenger cars and light commercial vehicles, fine-tuning of trip lengths and definition of road types for Belgium in 2010. The effect is significant for CO 2 , and even more pronounced for other pollutants such as NO x , PM 2.5 , and VOCs. Ó 2014 Elsevier Ltd. All rights reserved. 1. Introduction Nation-wide emission inventories and projections are often used to determine permitted emission levels, and to gain in- sight into emission levels expected in the future. In this context, transport emission models are applied to provide input. In particular, regarding road transport, emission models generally calculate fuel consumptions and emissions using bottom-up methodologies, starting from the underlying activities – as defined by the vehicle stock and kilometres travelled on the net- work – and detailed technical emission factors. A well-known tool for road transport emission inventories in Europe is CO- PERT (Ntziachristos and Samaras, 2010), which is widely used for estimating air pollutant and greenhouse gas emissions from road transport required in the annual emission inventories of European Environment Agency member countries. COPERT calculates emissions from automobiles, light and heavy duty vehicles, including busses, mopeds and motorcycles. The emission factors are subdivided according to cylinder capacity or weight class, fuel technology, road type (urban, rural, highway) and emission control technology (e.g. euro norms). Emissions include hot emissions, cold start overemissions – emitted during the warming-up phase – and non-exhaust emissions – caused by fuel evaporation and wear of brakes and tyres (Ntziachristos and Samaras, 2010). Several input parameters are necessary in the calculations, but as these also deter- mine the resulting emissions, possible over- or underestimates of road transport emissions can occur. Here we discusses a number of parameters influencing the uncertainty of the models’ outcome. 2. Methodology We estimate road transport emissions within E-Motion Road, a framework designed to calculate energy consumption and emission for road transport. E-Motion Road calculates bottom-up energy consumption and emissions for automobiles, light commercial vehicles, busses and coaches, heavy duty vehicles and mopeds and motorcycles. It not only focuses on drawing up inventories, but also enables projections to be made of energy consumptions and emissions. Future scenarios include alternative fuel technologies such as hybrids (both charge sustaining and plug-in hybrids) and hydrogen. E-Motion Road 1361-9209/$ - see front matter Ó 2014 Elsevier Ltd. All rights reserved. http://dx.doi.org/10.1016/j.trd.2013.12.002 ⇑ Corresponding author. Tel.: +32 14335952; fax: +32 14335599. E-mail address: [email protected](M. Vanhulsel). Transportation Research Part D 27 (2014) 41–45 Contents lists available at ScienceDirect Transportation Research Part D journal homepage: www.elsevier.com/locate/trd
Transcript
Transportation Research Part D 27 (2014) 41–45
Contents lists available at ScienceDirect
Transportation Research Part D
journal homepage: www.elsevier .com/ locate/ t rd
Road transportation emission inventories and projections –Case study of Belgium: Methodology and pitfalls
1361-9209/$ - see front matter � 2014 Elsevier Ltd. All rights reserved.http://dx.doi.org/10.1016/j.trd.2013.12.002
This paper quantifies the effect of a number of input parameters on the emission levels ofroad transport emissions calculated by means of a bottom-up methodology. The inputparameters considered cover small diesel cars, calculation of additional fuel consumptiondue to the use of mobile air conditioning in passenger cars and light commercial vehicles,fine-tuning of trip lengths and definition of road types for Belgium in 2010. The effect issignificant for CO2, and even more pronounced for other pollutants such as NOx, PM2.5,and VOCs.
� 2014 Elsevier Ltd. All rights reserved.
1. Introduction
Nation-wide emission inventories and projections are often used to determine permitted emission levels, and to gain in-sight into emission levels expected in the future. In this context, transport emission models are applied to provide input. Inparticular, regarding road transport, emission models generally calculate fuel consumptions and emissions using bottom-upmethodologies, starting from the underlying activities – as defined by the vehicle stock and kilometres travelled on the net-work – and detailed technical emission factors. A well-known tool for road transport emission inventories in Europe is CO-PERT (Ntziachristos and Samaras, 2010), which is widely used for estimating air pollutant and greenhouse gas emissionsfrom road transport required in the annual emission inventories of European Environment Agency member countries.
COPERT calculates emissions from automobiles, light and heavy duty vehicles, including busses, mopeds and motorcycles.The emission factors are subdivided according to cylinder capacity or weight class, fuel technology, road type (urban, rural,highway) and emission control technology (e.g. euro norms). Emissions include hot emissions, cold start overemissions –emitted during the warming-up phase – and non-exhaust emissions – caused by fuel evaporation and wear of brakes andtyres (Ntziachristos and Samaras, 2010). Several input parameters are necessary in the calculations, but as these also deter-mine the resulting emissions, possible over- or underestimates of road transport emissions can occur. Here we discusses anumber of parameters influencing the uncertainty of the models’ outcome.
2. Methodology
We estimate road transport emissions within E-Motion Road, a framework designed to calculate energy consumption andemission for road transport. E-Motion Road calculates bottom-up energy consumption and emissions for automobiles, lightcommercial vehicles, busses and coaches, heavy duty vehicles and mopeds and motorcycles. It not only focuses on drawingup inventories, but also enables projections to be made of energy consumptions and emissions. Future scenarios includealternative fuel technologies such as hybrids (both charge sustaining and plug-in hybrids) and hydrogen. E-Motion Road
42 M. Vanhulsel et al. / Transportation Research Part D 27 (2014) 41–45
includes exhaust emissions of the pollutants CO, NOx, VOS, CH4, N2O, NH3, PM2.5, NO2, CO2, SO2, Pb, Cd, Cu, Cr, Ni, Se and Zn,as well as non-exhaust emissions of the pollutants TSP (suspended particles), PM10, PM2.5, PM1, PM0.1, benzo(a)pyrene,benzo(b)fluoranthene, benzo(k)fluoranthene, benzo(ghi)perylene, fluoranthene, indeno(1,2,3-cd)pyrene, Pb, Cd, Cu, Cr, Niand Se. Here we concentrate on CO2, NOx and PM2.5, the most prominent.
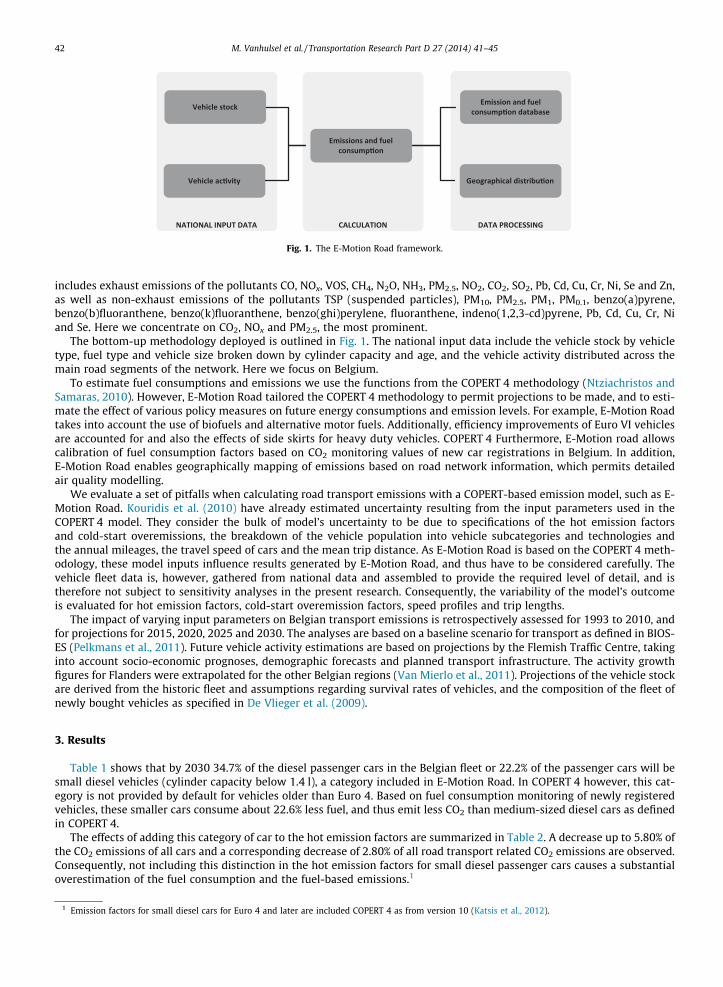
The bottom-up methodology deployed is outlined in Fig. 1. The national input data include the vehicle stock by vehicletype, fuel type and vehicle size broken down by cylinder capacity and age, and the vehicle activity distributed across themain road segments of the network. Here we focus on Belgium.
To estimate fuel consumptions and emissions we use the functions from the COPERT 4 methodology (Ntziachristos andSamaras, 2010). However, E-Motion Road tailored the COPERT 4 methodology to permit projections to be made, and to esti-mate the effect of various policy measures on future energy consumptions and emission levels. For example, E-Motion Roadtakes into account the use of biofuels and alternative motor fuels. Additionally, efficiency improvements of Euro VI vehiclesare accounted for and also the effects of side skirts for heavy duty vehicles. COPERT 4 Furthermore, E-Motion road allowscalibration of fuel consumption factors based on CO2 monitoring values of new car registrations in Belgium. In addition,E-Motion Road enables geographically mapping of emissions based on road network information, which permits detailedair quality modelling.
We evaluate a set of pitfalls when calculating road transport emissions with a COPERT-based emission model, such as E-Motion Road. Kouridis et al. (2010) have already estimated uncertainty resulting from the input parameters used in theCOPERT 4 model. They consider the bulk of model’s uncertainty to be due to specifications of the hot emission factorsand cold-start overemissions, the breakdown of the vehicle population into vehicle subcategories and technologies andthe annual mileages, the travel speed of cars and the mean trip distance. As E-Motion Road is based on the COPERT 4 meth-odology, these model inputs influence results generated by E-Motion Road, and thus have to be considered carefully. Thevehicle fleet data is, however, gathered from national data and assembled to provide the required level of detail, and istherefore not subject to sensitivity analyses in the present research. Consequently, the variability of the model’s outcomeis evaluated for hot emission factors, cold-start overemission factors, speed profiles and trip lengths.
The impact of varying input parameters on Belgian transport emissions is retrospectively assessed for 1993 to 2010, andfor projections for 2015, 2020, 2025 and 2030. The analyses are based on a baseline scenario for transport as defined in BIOS-ES (Pelkmans et al., 2011). Future vehicle activity estimations are based on projections by the Flemish Traffic Centre, takinginto account socio-economic prognoses, demographic forecasts and planned transport infrastructure. The activity growthfigures for Flanders were extrapolated for the other Belgian regions (Van Mierlo et al., 2011). Projections of the vehicle stockare derived from the historic fleet and assumptions regarding survival rates of vehicles, and the composition of the fleet ofnewly bought vehicles as specified in De Vlieger et al. (2009).
3. Results
Table 1 shows that by 2030 34.7% of the diesel passenger cars in the Belgian fleet or 22.2% of the passenger cars will besmall diesel vehicles (cylinder capacity below 1.4 l), a category included in E-Motion Road. In COPERT 4 however, this cat-egory is not provided by default for vehicles older than Euro 4. Based on fuel consumption monitoring of newly registeredvehicles, these smaller cars consume about 22.6% less fuel, and thus emit less CO2 than medium-sized diesel cars as definedin COPERT 4.
The effects of adding this category of car to the hot emission factors are summarized in Table 2. A decrease up to 5.80% ofthe CO2 emissions of all cars and a corresponding decrease of 2.80% of all road transport related CO2 emissions are observed.Consequently, not including this distinction in the hot emission factors for small diesel passenger cars causes a substantialoverestimation of the fuel consumption and the fuel-based emissions.1
1 Emission factors for small diesel cars for Euro 4 and later are included COPERT 4 as from version 10 (Katsis et al., 2012).
Table 1Share of small diesel passenger cars with respect to the passenger car, the diesel automobile, and the small andmedium-sized diesel passenger car fleets.
Share of small diesel PCwith respect to:
. . . all PC (%) . . . all diesel PC (%) . . . all diesel PC lessthan 2.0 l (%)
M. Vanhulsel et al. / Transportation Research Part D 27 (2014) 41–45 43
Another parameter that influences hot emissions is the use of mobile air conditioning (A/C) in cars and light commercialvehicles (LDV). The methodology to calculate the A/C-surplus is based on Rijkeboer et al. (2002). Depending on the outsidetemperature and fuel type, the A/C-surplus ranges from 0.15% and 0.11% at 15 �C to 3.34% and 2.43% at 60 �C for petrol anddiesel engines.
The annual level of A/C implementation in newly sold cars is based on information from sample drawings of GOCA, theBelgian motor vehicle inspection company, for historic years (ECONOTEC and VITO, 2007)2 and on assumptions on the shareof A/C equipped cars for forecasted years (Clodic et al., 2005). Furthermore, improvements of the conventional R134a A/C sys-tem influenced by the EU directive 2006/40/EC for the future energy consumption and emissions calculations are also accountedfor (Smokers et al., 2006).
Table 3 shows that the effect of the use of mobile air conditioning in passenger cars and light duty vehicles is small forinventory years, but grows for future prognoses up to a surplus of 1.8% on CO2 emissions for CAR and LDV and 1% on CO2
emissions of all road transportation in 2030.3
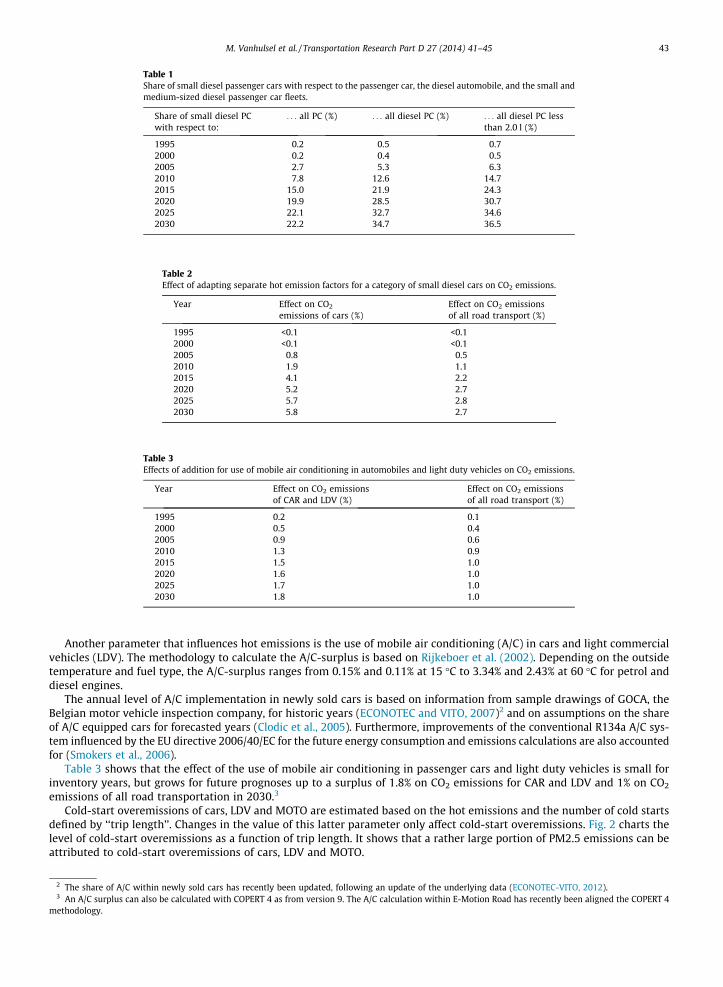
Cold-start overemissions of cars, LDV and MOTO are estimated based on the hot emissions and the number of cold startsdefined by ‘‘trip length’’. Changes in the value of this latter parameter only affect cold-start overemissions. Fig. 2 charts thelevel of cold-start overemissions as a function of trip length. It shows that a rather large portion of PM2.5 emissions can beattributed to cold-start overemissions of cars, LDV and MOTO.
2 The share of A/C within newly sold cars has recently been updated, following an update of the underlying data (ECONOTEC-VITO, 2012).3 An A/C surplus can also be calculated with COPERT 4 as from version 9. The A/C calculation within E-Motion Road has recently been aligned the COPERT 4
methodology.
Fig. 2. Sensitivity of emission level for PM2.5, VOCs, CO2 and NOx to trip length for Flanders in 2010. Note: emission level for trip distance of 35 km = 100.
44 M. Vanhulsel et al. / Transportation Research Part D 27 (2014) 41–45
The sensitivity of the calculations of cold-start overemissions of CO2, NOx, PM2.5 and VOCs with respect to the trip lengthparameter is also analysed. The starting point of this analysis is a calculation for Belgium in 2010, assuming a trip length of12.4 km for cars, LDV and MOTO, the trip length for Belgium forwarded in COPERT (Ntziachristos and Samaras, 2010). Theeffect on the emission level of automobiles in Flanders in 2010 of an increase of trip length by 1 km with respect to the baseof 12.4 km amounts to a decrease of 0.6% for CO2, 0.3% for NOx, 3.5% for PM2.5 and 2.8 for VOCs.
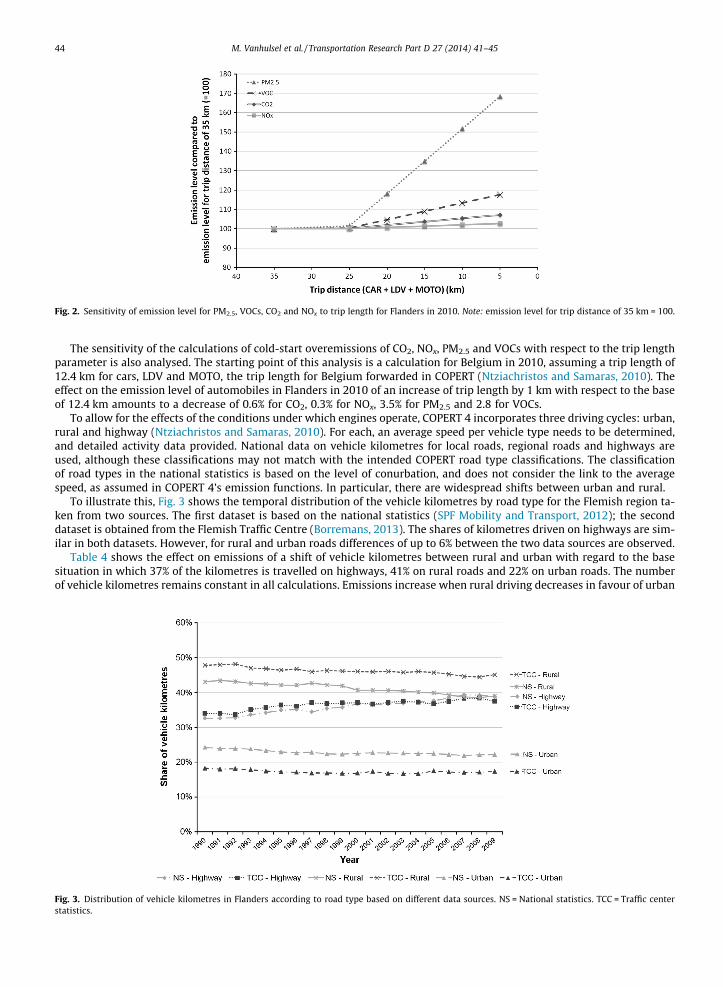
To allow for the effects of the conditions under which engines operate, COPERT 4 incorporates three driving cycles: urban,rural and highway (Ntziachristos and Samaras, 2010). For each, an average speed per vehicle type needs to be determined,and detailed activity data provided. National data on vehicle kilometres for local roads, regional roads and highways areused, although these classifications may not match with the intended COPERT road type classifications. The classificationof road types in the national statistics is based on the level of conurbation, and does not consider the link to the averagespeed, as assumed in COPERT 4’s emission functions. In particular, there are widespread shifts between urban and rural.
To illustrate this, Fig. 3 shows the temporal distribution of the vehicle kilometres by road type for the Flemish region ta-ken from two sources. The first dataset is based on the national statistics (SPF Mobility and Transport, 2012); the seconddataset is obtained from the Flemish Traffic Centre (Borremans, 2013). The shares of kilometres driven on highways are sim-ilar in both datasets. However, for rural and urban roads differences of up to 6% between the two data sources are observed.
Table 4 shows the effect on emissions of a shift of vehicle kilometres between rural and urban with regard to the basesituation in which 37% of the kilometres is travelled on highways, 41% on rural roads and 22% on urban roads. The numberof vehicle kilometres remains constant in all calculations. Emissions increase when rural driving decreases in favour of urban
Fig. 3. Distribution of vehicle kilometres in Flanders according to road type based on different data sources. NS = National statistics. TCC = Traffic centerstatistics.
Table 4Effect of shift of vehicle kilometres between rural and urban on emissions of road transportation for Belgium in 2010.
Table 5Impact of varying input parameters on CO2 emission level for Belgium in 2010 and 2030.
Input parameter 2010 (%) 2030 (%)
Inclusion of small diesel cars �1.1 �2.7Calculation of extra fuel consumption due to use of mobile air conditioning +0.9 +1.0Fine-tuning of trip length to 15 km instead 12.4 km �0.9 –Definition of road types: rural +16% and urban �22% �1.3 –
M. Vanhulsel et al. / Transportation Research Part D 27 (2014) 41–45 45
driving largely because rural kilometres are assumed to be driven at a speed of 56 km/h, except for mopeds, and urban kilo-metres at a speed of 29 km/h, except for buses.
4. Conclusions
The paper has examined the impact of varying input parameters on emission levels from road transport. The input param-eters subject to evaluation were the inclusion of small diesel cars, calculation of additional fuel consumption due to the useof mobile air conditioning in passenger cars and light commercial vehicles, fine-tuning of trip lengths and definition of roadtypes. Table 5 summarizes the possible effects of these parameters on CO2 emissions in Belgium. For other pollutants, suh as,NOx, PM2.5 and VOCs, the effects of parameter assumptions could be even more pronounced.
Acknowledgments
The analyses and results described here were partially performed in the course a project concerning the analysis of emis-sions and energy inventories and prognoses for road transport granted by LNE, the Flemish department for Environment,Nature and Energy.
References
Borremans, D., 2013, Annual Traffic Counts, Flemish Traffic Centre (VVC), Personal Communication.Clodic, D., Baker, J., Chen, J., Hirata, T., Hwang, R., Köhler, J., Petitjean, C., Suwono, A., 2005. Special report on Safeguarding the Ozone Layer and the Global
Climate System: Issues Related to Hydrofluorocarbons and Perfluorocarbons. Cambridge University Press, Cambridge.De Vlieger, I., Pelkmans, L., Schrooten, L., Vankerkom, J., Vanderschaeghe, M., Grispen, R., Borremans, D., Vanherle, K., Delhaye, E., Breemersch, T., De Geest,
C., 2009. Toekomstverkenning MIRA-S 2009 – Wetenschappelijk rapport – Sector ‘Transport’: referentie-en Europascenario.ECONOTEC & VITO 2007, Update of the Emission Inventory of Ozone Depleting Substances. HFCs, PFCs and SF6 for 2006 in Belgium.ECONOTEC-VITO, 2012. Update of the Emission Inventory of Ozone Depleting Substances, HFCs, PFCs and SF6 for 2010 in Belgium.Katsis, P., Ntziachristos, L., Mellios, G., 2012. Description of New Elements in COPERT 4 v10.0.Kouridis, C., Gkatzoflias, D., Kioutsioukis, I., Ntziachristos, L., Pastorello, C., Dilara, P., 2010. Uncertainty Estimates and Guidance for Road Transport Emission
Calculations.Ntziachristos, L., Samaras, Z., 2010. EMEP/EEA Emission Inventory Guidebook 2009, updated June 2010: Exhaust emissions from road transport.Pelkmans, L., De Vlieger, I., Beckx, C., Lenaers, G., Van Mierlo, J., Boureima, F.-S., De Ruyck, J., Bram, S., Macharis, C., Turcksin, L., Jossart, J.-M., Mertens, L.,
2011. BIOSES – Sustainable biofuel use in Belgium, Final scientic report.Rijkeboer, R.C., Gense, R.L.J., Vermeulen, R.J., 2002. Options to integrate the use of mobile airconditioning systems and auxiliary heaters into the emission
type approval test and the fuel consumption test for passenger cars (M1 vehicles), TNO.Smokers, R., Vermeulen, R., van Mieghem, R., Gense, R., Skinner, I., Fergusson, M., MacKay, E., ten Brink, P., Fontaras, G., & Samaras, Z., 2006. Review and
analysis of the reduction potential and costs of technological and other measures to reduce CO2-emissions from passenger cars.SPF Mobility and Transport. Vehicle kilometres per road type, region and year, 2012. SPF Mobility and Transport. <http://www.mobilit.belgium.be/nl/