Association for European Transport 2003 ROAD USER CHARGING FOR ROADS IN EGYPT: A CASE STUDY OF CAIRO-ALEXANDRIA TOLL ROAD Dr. Khaled A. Abbas 1 Professor Egypt National Institute of Transport P.O. Box 34 Abbassia – Nasr Road – Nasr City Cairo – Egypt email: [email protected]1. INTRODUCTION Charging road users has several purposes, the first is to provide a mechanism by which users pay for the costs they impose on the road as well as for the benefits they enjoy from using the road. In addition, road user charging represents a source of revenue for highway agencies. This research starts by reviewing the current situation of toll roads in Egypt. The core of the research is to develop a simulation model that can be used to compute toll rates that are equivalent to the benefits enjoyed by road users. A case study of the first and most vital toll road in Egypt, namely Cairo Alexandria desert road, is considered. In this context, a review of traffic patterns on the road is presented. Several methodological steps are then followed as part of the framework for simulating the effects induced by changes in toll rates on travel demand as well as on toll revenues. First, vehicle operation costs, time passenger costs, as well as vehicle running time costs are reviewed from previous studies and updated. This is culminated into the formulation of generalized cost functions for four types of vehicles on both alternative roads along the Cairo-Alexandria corridor, namely the Cairo-Alexandria desert tolled road as well as the Cairo Alexandria agriculture road. The expected difference in the generalized costs is considered as a benefit for road users using the Cairo-Alexandria desert road. These are compared with current charged tolls and the discrepancy of charging very low toll rates is identified. The discrepancy represents the forgone income by the road agency. In order to simulate the effect of toll rate changes on traffic demand as well as on generated toll revenue, four binary logit route assignment models are calibrated for each type of vehicles constituting the traffic stream. In the effort to develop such models, data is compiled to estimate Annual Average Daily Traffic (AADT) by type of vehicle on these roads as well as to establish appropriate traffic growth rates. A horizon year is selected, where generalised cost functions are updated using a growth factor of 5%p.a. Traffic patterns are also increased by a traffic growth rate of 7%p.a. The logit ,models are used to obtain the expected demand using each road in light of changes in toll rates. Four graphs showing the demand pattern as a function of toll rate 1 Currently on Sabbatical Leave to Department of Urban and Regional Planning - College of Architecture and Planning - King Faisal University – P.O. Box 2397 Dammam 31451- Saudi Arabia
Transcript
Association for European Transport 2003
ROAD USER CHARGING FOR ROADS IN EGYPT: A CASE STUDY OF CAIRO-ALEXANDRIA TOLL ROAD
Dr. Khaled A. Abbas1
Professor Egypt National Institute of Transport
P.O. Box 34 Abbassia – Nasr Road – Nasr City Cairo – Egypt
email: [email protected] 1. INTRODUCTION Charging road users has several purposes, the first is to provide a mechanism by which users pay for the costs they impose on the road as well as for the benefits they enjoy from using the road. In addition, road user charging represents a source of revenue for highway agencies. This research starts by reviewing the current situation of toll roads in Egypt. The core of the research is to develop a simulation model that can be used to compute toll rates that are equivalent to the benefits enjoyed by road users. A case study of the first and most vital toll road in Egypt, namely Cairo Alexandria desert road, is considered. In this context, a review of traffic patterns on the road is presented. Several methodological steps are then followed as part of the framework for simulating the effects induced by changes in toll rates on travel demand as well as on toll revenues. First, vehicle operation costs, time passenger costs, as well as vehicle running time costs are reviewed from previous studies and updated. This is culminated into the formulation of generalized cost functions for four types of vehicles on both alternative roads along the Cairo-Alexandria corridor, namely the Cairo-Alexandria desert tolled road as well as the Cairo Alexandria agriculture road. The expected difference in the generalized costs is considered as a benefit for road users using the Cairo-Alexandria desert road. These are compared with current charged tolls and the discrepancy of charging very low toll rates is identified. The discrepancy represents the forgone income by the road agency.
In order to simulate the effect of toll rate changes on traffic demand as well as on generated toll revenue, four binary logit route assignment models are calibrated for each type of vehicles constituting the traffic stream. In the effort to develop such models, data is compiled to estimate Annual Average Daily Traffic (AADT) by type of vehicle on these roads as well as to establish appropriate traffic growth rates.
A horizon year is selected, where generalised cost functions are updated using a growth factor of 5%p.a. Traffic patterns are also increased by a traffic growth rate of 7%p.a. The logit ,models are used to obtain the expected demand using each road in light of changes in toll rates. Four graphs showing the demand pattern as a function of toll rate
1 Currently on Sabbatical Leave to Department of Urban and Regional Planning - College of Architecture and Planning - King Faisal University – P.O. Box 2397 Dammam 31451- Saudi Arabia
Association for European Transport 2003
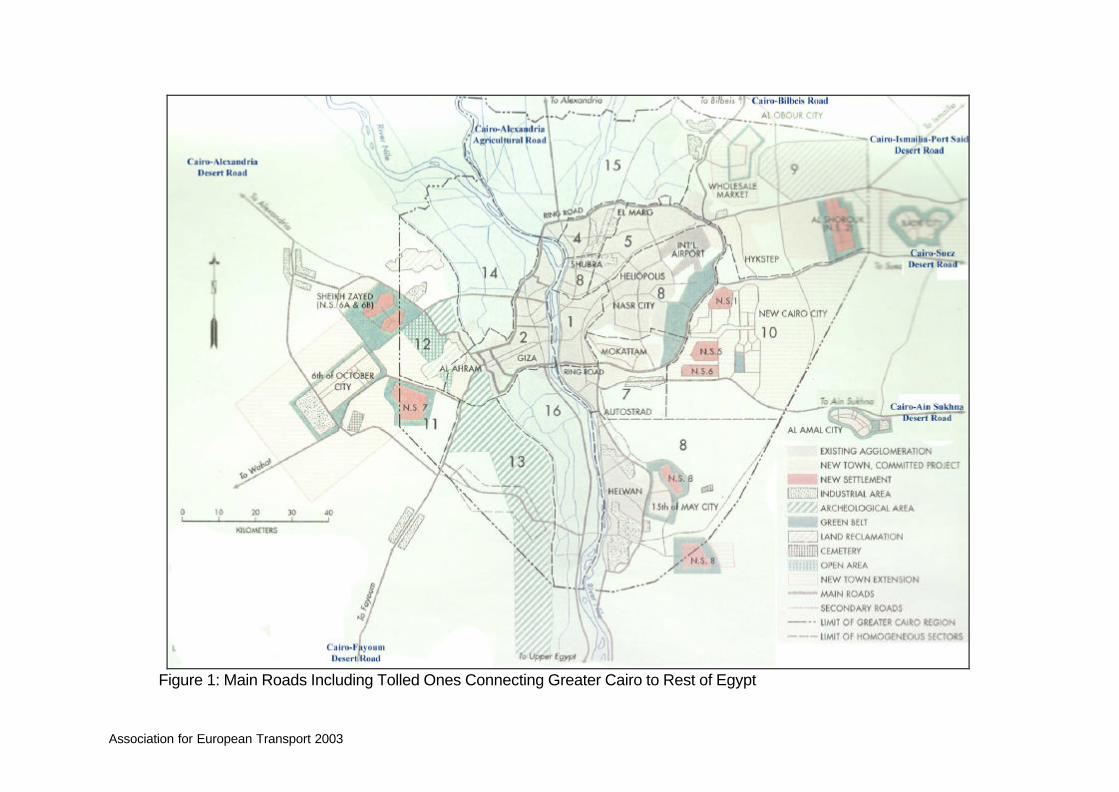
changes are produced for the four types of vehicles, on the two alternative roads. Finally four bell shaped curves describing the toll revenue changes with respect to toll rate changes are produced for each of the four types of vehicles. These curves can assist decision-makers to determine an optimum or a sub-optimum toll rate that generates maximum revenue from road users or that induces a certain demand split between the two roads serving the Cairo-Alexandria corridor. 2. TOLL ROADS IN EGYPT In 1984, a new law that enabled the Egyptian government to raise revenue from direct road charges was introduced. Consequently, several roads were converted to toll roads. There are currently five inter-urban roads, one tunnel and one bridge crossing that are tolled , as indicated in table 1 and figure 1. Table 1: Toll Roads in Egypt
Toll Roads Length of Tolled Sections*
Start of Toll Collection
Cairo – Alexandria Desert Road 160 km 1984 Cairo – Ismailia – Port Said Desert Road 90 km 1984 Cairo - Ain Sukhna Desert Road 90 km 1984 Cairo - El Fayoum Desert Road 80 km July 1992 Haikstep – Belbis Desert Road 26 km 1986 Ahmed Hamdy Martyr Tunnel Crossing Suez Canal**
1987
Mubarak Peace Bridge Crossing Suez Canal October 2001 Source: GARBLT (2001a) (*) Distance is measured between toll gates (**) Suez Canal Authority, on behalf of GARBLT, is currently responsible for toll collection, operation & maintenance of the tunnel. The main principle used for tolling roads is that these roads are significantly improved and have alternative un-tolled routes available. Tolls are collected and held in a special account administered by the General Authority for Roads and Bridges and Land Transport (GARBLT) within the toll roads section of the Authority. Current policy on the disbursement of revenues from tolls is that they must be allocated to maintenance or improvement of the toll roads. Improvements can, for example, take the form of capacity increases or the introduction of safety measures. Since the introduction of tolls in 1984, basic toll fees have been fixed by government with changes taking place in other aspects such as the introduction of sales taxes and road improvement fees that both differ in accordance with vehicle type, see table 2. The most recent component that was also added to the basic toll fees is an accident insurance fees, see table 2. The table shows the current toll rates considered which differ according to vehicle type. These toll rates currently apply to all roads except for Haikstep – Belbis, where half these toll rates are levied. Until recently vehicles entering Cairo-Alexandria desert road from any mid point along the road were levied half of these toll rates. Now all vehicles travelling along Cairo-Alexandria desert road are levied full toll rates.
Association for European Transport 2003
Figure 1: Main Roads Including Tolled Ones Connecting Greater Cairo to Rest of Egypt
Association for European Transport 2003
Table 2: Toll Fees Charged on Egyptian Toll Roads (Source: GARBLT, 2001a) Types of Vehicles
(*) Source Ministerial Decree number 160 for 1984, see ARE (1996) (**) 1 U.S. $ = 6.13 Egyptian Pounds (L.E.) (***) Sales taxes go to government treasury & are not used for road maintenance or improvement. Revenues generated by current tolls are very low. However, the end of the year 2000 witnessed a dramatic increase in toll rates, which generated an overall increase in toll revenue of 128% in 2001 compared with 1998. A comparison of toll receipts for 1998 versus 2001 for the five main toll roads in Egypt is shown in Table 3. Table 3: Comparison of Toll Receipts for 2001 Versus 1998 Source: GARBLT, 2001a
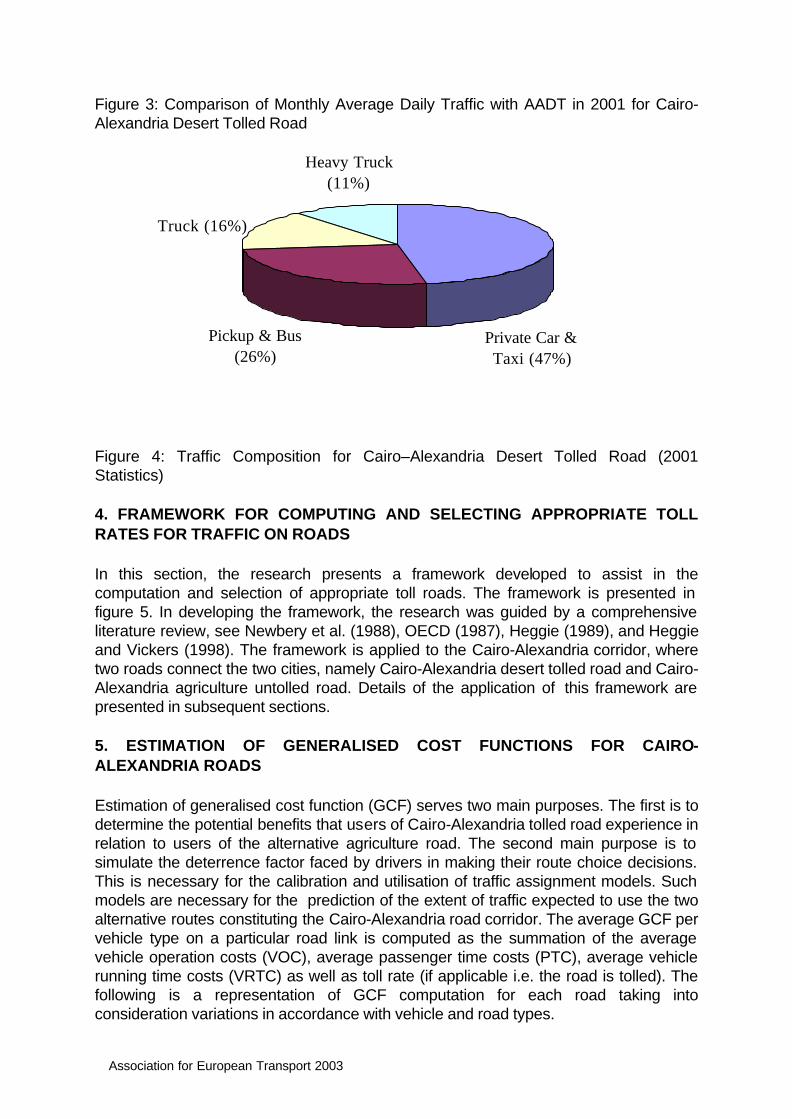
As can be seen from the table, the Cairo-Alexandria desert road produced a significant increase in toll revenue, which can be, attributed both to an increase in toll rates as well as to an increase in traffic volumes using the road. In the next section, a detailed analysis of traffic volumes on the Cairo-Alexandria desert road is presented. Following this the core of the paper is mainly concerned with developing and applying a methodology for conducting sensitivity analysis of demand and toll revenue with respect to suggested changes in toll rates by vehicle type. Such analysis is meant to assist in the selection of appropriate toll rates for the Cairo-Alexandria desert road. 3. TRAFFIC PATTERN ON CAIRO-ALEXANDRIA DESERT TOLL ROAD Historical data was collected from the toll department at GARBLT concerning the monthly number of vehicles using the Cairo-Alexandria toll road. Such data was compiled as AADT by vehicle type and displayed in figure 2 as time series patterns spanning over 11 years from 1991 to 2001. The figure shows varying traffic growth patterns by vehicle type, where the average annual growth rates for private cars and taxis is around 4.61% p.a., for buses and pickups is around 6.67% p.a., for trucks around 4.18% p.a., for heavy trucks around 11.82% p.a. An average overall growth rate is in the range of 5.7% p.a. Taking a microscopic look at monthly traffic patterns in 2001, see figure 3, one can notice the significant increase in monthly average daily traffic (MADT) during the three months of the summer, namely June, July and August with traffic reaching its peak level during August. Such monthly variation should be taken into account when determining appropriate toll rates. However the scope of this research does not include such monthly seasonal variation. This research is mainly involved with the determination of appropriate toll rates in accordance with different vehicle types travelling on a selected corridor. In this context, figure 4 shows the percentage share of the four main groups of vehicles that are charged different toll rates. The figure shows the dominance of private cars and taxis with a share of 47%, followed by pickups and buses (26%), followed by normal trucks (16%) and finally heavy trucks including trailers and trucks and trailers contributing to around 11%.
Association for European Transport 2003
Figure 2: Traffic Patterns by Vehicle Type on Cairo-Alexandria Desert Tolled Road
Figure 3: Comparison of Monthly Average Daily Traffic with AADT in 2001 for Cairo-Alexandria Desert Tolled Road Figure 4: Traffic Composition for Cairo–Alexandria Desert Tolled Road (2001 Statistics) 4. FRAMEWORK FOR COMPUTING AND SELECTING APPROPRIATE TOLL RATES FOR TRAFFIC ON ROADS In this section, the research presents a framework developed to assist in the computation and selection of appropriate toll roads. The framework is presented in figure 5. In developing the framework, the research was guided by a comprehensive literature review, see Newbery et al. (1988), OECD (1987), Heggie (1989), and Heggie and Vickers (1998). The framework is applied to the Cairo-Alexandria corridor, where two roads connect the two cities, namely Cairo-Alexandria desert tolled road and Cairo-Alexandria agriculture untolled road. Details of the application of this framework are presented in subsequent sections. 5. ESTIMATION OF GENERALISED COST FUNCTIONS FOR CAIRO-ALEXANDRIA ROADS Estimation of generalised cost function (GCF) serves two main purposes. The first is to determine the potential benefits that users of Cairo-Alexandria tolled road experience in relation to users of the alternative agriculture road. The second main purpose is to simulate the deterrence factor faced by drivers in making their route choice decisions. This is necessary for the calibration and utilisation of traffic assignment models. Such models are necessary for the prediction of the extent of traffic expected to use the two alternative routes constituting the Cairo-Alexandria road corridor. The average GCF per vehicle type on a particular road link is computed as the summation of the average vehicle operation costs (VOC), average passenger time costs (PTC), average vehicle running time costs (VRTC) as well as toll rate (if applicable i.e. the road is tolled). The following is a representation of GCF computation for each road taking into consideration variations in accordance with vehicle and road types.
Review Vehicle Operation Costs Consumption by Vehicle Type
Review Value of Running Timeby Vehicle Type
Review Value of Passenger Timeby Vehicle Type
Collect & CompileHistorical Data
ConcerningTraffic Volumes
on Alternative Routes
Define Study Area: This Includes Cairo-Alexandria Desert Tolled Roadand its Alternative Cairo-Alexandria Agriculture Un-tolled Road
EstablishAppropriate
Traffic GrowthRates
Identify RoadCross-Sections for Alternative Routes
Determine K Factor& Compute
Vehicles/Hour/Lanefor Alternative Routes
Determine Average Speedin Relation toTraffic Flows
Determine AverageJourney Time
DetermineHorizon Yearfor the Study
Estimate Generalised CostFunctions for Alternative Routes
by Vehicle Type
Identify Monetary Benefits ofUsing Tolled Road in Relation to
Alternative Route by Vehicle Type
Collect & CompileHistorical Data
ConcerningGDP/Capita,Inflation, CPI
Develop Route Choice Models Based on Binary Logit FormulationBetween the Two Alternative Routes by Vehicle Type
Conduct Traffic Forecasts and Traffic Assignmentin Accordance with Suggested Changes in Toll Rates
(Plot Sensitivity Curve of Demandw.r.t. Suggested Toll Changes)
Suggest Changes in Toll Rate byVehicle Type
Update Generalised CostFunction for Alternative Routes
Compute Toll Revenue in Accordance withSuggested Changes in Toll Rates
(Plot Sensitivity Bell Shaped Curve of Toll Revenue w.r.t. Suggested Toll Changes)
Establish Appropriate Toll Rates by Vehicle Type
DetermineBase Year
for the Study
Association for European Transport 2003
Figure 5: Framework Developed for Estimation & Selection of AppropriateToll Rates for Road Traffic 6. ESTIMATION OF VEHICLE OPERATION COSTS Components of VOC can be categorised into two main categories, namely fixed and running costs. Fixed costs are time dependent. On the other hand, running costs depend on: rates of consumption such as fuel consumption, or rates of wear and tear such as tyre wear and tear, or rates of utilisation such as battery utilisation. All these rates are kilometer based. Values of such rates vary in accordance with travel conditions on the different road classes. In particular these values are speed dependent. Several studies exist that show the variation of such rates with varying speed, see Archondo and Faiz (1994) for experience in developing countries. It is always recommended to conduct local studies to capture such variations, however this is not usually possible due to time and other resource constraints. In case previous studies exist that estimated average VOC by type of vehicle, these values should be revised and updated to account for current and future conditions. This research reviews and updates, see table 4, the two previous studies that computed economic values for vehicle operating costs consumption rates in Egypt, see JICA, 1993 and JICA, 1996. Updating of values shown in table 4 is based on an annual growth rate of 5%. This is obtained based on averaging GDP/Capita as well as inflation rates from 1996 to 2001, see IMF (2000). Table 4: Consumption Rates of VOC by Vehicle Type in L.E./Km Type of Vehicle Private Car Bus Truck Heavy Truck 1996 JICA Study 0.36 1.16 1.39 1.66 2001 Updated 0.46 1.48 1.77 2.12
Based on the above rates VOC is computed for the two alternative routes as shown in table 5. Table 5: VOC by Vehicle Type for Alternative Roads in 2001 (L.E.)
Vehicle Type Alternative Road
Distance* Private Car
Bus Truck Heavy Truck
Cairo-Alexandria Desert tolled Road
160 km 74 237 283 339
Cairo-Alexandria Agriculture Untolled Road
193 km 89 286 342 409
(*) In Case of Cairo-Alexandria tolled road, distance is measured as the number of kilometers between the two toll gates In case of Cairo-Alexandria agriculture road distance is obtained from ARE (1996) In this context, it has to be noted that one of the main variable components of vehicle operating costs is fuel consumption. Fuel consumption is a function of average running speed. Each vehicle type has a different average unit fuel vehicle operating cost which can be computed using fuel consumption formulas such as the one developed in the British Cost Benefit Appraisal Manual, see COBA 11 (2003). However in this research such variation was not taken into account. 7. ESTIMATION OF PASSENGER & VEHICLE RUNNING TIME COSTS
Association for European Transport 2003
Passenger time and vehicle running costs are important components of travel cost. The derivation of representative values of time for each vehicle type is a vital step in formulating PTC and VRT. Values of passenger time (VOPT) depend on the average vehicle occupancy as well as on the trip purpose of passengers and how they value their journey time. On the other hand, values of running time (VORT) depend on the fixed costs incurred while a vehicle is not in operation. This research reviews and updates, see table 6, the two previous studies that computed economic VOPT and VORT by vehicle type in Egypt, see JICA, 1993 and JICA, 1996. As previously stated, updating of values shown in table 4 is based on an annual growth of 5%. Table 6: VOPT and VORT by Vehicle Type in L.E./Hour
Type of Vehicle Private Car Bus Truck Heavy Truck 1996 JICA Study VOPT 16.4 26.1 No
Passenger time costs as well as vehicle running time costs are transferred to monetary values by multiplying these time values by average journey times. Journey times can be obtained by dividing journey distances by average journey speeds. Average journey speeds are obtained from speed/flow relationship. A major component of describing a road is to establish an appropriate speed/flow relationship representing the traffic conditions on this road. If local studies exist that classified the national road network into different classifications as well as developed local speed/flow relationships for each road classification, these should be carefully examined and possibly adopted. However, in most developing countries, such studies either do not exist or are currently being undertaken. In such circumstances. speed/flow curves of the American Highway Capacity Manual (HCM), 2000 or those of COBA, see COBA (2003) can be adapted to suit local conditions. For each road classification and sub-classification, these manuals, through long research experience, provide representative speed/flow curves. In this research, the COBA 9 speed/flow curves were utilized, where traffic volumes in terms of vehicles/hour/lane were computed based on the road cross sections as well as on a selected K factor. The two roads were classified as all purpose dual carriageways. In table 7, steps involved in estimation of appropriate average travelling speed for the two roads are displayed. Table 7: Average Travelling Speeds for Alternative Roads in 2001
Vehicle Type Alternative Road
AADT (Both
Directions)
K Factor*
No. of Lanes Design Hourly
Volume
Average Speed
(km./hr.) Cairo-Alexandria Desert tolled Road
29587 12% Mostly Upgraded to 3 lanes per direction
592 95
Cairo-Alexandria Agriculture Untolled Road
43332 12% Mostly 2 lanes per direction
1300 85
Association for European Transport 2003
(*) According to ITE (1991), the average value of K for the 30th highest hourly volume for main rural highways varies in the range from 12% to 18%. Furthermore, posted speeds were adjusted accordingly to reflect speed variations by vehicle type, see table 8. Table 8: Average Speeds by Vehicle Type for Alternative Roads in 2001
(*) Posted speeds are obtained from ARE (2000) Based on the above average speeds and road distances, average journey times, and hence PTC and VRTC are computed by vehicle type for the two alternative routes as shown in table 9. Table 9: Average Journey Times, PTC & VRTC by Vehicle Type for Alternative Roads in 2001
8. ROAD USER BENEFITS GENERATED FROM USING CAIRO-ALEXANDRIA DESERT TOLLED ROAD Benefits generated to road users of Cairo-Alexandria desert road versus Cairo-Alexandria agriculture road include reductions in journey times inducing time savings benefits, as well as reductions in vehicle operating costs. Based on the above analysis, the research estimates generalised cost functions by vehicle type for each of the two roads and determines the extent of benefits enjoyed by users of Cairo-Alexandria desert road. These are displayed in table 10.
Association for European Transport 2003
Table 10: Estimation of Generalised Cost Functions & Benefits Experienced by Users of Cairo-Alexandria Tolled Rd. versus Cairo-Alexandria Untolled Rd.
If the government wants to recover such economic benefits from road users, it should increase toll rates. Toll rates in 2001 barely cover such benefits. In table 11, the percentages of benefits covered by 2001 toll rates are computed for each vehicle type. The table shows that such coverage does not exceed 7% in any case and that road users are being subsidised. In this context, and according to GARBLT officials, it has to be noted that the debts of toll roads in Egypt have amounted to 70 million L.E. in 2002. Table 11: Percentage Coverage of Benefits Induced by Using Cairo Alexandria Desert Road Through Toll Rates
(*) This is an average toll rate for heavy trucks and trucks and trailers. According to GARBLT toll road department, both vehicle types have equal percentages in the traffic stream. The above analysis will be used in the next sections of the paper in an effort to conduct sensitivity analysis of the effects of increasing toll rates on the traffic demand and hence on the toll generated revenue. Such analysis is meant to act as a main input in assisting decision makers to determine potential toll rates covering such induced user benefits as well as generating extra revenues. In order to proceed with such analysis traffic growth patterns as well as traffic assignment models should be developed. These should be capable of predicting expected traffic demand on the road in light of the proposed changes in toll rates by vehicle type. 9. TRAFFIC GROWTH PATTERNS The Egyptian intercity road network is currently covered by 15 permanent traffic counting stations as well as more than 40 temporarily supplementary counting stations. Two permanent counting stations are located on the Cairo-Alexandria desert road, while four are located on the Cairo-Alexandria agriculture road. In order to make sure that those counts capture Cairo-Alexandria travellers, count 12 and 15 were selected. Permanent station 12 is located towards the end of the Cairo-Alexandria desert road, while
Association for European Transport 2003
permanent station 15 is located towards the end of the Cairo-Alexandria agriculture road. Examining the pattern on these stations over the period from 1991 to 2001, average annual growth rates of 5.7% and 6.4% are observed respectively. The national average growth of traffic recorded over the last 10 years established from the permanent count data indicate that traffic has increased by 2.1% per annum. However, over the last 2 years, traffic has grown at 8.1% per annum. In this context, a review of previous studies is also of vital importance, see JICA (1993). The JICA (1993) developed a 1992 all vehicle matrix for Egypt. This was used as a basis for future forecasts to the years 1997, 2002 and 2012. When analysing the total traffic volumes, generated/attracted throughout Egypt and comparing different years, one can obtain the traffic growth rates, across the whole Egyptian road network that was used in this study. This analysis is shown in table 12. Table 12: Traffic Growth Rates Over the Egyptian Road Network in Accordance with JICA, 1993 Predictions JICA 1992 1997 2002 2012 Growth Growth Growth Growth Matrices 92-97 97-
The above table demonstrates that the traffic growth rate adopted by JICA between 1992 and 2002 is around 7.1% p.a. Another recent study conducted by JICA estimated a traffic growth rate for all vehicles in Egypt over the period 1995-2017 at 4% p.a., see JICA, 1996. Taking into account all of the above analysis and reviews, a traffic growth rate of 7% p.a. was adopted in this research. 10. DEVELOPING ROUTE CHOICE TRAFFIC MODELS
Several methods can be utilized in forecasting the expected split of demand between the two alternative Cairo-Alexandria roads. In this research four route choice models were calibrated, each for a vehicle type. Formulations of the four models is based on the binary logit route choice equation, see Ortuzar and Willumsen (1995). This takes the following form:
PC-A-D-R = EXP(-β*GCFC-A-D-R) / [ EXP(-β*GCFC-A-D-R) + EXP(-β*GCFC-A-A-R) ] PC-A-D-R = Probability of Choosing Cairo-Alexandria Desert Road PC-A-A-R = Probability of Choosing Cairo-Alexandria Agriculture Road GCFC-A-D-R = Generalised Cost Function of a Vehicle Using Cairo-Alexandria Desert Road GCFC-A-A-R = Generalised Cost Function of a Vehicle Using Cairo-Alexandria Agriculture Road Calibration of the four models were based on 2001 traffic demand as well as on estimations of GCF for the two alternative roads. The derived calibration factors β for each model are displayed in table 13.
Association for European Transport 2003
Table 13: Calibration Factor β for the Four Binary Logit Mode Choice Models
Vehicle Types Car & Taxi Pickup & Bus Normal Truck Heavy Truck β 0.012
0.0045
0.0044
0.0039
11. SENSITIVITY ANALYSIS OF DEMAND AND TOLL REVENUE WITH RESPECT TO CHANGES IN TOLL RATES The derivation of an appropriate and acceptable representative toll rates is a vital step that serves the following purposes: • Toll rates are used in the financial analysis to arrive at the expected toll revenue that
would be generated if the road was concessioned to the private sector. • Toll rates are also used in the economic analysis to represent a component of
monetary benefits for the society • Toll rates constitute one of the main components used in formulating the GCF. GCF
is used to represent the deterrence factors faced by drivers in making their route choice decisions. The GCF is a necessary component of the assignment model used to simulate drivers’ behavior.
In this section, the sensitivity of travel behaviour and toll revenue as a result of changes in basic toll rate is simulated for the Cairo-Alexandria corridor for the horizon year 2004. In this context, various toll rates are selected. These act as an input to the GCF, which is updated from the year 2001 to 2004 to account for price inflation. The expected travel demand in 2004 along the corridor is increased using a growth rate of 7% p.a. GCF for the two parallel roads are fed into the calibrated route choice models. These models generate the proportional split for each of the two parallel routes in accordance with their relative GCF. These proportions are then multiplied by the expected corridor demand, hence generating the demand split along the two Cairo-Alexandria alternative routes. Toll revenues are computed as the multiplication of expected traffic flows on the Cairo-Alexandria desert road for each type of vehicle by the respective toll rate. Such computations can be mathematically represented as follows: GCFVD
2004 = GCFVD2001 (1+Inflation)n
GCFVA
2004 = GCFVA2001 (1+Inflation)n
TijV
2004 = TijV2001 (1+TG)n
Ti jVD2004 =
TijV2004 {EXP(-βV*GCFVD
2004) / [ EXP(-βV*GCFVD2004) + EXP(-βV*GCFVA
2004) ]} Toll-RevVD
2004 = Ti jVD2004 * (1-RF) * TollVD
2004
Where: i = Cairo, j = Alexandria, V = Vehicle Type (1, …4), D = Cairo-Alex Desert Road, A = Cairo-Alex Agriculture Road, Inflation = 5%p.a. TG = Traffic growth rate 7%p.a., T = Travel Demand, Toll-Rev = Toll Revenue, RF = Reduction Factor taken as 0.2
Association for European Transport 2003
In this context, it has to be noted that predicted demand on the Cairo-Alexandria desert road is reduced by 20%, allowing for vehicles that are exempted from paying tolls on the road such as army, police, ambulance and some government vehicles, see GARBLT, 2001a). Several sensitivity tests were simulated for each vehicle type. Results of these tests are presented in figures 6 through 13, where for each vehicle type two figures are plotted. The first represents the effect of changes of toll rates on the expected travel demand split along the Cairo-Alexandria corridor i.e. the amount of traffic expected to use the Cairo-Alexandria desert road versus the Cairo-Alexandria agriculture road in light of the suggested charged toll rate. The second curve represents the bell shaped curve describing the expected increase in toll revenue versus the increase in toll rate. Such curve is characterised by a point where any further increase in toll rate induces a significant reduction in traffic demand and hence a reduction in toll revenue. Examining the figures, one can deduce the following conclusions: • There is a very huge potential to increase toll rates on the Cairo-Alexandria desert
road. • At toll rates that cover the induced travallers benefits of using the tolled road a 50/50
split of demand is shown. Decision makers might be willing to select such toll rates. • However, this is still not the optimum toll rate in terms of revenue maximization.
Rates maximising toll revenue are almost in the range of 125 L.E. i.e. 0.78 L.E./km. for private cars & taxis, 340 L.E. i.e. 2.1 L.E./km for pick up and bus, and normal trucks, 370 L.E. i.e. 2.3 L.E./km for heavy trucks. In an Egyptian context, these can be considered as very high toll rates. However, if compared internationally, these would prove very near to tolls charged in other countries, see Munro and Musset (1994).
• Decision makers might opt for toll rates that produces a certain travel demand split or that generates a certain amount of toll revenue. In this respect, the generated curves are extremely helpful.
Association for European Transport 2003
Figure 6: Expected Demand Split Along Cairo-Alexandria Corridor Versus Varying Toll Rates/Car & Taxi in 2004 Figure 7: Expected Toll Revenue Versus Varying Toll Rates/Car & Taxi in 2004
12. CONCLUSIONS In Egypt, several rural roads are operating with toll charging. However, the charged toll rates are determined based on political consensus rather than on a benefit analysis. Over the years, toll revenues were foregone due to such low toll rates. Such toll rates ought to increase if the toll roads are to sustain their operation without any government subsidy. This paper was mainly concerned with developing and applying a methodology for conducting sensitivity analysis of demand and toll revenue with respect to suggested changes in toll rates by vehicle type. Such analysis is meant to assist in the selection of appropriate toll rates for the Cairo-Alexandria desert road. In this context several conclusions were deduced. • There is a very huge potential to increase toll rates on the Cairo-Alexandria desert
road. • At toll rates that cover the induced travellers benefits of using the tolled road a 50/50
split of demand is shown between Cairo Alexandria desert tolled road and Cairo-Alexandria agriculture road.
• However, this is still not the optimum toll rate in terms of revenue maximization. Rates maximising toll revenue are almost in the range of 125 L.E. i.e. 0.78 L.E./km. for private cars & taxis, 340 L.E. i.e. 2.1 L.E./km for pick up and bus, and normal trucks, 370 L.E. i.e. 2.3 L.E./km for heavy trucks. In an Egyptian context, these can be considered as very high toll rates.
• Decision-makers might opt for toll rates that produces a certain travel demand split or that generates a certain amount of toll revenue.
REFERENCES Arab Republic of Egypt (ARE) (2000) Traffic Law No 66 issued in 1973 and Modified by Law no. 155 issued in 1999 and Its implementation Regulation no. 2777 issued in 2000. Printed by Egypt Police Press. Arab Republic of Egypt (ARE) (1996) Public Roads and Advertisements. Fifth Edition. General Authority for Amiria Press. Archondo-Callao R. S. and Faiz A. (1994) Estimating Vehicle Operating Costs. World Bank Technical Paper Number 234. World Bank, Washington DC. Cost Benefit Analysis (COBA11 Manual) (2003) Department of Transport, UK. General Authority for Roads Bridges and Land Transport (GARBLT) (2001a) Toll Road Statistics. Toll Department – GARBLT . Ministry of Transport, Egypt General Authority for Roads Bridges and Land Transport (GARBLT) (2001b) Annual Report. Ministry of Transport, Egypt
Association for European Transport 2003
Heggie I. G. (1989) Brief Notes on Charging for Road Use in Developing countries. World Bank Conference Paper. World Bank, Washington DC. Heggie I. G. and Vickers P. (1998) Commercial Management and financing of roads. World Bank Technical Paper No. 409. World Bank, Washington DC. Highway Capacity Manual (HCM) (2000) United States Department of Transportation. USA Institute of Transportation Engineers (ITE) (1991) Traffic Engineering Handbook Fourth Edition. Prentice Hall, USA. International Monetary Fund (IMF) (2000) The World Economic Outlook (WEO) Database. World Economic Studies Division, Research Department, International Monetary Fund. Japan International Cooperation Agency (JICA) (1993) The Study of the Transportation System and the National Road Transportation Master Plan. Transport Planning Authority, Ministry of Transport, Arab Republic of Egypt. Japan International Cooperation Agency (JICA) (1996) The Feasibility Study on a Bridge over Northern Part of the Suez Canal. Ministry of Transport, Arab Republic of Egypt. Munro-Lafon J. P. and Musset J. W. (1994) European Inter-Urban Toll Roads. In Financing Transport Infrastructure. Edited by Sheilla Farrell. PTRC Education and Research Services Ltd, UK, pp. 57-63. Newbery D. M. , Hughes G. A., Paterson W. D. O., and Bennathan E. (1988) Road transport taxation in developing countries: The design of user charges and taxes for Tunisia. World Bank discussion paper no. 26. World Bank, Washington DC. Organisation for Economic Cooperation and Development (OECD) (1987) Toll Financing and Private Sector Involvement in Road Infrastructure Development. A Report Prepared by an OECD Expert Group Ortuzar, J. D., and L. G. Willumsen (1995) Modeling transport. Second Edition John Wiley & Sons.