THE 2015 SUMMIT IN THE INLAND EMPIRE: Restoring upward mobility in every region Even as the economy recovers, many California communities—urban and rural, coastal and inland—face persistent gaps in employment, education, and opportunity. For too many Californians, these troublesome signs of inequality show no sign of shrinking. Poverty rates have doubled in the last two decades in regions like the Inland Empire, where fewer than one in five residents have a college degree. Even fast-growing cities are struggling to find the workers they need: California is projected to face a gap of 2 million skilled workers in the next decade. California cannot thrive unless it finds ways to radically improve upward mobility—in the regions still emerging from the recession and in the stubborn pockets of poverty next to the state’s wealthiest neighborhoods. At the California Economic Summit on November 12-13 in Ontario, state and regional leaders will assess progress and sharpen strategies for targeting resources where they are needed most to build the skills and the infrastructure Californians and their communities need to prosper. A ROADMAP TO SHARED PROSPERITY: The right next steps toward sustainable growth California has always been the frontier of the possible— for immigrants and entrepreneurs, for infrastructure and environmental protections, for sustainable communities and global markets. The California Dream has been the American Dream, with more rungs on the economic ladder. For all its progress, California will need to work even smarter in the decades ahead to achieve its promise. Faced with a growing income gap, the next generation of Californians—the most diverse in its history—must be ready to contribute to an ever-changing global economy. To prepare for—and slow—climate change, natural resources must be managed more responsibly. Bigger cities will need less traffic. Regional economies will need both clean air and global trade. This new prosperity will require more—and more effective—investments in education and infrastructure. It will demand a blend of entrepreneurial thinking, new technology, and innovative public decision-making. While California has historically led on these issues, the challenge now is that tackling any one of these problems requires taking them all on simultaneously. This is the aim of the California Economic Summit, a coalition of regional leaders advancing an agenda for shared prosperity. The Summit’s five-year prosperity plan is grounded in public and private sector commitments to the “triple bottom line”—simultaneous growth in the economy, improvement in environmental quality, and increased opportunity for all. The Roadmap focuses on three urgent and overarching priorities that—with action from leaders in 2015—can increase and broaden prosperity for all Californians. 2015-2020 PRIORITIES: WORKFORCE & WORKPLACE INFRASTRUCTURE & SUSTAINABLE COMMUNITIES GOVERNANCE & FINANCE
Transcript
THE 2015 SUMMIT IN THE INLAND EMPIRE: Restoring upward mobility in every region
Even as the economy recovers, many California communities—urban and rural, coastal and inland—face persistent gaps in employment, education, and opportunity. For too many Californians, these troublesome signs of inequality show no sign of shrinking.
Poverty rates have doubled in the last two decades in regions like the Inland Empire, where fewer than one in five residents have a college degree. Even fast-growing cities are struggling to find the workers they need: California is projected to face a gap of 2 million skilled workers in the next decade.
California cannot thrive unless it finds ways to radically improve upward mobility—in the regions still emerging from the recession and in the stubborn pockets of poverty next to the state’s wealthiest neighborhoods.
At the California Economic Summit on November 12-13 in Ontario, state and regional leaders will assess progress and sharpen strategies for targeting resources where they are needed most to build the skills and the infrastructure Californians and their communities need to prosper.
A ROADMAP TO SHARED PROSPERITY:The right next steps toward sustainable growth
California has always been the frontier of the possible—
for immigrants and entrepreneurs, for infrastructure and
environmental protections, for sustainable communities and
global markets. The California Dream has been the American
Dream, with more rungs on the economic ladder.
For all its progress, California will need to work even smarter in the decades ahead to achieve its promise. Faced with a growing income gap, the next generation of Californians—the most diverse in its history—must be ready to contribute to an ever-changing global economy. To prepare for—and slow—climate change, natural resources must be managed more responsibly. Bigger cities will need less traffic. Regional economies will need both clean air and global trade.
This new prosperity will require more—and more effective—investments in education and infrastructure. It will demand a blend of entrepreneurial thinking, new technology, and innovative public decision-making.
While California has historically led on these issues, the challenge now is that tackling any one of these problems requires taking them all on simultaneously.
This is the aim of the California Economic Summit, a coalition of regional leaders advancing an agenda for shared prosperity. The Summit’s five-year prosperity plan is grounded in public and private sector commitments to the “triple bottom line”—simultaneous growth in the economy, improvement in environmental quality, and increased opportunity for all.
The Roadmap focuses on three urgent and overarching priorities that—with action from leaders in 2015—can increase and broaden prosperity for all Californians.
Increased workforce training investments Enhanced infrastructure financing tools
Expanded manufacturing partnerships Targeted funding for affordable housing
Highlighted regulations in need of streamlining Improved preparation for next drought
Piloted new investment network for small businesses
A full accounting of the Summit action teams’ progress in 2014 can be found at: www.caeconomy.org/progress
3 SUMMIT PRIORITIES FOR 2015 AND BEYOND
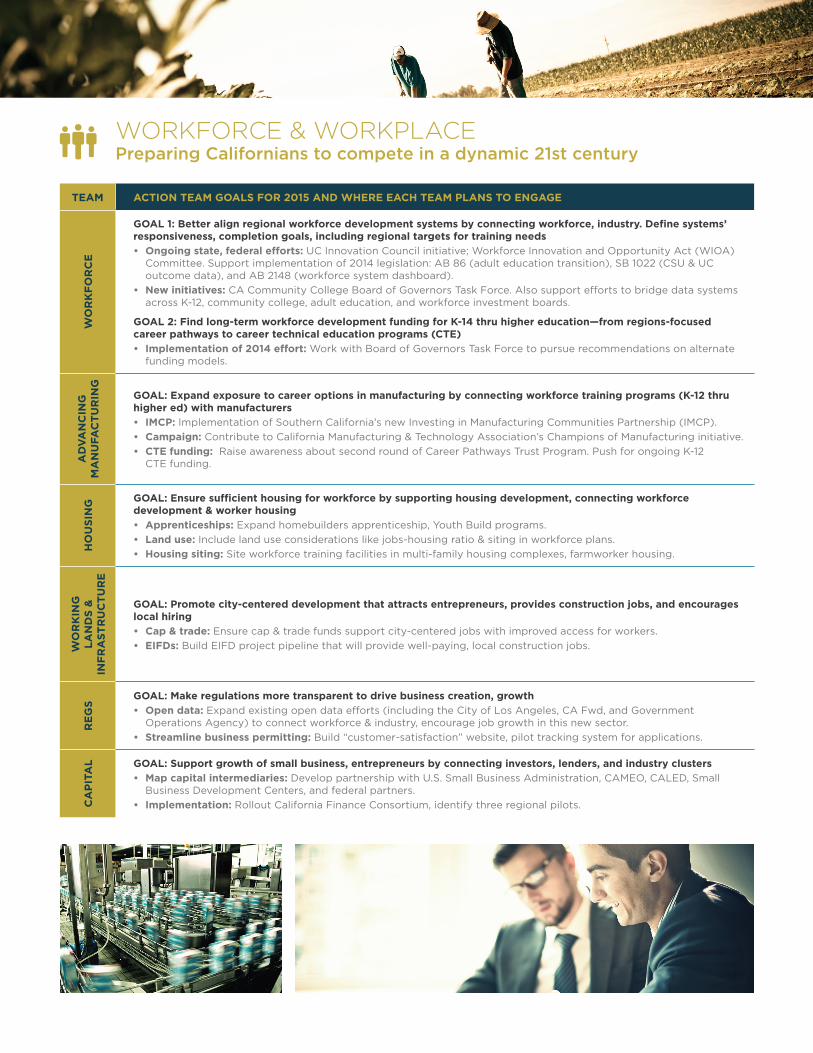
WORKFORCE & WORKPLACEPreparing Californians to compete in a dynamic 21st century
GOAL: The Summit aims to increase opportunity by providing California’s workforce—and its businesses and entrepreneurs—with the skills, knowledge, and abilities they need to grow well-paying jobs in changing markets.
THE RIGHT NEXT STEPS IN 2015
1. Align regional workforce training, industry, and community needs by improving responsiveness to students, increasing completion rates, and finding long-term funding for career pathways and career technical education programs.
2. Provide small businesses and entrepreneurs with the tools to grow jobs in changing markets.
INFRASTRUCTURE & SUSTAINABLE COMMUNITIESBuilding the communities California needs to thrive
GOAL: The Summit will focus state and regional resource and infrastructure investments on sustainable growth, especially in underserved communities.
THE RIGHT NEXT STEPS IN 2015
3. Expand infrastructure investment through local financing tools and public-private partnerships.
4. Promote sustainable communities including a sufficient housing supply through data-driven land use decisions and by ensuring state cap & trade funds and regional climate plans support adequate affordable housing, integrate urban and rural development, and include long-term goods movement strategies, even in rural regions without existing sustainable communities strategies.
5. Ensure $7.5 billion in water bond funds go to sustainable, multi-benefit, integrated water projects that address issues across watersheds.
6. Update regulatory processes such as CEQA, water transfers, and air permitting to advance the triple bottom line. Expand use of open data in land use planning.
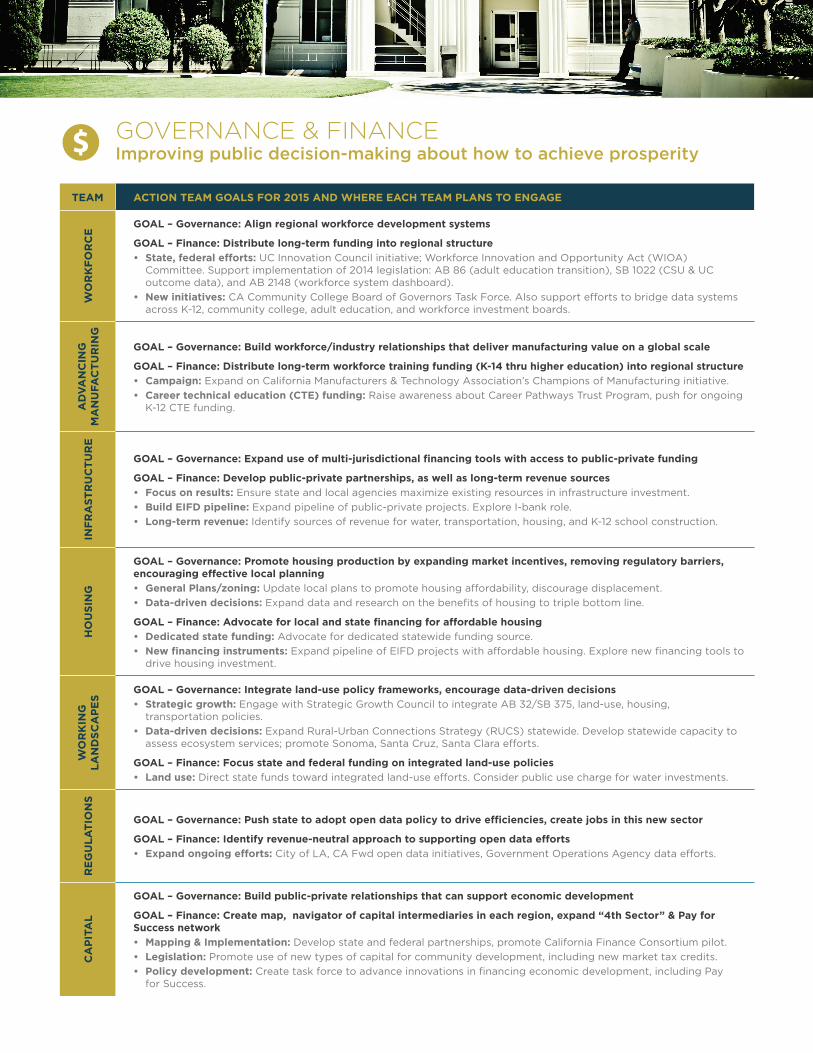
GOVERNANCE & FINANCEImproving public decision-making about how to achieve prosperity
GOAL: The Summit will drive more integrated, outcome-oriented decision-making that sustains public and private investments.
THE RIGHT NEXT STEPS IN 2015
7. Identify adequate revenues to make investments in the state’s long-term prosperity—from workforce development to infrastructure and sustainable communities.
8. Align regional workforce development systems with industry, including manufacturers.
9. Integrate state climate adaptation efforts in next update of the AB 32 Scoping Plan to ensure sustainable land use, infrastructure development, and drought preparedness.
10. Increase data-driven decision-making at all levels of government. Expand use of open data to drive efficiencies, innovation, and create jobs in new sector.
Having achieved all of the Summit’s 2014 goals, Summit leaders looked ahead to identify the priorities for advancing prosperity over the next five years. A shared prosperity agenda emerged that integrates the elements of sustainable and equitable development, identifies goals and the “right next steps,” and connects these actions to measurable statewide outcomes.
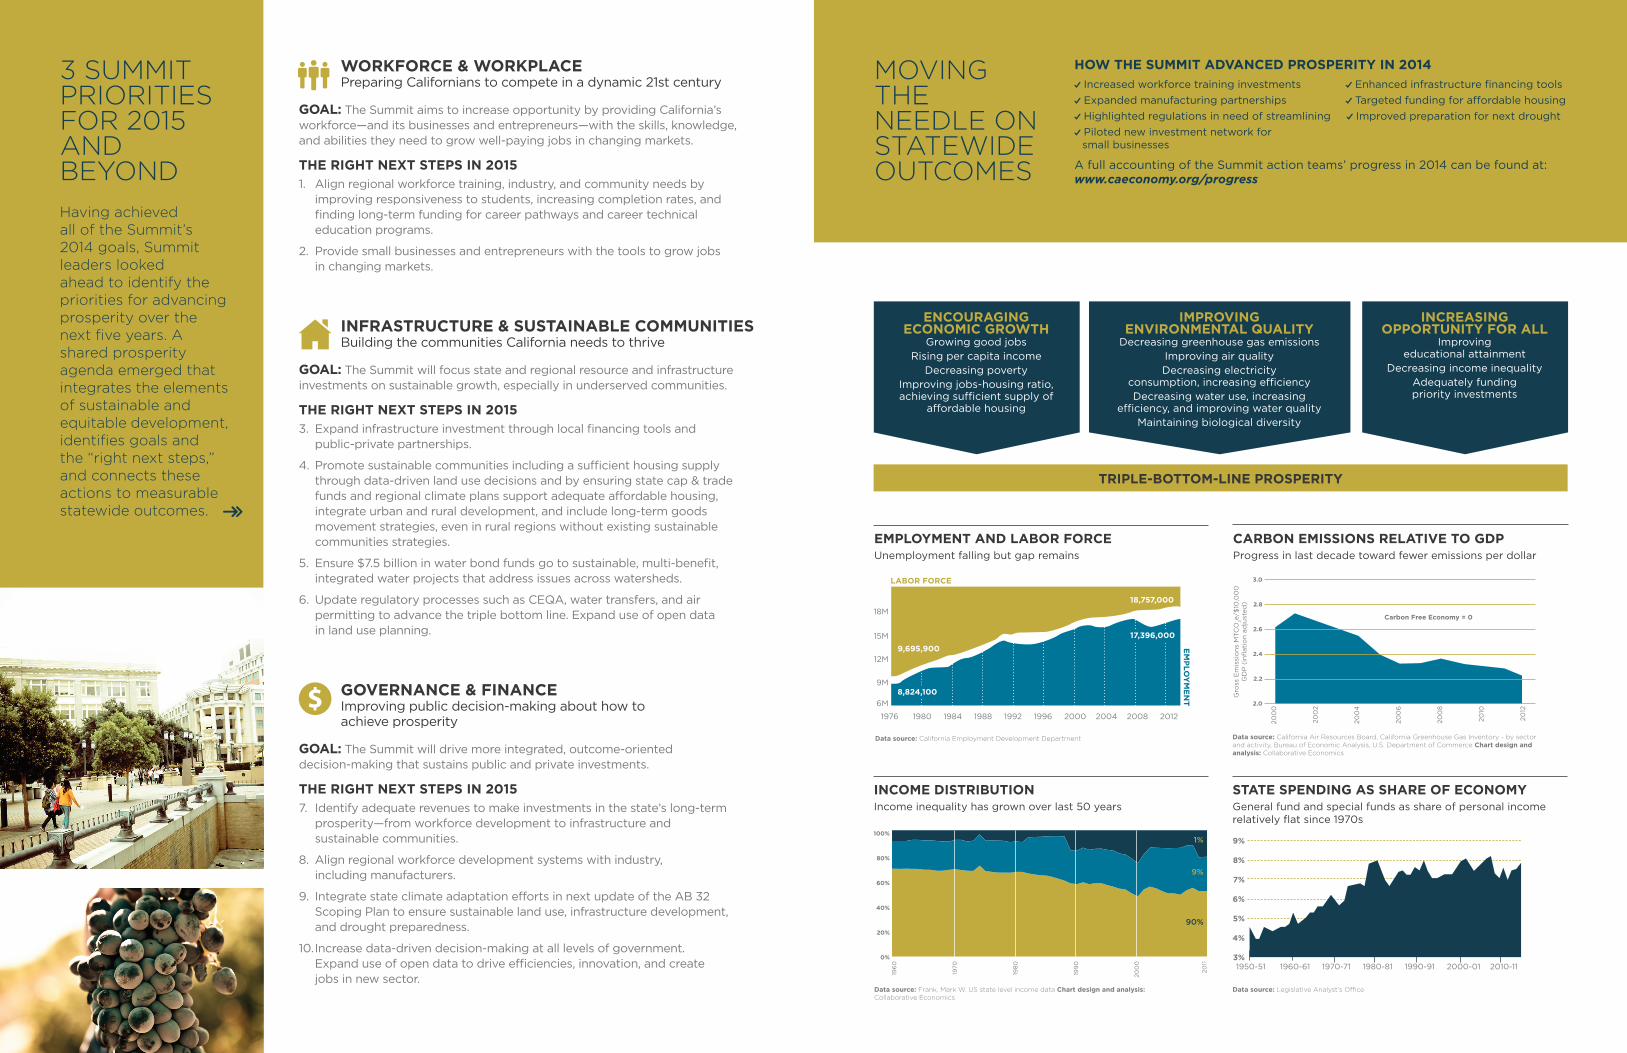
EMPLOYMENT AND LABOR FORCEUnemployment falling but gap remains
CARBON EMISSIONS RELATIVE TO GDPProgress in last decade toward fewer emissions per dollar
INCOME DISTRIBUTIONIncome inequality has grown over last 50 years
STATE SPENDING AS SHARE OF ECONOMYGeneral fund and special funds as share of personal income relatively flat since 1970s
196
0
1970
198
0
199
0
20
00
20
11
100%
80%
60%
40%
20%
0%
9%
8%
7%
6%
5%
4%
3%
Data source: Frank, Mark W. US state level income data Chart design and analysis: Collaborative Economics
Data source: California Air Resources Board, California Greenhouse Gas Inventory - by sector and activity, Bureau of Economic Analysis, U.S. Department of Commerce Chart design and analysis: Collaborative Economics
Data source: California Employment Development Department
Data source: Legislative Analyst’s Office
Carbon Free Economy = 0
Gro
ss E
mis
sio
ns
MTC
O2e/$
10,0
00
G
DP
(in
flati
on
ad
just
ed
)
20
00
20
02
20
04
20
06
20
08
20
10
20
12
3.0
2.8
2.6
2.4
2.2
2.0
TRIPLE-BOTTOM-LINE PROSPERITY
ENCOURAGING
ECONOMIC GROWTHGrowing good jobs
Rising per capita incomeDecreasing poverty
Improving jobs-housing ratio, achieving sufficient supply of
affordable housing
IMPROVING
ENVIRONMENTAL QUALITYDecreasing greenhouse gas emissions
Improving air qualityDecreasing electricity
consumption, increasing efficiencyDecreasing water use, increasing
efficiency, and improving water qualityMaintaining biological diversity
INCREASING
OPPORTUNITY FOR ALLImproving
educational attainmentDecreasing income inequality
Adequately funding priority investments
8,824,100
17,396,000
HONORARY CHAIRSGEORGE SHULTZHoover Institution, Stanford University
LEON PANETTAThe Panetta Institute for Public Policy
SUMMIT CO-CHAIRSGAVIN NEWSOMLieutenant Governor of California
MICHAEL ROSSISenior Advisor - Offi ce of the Governor
LAURA TYSONUniversity of California, Berkeley
ASHLEY BORENSustainable Conservation
JOSÉ CISNEROSLeague of California Cities
JIM EARPCalifornia Alliance for Jobs
JOHN GIOIACalifornia State Association of Counties
ANTONIA HERNANDEZCalifornia Community Foundation
JESSIE KNIGHTSempra Energy
SUNNE WRIGHT MCPEAKCalifornia Emerging Technology Fund
DAVE REGANSEIU-United Healthcare Workers West
MARIA SALINASProAmérica Bank
ASHLEY SWEARENGINMayor of Fresno
SUMMIT STEERING COMMITTEEBILL ALLENLos Angeles County Economic Development Corporation
LUCY DUNNOrange County Business Council
STEVE FRISCHSierra Business Council
PAUL GRANILLO,Co-ChairInland Empire Economic Partnership
CARL GUARDINOSilicon Valley Leadership Group
GLENDA HUMISTONUSDA Rural Development
JOANNE KOZBERGCalifornia Strategies
LENNY MENDONCAMcKinsey & Company (ret.)
BILL MUELLERValley Vision (Sacramento)
ELOY OAKLEY,Co-ChairLong Beach City College
SEAN RANDOLPHBay Area Council Economic Institute
LAURIE MADIGANSan Diego Business Leadership Alliance
SUMMIT ACTION TEAMS:More than 700 experts and practitioners are working through the Summit on action teams committed to the triple bottom line. In advance of the 2015 Summit in Ontario, these teams are broadening their regional networks, while working with state leaders to advance the Summit agenda:
INFRASTRUCTUREA team is developing new approaches to fi nancing infrastructure projects from transit to water systems—and training skilled workers to build them.
WORKFORCEA team is integrating the state’s segmented education system—and aligning the needs of students and future employers.
ADVANCING MANUFACTURINGA team is expanding career options in fi elds that provide sustainable, middle-income jobs.
HOUSINGA team is developing affordable, accessible housing for all.
CAPITALA team is growing small businesses by connecting investors and entrepreneurs.
WORKING LANDSCAPESA team is integrating rural and urban development, while preserving the state’s unmatched natural resources.
REGULATIONSA team is driving business growth by making state regulations more transparent.
SUMMIT UNDERWRITERS
AT&T
Automobile Club of Southern California
California Airports Council
Edison International
Metabolic Studio
Sempra Energy Utilities
Chevron
REGIONAL UNDERWRITERS
Morgan Family Foundation
Wells Fargo
SPONSORS
Applied Materials
Bridgepoint Education
California Emerging Technology Fund
Half Moon Bay Brewing Co.
Long Beach City College
The Nature Conservancy
SUMMIT PARTNERSThe California Economic Summit is a partnership of California Forward, an organization that works with Californians to stimulate the economy, make government more effective, and promote accountability and transparency, and the California Stewardship Network, a civic effort to develop regional solutions to the state’s most pressing economic, environmental, and community challenges.
THE ROAD TO THE SUMMITSummit Leaders, Partners, & Action Teams
All photos: Violeta Vaqueiro
UNDERWRITERS AND SPONSORS
WORKFORCE & WORKPLACEPreparing Californians to compete in a dynamic 21st century
TEAM ACTION TEAM GOALS FOR 2015 AND WHERE EACH TEAM PLANS TO ENGAGE
WO
RK
FO
RC
E
GOAL 1: Better align regional workforce development systems by connecting workforce, industry. Defi ne systems’ responsiveness, completion goals, including regional targets for training needs
• Ongoing state, federal efforts: UC Innovation Council initiative; Workforce Innovation and Opportunity Act (WIOA) Committee. Support implementation of 2014 legislation: AB 86 (adult education transition), SB 1022 (CSU & UC outcome data), and AB 2148 (workforce system dashboard).
• New initiatives: CA Community College Board of Governors Task Force. Also support efforts to bridge data systems across K-12, community college, adult education, and workforce investment boards.
GOAL 2: Find long-term workforce development funding for K-14 thru higher education—from regions-focused career pathways to career technical education programs (CTE)
• Implementation of 2014 effort: Work with Board of Governors Task Force to pursue recommendations on alternate funding models.
AD
VA
NC
ING
M
AN
UFA
CT
UR
ING
GOAL: Expand exposure to career options in manufacturing by connecting workforce training programs (K-12 thru higher ed) with manufacturers
• IMCP: Implementation of Southern California’s new Investing in Manufacturing Communities Partnership (IMCP).
• Campaign: Contribute to California Manufacturing & Technology Association’s Champions of Manufacturing initiative.
• CTE funding: Raise awareness about second round of Career Pathways Trust Program. Push for ongoing K-12 CTE funding.
HO
US
ING
GOAL: Ensure suffi cient housing for workforce by supporting housing development, connecting workforce development & worker housing
• Land use: Include land use considerations like jobs-housing ratio & siting in workforce plans.
• Housing siting: Site workforce training facilities in multi-family housing complexes, farmworker housing.
WO
RK
ING
L
AN
DS
&
INF
RA
ST
RU
CT
UR
E
GOAL: Promote city-centered development that attracts entrepreneurs, provides construction jobs, and encourages local hiring
• Cap & trade: Ensure cap & trade funds support city-centered jobs with improved access for workers.
• EIFDs: Build EIFD project pipeline that will provide well-paying, local construction jobs.
RE
GS
GOAL: Make regulations more transparent to drive business creation, growth
• Open data: Expand existing open data efforts (including the City of Los Angeles, CA Fwd, and Government Operations Agency) to connect workforce & industry, encourage job growth in this new sector.
• Streamline business permitting: Build “customer-satisfaction” website, pilot tracking system for applications.
CA
PIT
AL GOAL: Support growth of small business, entrepreneurs by connecting investors, lenders, and industry clusters
• Map capital intermediaries: Develop partnership with U.S. Small Business Administration, CAMEO, CALED, Small Business Development Centers, and federal partners.
• Implementation: Rollout California Finance Consortium, identify three regional pilots.
THE RIGHT NEXT STEPS & WHO WILL BE INVOLVED
1. Align regional workforce training, industry, and community needs by improving responsiveness to students, increasing completion rates, and fi nding long-term funding for career pathways and career technical education programs.
• Higher Ed: Community Colleges Chancellor’s Offi ce, California State University, University of California, University Economic Development Association
• K-12: State Department of Education, K-12 regional representatives, Linked Learning Alliance, Association of California School Administrators, California School Boards Association
• State agencies: GO-Biz (California Competes, Permit Assistance, iHubs), CalWORKs, Department of Rehabilitation, Department of Veterans Affairs, Department of Housing and Community Development
• Regions: Workforce Investment Boards, Regional Consortia, private colleges, equity groups (California Community Economic Development Association), Small Business Development Centers
• Open data: Government Operations Agency
• Labor: United Food and Commercial Workers, State Building & Construction Trades Council of California, SEIU-United Healthcare Workers West, California Alliance for Jobs
• Federal: National Standards Certifi cation Board
2. Provide small businesses and entrepreneurs with the tools they need to grow jobs in changing markets
• Capital team’s Impact Economy partners
• Manufacturing industry leaders (especially clean tech with its triple bottom line focus)
• Small business: National Federation of Independent Business, California Chamber of Commerce, local chambers
• State: GO-Biz, Employment Training Panel
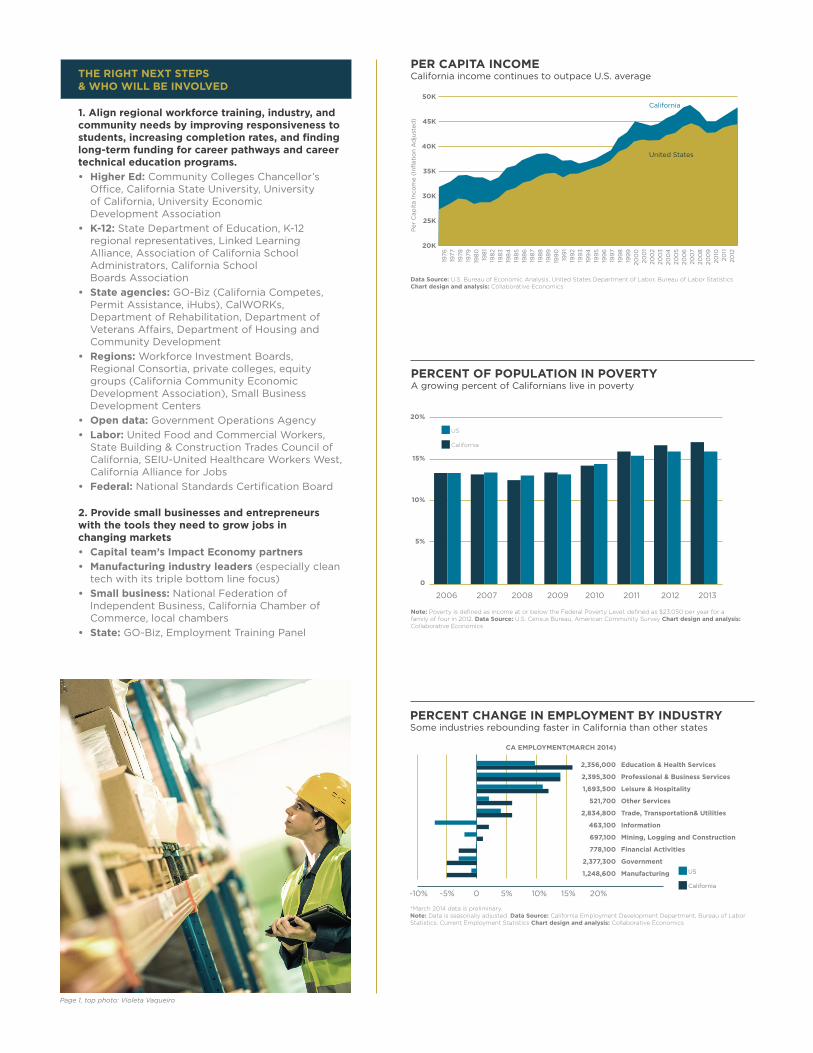
PER CAPITA INCOMECalifornia income continues to outpace U.S. average
Data Source: U.S. Bureau of Economic Analysis, United States Department of Labor, Bureau of Labor StatisticsChart design and analysis: Collaborative Economics
California
1976
1977
1978
1979
198
0
198
1
198
2
198
3
198
4
198
5
198
6
198
7
198
8
198
9
199
0
199
1
199
2
199
3
199
4
199
5
199
6
199
7
199
8
199
9
20
00
20
01
20
02
20
03
20
04
20
05
20
06
20
07
20
08
20
09
20
10
20
11
20
12
50K
45K
40K
35K
30K
25K
20K
20%
15%
10%
5%
0
Per
Cap
ita In
co
me (
Infl
ati
on
Ad
just
ed
)
United States
PERCENT OF POPULATION IN POVERTYA growing percent of Californians live in poverty
Note: Poverty is defi ned as income at or below the Federal Poverty Level, defi ned as $23,050 per year for a family of four in 2012. Data Source: U.S. Census Bureau, American Community Survey Chart design and analysis: Collaborative Economics
2006 2007 2008 2009 2010 2011 2012 2013
US
California
PERCENT CHANGE IN EMPLOYMENT BY INDUSTRYSome industries rebounding faster in California than other states
*March 2014 data is preliminary.Note: Data is seasonally adjusted. Data Source: California Employment Development Department, Bureau of Labor Statistics, Current Employment Statistics Chart design and analysis: Collaborative Economics
Page 1, top photo: Violeta Vaqueiro
CA EMPLOYMENT(MARCH 2014)
2,356,000
2,395,300
1,693,500
521,700
2,834,800
463,100
697,100
778,100
2,377,300
1,248,600
Education & Health Services
Professional & Business Services
Leisure & Hospitality
Other Services
Trade, Transportation& Utilities
Information
Mining, Logging and Construction
Financial Activities
Government
Manufacturing
-10% -5% 0 5% 10% 15% 20%
US
California
INFRASTRUCTURE & SUSTAINABLE COMMUNITIESBuilding the communities California needs to thrive
TEAM ACTION TEAM GOALS FOR 2015 AND WHERE EACH TEAM PLANS TO ENGAGE
INF
RA
ST
RU
CT
UR
E
GOAL 1: Expand use of Enhanced Infrastructure Financing Districts (EIFDs), public-private partnerships
• Build project pipeline: Expand regional project pipeline, ensure tools’ validation. Explore I-bank role, use of EIFDs in conjunction with industrial development bonds.
• Legislation: Pursue follow-up to SB 628 in 2015. Explore legislation to extend P3 authority beyond 2017.
GOAL 2: Maximize existing resources and identify new revenue sources to support outcomes-oriented infrastructure investments
• Cap & trade: Support implementation of Strategic Growth Council grant program to promote infrastructure resilience over next 25-50 years.
• Water, transportation, housing, K-12 schools: Identify long-term sources of revenue to support programs that can provide demonstrable results to voters.
HO
US
ING
GOAL 1: Ensure sufficient housing—and specific strategies and initiatives—in regional Sustainable Communities Strategies (SCS) and encourage transit-oriented housing development through cap & trade. Develop ways for rural areas with regional plans to qualify for these funds.
• SCS updates: Encourage support for effective urban & rural housing strategies in SCSs—especially in next Regional Housing Needs Assessment cycle—to ensure affordability, equity.
• Cap & trade: Emphasize value of housing near transit in reducing emissions. Assist regions without SCSs in identifying alternative methods for receiving funding.
• VMT: Follow debate over new transportation metrics (including Vehicle Miles Traveled - VMT) for impacts on jobs-housing ratio.
GOAL 2: Promote housing development, including dedicated source of statewide funding for affordable housing and provision of market-rate housing at all levels
• Local tools: Pursue follow-up to SB 628 (EIFDs). Work with cities to update General Plan provisions. Advocate for state matching role in K-12 school construction.
• Regional incentives: Scale up successful employer advocacy for housing projects that meet specific standards. Reduce regulatory barriers to building housing.
• Dedicated funding: Advocate for dedicated source of statewide funding for affordable housing.
RE
GU
LA
TIO
NS
&
MA
NU
FA
CT
UR
ING GOAL: Update regulatory processes including CEQA, water transfers, air permitting; expand use of open data in
land-use planning
• CEQA: Contribute to Office of Planning & Research update of CEQA Guidelines. Explore convening of environmental, environmental justice, housing groups on VMT.
• Water: Work with Department of Water Resources and State Water Resources Control Board on drought response.
• Open data: Engage Government Operations Agency, other agencies on open data efforts.
• Air: Shorten lead time for clean-tech and other manufacturers seeking air permits.
WO
RK
ING
LA
ND
SC
AP
ES
GOAL 1: Promote sustainable communities & use of natural capital by integrating urban/rural development, encouraging regional goods movement strategies
• Water bond: Ensure $7.5 billion in new funding is distributed to sustainable water projects with watershed-wide focus.
• Urban/rural: Expand Rural-Urban Connections Strategy (RUCS) model statewide to encourage integration of natural & traditional infrastructure. Join USDA Rural Opportunity Investment effort.
• Cap & trade: Encourage Strategic Growth Council grant guidelines to incorporate cap & trade and USDA efforts in one grant program. Assist rural regions without SCSs in identifying alternative methods for receiving funding for projects that reduce greenhouse gas emissions.
• Goods movement: Work with Metropolitan Planning Organizations on goods movement strategies.
• Water-energy-broadband: Work with Public Utilities Commission to target resources at rural landscapes.
GOAL 2: Document benefits of ecosystem services
• County grant programs: Expand Sonoma, Santa Cruz, Santa Clara ecosystem services efforts.
• Quantifying benefits: Work with Scientific Committee of the California Department of Food and Agriculture.
CA
PIT
AL GOAL: Expand private capital investment in infrastructure by mapping regional capital intermediaries and creating
navigator tool to match supply & demand
• Mapping: Develop partnership with U.S. Small Business Administration, CAMEO, CALED, Small Business Development Centers, and federal partners.
• Implementation: Rollout California Finance Consortium. Expand EIFD project pipeline.
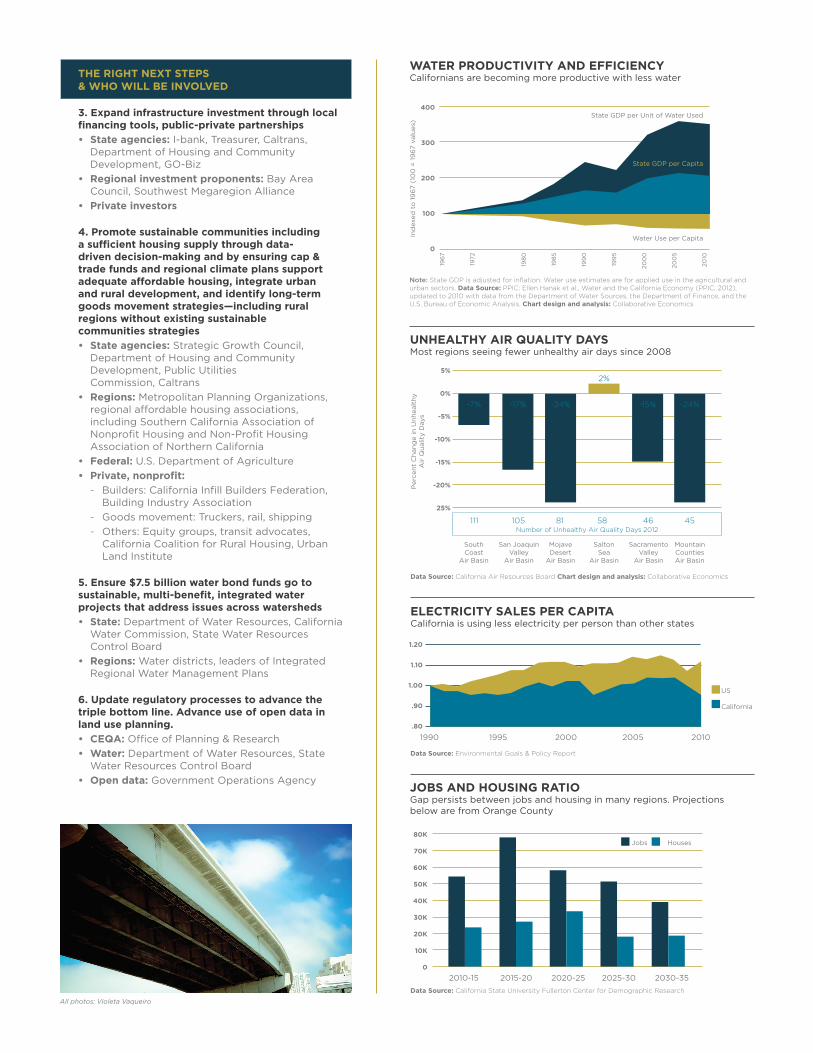
WATER PRODUCTIVITY AND EFFICIENCY Californians are becoming more productive with less water
UNHEALTHY AIR QUALITY DAYSMost regions seeing fewer unhealthy air days since 2008
ELECTRICITY SALES PER CAPITACalifornia is using less electricity per person than other states
JOBS AND HOUSING RATIOGap persists between jobs and housing in many regions. Projections below are from Orange County
Note: State GDP is adjusted for inflation. Water use estimates are for applied use in the agricultural and urban sectors. Data Source: PPIC: Ellen Hanak et al., Water and the California Economy (PPIC, 2012), updated to 2010 with data from the Department of Water Sources, the Department of Finance, and the U.S. Bureau of Economic Analysis. Chart design and analysis: Collaborative Economics
Data Source: California Air Resources Board Chart design and analysis: Collaborative Economics
Data Source: California State University Fullerton Center for Demographic Research
Data Source: Environmental Goals & Policy Report
Number of Unhealthy Air Quality Days 2012
Jobs Houses
US
California
SouthCoast
Air Basin
San JoaquinValley
Air Basin
MojaveDesert
Air Basin
SaltonSea
Air Basin
SacramentoValley
Air Basin
MountainCountiesAir Basin
Water Use per Capita
State GDP per Unit of Water Used
196
7
1972
198
0
198
5
199
0
199
5
20
00
20
05
20
10
400
300
200
100
0
5%
0%
-5%
-10%
-15%
-20%
25%
80K
70K
60K
50K
40K
30K
20K
10K
0
1.20
1.10
1.00
.90
.80
Ind
exed
to
19
67 (
100
= 1
96
7 v
alu
es)
Perc
en
t C
han
ge in
Un
healt
hy
Air
Qu
alit
y D
ays
111 105 81 58 46 45
1990 1995 2000 2005 2010
-7% -17% -24%
2%
-15% -24%
2010-15 2015-20 2020-25 2025-30 2030-35
THE RIGHT NEXT STEPS & WHO WILL BE INVOLVED
3. Expand infrastructure investment through local financing tools, public-private partnerships
• State agencies: I-bank, Treasurer, Caltrans, Department of Housing and Community Development, GO-Biz
• Regional investment proponents: Bay Area Council, Southwest Megaregion Alliance
• Private investors
4. Promote sustainable communities including a sufficient housing supply through data-driven decision-making and by ensuring cap & trade funds and regional climate plans support adequate affordable housing, integrate urban and rural development, and identify long-term goods movement strategies—including rural regions without existing sustainable communities strategies
• State agencies: Strategic Growth Council, Department of Housing and Community Development, Public Utilities Commission, Caltrans
• Regions: Metropolitan Planning Organizations, regional affordable housing associations, including Southern California Association of Nonprofit Housing and Non-Profit Housing Association of Northern California
• Federal: U.S. Department of Agriculture
• Private, nonprofit:
- Builders: California Infill Builders Federation, Building Industry Association
- Goods movement: Truckers, rail, shipping
- Others: Equity groups, transit advocates, California Coalition for Rural Housing, Urban Land Institute
5. Ensure $7.5 billion water bond funds go to sustainable, multi-benefit, integrated water projects that address issues across watersheds
• State: Department of Water Resources, California Water Commission, State Water Resources Control Board
• Regions: Water districts, leaders of Integrated Regional Water Management Plans
6. Update regulatory processes to advance the triple bottom line. Advance use of open data in land use planning.
• CEQA: Office of Planning & Research
• Water: Department of Water Resources, State Water Resources Control Board
• Open data: Government Operations Agency
State GDP per Capita
All photos: Violeta Vaqueiro
GOVERNANCE & FINANCEImproving public decision-making about how to achieve prosperity
TEAM ACTION TEAM GOALS FOR 2015 AND WHERE EACH TEAM PLANS TO ENGAGE
WO
RK
FO
RC
E
GOAL – Governance: Align regional workforce development systems
GOAL – Finance: Distribute long-term funding into regional structure
• State, federal efforts: UC Innovation Council initiative; Workforce Innovation and Opportunity Act (WIOA) Committee. Support implementation of 2014 legislation: AB 86 (adult education transition), SB 1022 (CSU & UC outcome data), and AB 2148 (workforce system dashboard).
• New initiatives: CA Community College Board of Governors Task Force. Also support efforts to bridge data systems across K-12, community college, adult education, and workforce investment boards.
AD
VA
NC
ING
M
AN
UFA
CT
UR
ING
GOAL – Governance: Build workforce/industry relationships that deliver manufacturing value on a global scale
GOAL – Finance: Distribute long-term workforce training funding (K-14 thru higher education) into regional structure
• Campaign: Expand on California Manufacturers & Technology Association’s Champions of Manufacturing initiative.
• Career technical education (CTE) funding: Raise awareness about Career Pathways Trust Program, push for ongoing K-12 CTE funding.
INF
RA
ST
RU
CT
UR
E
GOAL – Governance: Expand use of multi-jurisdictional financing tools with access to public-private funding
GOAL – Finance: Develop public-private partnerships, as well as long-term revenue sources
• Focus on results: Ensure state and local agencies maximize existing resources in infrastructure investment.
• Strategic growth: Engage with Strategic Growth Council to integrate AB 32/SB 375, land-use, housing, transportation policies.
• Data-driven decisions: Expand Rural-Urban Connections Strategy (RUCS) statewide. Develop statewide capacity to assess ecosystem services; promote Sonoma, Santa Cruz, Santa Clara efforts.
GOAL – Finance: Focus state and federal funding on integrated land-use policies
• Land use: Direct state funds toward integrated land-use efforts. Consider public use charge for water investments.
RE
GU
LA
TIO
NS
GOAL – Governance: Push state to adopt open data policy to drive efficiencies, create jobs in this new sector
GOAL – Finance: Identify revenue-neutral approach to supporting open data efforts
• Expand ongoing efforts: City of LA, CA Fwd open data initiatives, Government Operations Agency data efforts.
CA
PIT
AL
GOAL – Governance: Build public-private relationships that can support economic development
GOAL – Finance: Create map, navigator of capital intermediaries in each region, expand “4th Sector” & Pay for Success network
• Mapping & Implementation: Develop state and federal partnerships, promote California Finance Consortium pilot.
• Legislation: Promote use of new types of capital for community development, including new market tax credits.
• Policy development: Create task force to advance innovations in financing economic development, including Pay for Success.
THE RIGHT NEXT STEPS & WHO WILL BE INVOLVED
7. Identify adequate revenues to make investments in state’s long-term prosperity—from workforce development to infrastructure and sustainable communities
• Public/private: CA Fwd “Financing the Future” project, Impact Economy network, including Coalition of Community Development Financial Institutions
8. Align workforce development systems with industry, including manufacturers
• Higher Ed: Community Colleges Chancellor’s Office, California State University, University of California, University Economic Development Association
• K-12: State Department of Education, K-12 regional representatives, Linked Learning Alliance, Association of California School Administrators, California School Boards Association
• State agencies: GO-Biz (California Competes, Permit Assistance, iHubs), CalWORKs, Department of Rehabilitation, Department of Veterans Affairs, Department of Housing and Community Development
• Regions: Workforce Investment Boards, Regional consortia, private colleges, equity groups (California Community Economic Development Association), Small Business Development Centers
• Open data: Government Operations Agency
• Labor: United Food and Commercial Workers, State Building & Construction Trades Council of California, SEIU-United Healthcare Workers West, California Alliance for Jobs
• Federal: National Standards Certification Board
9. Integrate state climate adaptation efforts in next update of the AB 32 Scoping Plan to ensure sustainable land-use, infrastructure development, and drought preparedness
• State agencies: Strategic Growth Council, Department of Water Resources, State Water Resources Control Board, Public Utilities Commission, Department of Housing and Community Development, I-Bank, Treasurer’s Office
• Regions: Metropolitan Planning Organizations, water agencies
• Federal: U.S. Department of Agriculture
• Plans: California Climate Adaptation Strategy, California Goods Movement Action Plan, regional adaptation strategies, Environmental Goals and Policy Report, California Water Action Plan, Energy Efficiency Strategic Plan, California Biomass Energy Plan, AB 32 Scoping Plan, and Cap and Trade Investment Plan
• Private investors
10. Increase data-driven decision-making at all levels of government. Expand use of open data to drive efficiencies & innovation, create jobs in new sector
• Data-driven decision-making: Strategic Growth Council
• Open data: Government Operations Agency, GO-Biz, City of Los Angeles
Data source: Legislative Analyst’s Office
Criminal justice
Health and human services
Higher education
K-12
Prop 30 impact on spending begins >>
$120
$100
$80
$60
$40
$20
0
2007 2008 2009 2010 2011 2012 2013 2014
STATE SPENDING DURING THE RECOVERYGeneral fund and special fund spending climbing again
STATE FUNDING FOR CAREER TECHNICAL EDUCATIONDeclining funding over last decade as a percentage of full-time students
Data source: CA Community College Chancellor’s Office
31.5%
31%
30.5%
30%
29.5%
29%
2001 2002 2003 2004 2005 2006 2007 2008 2009 2010
Data source: Census data; Bureau of Economic Analysis
New York
Illinois
MassachusettsTexas
California
Florida
5.5%
5%
4.5%
4%
3.5%
3%
2.5%
1998 2000 2002 2004 2006 2008 2010 2012
K-12 SPENDING BY PERSONAL INCOMECalifornia lags behind peer states
TRANSPORTATION FUNDINGDramatic decline project in state and local investment
Data source: Caltrans. Funding sources depicted include state bond funds, local tax revenues, other state taxes, and the State Highway Operation and Protection Program (SHOPP).