82
Roadshow Webcast October 5, 2020

Roadshow Webcast
October 5, 2020

2
This presentation contains forward-looking statements within the meaning of the federal securities laws. These statements include, but are not limited to statements regarding Vontier Corporation’s (the
“Company’s”) business and acquisition opportunities, anticipated revenue growth, anticipated operating margin expansion, anticipated cash flow, and anticipated earnings growth, and any other statements
identified by their use of words like “anticipate,” “expect,” “believe,” “outlook,” “guidance,” or “will” or other words of similar meaning. There are a number of important risks and uncertainties that could cause
actual results, developments and business decisions to differ materially from those suggested or indicated by such forward-looking statements and you should not place undue reliance on any such forward-
looking statements. These risks and uncertainties include, among other things, the ability to satisfy the conditions to, and complete, the transaction on a timely basis or at all, including the ability of Vontier to
realize the benefits of the transaction, Vontier’s performance and maintenance of important business relationships pending closing of the transaction, the duration and impact of the COVID-19 pandemic,
deterioration of or instability in the economy, the markets we serve, international trade policies and the financial markets, trade relations with China, the phase out of the London Interbank Offered Rate,
contractions or lower growth rates and cyclicality of markets we serve, competition, changes in industry standards and governmental regulations that may adversely impact demand for our products or our costs,
our ability to successfully identify, consummate, integrate and realize the anticipated value of appropriate acquisitions and successfully complete divestitures and other dispositions, our ability to develop and
successfully market new products, software, and services and expand into new markets, the potential for improper conduct by our employees, agents or business partners, impact of divestitures, contingent
liabilities relating to acquisitions and divestitures, impact of changes to tax laws, our compliance with applicable laws and regulations and changes in applicable laws and regulations, risks relating to international
economic, political, legal, compliance and business factors, risks relating to potential impairment of goodwill and other intangible assets, currency exchange rates, tax audits and changes in our tax rate and
income tax liabilities, the impact of our debt obligations on our operations, litigation and other contingent liabilities including intellectual property and environmental, health and safety matters, our ability to
adequately protect our intellectual property rights, risks relating to product, service or software defects, product liability and recalls, risks relating to product manufacturing, our relationships with and the
performance of our channel partners, commodity costs and surcharges, our ability to adjust purchases and manufacturing capacity to reflect market conditions, reliance on sole sources of supply, security
breaches or other disruptions of our information technology systems, adverse effects of restructuring activities, impact of changes to U.S. GAAP, labor matters, and disruptions relating to man-made and natural
disasters. Additional information regarding the factors that may cause actual results to differ materially from these forward-looking statements is available in our SEC filings, including our Information Statement
filed with the Form 10-12B/A on September 21, 2020. These forward-looking statements represent Vontier’s beliefs and assumptions only as of the date of this presentation and Vontier does not assume any
obligation to update or revise any forward-looking statement, whether as a result of new information, future events and developments or otherwise.
Forward-Looking Statements

3
This presentation may contain statistics or other data that in some cases has been contained or compiled from information made available by third-party service providers. The Company makes no
representations or warranties, express or implied, with respect to the accuracy, reasonableness, or completeness of such information.
This presentation shall not constitute an offer to sell or the solicitation of an offer to buy these securities, nor shall there be any sale of these securities in any state or jurisdiction in which such offer,
solicitation or sale would be unlawful prior to registration or qualification under the securities laws of any such state or jurisdiction.
The information contained herein does not constitute investment, legal, accounting, regulatory, taxation or other advice and the information does not take into account your investment objectives or
legal, accounting, regulatory, taxation or financial situation or particular needs. You are solely responsible for forming your own opinions and conclusions on such matters and the market and for making
your own independent assessment of the information.
Disclaimer

4
This presentation contains references to “core revenue,” “core revenue growth,” “free cash flow,” “adjusted free cash flow,” “adjusted normalized free cash flow,” “adjusted normalized free cash flow conversion,” “adjusted operating
profit,” “adjusted normalized operating profit,” “adjusted normalized operating margin,” “adjusted net earnings,” “adjusted normalized net earnings,” “adjusted normalized net earnings margin,” “EBITDA,” “adjusted EBITDA,” “adjusted
EBITDA margin “adjusted normalized EBITDA,” and “adjusted normalized EBITDA margin,” financial measures which are, in each case, not presented in accordance with generally accepted accounting principles (“GAAP”).
• Core revenue or core revenue growth refers to sales or change from sales from operations, respectively, calculated according to GAAP but excluding (1) sales impact from acquired businesses and (2) the impact of currency
translation. References to sales or operating profit attributable to acquisitions or acquired businesses refer to GAAP sales or operating profit from acquired businesses recorded prior to the first anniversary of the acquisition less
the amount of sales or operating profit attributable to certain divested businesses or product lines not considered discontinued operations. The portion of sales attributable to the impact of currency translation is calculated as the
difference between (a) the period-to-period change in sales (excluding sales from acquired businesses) and (b) the period-to-period change in sales, including foreign operations (excluding sales from acquired businesses) after
applying the current period foreign exchange rates to the prior year period.
• Free cash flow refers to cash flow from operations calculated according to GAAP but excluding capital expenditures.
• Adjusted free cash flow refers to free cash flow adjusted for pro-forma interest expense on debt, net of interest income
• Adjusted normalized free cash flow refers to adjusted free cash flow adjusted for standalone and other one-time public company costs and adjusted normalized free cash flow conversion refers to adjusted normalized
free cash flow divided by adjusted normalized net earnings
• Adjusted operating profit refers to operating profit calculated in accordance with GAAP, but excluding amortization of acquisition-related intangible assets, accruals for significant legal matters, and restructuring costs and asset
impairments
• Adjusted normalized operating profit refers to adjusted operating profit adjusted for standalone and other one-time public company costs and adjusted normalized operating margin refers to adjusted normalized
operating profit divided by GAAP sales
• Adjusted net earnings refers to net earnings calculated in accordance with GAAP, but excluding amortization of acquisition-related intangible assets and applying the Company's overall estimated effective tax rate to the pretax
amount of the adjustment, unless the nature of the adjustment and/or the tax jurisdiction in which the adjustment has been recorded requires application of a specific tax rate or tax treatment, in which case the tax effect of such
adjustment is estimated by applying such specific tax rate or tax treatment.
• Adjusted normalized net earnings refers to adjusted net earnings adjusted for standalone public company costs and the tax impact of those adjustments and adjusted normalized net earnings margin refers to adjusted
normalized net earnings as a percentage of GAAP sales
• EBITDA refers to net earnings calculated in accordance with GAAP, excluding, interest, taxes, depreciation, and amortization of acquisition-related intangible assets
• Adjusted EBITDA refers to EBITDA excluding accruals for significant legal matters, restructuring costs and asset impairments, loss or gains from acquisitions and divestitures, and earnings attributable to non controlling
interest and adjusted EBITDA margin refers to adjusted EBITDA as a percentage of GAAP sales
• Adjusted normalized EBITDA refers to adjusted EBITDA adjusted for standalone public company costs and adjusted normalized EBITDA margin refers to adjusted normalized EBITDA as a percentage of GAAP sales.
The Company has not reconciled the forward-looking statements regarding core revenue growth, core operating margin expansion, adjusted normalized operating profit and margin, adjusted normalized free cash flow and conversion,
and adjusted normalized net earnings because both the corresponding GAAP measures and the reconciliation thereto would require the Company to make estimates or assumptions about unknown currency impact, unidentified
acquisitions and similar adjustments during the relevant period. The historical non-GAAP financial measures should not be considered in isolation or as a substitute for the GAAP financial measures but should instead be read in
conjunction with the corresponding GAAP financial measures. Further information with respect to and reconciliations of such non-GAAP financial measures to the nearest GAAP financial measure can be found attached to this
presentation.
We report our financial results in accordance with GAAP. However, we present certain non-GAAP measures, as described above, which are not recognized financial measures under GAAP, because we believe they assist investors
and analysts in comparing our operating performance across reporting periods on a consistent basis by excluding items that we do not believe are indicative of our core operating performance. Management believes these measures
are helpful in highlighting trends in our operating results, while other measures can differ significantly depending on long-term strategic decisions regarding capital structure and allocation, the tax jurisdictions in which companies
operate and capital investments and acquisitions.
Non-GAAP Financial Measures

Key Facts and Dates
5
Structure: Tax-free pro rata distribution to Fortive shareholders of 80.1% of Vontier, a new publicly-traded company
Exchange: NYSE
Ticker: VNT
Distribution Ratio: 2 shares of VNT for every 5 shares of Fortive
Declaration Date September 15
Record Date September 25
Distribution Date October 9
Fiscal Year End December 31

Agenda
6
I. Introduction to Vontier Mark Morelli, President & CEO
II. M&A Playbook and Portfolio Transformation Elizabeth Cheever, Vice President, Corporate Development
Q&A
III. Mobility Technologies Mark Morelli, President & CEO
Q&A
IV. Diagnostics & Repair Technologies Mark Morelli, President & CEO
V. Financial Overview David Naemura, CFO
VI. Closing Comments Mark Morelli, President & CEO
Q&A

Today’s Presenters
7
Mark
MorelliPresident &
Chief Executive Officer
David
NaemuraChief Financial Officer
Elizabeth
CheeverVice President,
Corporate
Development

I. Introduction to Vontier

By Geography¹
North America
68%
High-Growth Markets (HGMs)
18%
Europe10%
RoW4%
SaaS7%
Service & Other Recurring Revenue
16%
Environmental 11%
E-Mobility<1%Retail
Solutions11%
Retail Fueling HW
31%
Smart Cities1%
Auto Repair20%
Other3%
Establishing a New Premier Industrial Technology Company
Strong Fundamentals with Runway of Opportunities, Enhanced by M&A 9
Key Financials
By Solution¹
>100%
FCF Conversion
~20%
Adj. Normalized
Op. Profit Margin
GDP+
Core Revenue Growth
Market Leader in Mobility Technologies
Large, Global Installed Base with
Historically Low Cyclicality
Attractive Financial Profile with Strong
Margins & Free Cash Flow
Proven Business System and Culture,
Inherited from Danaher & Fortive
Runway of Opportunities for Profitable
Growth and M&A
>40%
Gross Margin
$2.8bn
2019 Sales
Mid-20%
Recurring Sales
Note: Core Revenue Growth, Adjusted Normalized Operating Profit Margin, Free Cash Flow, and Free Cash Flow Conversion are non-GAAP financial metrics. For a reconciliation to the
most comparable GAAP metrics, see Appendix.1 Based on 2019A sales. High-growth markets are defined as developing markets of the world experiencing extended periods of accelerated growth in gross domestic product and
infrastructure, which include Eastern Europe, the Middle East, Africa, Latin America, and Asia Pacific (with the exception of Japan and Australia).

United by Our Shared Purpose

VBS Powers Every Aspect of our Culture and Performance
Defined by Our Values

Strategically Positioned in Attractive Mobility Infrastructure Markets
Trusted Brands and Leading Technology with Long Runway of Potential 12
Mobility Technologies
A leading worldwide provider of integrated fueling infrastructure solutions,
c-store software and payment systems, and connected solutions to drive
efficiency and improve safety
~$20bn | MSD
Diagnostics & Repair Technologies
Broad product offering of automotive diagnostic and
repair solutions
~$7bn | LSD
Vontier Value
Proposition
Served Markets1 /
Market Growth
Outlook2
Operating
Companies
1 Based on 2019 industry sales and management estimates2 Based on the compound annual growth rates of large industry companies

Global Footprint and Broad Installed Base Provide StrongFoundation for Continued Growth
Strong Local Infrastructure and Long Tenure of Operations in Global Markets 13
~8,300 Employees
~700Engineers
20Manufacturing
Facilities
>260,000Retail Fueling
Customer Sites
>1,800 Matco Franchisees
>600,000Auto technicians
served weekly
>90,000GTT Controlled
Intersections
>480,000Vehicles Monitored
by Teletrac Navman
Vontier Locations
Tenure Operating in Market
2019 Sales: ~$2.8 Billion
100+
yrs
~60
yrs
~30
yrs
~10
yrs
~75
yrs
~20
yrs
~90
yrs
United States
Latin America
Europe
Middle East &
Africa
IndiaChina
Australia /
New Zealand
Loyal customer base with no significant customer concentration
Note: Based on 2019 actuals

Key Secular Growth Trends That Provide Stability Through Economic Cycles
Macro Tailwinds Driving Cycle Resistant Growth in ~$27bn Market 14
Growing Population &
Traffic Congestion
Increasing Complexity
of Supply Chain
Safety, Security, &
Regulation
• Growing populations globally
• Increasing traffic congestion in both emerging and developed markets
• Increasing vehicle miles traveled
• Changing fiscal regulation and systems
• Continued focus on driver safety
• Stringent emission control regulations
• Need for efficient fleet management
• Increasing vehicle connectivity
• Adoption of electric vehicles
• Rising emphasis on environmental impact
• Increasing complexity of vehicle repair
• Aging vehicle installed base
• Shortage of skilled technicians
• Rise in e-commerce and overall movement of goods by road
• Increasingly complex and global supply chains
• Mainstreaming of efficient and same-day last mile deliveries
Clean, Efficient
Mobility Solutions
Increased Vehicle
Complexity

Resilient Business Model with Strong Performance Through the Cycle
MSD Growth Over the Last 15 Years, While Improving Margins ~500bps 15
2005 – 2019 Sales Over TimeUS$ in Billions
Sales CAGR (%)
‘05 – ‘19 6 %
‘08 – ‘10 3 %
Last 3 Years (‘16 – ‘19) 5 %
Last 5 Years (‘14 – ‘19) 5 %
YoY Total
Growth 5 % 9 % 5 % 4 % (6) % 12 % 4 % 5 % 14 % 12 % 5 % 7 % 5 % 7 % 4 % Avg: 6%
‘05 – ‘19
$1.2 $1.4 $1.4
$1.5 $1.4
$1.6 $1.6 $1.7
$1.9 $2.1
$2.2 $2.4
$2.5 $2.7
$2.8
2005 2006 2007 2008 2009 2010 2011 2012 2013 2014 2015 2016 2017 2018 2019
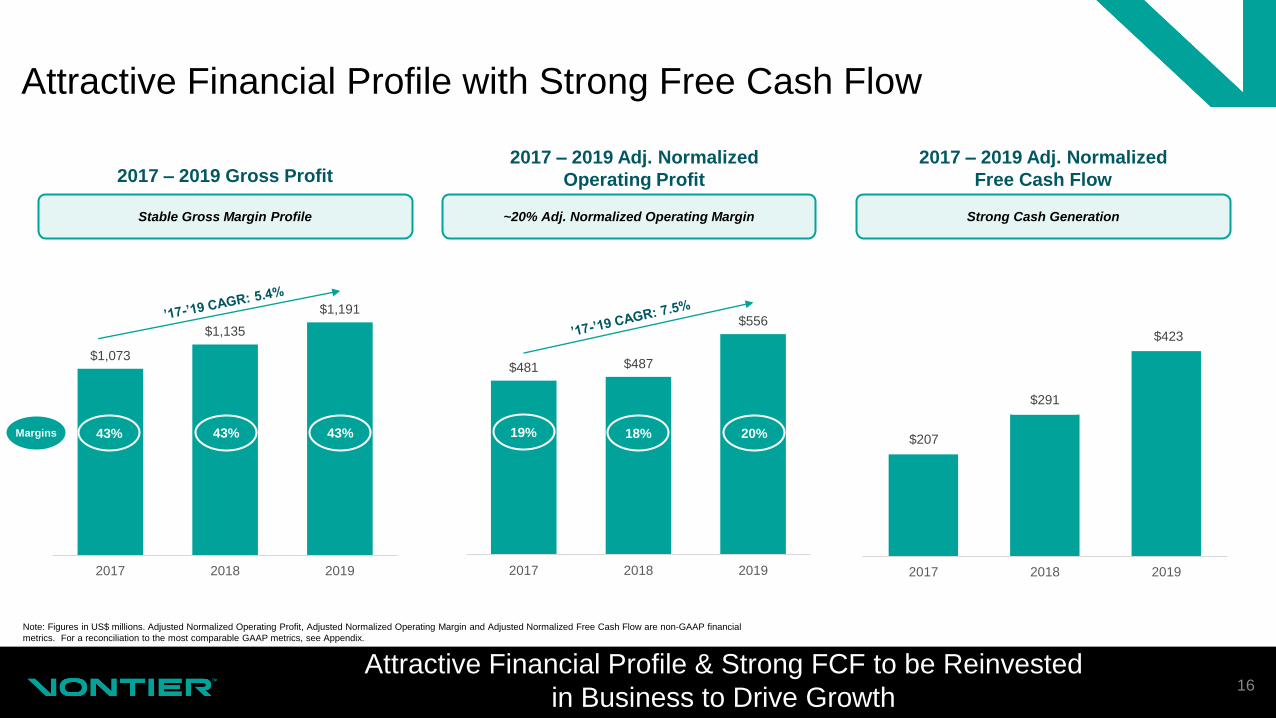
Attractive Financial Profile with Strong Free Cash Flow
Attractive Financial Profile & Strong FCF to be Reinvested
in Business to Drive Growth16
2017 – 2019 Adj. Normalized
Operating Profit
2017 – 2019 Adj. Normalized
Free Cash Flow
Strong Cash Generation~20% Adj. Normalized Operating Margin
2017 – 2019 Gross Profit
Stable Gross Margin Profile
$1,073
$1,135
$1,191
2017 2018 2019
$481 $487
$556
2017 2018 2019 2017 2018 2019
$207
$291
$423
43%Margins 43% 43% 19% 18% 20%
Note: Figures in US$ millions. Adjusted Normalized Operating Profit, Adjusted Normalized Operating Margin and Adjusted Normalized Free Cash Flow are non-GAAP financial
metrics. For a reconciliation to the most comparable GAAP metrics, see Appendix.
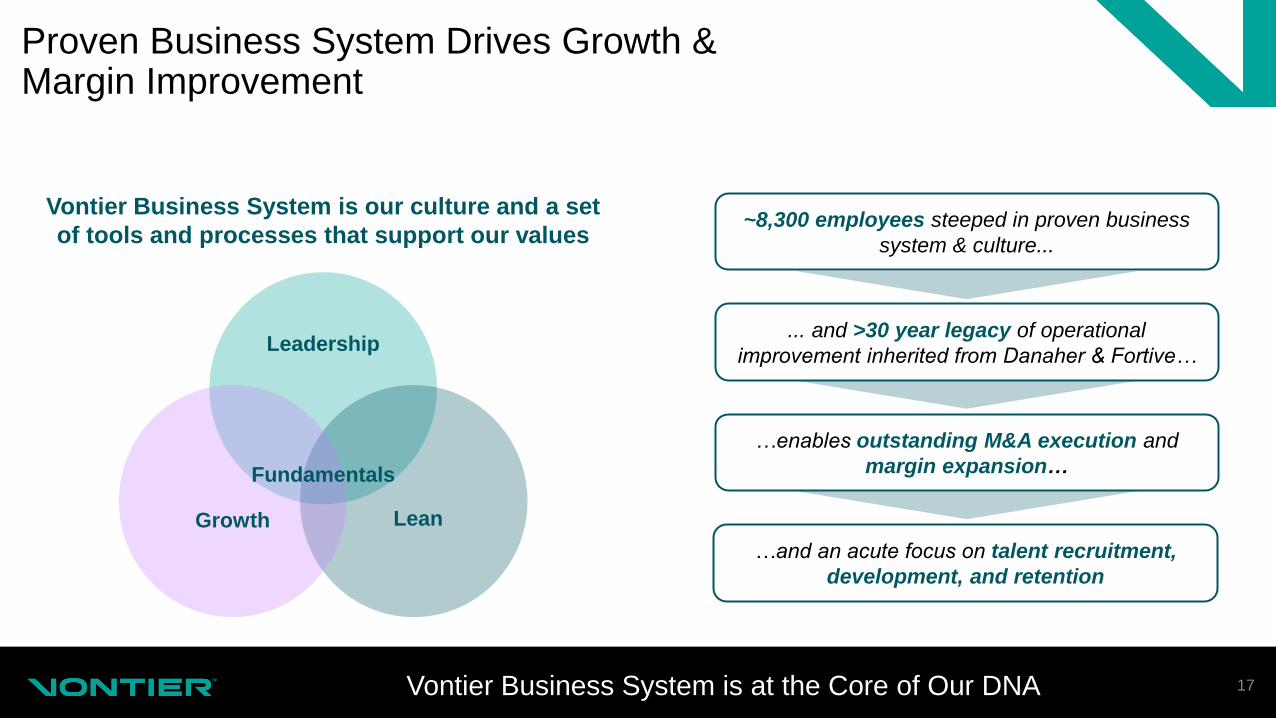
Proven Business System Drives Growth & Margin Improvement
Vontier Business System is at the Core of Our DNA 17
Leadership
Growth Lean
Fundamentals
Vontier Business System is our culture and a set
of tools and processes that support our values~8,300 employees steeped in proven business
system & culture...
... and >30 year legacy of operational
improvement inherited from Danaher & Fortive…
…and an acute focus on talent recruitment,
development, and retention
…enables outstanding M&A execution and
margin expansion…
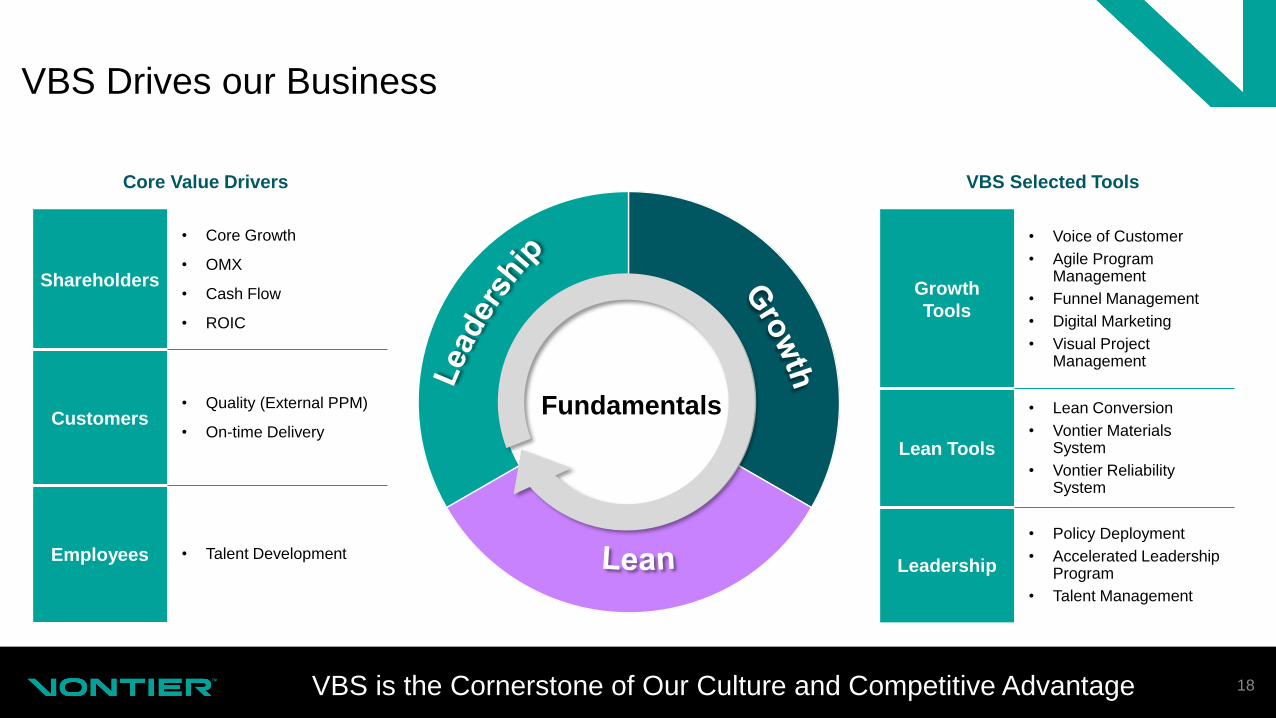
VBS is the Cornerstone of Our Culture and Competitive Advantage 18
Fundamentals
Core Value Drivers
Shareholders
• Core Growth
• OMX
• Cash Flow
• ROIC
Customers• Quality (External PPM)
• On-time Delivery
Employees • Talent Development
VBS Selected Tools
Growth
Tools
• Voice of Customer
• Agile Program Management
• Funnel Management
• Digital Marketing
• Visual Project Management
Lean Tools
• Lean Conversion
• Vontier Materials System
• Vontier Reliability System
Leadership
• Policy Deployment
• Accelerated Leadership Program
• Talent Management
VBS Drives our Business

• Entry into Electric Charging
• Insite360 for Retail Station Operations
Successful Track Record of Growth and Strategic Evolution Through M&A and Organic Expansion
Proven Flywheel Playbook Demonstrates Power of Compounding Growth 19
• Expansion into HGMs
• Fleet Management, Safety, and Compliance
• Emergency Response & Transit Systems
• Dispensers
• Tank Gauging
• Alternative Fuels
• Point-of-Sale
• Forecourt Control
• Payment Systems
2000s
Hardware & SensorsLate 2000s
Software Systems Early 2010s
High-Growth
Markets 2013
Logistics &
Supply Chain
(Partnership) (Minority
Investment)
2014
Cloud-Based
SW & Analytics 2016
Smart City
Expansion 2018 to Present
E-Mobility
Fuel Pumps
Early 2000s → TAM: $1bn 2019 → TAM: $27bn
Separation creates opportunity to re-engage in M&A as <5% of Fortive’s historical capital was deployed in mobility infrastructure
(Minority
Investment)

$27bn Market with Large Runway for Earnings Growth
Platform Is Well-Positioned to Expand Into Attractive Market Adjacencies 20
Retail / Commercial Fueling
Telematics
Diagnostics & Repair Technologies
Smart City
Solutions
Intersection
Automation
Adv. Traffic
Management
Public Transit
IoT Devices
Supply Chain
Transpo. Mgmt.
Software
Workflow SoftwareEV
Infrastructure
Expand Footprint
in HGMs
Workflow Software Diagnostics
$8bn | MSD $5bn | HSD
$7bn | LSD
$7bn | MSD
Total Addressable Market1 | Estimated Market Growth2
1 Based on 2019 industry sales and management estimates2 Based on the compound annual growth rates of large industry companies

Vontier Will Build on its Danaher and Fortive Heritage
Vontier Business System, Inherited from Danaher and Fortive, Provides a
Proven Playbook to Drive Shareholder Value 21
Inherited business system from Fortive Business System (“FBS”)
Investment grade style capital structure
Robust free cash flow allows for reinvestment
Disciplined M&A with a significant pipeline to accelerate growth and evolve the portfolio
◼ Inherited proven business system from Danaher (“DBS”)
◼ Strong capital structure
◼ Robust free cash flow allows for reinvestment
◼ Disciplined R&D and M&A with a significant pipeline to accelerate growth and evolve the portfolio
✓
✓
✓
✓
Core Growth
vs. Fortive
at Spin
Recurring Sales
Adj. Normalized
OM1
GDP+ +
+Mid-20%
~20%
+ = Better = In-Line
✓
✓ ✓
✓
Fortive Heritage for Performing Portfolio Transformation Vontier’s Similar Playbook for Shareholder Value Creation
✓
FCF Conv. >100% + ✓
Note: Core Growth, Adjusted Normalized Operating Margin, Free Cash Flow and Free Cash Flow Conversion are non-GAAP financial metrics. For a reconciliation to the most comparable GAAP metrics, see Appendix.1 Adjusted normalized operating margin. Fortive at Spin metrics based on 2016. For a reconciliation to the most comparable GAAP metrics, see Appendix. 2 Premium Industrial comps include: Illinois Tool Works, Ametek, Idex, Nordson, Graco and MSA Safety.
vs. Premium
Industrials2

Name Background
Mark Morelli
President & CEO,
Board Nominee
David Naemura
CFO
Elizabeth Cheever
VP of Corporate
Development
Roopa Unnikrishnan
Chief Strategy Officer
Kathryn Rowen
General Counsel
Sarah Miller
CIO
Lisa Curran
VP of IR
Name Background
Aaron Saak
President of GVR
Tim Gilmore
President of Matco
Jens Meggers
President of
Teletrac Navman
Nicole Rennalls
President of GTT
Ben Gambrel
Head of VBS
Andrew Nash
Head of HR
Shinder Dhillon
VP, Inclusion,
Diversity & Equity
Name Background
Karen Francis
Chair
Martin Gafinowitz
Board Director
Mark Morelli
President & CEO,
Board Nominee
Gloria Boyland
Board Nominee
Andrew Miller
Board Nominee
Experienced and Proven Leadership Team
Strong, Diverse Team Steeped in Business System Culture –
Track Record of Portfolio Transformation22
Board of Directors

II. M&A Playbook & Portfolio Transformation

Proven Playbook for Exceptional Growth Through M&A
Substantial Opportunity to Accelerate Growth Through M&A 24
ValuationExecution
Opportunities to Accelerate Strategic
Objectives are the Priority for M&A Capital
MarketStrategic Alignment
CompanyRobust pipeline of opportunities
What We Look For
\
• Secular / structural growth drivers
• High barriers to entry / low risk of disruption
• Runway for future M&A
\
• Attractive market position with potential to grow
• Strong brand and / or channel
• Margin improvement potential
\
• Disciplined on valuation
• Patient, systematic approach to identification and cultivation of M&A funnel

Multiple Vectors For Growth Through M&A
~$1.5bn of M&A Capacity Over Next 2-3 Years 25
Bolt-ons
• Scale new technology by leveraging our installed base
• Acquire channel / commercial capabilities
• Expand geographic reach
Adjacencies
• Leverage strength in existing markets
• Revenue and cost synergies
• Drive margin improvement with Vontier Business System (“VBS”)
New
Platforms
• Transformative transactions
• Larger, beach-head investments
2000s Late 2000s Early 2010s
2013 2014 2016+
Successful Track Record of Growth Through M&A
M&A execution across growth, value, and minority investments
underscores Vontier’s agile capital deployment strategy
Growth / Improvement
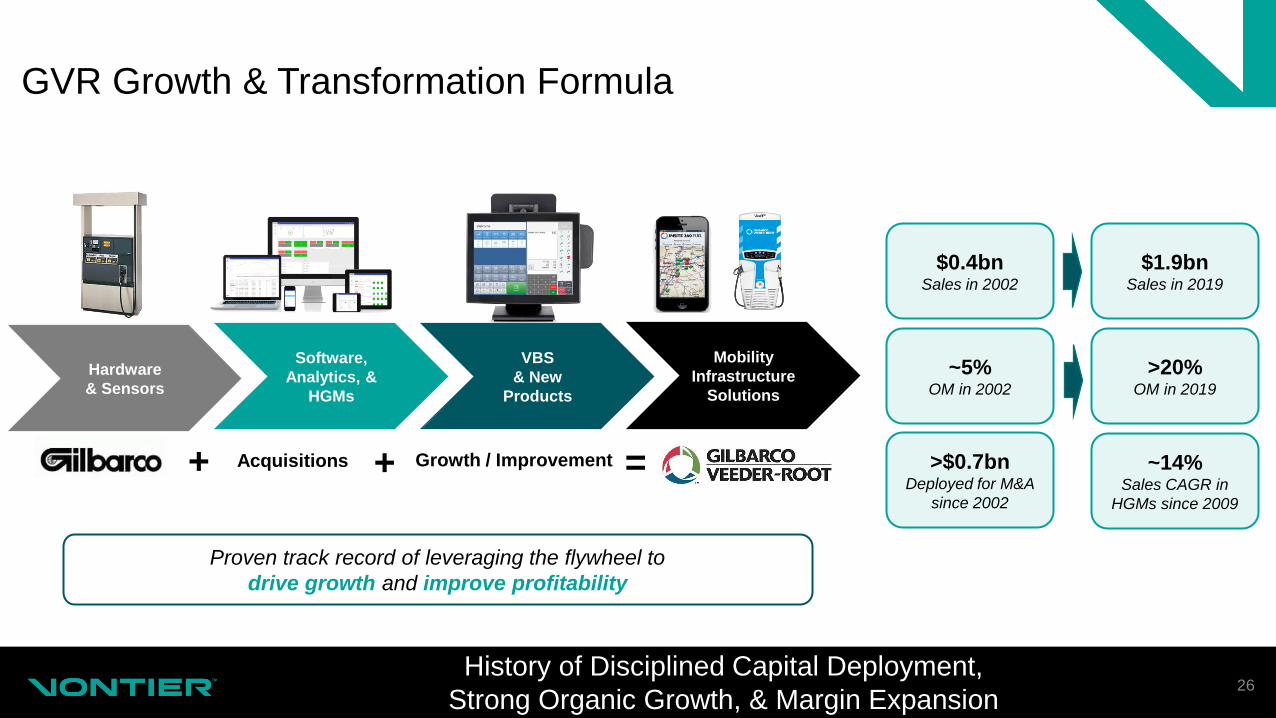
GVR Growth & Transformation Formula
History of Disciplined Capital Deployment,
Strong Organic Growth, & Margin Expansion26
+ + =Acquisitions
Hardware
& Sensors
Software,
Analytics, &
HGMs
VBS
& New
Products
Mobility
Infrastructure
Solutions
$0.4bn Sales in 2002
$1.9bnSales in 2019
~5%OM in 2002
>20% OM in 2019
>$0.7bnDeployed for M&A
since 2002
Proven track record of leveraging the flywheel to
drive growth and improve profitability
~14%Sales CAGR in
HGMs since 2009

Q&A
27

III. Mobility Technologies

Mobility Technologies
Mobility Technologies Leader: Powering, Monitoring, & Directing Transportation 29
Key Financials
~$2.1bn
2019 Sales
~$20bn
Market Size1
MSD
Estimated
Market Growth2
Leading Global Supplier of
Mobility Infrastructure
Solutions
Leading Global SaaS
Telematics Provider
Leading Provider of Intelligent
Traffic Control Systems
Fueling Infrastructure Solutions Fleet Management Solutions Traffic / Transit Solutions
Retail Fuel Stations &
Convenience Store Operators
Service, Transport, &
Construction / Mining Fleet
Operators
Emergency Response and
Transit Agencies
Ove
rvie
wC
usto
me
rs
1 Based on 2019 industry sales and management estimates2 Based on the compound annual growth rates of large industry companies

Gilbarco Veeder-Root

Gilbarco Veeder-Root Overview
Industry Leading Platform with Significant Global Scale 31
Overview
• #1 global supplier of solutions for mobility infrastructure
• Customers include the world’s leading convenience stores and commercial fleet brands
• Products include fuel dispensers, point-of-sale software, payment systems, cloud services, tank monitoring systems, aftermarket services, and EV chargers
• Approximately 5,500 employees worldwide, with manufacturing facilities in 9 countries
• Headquartered in Greensboro, NC
Key Growth Initiatives
Expand in
High-Growth
Markets
Grow Digital
Solutions
Drive Profitable
Growth
Expand
E-Mobility
Solutions
Strategic Advantages
Leader in technology for regulatory and
infrastructure build-out cycles
Diverse mix of customers spanning multiple
geographies
Growing solution stack for e-mobility
infrastructure build-out
Broad range of software solutions enabling
the ability to drive additional recurring sales
and bigger share-of-wallet

Fully-Integrated Solutions for the Forecourt & the C-Store 32
EV CHARGERS
AUTOMATED TANK GAUGES
FORECOURT
CONTROLLER
DISPENSERS
PAYMENT
SOLUTIONS
POINT-OF-SALE
SOFTWARE
FUEL LOGISTICS
MANAGEMENT
GVR is the Only Global Provider of Full-Site Solutions
Why GVR Wins
HEAD & BACK OFFICE
SOFTWARE
Large Installed Base
Strong HGM Exposure
Technology Leadership
Market Leading Software
& Workflow Solutions
Portfolio Evolution Ahead of
Customer / Market Needs

Key Market Dynamics Underpinning Long-Term Growth for GVR
GVR Uniquely Positioned to Benefit Given Scale and Breadth of Technology 33
Security &
Environmental
Regulations
HGM
Infrastructure
Build-Out
Retailer
Sophistication
• Electronic tampering of
payment systems is key
financial risk
• Fuel and vapor release into
ground water and air are
environmentally damaging
• Auto emission regulations
and growing social
awareness leading to
adoption of EVs
• Growing car parc
increasing vehicle density
in both urban and rural
areas
• Fuel retailing networks
needing integrated
hardware and software
solutions to drive
productivity
• Strategic change in
mindset from “gas station”
to “retailer”
• Expanding offerings
beyond fuel to increase
sales and profits
• Increased reliance on
software and analytics to
improve productivity and
customer experience
Continued
Growth in the
Global Car Parc
• The global car parc of
~1.2bn vehicles is
expected to grow
• ICE1 vehicles are expected
to remain >90% of the
global car parc through
20302
• EVs represent <1% of the
global car parc in 20202
1ICE = Internal combustion engine, 2Bloomberg NEF’s 2020 Electric Vehicle Outlook

• India/Mexico/Brazil: Vapor recovery,
continued station automation, and anti-
fraud measures
• China: Vapor recovery and vapor
monitoring moving forward
Long History of Regulatory Waves Driving Growth
EMV ‘Supercycle’ Driving Outsized Growth vs Other Regulations 34
Nordics
Payments
2005 2010 2022+
Canada EMV
Italy
Payments
China Vapor
Recovery
2020
India/Mex/Brazil
Vapor Recovery
India Automation
Regulatory Environment
• Extended deadline for EMV compliance
standards to April 2021
• EMV expected to support strong growth in
2020, with 70%+ penetration by end of year
• Large customers continuing upgrades,
reflecting healthy margins and MOC
incentives
• The timing of the peak will be driven by the
next few tiers of customers and their timing
is harder to predict
U.S. EMV Update
New Regulations on the Horizon
Pa
ym
en
t
Reg
ula
tio
n
En
vir
on
me
nta
l /
Fis
ca
l
Reg
ula
tio
n
Greece Fiscal
U.S. DEF
SEA
Payments
AUS
Pay@Pump
U.S. PCI 1-4
Turkey Fiscal
China Double-
Wall
U.S. PCI
2.0 Sunset
Brazil Fraud/Tax
Mexico
Fiscal
U.S. EMV

Timing / ramp of peak driven by smaller
tier customers’ rate of adoption
EMV providing strong growth in 2020
Pandemic causing dynamic demand
environment with limited visibility
EMV has Provided Above Historical Growth
GVR Expected to Have Long-Term MSD Core Growth;
EMV Sunset Tempers Nearer-Term Growth35
Pre-EMV Mandate
’11 – 13: CAGR: ~5% ’14 – 19 CAGR (incl. EMV): ~6%
GVR historically
grew at ~5% annually
EMV accelerated GVR sales growth
during the roll-out period
EMV Roll-Out
¹ GVR EMV includes incremental sales of dispensers and kits above long-term historical growth rates.
Near-Term Forecast
2011 2012 2013 2014 2015 2016 2017 2018 2019
GVR Excluding EMV GVR EMV¹
Upside from profitability focus and M&A

Strategic Initiatives Support Growth Post-EMV Transition
Actions in Place to Address Large Runway of Opportunities 36
Expand
High-Growth Markets
• Capitalize on infrastructure build-out and increasing environmental regulations
• Targeted investments in India, China, the Middle East, Africa, and Latin America
Grow Digital
Solutions
• Deploy suite of software offerings to improve store efficiency and end-user experience
• Leverage in-country presence to customize solutions for local market needs
• Provide integrated, cloud-based software suite spanning fuel logistics through forecourt management
• Leverage VBS toolkit focused on:
o Expanding industry leading margins
o Simplifying product and operational footprint
o Accelerating productivity
o Enhancing the customer experience
Expand
E-Mobility Solutions
• Investments in global leaders, strong position in infrastructure
• Expand offerings beyond high-speed charging to capture emerging opportunities across customer base
• Expand fleet offering, combining charging into a single mobility infrastructure
Drive Profitable
Growth

Driving Top and Bottom-Line Growth Through:
Productivity Programs Designed to Accelerate Profitable Growth
VBS is the Foundation of Organic Initiatives to Enhance Growth, Drive OMX 37
Drive Profitable Growth
Europe
MEA
Multiple opportunities to drive revenue growth and operating margin expansion
Streamlining organization post-EMV
Simplifying product line
Expanding recurring revenue
opportunities
Enhancing the customer experience

Opportunity for Continued Growth in Retail Solutions
Highly Sticky, Recurring Sales with Multiple Upgrade Opportunities 38
Grow Digital
Solutions
Market Dynamics
• Customer strategic mindset shift from “gas station” to “retailer” across all geographies
• Expansion of in-store offerings to increase sales and improve profitability
• Focus on simple, convenient and safe customer experience throughout buying cycle (at the pump, in the store, on the app)
• Increasing sophistication on consumer loyalty insights and data analytics
• Move to cloud-hosted applications vs. on premise hardware to lower cost and improve access
Complexity of integrating fueling operations with diverse
mix of in-store offerings plays to GVR’s strengths
USA In-store Sales at C-Stores ($bn)
Source: 2020 National Association of Convenience Stores (NACS)
$0
$50
$100
$150
$200
$250
20
02
20
03
20
04
20
05
20
06
20
07
20
08
20
09
20
10
20
11
20
12
20
13
20
14
20
15
20
16
20
17
20
18
20
19
In-Store sales showing
resilience: Sales +5% YoY
since May 2020

Case Study: Expanding Share-of-Wallet with Retail Solutions
Breadth of Portfolio Provides Continued Expansion Opportunities 39
Multiple Avenues for
ADDITIONAL ADD-ONS
Additional Sales at
~2X ORIGINAL
PURCHASE
RECURRING SALES
from Software &
Maintenance
• Customer needed integrated suite of solutions that spanned POS solutions to dispensers
• Converting the customer from competitor’s offering
The Challenge
• Converted dispensers from competitor
• Upgraded point-of-sale software
• Added on-counter promotion capabilities and self-checkout solutions
• Identified future roadmap of solutions
The Solution The Impact
Passport
POS
Passport
Impulse
GVR
Dispensers
Passport
Express Lane
Grow Digital
Solutions

Fueling Station Demand
229
100
3324
14
Fueling Stations per Population(Europe = 100)
HGMs Driven by Infrastructure Build-Out and Site Modernization
GVR Positioned to Bring Broad Set of Technology Solutions to HGMs 40
Expand High Growth
Markets
Europe
MEAIndiaChina
Gas Kiosk Modern C-Store
Technology Upgrades
Doubling station count
over next 5 years
Investment in technology driven by need to improve productivity,
enhance security, and ensure environmental compliance
US
Source: Management estimates on # of fueling stations. On population, US Census Bureau

The Internal Combustion Engine (“ICE”) Leads the Car Parc
ICE Drives Strong Demand Beyond the Horizon 41
Source: BloombergNEF 2020 Outlook
Global Passenger Vehicle Market
• Global car parc continues to increase
• Fleet age rising
• EVs represent <1% of car parc in 2020
• ICE expected to be >90% of the global car
parc through 2030
Battery
electric
Plug-in
hybrid
Fuel cell
Internal
combustion
Billion
1.8
1.6
1.4
1.2
1.0
0.8
0.6
0.4
0.2
0.0
2015 2020 2025 2030 2035 2040

GVR’s Opportunity Set and Early-Stage Investments in EV Charging
Important First Steps in Rapidly Evolving E-Mobility Market 42
Expand E-Mobility
Solutions
• A global leader in DC fast charging
solutions
• ~2,700 high speed chargers deployed
across 30 countries
• Leading position in Europe
• Facilities in Australia, the Netherlands
and the U.S.
• GVR made minority investment in
October 2018
• Option to buy company in 2021
• Leading provider of EV charging network
management software
• Agnostic to charging hardware platform
• Global customer base spanning Europe,
North America and Asia
• Over 400,000 drivers using the platform
• Frost & Sullivan innovation award winner
• GVR made minority investment in
February 2020
Opportunity
Overview
• EV charging market is a highly attractive space for long-term growth
• Demand from GVR’s core customers will increase as EV utilization accelerates
• GVR is well-positioned to integrate EV solutions with the customers’ current fueling and retail systems
• Building out the GVR solution stack with M&A focused on market leading technologies

Summary of GVR
43
#1 global provider of technology solutions for mobility infrastructure
Track record of organic growth, disciplined M&A, and margin expansion
Continued tailwinds from substantial car parc and regulatory drivers
Large runway of improvement opportunities; Longer-term growth from HGMs and
software solutions
Transformative growth opportunity with strategic focus on e-mobility

Teletrac Navman

Teletrac Navman Overview
Leading Telematics Provider Well-Positioned in Attractive Markets 45
• Leading software-as-a-service (SaaS) telematics provider that leverages location-based technology and services for managing mobile assets
• Resulted from the acquisitions of Navman Wireless in 2012 and Teletrac in 2013
• Solutions include fleet management, equipment utilization tracking, electronic logging devices, and vehicle tracking which increase safety and efficiency
• Tracks and manages more than 480,000 vehicles and assets for more than 40,000 companies around the world
• Operates globally with presence in the U.S., Europe, Mexico / Latin America, and Australia / New Zealand; headquartered in Garden Grove, CA
• Elevated churn drove net subscriber decline in 2019
Key Growth Initiatives
Reposition U.S.
BusinessBuild Upon
Success in ANZ
Capture
Transition to AI
Telematics
Expansive product portfolio with offerings
across all price points and fleet types
Advanced feature functionality, including
analytics, diagnostics, and safety
The only authorized telematics provider with
federal security certification (FEDRAMP)
Differentiated platform with real-time sensor
data and AI based analytics (TN360)
Overview Strategic Advantages

Go Forward Strategy for Teletrac Navman
Strengthened Management Team, Encouraged by Progress & Outlook 46
Recent Business Challenges What Are We Changing?
Launched the first AI-based platform
Established leading customer service
Fixed software and hardware problems
Impact
Operational &
Software Issues
Aging
U.S. Platform
Stabilizing
Churn
Launched TN360
In 3Q20

Case Study: TN360 New Technology Platform
Expanding upon Acquired Technology to Drive Business Inflection 47
Complex Challenges
• First AI-powered platform that delivers real-time telematics
• Designed to tell you what you don’t know. Connect. Collect. Analyze. Predict
• Realtime analytics uncovers trends via natural search, drillable data, and dynamic dashboards
The Solution The Impact
>2xSales of upsell modules
and accessories
+30%Average Revenue Per Unit
+50% of Sales Growth
from New Customers
+75% Contract Margin

Summary of Teletrac Navman
48
Launched TN360 – a new AI-based, differentiated technology platform
Multi-geography telematics leader with over 480,000 subscribed unitsa
Fixed hardware, software, and customer service issues
Increasing demand for digitization, automation and freight visibility provides continued
runway for growth
New management team on track for business turnaround

Global Traffic Technologies

Global Traffic Technologies Overview
Leading Platform Levered to Smart City and Urbanization Trends 50
• Manufacturer of priority control systems delivering safe and reliable traffic solutions for emergency response and transit agencies for over 50 years
• Market leader in intelligent traffic management systems
• Smart solutions tailored for bus, rail, and public safety agencies
• Installed base of over 90,000 intersections for 3,100+ customers
• Headquartered in St. Paul, MN
• GTT was Fortive’s first acquisition, completed in 2016
Key Growth Initiatives
Enhance
Technology
Leadership
Grow “As a
Service”
Business
Expand into
New Smart City
Verticals
Trusted brand with large installed base and
entrenched relationships
Unique combination of best-in-class
algorithms and application expertise
Growing subscription business, reduces
customer’s upfront investment and broadens
target customer base
Collaborative solution development with key
customers
Overview Strategic Advantages

Smart Cities is a Compelling Market Opportunity
• At intersection sensing and AI for more efficient traffic flow
• Dual use to public safety applications
• Overlap with GTT customer base
• Metering and electric charging for on-street and off-street parking
• SaaS-based management and enforcement platforms
• Overlap with GTT customer base
• Integrated systems & service for electronic toll collection
• Congestion tolling to reduce traffic during peak transit hours provides munis with revenue generating solutions
Collaboration and Technology Leadership Earn us a Powerful Right to Play 51
Traffic Management
Parking
Electronic Toll
Collection
.1 Based on 2019 industry sales and management estimates
Size1
$3bn
$1bn
$4bn

Q&A
52

IV. Diagnostics & Repair Technologies

Diagnostics & Repair Technologies
Sticky Business with Strong Brand Loyalty, Levered to U.S. Market &
Benefiting from Increasing Vehicle Complexity and Technician Shortages54
1 Based on 2019 industry sales and management estimates2 Based on the compound annual growth rates of large industry companies
Automotive Repair Tools, Storage, & Diagnostics Tire Changers, Wheel Balancers & Weights, & Brake Lathes
Leading Manufacturer and Distributor
of Vehicle Repair Tools & Diagnostic
Equipment through ~1,800 Franchisees
One of the World’s Leading
Manufacturers of Aftermarket
Wheel-Service Equipment
Key Financials
~$0.6bn
2019 Sales
~$7bn
Market Size1
LSD
Estimated
Market Growth2
Matco Overview
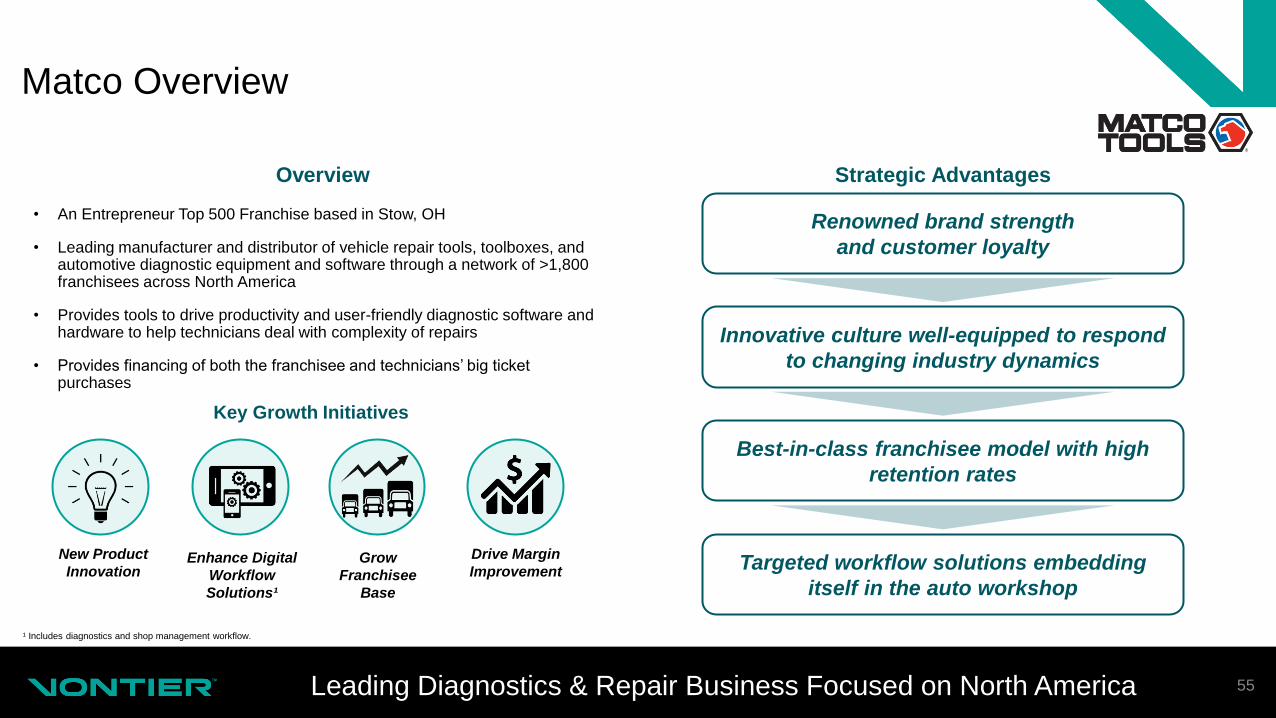
Leading Diagnostics & Repair Business Focused on North America 55
• An Entrepreneur Top 500 Franchise based in Stow, OH
• Leading manufacturer and distributor of vehicle repair tools, toolboxes, and automotive diagnostic equipment and software through a network of >1,800 franchisees across North America
• Provides tools to drive productivity and user-friendly diagnostic software and hardware to help technicians deal with complexity of repairs
• Provides financing of both the franchisee and technicians’ big ticket purchases
Key Growth Initiatives
New Product
InnovationEnhance Digital
Workflow
Solutions¹
Grow
Franchisee
Base
Drive Margin
Improvement
¹ Includes diagnostics and shop management workflow.
Renowned brand strength
and customer loyalty
Innovative culture well-equipped to respond
to changing industry dynamics
Targeted workflow solutions embedding
itself in the auto workshop
Best-in-class franchisee model with high
retention rates
Overview Strategic Advantages
Broad Product Offering with Loyal Customer Base
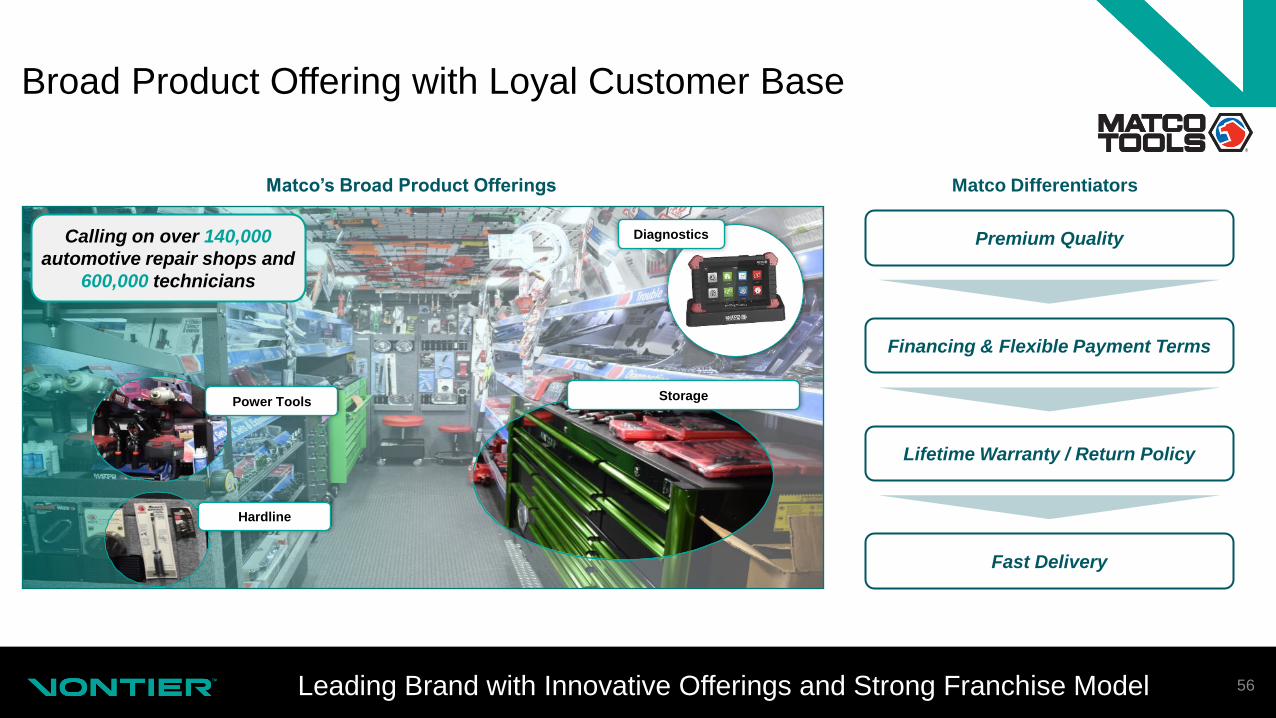
Leading Brand with Innovative Offerings and Strong Franchise Model 56
Matco’s Broad Product Offerings Matco Differentiators
Premium Quality
Financing & Flexible Payment Terms
Lifetime Warranty / Return Policy
Fast Delivery
Hardline
Power Tools
DiagnosticsCalling on over 140,000
automotive repair shops and
600,000 technicians
Storage

Matco is Positioned to Generate Steady Organic Growth
Key Growth Initiatives Focused on Consistent and Stable Growth 57
New Product
Innovation
• Continued innovation to address complex customer needs
• Seek to grow new product sales as a percent of total Matco sales
Enhance Digital
Workflow Solutions
• Matco Tools App to deliver the convenience of online commerce to franchisees
• Increasing need for advanced diagnostic solutions to compensate for aging base of experienced technicians
Grow
Franchisee Base
• Target select attractive geographic areas for franchisee base expansion
• Continue capitalizing on digital recruiting strategy
Drive Margin
Improvement
• Shift product mix towards software and service-based offerings
• Continue to improve productivity through VBS

• Matco exclusive patented tip design
• Dramatically improves cutting speed
• Growing line of easy-to-use cordless
products
• More to come over next 12 months
• Replaces decades old product with
patented design
• Significantly easier use and greater
functionality
Accelerating Innovation in Traditional Tool Categories
Innovation has Driven Steady Increases in Product Vitality 58
Ball Joint Press
New Product
Innovation
Hyper-Step Drill Bits
AC Recyclers
20 Volt Brushless Impact Wrenches
• Touch screen interface
• Remote access via Wi-Fi and an extensive
service network
Development of Matco Tools App
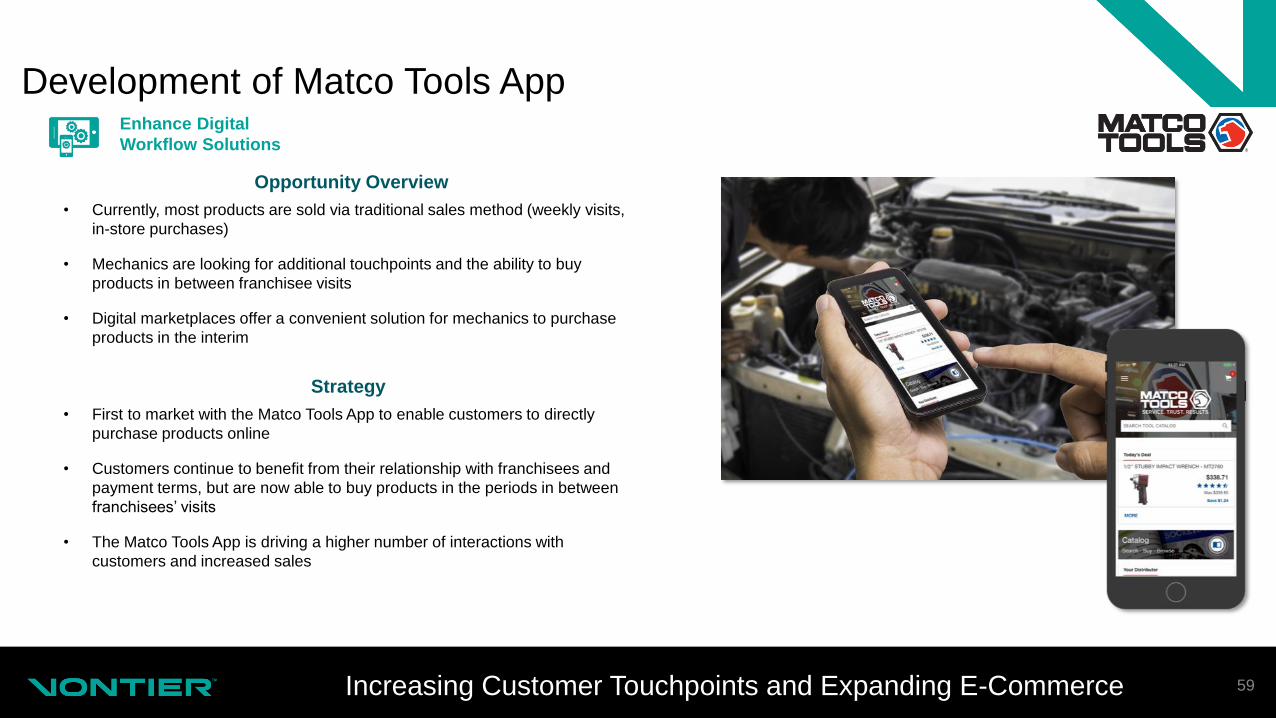
Increasing Customer Touchpoints and Expanding E-Commerce 59
Opportunity Overview
Strategy
• Currently, most products are sold via traditional sales method (weekly visits,
in-store purchases)
• Mechanics are looking for additional touchpoints and the ability to buy
products in between franchisee visits
• Digital marketplaces offer a convenient solution for mechanics to purchase
products in the interim
Enhance Digital
Workflow Solutions
• First to market with the Matco Tools App to enable customers to directly
purchase products online
• Customers continue to benefit from their relationship with franchisees and
payment terms, but are now able to buy products in the periods in between
franchisees’ visits
• The Matco Tools App is driving a higher number of interactions with
customers and increased sales

Responding to Vehicle Diagnostics & Repair Dynamics
Diagnostic Sales are Expected to Increase Double Digits 60
Opportunity Overview What We Are Doing
• Today’s cars feature 100mm lines of code which is expected to grow to
between 200mm and 300mm lines
• Most repairs require the use of a diagnostic scan tool to interface with
the vehicle engine control module
• The decline of the experienced technician population and increasing
vehicle complexity enhances need for user-friendly diagnostic
solutions for a less experienced technician base
Enhance Digital
Workflow Solutions
• Designing a broader set of user-friendly solutions to
complete repairs more efficiently & raise productivity
• Providing diagnostic options at affordable price points
based on experience and skill set
• Providing diagnostic tools that are easily integrated into
the repair shop workflows
Full-featured
Diagnostics
Diagnostics for Heavy
Duty Vehicles
Detailed Repair
Database

Expanding into Digital Workflows Via Key Partnerships
Opportunity to Grow Addressable Market and Expand Margin Profile 61
Independent Mechanic Digital Workflow Opportunity
Enhance Digital
Workflow Solutions
• Independent mechanics are struggling with repair
workflow given technician shortage and increasing
vehicle complexity
• Today’s systems are typically disjointed with limited
integration
• Current workflow contains a mix of mature and
emerging spaces
• Potential to create a platform focused on a universal
automotive repair workflow
Shop
Management
Software
System of record for
all shop operational
activity (work orders,
labor mgmt,
inventory, etc.)
Diagnostics /
Remote
Diagnostics
Repair Info
Connected
Equipment
Parts
Procurement
Customer
Relationship
Mgmt / ERP
Expansion OpportunityCurrent Offering

Franchisee Base Growth Over Time
Significant Opportunity for Continued Franchisee Base Growth 62
Franchisees Over TimeSteady year over year growth
in franchises over time
On average, increase of ~50 franchisees annually from 2012 to 2019
Grow Franchisee
Base
Franchisee referrals of new franchisees
are a mark of a quality system
Capitalizing on digital recruiting strategy
to drive franchise growth
>30% open territories in North America
2010 – 2019
CAGR: 2.5%
1,463 1,467 1,455
1,478
1,580
1,688
1,758
1,793 1,779
1,834
2010 2011 2012 2013 2014 2015 2016 2017 2018 2019
Territory Support Specialist
Franchisee Continuation
Training
Revised Ride/Review Processes
Remote Presentation
Method
Field Segmentation Implemented
FranchiseeWatchlist Process
TerritoryManagement
Updated Franchisee
Training
MMP Custom Mapping Program

Case Study: Driving Continued Margin Expansion in Mature Business
Leveraging Pervasive VBS Tools and Culture Drove ~100bps of OMX 63
• Tariffs creating cost pressures
• Slower growth due to technician shortage
• Price transparency due to e-retailers
The Challenge
• Total Process Improvement deployed in warranty screening process to drive out waste
• APD helping to drive product mix to higher margin opportunities
• Deployed Standard Work for the supply chain to manage supplier attempts at price increases
The Solution The Impact
Drive Margin
Improvement
+40bpsOverall Standard Margin
Expansion Across Product
Lines
+20 bps Margin Expansion
Negotiated with Suppliers
Despite Tariffs
+38 bpsMargin Expansion from
Warranty Reductions

Hennessy Overview
Portfolio of Strong Brands with Defined Plan for Profitable Growth 64
• With facilities in the U.S. and Canada, Hennessy Industries is
one of the world’s foremost manufacturers of aftermarket wheel-
service equipment
• Designs, builds and markets equipment, accessories, and
consumables under its four brand names
• ~100 service technicians covering >70% of key account outlets
• Headquartered in LaVergne, TN
Key Growth Initiatives
Scaling
Geographically
Entry into
New Product Categories
Grow Service
Offering
Trusted brand with customer loyalty
Growing service offerings to capitalize on
key trends
VBS provides necessary tools for innovation
Overview Strategic Advantages
Summary of Diagnostics & Repair Technologies
65
Businesses with leading brands and significant opportunities for growth
Predictable growth at attractive margins, with strong free cash flow generation
Large runway to drive growth in vehicle diagnostics and digital workflows
Loyal base of franchisees, with room to add
Increasing vehicle complexity supports increased product demand

V. Financial Overview

Vontier Financial Highlights
Strong Financial Profile Positioned for Growth and M&A 67
GDP+ Revenue Growth Bolstered Through M&A | 2017 – 2019 sales CAGR of 5.3%; sales growth of ~4.5%
estimated for 3Q20
Substantial Scale with Resiliency Through the Cycle | $2.8bn of sales and $556mm of Adjusted Normalized
Operating Profit in FY 2019
Strong Margins with Track Record of Expansion | 43% Gross Margin and 20% Adjusted Normalized Operating
Margin in LTM Jun20
Strong Balance Sheet With Ample Flexibility | Anticipate ~$1.5bn of M&A capacity over the next 2 - 3 yrs.;
Investment Grade Style capital structure with target leverage ratio < 3.0x
Robust Free Cash Flow Generation | ~$500mm of LTM Jun20 Adjusted Normalized Free Cash Flow &
137% Adjusted Normalized FCF Conversion
Note: Adjusted Normalized Operating Profit, Adjusted Normalized Operating Margin, Free Cash Flow, Adjusted Normalized Free Cash Flow and Adjusted Normalized FCF Conversion are non-GAAP financial metrics. For a reconciliation to the most comparable GAAP metrics, see Appendix.

Strong Execution During the COVID-19 Pandemic
VBS and Cost Actions Position us for Recovery 68
Implemented safety protocols to ensure continued production
of essential goods and services
Redirected supply chain where necessary to ensure
continued operations
Rapidly adjusted working capital to align with operating levels
preserving Free Cash Flow
Managed credit underwriting dynamically with rapidly
evolving environment
Adjusted key customer-facing activities to virtual formats
Operating Company Select Actions Taken By Vontier
• Miles driven has recovered to 80%+ of pre-COVID-19 levels globally
• Recovery rates vary by region
• EMV continues to drive demand in North America
• Was most dramatically impacted by shelter-in-place restrictions with V-shaped recovery as restrictions eased
• Saw sequential recovery during 2Q20 from April lows, continuing into 3Q20
• SaaS recurring revenue business saw less impact to results
• Continued similar demand trends
• Some small account churn
✓
✓
✓
✓
✓
Note: Free Cash Flow is a non-GAAP financial metric. For a reconciliation to the most comparable GAAP metric, see Appendix.
Source: Bloomberg and management estimates

3Q Performance Commentary
Strong Performance Reflects Resilient Portfolio 69
Regional
North America
• EMV demand remains strong, with large customers continuing to drive adoption
• Matco demonstrated a sharp recovery following easing of COVID-19 related restrictions
HGM
• COVID-19 impacts were more dramatic, particularly in India and China
• Seeing sequential recovery, but will remain lumpy, particularly where we have tender driven activity
• Security and environmental remain good long-term regulatory drivers
Europe
• Good sequential recovery through 3Q20 as various jurisdictions reopened
• Miles driven approaching pre-COVID-19 levels
• Seeing some reduced capital spend at vertically integrated multi-national oil companies
Operating Company
GVR
• Increased outlook reflects continued strong demand from EMV adoption and regulatory tailwinds in Mexico
• Expect MSD growth
Matco
• Increased outlook reflects continued sequential improvement driven by successful August sales meeting and new product introductions
• Technician employment environment has held up well
• Expect a return to growth
Teletrac Navman
• Launched new AI-based platform, TN360, and receiving very favorable customer reviews
• Seeing moderation in churn
Expect 3Q20 sales growth of ~4.5%

Strong Historical Financial Performance
Demonstrated Growth and Margin Expansion 70
Summary Financials Management Commentary
Net Sales
• Mobility Technologies sales grew at HSD rate from 2017 – 2019
• Diagnostics & Repair Technologies sales grew at LSD rate from 2017 – 2019
Gross
Margin
• Stable history of strong gross margin profile
• Price and procurement actions effectively offset RM inflation
Adjusted
Normalized
Operating
Profit
• SG&A and R&D have remained relatively constant as a % of sales
• Adjusted Normalized Operating Profit has been adjusted for estimated standalone public company costs
Adjusted
Normalized
Free Cash
Flow
• VBS drives strong free cash flow generation
• Increasing conversion percentages
• 2017 /2018 reflecting Orpakacquisition and growth capex (‘17) and system conversion (‘18)
Note: Adjusted Normalized Operating Profit, Adjusted Normalized Operating Margin, Adjusted Normalized Net Earnings, Adjusted Normalized Net Earnings Margin, Adjusted Normalized Free Cash Flow and Adjusted Normalized Free Cash Flow Conversion
are non-GAAP financial metrics. For a reconciliation to the most comparable GAAP metrics, see Appendix.
($US in millions) 2017 2018 2019
'17 – ‘19
CAGR
LTM
Jun20 1H20
Net Sales $ 2,498 $ 2,666 $ 2,772 5.3 % $ 2,601 $ 1,143
YoY Growth (%) 4.6 % 6.7 % 4.0 % (4.2) % (13.0) %
Gross Profit $ 1,073 $ 1,135 $ 1,191 5.4 % $ 1,128 $ 494
Gross Margin (%) 42.9 % 42.6 % 43.0 % 43.4 % 43.2 %
Adjusted Normalized Operating
Profit$ 481 $ 487 $ 556 7.5 % $ 516 $ 198
Adjusted Normalized Operating
Margin (%)19.3 % 18.3 % 20.1 % 19.8 % 17.3 %
Adjusted Normalized Net Earnings $ 310 $ 340 $ 396 13.0 % $ 364 $ 136
Adjusted Normalized Net Earnings
Margin (%)12.4 % 12.8 % 14.3 % 14.0 % 11.9 %
Adjusted Normalized Free Cash
Flow$ 207 $ 291 $ 423 43.0 % $ 500 $ 192
Adjusted Normalized Free Cash Flow
Conversion (%)66.8 % 85.6 % 106.8 % 137.4 % 141.2 %
Double-Digit Adj. Normalized Net Earnings Growth 2017 – 2019 CAGR

Strong Balance Sheet to Support M&A
Flexible Balance Sheet to Drive Growth through M&A 71
($US in millions) At Close
$750mm revolving credit facility $0
Total Debt $1,800
Cash $200
Net Debt $1,600
Debt / LTM Q2 Adjusted EBITDA 3.0x
Net Debt / LTM Q2 Adjusted
EBITDA2.7x
✓
✓
✓
~$1.5bn of M&A Capacity over the
next 2–3 years
$950mm of Total Liquidity
Investment Grade Style Balance Sheet
Balance Sheet Overview1 Capital Structure Highlights
Note: Adjusted EBITDA is a non-GAAP financial metric. For a reconciliation to the most comparable GAAP metrics, see Appendix.
¹ VNT entered into the Credit Facilities on September 29, 2020 but did not draw down on the revolving credit facility at the closing.

FY 2020 Outlook
VBS and Cost Actions Position us Well in Challenging Macro 72
Revenue
Anticipating FY 2020 Core Revenue decline of (LSD) based on current COVID-19 environment
• Expected growth of ~4.5% in 3Q20 assumes a strong recovery driven by strength in GVR and Matco
• EMV expected to support strong growth in 2020, with 70%+ penetration of our customer base by end
of year (EOY)
• If EOY penetration is stronger than expected, then 2020 could be peak year for EMV
demand…which could potentially lead to a decline in EMV sales of (~$150mm to $200mm) the
following year, as the EMV supercycle rolls off
• We will provide key updates when we report 4Q20, after the seasonally important quarter for
retailer capex decisions, and after the liability shift in April 2021
Adjusted Normalized
Operating Profit
Anticipating FY 2020 Adjusted Normalized Operating Margin expansion and dollar growth, despite
YOY lower demand
• Leveraging VBS and our improvement culture to dynamically allocate resources and maximize fall-
through
• Continuing to invest in strategic growth priorities to emerge from a position of strength
Adjusted Normalized
Free Cash Flow
Adjusted Normalized Free Cash Flow conversion anticipated to be >100% (Adj Normalized Net
Earnings) for FY 2020

Value Creation Flywheel
Deploying Proven Model for Earnings Growth 73
Core Revenue
GrowthGDP+
Growth
Through M&A>100% FCF conversion
Margin Expansion25-50 bps core OMX
Investment Grade
Style Balance Sheet
to Fund Growth
Note: Represents general target measures

VI. Closing Comments

Priorities to Unleash Earnings Growth Potential
Runway of Opportunities to Grow Profits 75
Profitable Organic Growth Initiatives
Increase Profitability Through VBS
• VBS -- focus and simplification to drive operating margin expansion
• Better traction in retailing solutions capitalizing on HGM’s and other regulatory drivers
• New product introductions focused on next-gen solutions
• Continued share gains through franchisee growth and product extensions in Diagnostics & Repair Technologies
• Teletrac Navman return to growth
M&A to Accelerate Core Growth Strategy
~$1.5bn of Balance Sheet Flex Over Next 2-3 Years
• Fragmented, growth markets with near in adjacencies
• Market led strategy process with profitable growth segmentation
• Disciplined M&A process based on market assessments
• Operating company involvement in building pipeline and cultivation of attractive companies
• Acquisitions to accelerate core strategy

Vontier | A Compelling Investment Opportunity
Well-Positioned for Substantial Growth to Drive Long-Term Shareholder Value 76
Industrial technology leader with outstanding brands and strong installed base levered to attractive $27bn mobility market
Strong performance and limited cyclicality, supported by recurring sales
Robust free cash flow generation and investment grade style balance sheet to fund M&A
Runway of opportunities to drive profitable growth
Experienced and proven leadership team with track record of driving substantial growth
and strategic portfolio transformation
Vontier Business System is a cornerstone of culture and competitive advantage

Q&A
77

AppendixAdditional Financial Detail

Reconciliation of Vontier Non-GAAP Figures
79
Reconciliation of Operating Profit Adjusted Operating Profit to Adjusted
Normalized Operating Profit and Margin
2017 2018 2019 LTM Jun 2020 1H 2020
Reported Operating Profit $ 501 $ 500 $ 563 $ 430 $ 112
Amortization 25 31 32 30 14
Accruals from significant legal matters (3) - - - -
Restructuring costs and asset
impairments6 3 6 92 85
Adjusted Operating Profit (Non-
GAAP)$ 529 $ 534 $ 601 $ 552 $ 211
Normalization and other adjustments¹ (48) (47) (45) (36) (13)
Adjusted Normalized Operating Profit
(Non-GAAP)$ 481 $ 487 $ 556 $ 516 $ 198
Net sales 2,498 2,666 2,772 2,601 1,143
Adjusted Normalized Operating Profit
Margin (Adj. Normalized Operating
Profit / Net Sales) (Non-GAAP)
19.3 % 18.3 % 20.1 % 19.8 % 17.3 %
Reconciliation of Cash Flow from Operations Free Cash Flow to Adjusted
Free Cash Flow to Adjusted Normalized Free Cash Flow and Conversion
2017 2018 2019 LTM Jun 2020 1H 2020
Total Revenue Growth (GAAP) 4.6 % 6.7 % 4.0 % (4.2) % (13.0) %
Core / Existing businesses (Non-GAAP) 2.1 % 4.2 % 5.6 % (2.1) % (10.3) %
Acquisitions and divestitures (Non-GAAP) 2.1 % 2.7 % 0.5 % (0.1) % (0.3) %
Currency Exchange Rates and Other (Non-
GAAP)0.4 % (0.2) % (2.1) % (2.0) % (2.4) %
Reconciliation of Core Revenue Growth
1 Adjusted for standalone public company costs.
2017 2018 2019 LTM Jun 2020 1H 2020
Reported Net Cash
Provided by Operating
Activities
$ 364 $ 421 $ 545 $ 607 $ 235
Payments for additions to
property, plant & equipment
(capital expenditure)
(68) (42) (38) (36) (14)
Free Cash Flow (Non-
GAAP)$ 296 $ 379 $ 507 $ 571 $ 221
Pro-forma interest expense
on debt, net of interest
income
(47) (47) (44) (41) (19)
Adjusted Free Cash Flow
(Non-GAAP)$ 249 $ 332 $ 463 $ 530 $ 202
Normalization and other
adjustments¹(42) (41) (40) (30) (10)
Adjusted Normalized Free
Cash Flow (Non-GAAP)$ 207 $ 291 $ 423 $ 500 $ 192
Adjusted Normalized Net
Earnings (Non-GAAP)310 340 396 364 136
Adjusted Normalized FCF
Conversion (Adj.
Normalized FCF / Adj.
Normalized Net Earnings)
(Non-GAAP)
66.8 % 85.6 % 106.8 % 137.4 % 141.2 %

Reconciliation of Vontier Non-GAAP Figures
80
Reconciliation of Net Earnings to Adjusted Net Earnings to Adjusted
Normalized Net Earnings and Margin
2017 2018 2019
LTM Jun
2020 1H 2020
Reported Net Earnings $ 373 $ 385 $ 437 $ 311 $ 64
Amortization 25 31 32 30 14
Accruals from significant legal matters (3) - - - -
Restructuring costs and asset
impairments6 3 6 92 85
Loss (gain) from acquisition and
divestiture(15) - - - -
Pro-forma interest expense on debt, net of
interest income(47) (47) (44) (41) (19)
Earnings attributable to NCI (1) 1 (2) (1) 1
Tax adjustment to Non-GAAP
adjustments28 3 2 1 1
Adjusted Net Earnings (Non-GAAP) $ 346 $ 376 $ 431 $ 392 $ 146
Normalization and other adjustments¹ (48) (47) (45) (36) (13)
Tax adjustment to normalization
adjustment212 11 10 8 3
Adjusted Normalized Net Earnings (Non-
GAAP)$ 310 $ 340 $ 396 $ 364 $ 136
Net sales 2,498 2,666 2,772 2,601 1,143
Adjusted Normalized Net Earnings
Margin (Adj. Normalized Net Earnings /
Net Sales) (Non-GAAP)
12.4 % 12.8 % 14.3 % 14.0 % 11.9 %
1 Adjusted for standalone public company costs. 2 Tax adjustment calculated using an estimated effective rate for each respective period. The goodwill impairment charge is not tax deductible and therefore the tax effect of the adjustments includes only the other adjustments noted.
2017 2018 2019
LTM Jun
2020 1H 2020
Reported Net Earnings $ 373 $ 385 $ 437 $ 311 $ 64
Interest (income) expense, net (8) (9) (3) (1) 1
Income Taxes 151 121 129 118 47
Depreciation 41 56 53 52 24
Amortization 25 31 32 30 14
EBITDA (Non-GAAP) $ 582 $ 584 $ 648 $ 510 $ 150
Accruals from significant legal matters (3) - - - -
Restructuring costs and asset impairments 6 3 6 92 85
Loss (gain) from acquisition and divestiture (15) - - - -
Earnings attributable to NCI (1) 1 (2) (1) 1
Adjusted EBITDA (Non-GAAP) $ 569 $ 588 $ 652 $ 601 $ 236
Normalization and other adjustments¹ (48) (47) (45) (36) (13)
Adjusted Normalized EBITDA (Non-GAAP) $ 521 $ 541 $ 607 $ 565 $ 223
Net sales 2,498 2,666 2,772 2,601 1,143
Adjusted Normalized EBITDA Margin (Adj.
Normalized EBITDA/ Net Sales) (Non-
GAAP)
20.9 % 20.3 % 21.9 % 21.7 % 19.5 %
Reconciliation of Net Earnings to EBITDA to Adjusted EBITDA to Normalized
Adjusted EBITDA and Margin

Supplemental Financials
81
https://investors.vontier.com/files/doc_downloads/2020/10/Supplemental-
Financials-Final.pdf


