38
9641 Irvine Center Drive Irvine CA 92618 Kayugasolution.com City of Chula Vista Roadway Asset Management Plan 2016

9 6 4 1 I r v i n e C e n t e r D r i v e I r v i n e C A 9 2 6 1 8 K a y u g a s o l u t i o n . c o m
City of Chula Vista
Roadway Asset Management Plan
2016
Table of Contents
1 Introduction .......................................................................................................................................................... 1
1.1 Asset Management Program Goal ............................................................................................................... 1
1.2 Asset Management Program Methodology ................................................................................................. 2
1.3 Asset Management Definition ..................................................................................................................... 3
1.4 Asset Management Plan .............................................................................................................................. 3
2 Asset Register ....................................................................................................................................................... 4
2.1 Asset Definition ............................................................................................................................................ 4
2.2 Asset Hierarchy ............................................................................................................................................ 5
2.3 Asset Class .................................................................................................................................................... 5
2.4 Asset Inventory ............................................................................................................................................ 6
2.5 Installation and Consumption Profiles ......................................................................................................... 7
2.6 Replacement Cost ........................................................................................................................................ 8
2.7 Condition Assessment .................................................................................................................................. 9
3 Risk Analysis ........................................................................................................................................................ 15
3.1 Probability of Failure .................................................................................................................................. 15
3.2 Consequence of Failure .............................................................................................................................. 17
3.3 Risk ............................................................................................................................................................. 23
4 Life Cycle Cost Analysis ....................................................................................................................................... 24
4.1 Immediate Needs ....................................................................................................................................... 24
4.2 Life Cycle Cost Logic ................................................................................................................................... 24
4.3 Preservation and Restoration Profile ......................................................................................................... 25
5 Confidence Level ................................................................................................................................................. 31
5.1 Next Steps .................................................................................................................................................. 33
6 Appendix A .......................................................................................................................................................... 34
Figures Figure 2-1 Roadway Asset Hierarchy ............................................................................................................................. 5
Figure 2-2 Roadway Installation Profile ......................................................................................................................... 7
Figure 2-3 Roadway Consumption Profile ..................................................................................................................... 7
Figure 2-4 Roadway Asset Valuation ............................................................................................................................. 8
Figure 2-5 Roadway Field Inspection Data .................................................................................................................... 9
Figure 2-6 Roadway Condition Assessment Samples .................................................................................................. 11
Figure 2-7 ADA Compliance Criteria for Pedestrian Ramp .......................................................................................... 12
Figure 2-8 ADA Compliance Result .............................................................................................................................. 13
Figure 2-9 Sidewalk Condition Assessment ................................................................................................................. 14
Figure 3-1 CoF Rating based on Asset Class ................................................................................................................. 18
Figure 3-2 CoF Map of Traffic Signs ............................................................................................................................. 21
Figure 3-3 Roadway System Risk Matrix ...................................................................................................................... 23
Figure 4-1 Roadway Preservation and Restoration Profile .......................................................................................... 25
Figure 4-2 10-Year Preservation and Restoration Profile ............................................................................................ 26
Figure 4-3 20-Year Preservation and Restoration Profile ............................................................................................ 26
Figure 4-4 30-Year Preservation and Restoration Profile ............................................................................................ 27
Figure 4-5 Roadway Restoration Profile ...................................................................................................................... 29
Figure 4-6 Roadway Preservation Profile .................................................................................................................... 30
Tables
Table 2-1 Roadway Asset Inventory .............................................................................................................................. 6
Table 2-2 Roadway System Inspected Assets .............................................................................................................. 10
Table 2-3 Cost to Bring to ADA Compliance ................................................................................................................ 13
Table 3-1 Roadway PoF Level Distribution .................................................................................................................. 16
Table 3-2 Social, Community, and Organizational CoF Component ............................................................................ 17
Table 3-3 Economic CoF Component ........................................................................................................................... 17
Table 3-4 CoF Score Adjustment Based on Street Class .............................................................................................. 19
Table 3-5 CoF Score Adjustment Based on Signage Types .......................................................................................... 20
Table 3-6 CoF Score Adjustment Based on Parking Lot Asset Classes ......................................................................... 22
Table 4-1 Immediate Needs ......................................................................................................................................... 24
Table 4-2 Average Annual Preservation and Restoration Needs ................................................................................. 28
Table 5-1 Confidence Level Logic ................................................................................................................................. 31
Table 5-2 Roadway Confidence Level .......................................................................................................................... 32
1
1 Introduction
The City of Chula Vista (City) is currently enhancing its asset management practices to promote effective use of
financial and physical resources and to develop a proactive approach to managing its infrastructure assets. As part
of this effort, the City embarked on developing a comprehensive, citywide Asset Management Program (AM Program)
that includes the following asset management systems:
Wastewater Management System
Urban Forestry Management System
Building Management System
Drainage Management System
Parks Management System
Roadway Management System
Fleet Management System
The AM Program began with the Wastewater Management System as the pilot asset management program. The
Wastewater Management System helped to educate the City staff on asset management processes and practices
and acted as a template for other asset management systems. The Wastewater Management System demonstrated
the benefits of asset management, and the City decided to expand its asset management improvement efforts to its
other systems, listed above.
In addition to the above asset management systems, the City plans to include the following asset management
systems to develop a comprehensive citywide asset management program:
Fleet Management System
Open Space Management System
General Government Management System
This document, Roadway Asset Management Plan, will only focus on the roadway assets.
The City owns and manages roadway assets such as bridges, curbs and gutters, driveway approaches, guardrails,
medians, parking lots, parking meters, parkways, pavement striping and marking, pedestrian ramps, sidewalks,
street lights, traffic signs, and traffic signal systems. This City manages its pavement separately under the pavement
management system, so pavement will not be included in this report.
1.1 Asset Management Program Goal
The goal of the City’s AM Program was to shift from reactive to proactive planning and management of its
infrastructure assets. Specifically, the City wanted to do the following:
Gain better understanding of the current state of the infrastructure and its future needs
Proactively identify the asset replacement and rehabilitation needs and plan the budget and resources
accordingly
Understand the probability and consequence of failure of each asset so that the City can manage high risk
assets before failure and minimize the City’s overall risk profile
Minimize the life cycle cost by incorporating latest technological advances in infrastructure to develop
efficient and effective preservation and restoration strategies
Develop a consistent and defendable methodology for prioritizing work and budget expenditure

2
Focus on high benefit-to-cost ratio to ensure the budget is spent in the right place, for the right reason, at
the right time, at the right cost
Be transparent by involving the Council and the Public in the development of the asset management
program and the associated decisions
In essence, the City wanted to gain better understanding of the current and future asset needs, asset risk profile,
appropriate levels of service, cost to provide services, and financial requirements to sustain the delivery of services.
The City then wanted to communicate this improved understanding of the infrastructure status with the public and
the decision makers. Together, the City wanted to develop management strategies that deliver the established levels
of service while managing individual assets to minimize life cycle cost with an acceptable level of risk.
Key objectives of the City’s AM Program were to identify answers for each asset management system to the following
questions:
Catch Up – What levels of work, resources, and budget are required to bring the asset back required
conditional state to meet the safety, regulatory, and level of service requirements
Keep Up – Once the asset is caught up, what levels of work, resources, and budget are required to keep
up the level of service?
Moving Forward – What levels of work, resources, and budget are required to sustain the level of service?
1.2 Asset Management Program Methodology
The following diagram illustrates the methodology the City implemented to develop the AM Program.
In order to promote education, communication, and transparency, the City established two committees: the Asset
Engage Community Leaders
Inventory and Assess Condition of Individual Assets
Estimate Replacement Cost of Each Asset
Define Preservation and Restoration Costs and Schedules
Determine the Desired Service Levels
Understand the Finance and Resources Required to Sustain the
Delivery of Services
Optimize and Prioritize the Needs Based on Risk
Communicate and Negotiate
3
Management Program Advisory Committee (AMPAC) and the Asset Management Program Technical Advisory
Committee (AMPTAC). Members of the AMPAC are residents, business owners, community leaders, and
stakeholders. AMPAC visited various asset management systems and observed and discussed the issues associated
with each asset management system. AMPAC oversaw the City’s overall AM Program methodology and helped to
guide and reach consensus.
A technical committee was formed within AMPAC to further engage the public in the understanding and review of
the asset management methodologies and logic used to define the preservation and restoration costs and schedules.
A comprehensive inventory of assets took place for each asset management system. Where accessible, assets were
visited and their conditions were assessed. Based on the condition, actions required to restore the asset were
identified, and the cost and timing were estimated. Through assessment of risk (probability and consequence of
failures), activities were prioritized and communicated regarding urgency and the financial and resource
requirements.
1.3 Asset Management Definition
The City defined asset management as
“Delivering an established level of service while managing individual assets to minimize the life cycle cost with an
acceptable level of risk.”
The City’s asset management definition formed the fundamental basis of the City’s AM Program.
1.4 Asset Management Plan
An asset management plan is a long-range planning document that provides a framework for understanding the
assets an organization owns, services it provides, risks it assumes, and financial investments it requires. An asset
management plan can help an organization move from reactive to proactive management of its physical and financial
resources. This transition requires answers to the following questions:
What is an asset? What is not an asset?
Which assets need to be managed?
What are the conditions of the assets?
What maintenance and capital work is required? When and how much?
How long until the assets need to be renewed?
Which assets are critical?
What levels of service must be provided?
Are the current maintenance practices sufficient to sustain the service level?
How should the assets be managed to provide services in the most efficient way?
How can the asset data and maintenance system be updated to better facilitate maintenance practices?
How much funding is necessary to sustain the delivery of services?
Are there adequate resources to provide the services?
The answers to these questions help in the development of an asset management plan. An asset management plan
is meant to grow and change with the organization and system for which it is written. In the spirit of continuous
improvement, recommendations for future improvement activities were also developed and presented.
4
2 Asset Register
The asset register is a key component of the asset management plan. It establishes the data foundation of the asset
management plan by consolidating all data pertaining to the assets in the asset management system. The Roadway
Management System includes the following assets:
Curbs
Gutters
Sidewalks
Pedestrian ramps
Traffic signals
Signage
The initial step in developing an asset register was to consolidate all previously existing asset data in the City’s various
information systems (e.g., GIS, Lucity, Excel spreadsheets) into the asset register, creating a centralized database.
Once the data was gathered, a data gap analysis was performed to determine which assets or asset attributes (e.g.,
size, material) were missing from the register. This data gap analysis built a foundation for the data collection part
of the project. Each asset that was safely accessible was visited, photographed, and assessed for condition and
missing attributes.
The development of the asset register continues by establishing the following:
- Asset Definition – Helps to define what is an asset versus what is not an asset. With the asset definition
established, the City is able to separate assets from components and filter assets depending on how they
should be managed.
- Asset Hierarchy - Organizes the thousands of assets in the asset register. With the asset hierarchy, the City
is able to easily find and support asset management decisions at any level within the asset hierarchy.
- Asset Classes – Groups the assets to allow the City to characterize the life cycle behavior of thousands of
assets in the register. An asset class is developed by grouping assets with similar characteristics, such as
type, function, useful life, material, and size. These asset classes to help model the life cycle cost of the
assets.
2.1 Asset Definition
An asset definition establishes what will be included in the asset register. It defines an asset as opposed to a
component. In the Roadway Management System, the assets were previously defined in GIS.
5
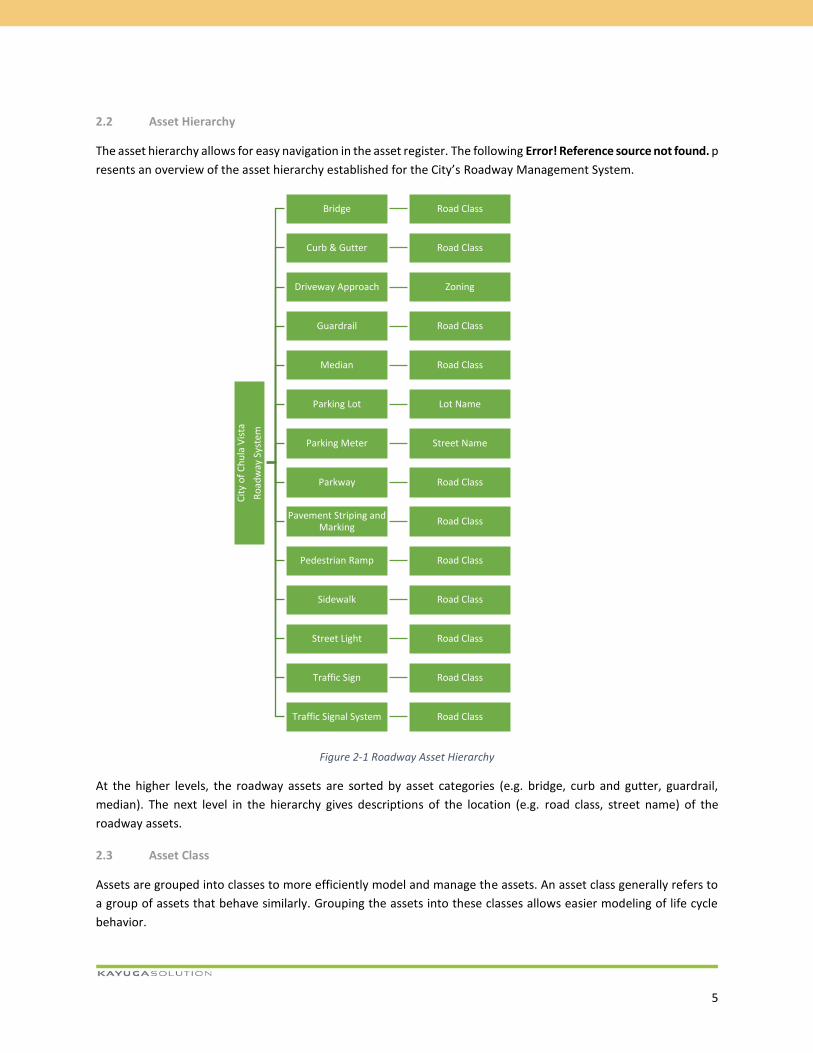
2.2 Asset Hierarchy
The asset hierarchy allows for easy navigation in the asset register. The following Error! Reference source not found. p
resents an overview of the asset hierarchy established for the City’s Roadway Management System.
Figure 2-1 Roadway Asset Hierarchy
At the higher levels, the roadway assets are sorted by asset categories (e.g. bridge, curb and gutter, guardrail,
median). The next level in the hierarchy gives descriptions of the location (e.g. road class, street name) of the
roadway assets.
2.3 Asset Class
Assets are grouped into classes to more efficiently model and manage the assets. An asset class generally refers to
a group of assets that behave similarly. Grouping the assets into these classes allows easier modeling of life cycle
behavior.
Cit
y o
f C
hu
la V
ista
Ro
adw
ay S
yste
m
Bridge Road Class
Curb & Gutter Road Class
Driveway Approach Zoning
Guardrail Road Class
Median Road Class
Parking Lot Lot Name
Parking Meter Street Name
Parkway Road Class
Pavement Striping and Marking
Road Class
Pedestrian Ramp Road Class
Sidewalk Road Class
Street Light Road Class
Traffic Sign Road Class
Traffic Signal System Road Class

6
The roadway assets are organized into the following classes: bridge, curb and gutter, driveway approach, guardrail,
median, parking lot, parking meter, parkway, pavement striping and marking, pedestrian ramp, sidewalk, street light,
traffic sign, and traffic signal system. The assets were then further categorized based on the material or the type of
asset classes. For example, traffic signs were identified based on different types, such as warning, guide, regulatory,
transit, object marker, and school.
Although pavement is one of the most important assets in the roadway system, it will not be included because the
data currently resides in a separate pavement management system.
2.4 Asset Inventory
Once the asset definition, hierarchy, and classes were set, the City began compiling the asset register. On-site
assessments took place to fill the asset register.
The following Table 2-1 presents a summary of the Roadway Management System asset inventory.
Table 2-1 Roadway Asset Inventory
Asset Class Length (LnFt) Area (SqFt) Count
Bridge 1,792 30,441 21
Curb & Gutter 4,291,686
Driveway Approach 61,082
Guardrail 35,977
Median 3,626,729
Parking Lot (Public) 10
Parking Meter 380
Parkway 6,115,569
Pavement Striping and Marking 2,941,040 6,937
Pedestrian Ramp 5,497
Sidewalk 24,238,751
Street Light 7,926
Traffic Sign 27,440
Traffic Signal System 259
Pavement striping and markings are measured differently depending on the type. Pavement striping are measured
in linear feet as opposed to pavement markings such as words or symbols (e.g. arrows, speed zone legend, stop
legend) are measured by count. The length column in the summary table only represents length of pavement striping
and count column of the summary table only represents pavement markings. The pavement striping exists in GIS as
point data; estimated lengths were assigned based on the type of striping.
7
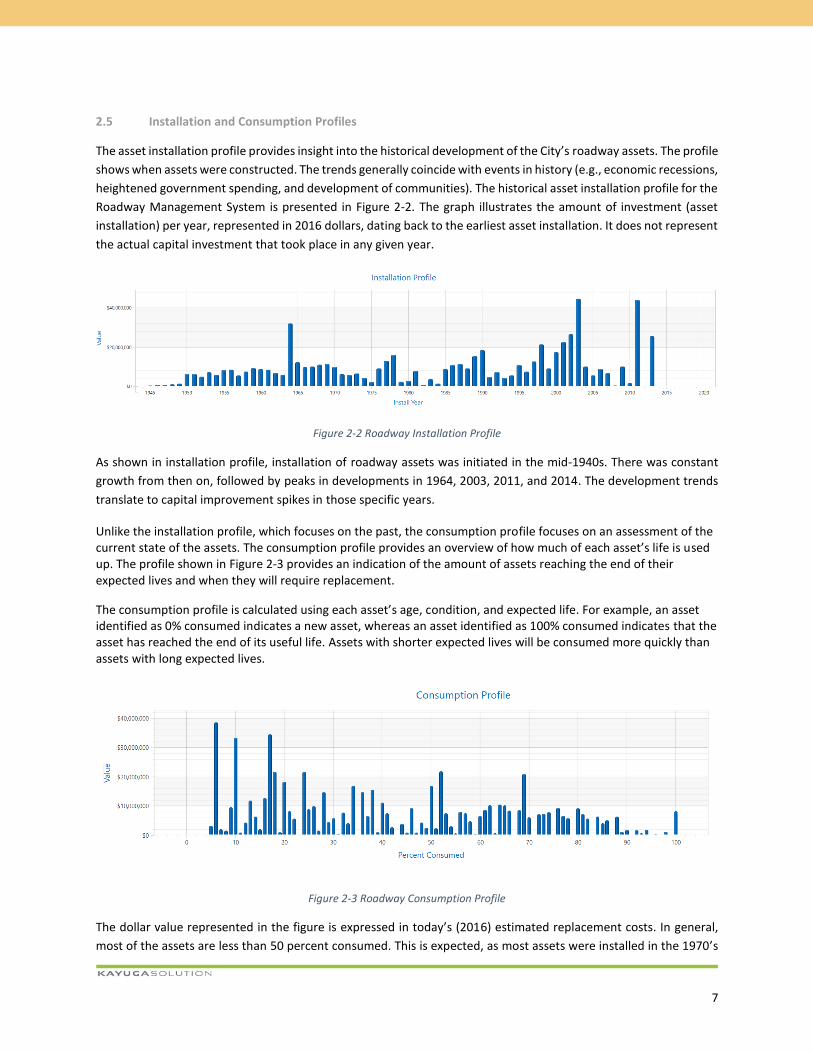
2.5 Installation and Consumption Profiles
The asset installation profile provides insight into the historical development of the City’s roadway assets. The profile
shows when assets were constructed. The trends generally coincide with events in history (e.g., economic recessions,
heightened government spending, and development of communities). The historical asset installation profile for the
Roadway Management System is presented in Figure 2-2. The graph illustrates the amount of investment (asset
installation) per year, represented in 2016 dollars, dating back to the earliest asset installation. It does not represent
the actual capital investment that took place in any given year.
Figure 2-2 Roadway Installation Profile
As shown in installation profile, installation of roadway assets was initiated in the mid-1940s. There was constant
growth from then on, followed by peaks in developments in 1964, 2003, 2011, and 2014. The development trends
translate to capital improvement spikes in those specific years.
Unlike the installation profile, which focuses on the past, the consumption profile focuses on an assessment of the current state of the assets. The consumption profile provides an overview of how much of each asset’s life is used up. The profile shown in Figure 2-3 provides an indication of the amount of assets reaching the end of their expected lives and when they will require replacement.
The consumption profile is calculated using each asset’s age, condition, and expected life. For example, an asset identified as 0% consumed indicates a new asset, whereas an asset identified as 100% consumed indicates that the asset has reached the end of its useful life. Assets with shorter expected lives will be consumed more quickly than assets with long expected lives.
Figure 2-3 Roadway Consumption Profile
The dollar value represented in the figure is expressed in today’s (2016) estimated replacement costs. In general,
most of the assets are less than 50 percent consumed. This is expected, as most assets were installed in the 1970’s

8
to early-2000’s, as indicated in the installation profile, and are relatively new.
2.6 Replacement Cost
With the asset inventory complete, each asset was assigned an estimated replacement cost. The replacement cost
is an estimated budget the City will spend to replace the asset including material, labor, and other indirect costs. The
estimated replacement costs were based on City’s historical cost database, City staff estimate, or Kayuga Solution’s
cost database from other comparable cities. Knowledge of estimated current replacement costs allows managers to
support their budgetary planning, identify high value assets, and understand the total value of the assets at all levels
of the hierarchy.
Figure 2-4 below presents the valuation of roadway assets broken down by asset class.
Figure 2-4 Roadway Asset Valuation
The total valuation for the Roadway Management System determined by aggregating the individual asset
replacement costs. The total estimated valuation of the Roadway Management System is approximately $662
million. The sidewalks have the highest total valuation at $194 million. Driveway approach and curb and gutter make
up the next highest valuations at $147 million and $103 million, respectively.

9
2.7 Condition Assessment
In order to most efficiently determine the current condition of the assets, a sample condition assessment was
performed on the roadway assets. Condition assessment was focused on west side of the City, where most of the
assets are older and are expected to be in below average condition. Condition assessment was also focused on the
assets located along the major high-traffic roads in the City (e.g., Telegraph Canyon Road, Olympic Parkway, East H
Street, Oleander Avenue). Figure 2-5 shows the areas where the sample field inspections took place for each of the
asset classes.
Figure 2-5 Roadway Field Inspection Data
10
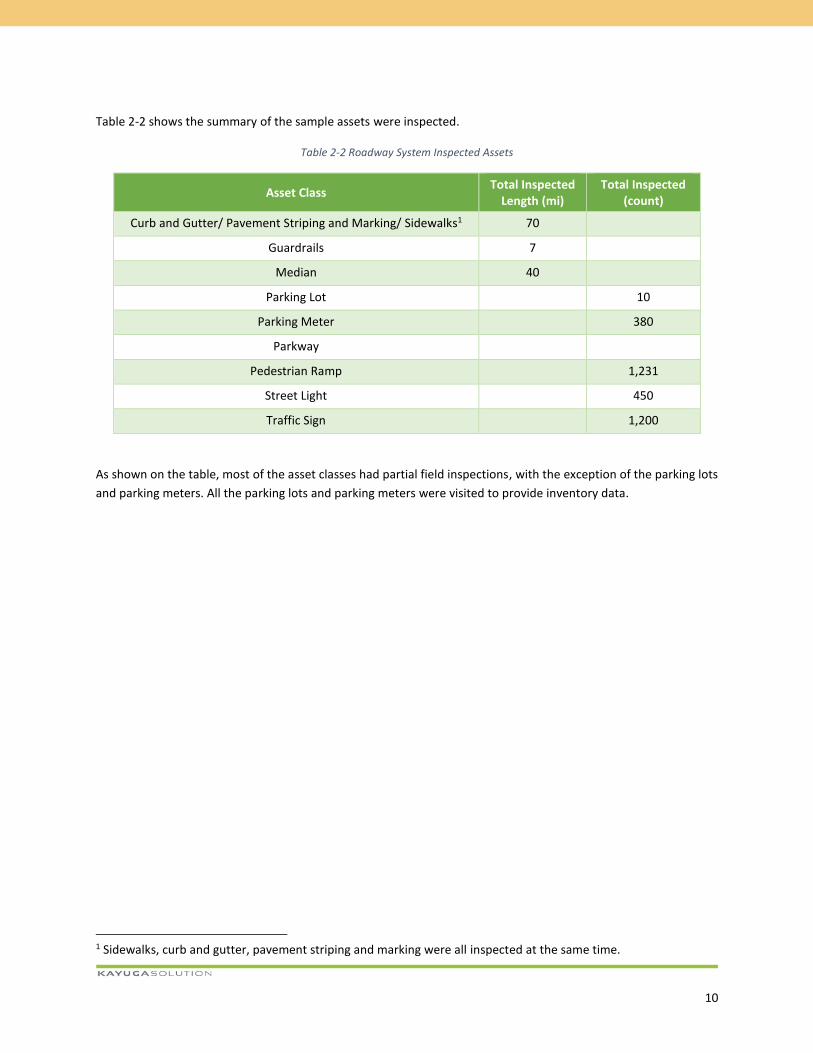
Table 2-2 shows the summary of the sample assets were inspected.
Table 2-2 Roadway System Inspected Assets
Asset Class Total Inspected
Length (mi) Total Inspected
(count)
Curb and Gutter/ Pavement Striping and Marking/ Sidewalks1 70
Guardrails 7
Median 40
Parking Lot 10
Parking Meter 380
Parkway
Pedestrian Ramp 1,231
Street Light 450
Traffic Sign 1,200
As shown on the table, most of the asset classes had partial field inspections, with the exception of the parking lots
and parking meters. All the parking lots and parking meters were visited to provide inventory data.
1 Sidewalks, curb and gutter, pavement striping and marking were all inspected at the same time.

11
Based on the asset classes, the condition assessment process included taking GIS coordinates, recording current
conditions, checking ADA requirements, and taking pictures of the asset. Figure 2-6 shows sample condition
assessments for the roadway systems.
Figure 2-6 Roadway Condition Assessment Samples
12
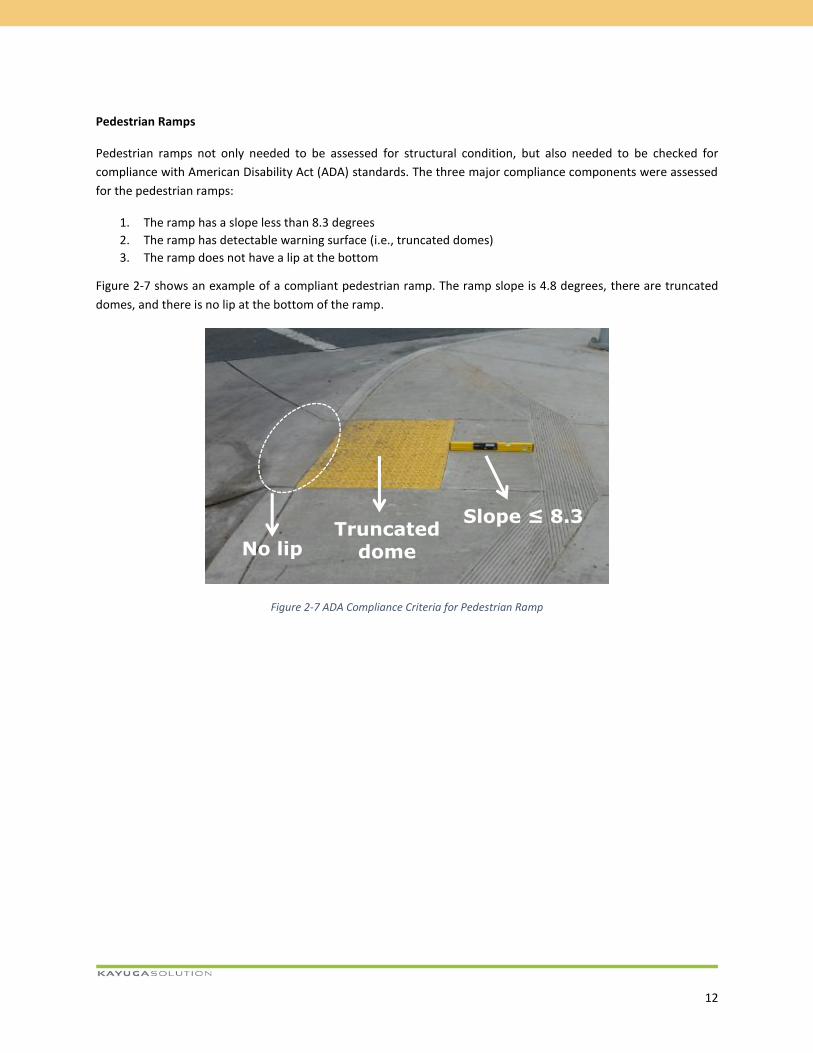
Pedestrian Ramps
Pedestrian ramps not only needed to be assessed for structural condition, but also needed to be checked for
compliance with American Disability Act (ADA) standards. The three major compliance components were assessed
for the pedestrian ramps:
1. The ramp has a slope less than 8.3 degrees
2. The ramp has detectable warning surface (i.e., truncated domes)
3. The ramp does not have a lip at the bottom
Figure 2-7 shows an example of a compliant pedestrian ramp. The ramp slope is 4.8 degrees, there are truncated
domes, and there is no lip at the bottom of the ramp.
Figure 2-7 ADA Compliance Criteria for Pedestrian Ramp
Slope ≤ 8.3 Truncated
dome No lip
13
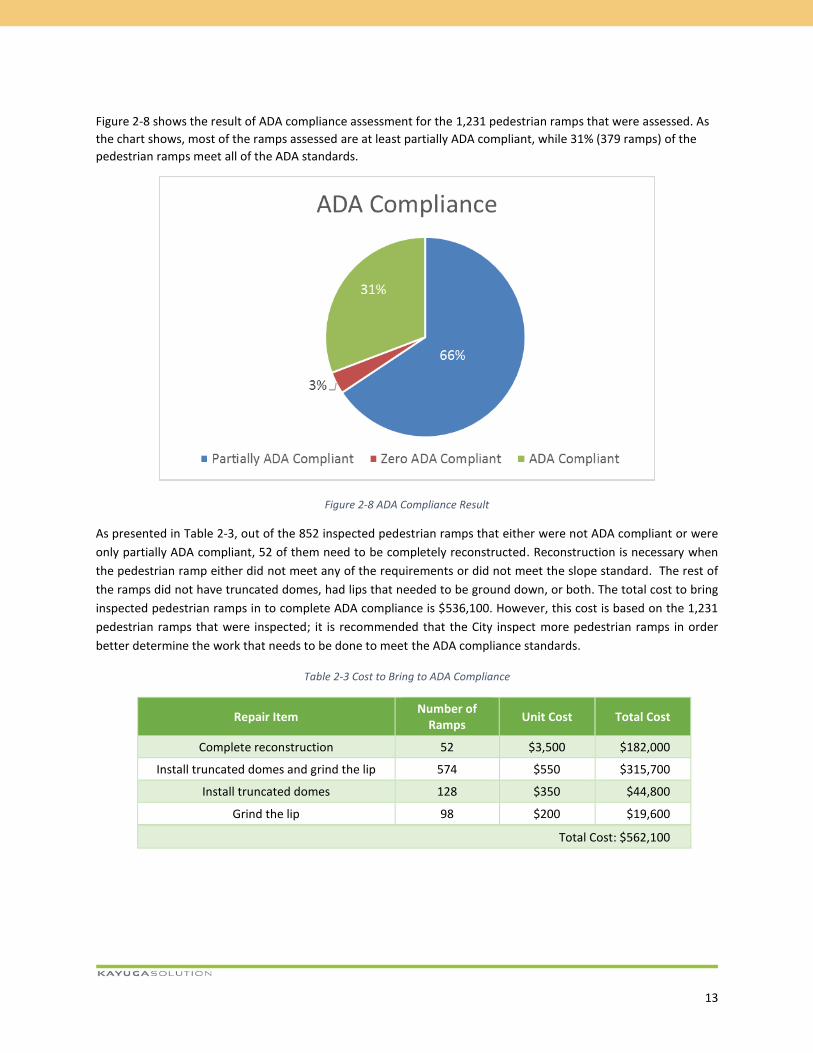
Figure 2-8 shows the result of ADA compliance assessment for the 1,231 pedestrian ramps that were assessed. As
the chart shows, most of the ramps assessed are at least partially ADA compliant, while 31% (379 ramps) of the
pedestrian ramps meet all of the ADA standards.
Figure 2-8 ADA Compliance Result
As presented in Table 2-3, out of the 852 inspected pedestrian ramps that either were not ADA compliant or were
only partially ADA compliant, 52 of them need to be completely reconstructed. Reconstruction is necessary when
the pedestrian ramp either did not meet any of the requirements or did not meet the slope standard. The rest of
the ramps did not have truncated domes, had lips that needed to be ground down, or both. The total cost to bring
inspected pedestrian ramps in to complete ADA compliance is $536,100. However, this cost is based on the 1,231
pedestrian ramps that were inspected; it is recommended that the City inspect more pedestrian ramps in order
better determine the work that needs to be done to meet the ADA compliance standards.
Table 2-3 Cost to Bring to ADA Compliance
Repair Item Number of
Ramps Unit Cost Total Cost
Complete reconstruction 52 $3,500 $182,000
Install truncated domes and grind the lip 574 $550 $315,700
Install truncated domes 128 $350 $44,800
Grind the lip 98 $200 $19,600
Total Cost: $562,100

14
Traffic Sign
Traffic signs need to meet reflectivity regulation standards. These standards are set to help increase the visibility of
signs to drivers, especially at night. A sample condition assessment was performed in order to measure the
reflectivity of the traffic signs. Of the 27,440 total signs, 638 signs were inspected.
Of the inspected traffic signs, 39% (247 signs) fell below the mandated reflectivity level. The City estimates there to
be additional 9,157 non-compliant signs city-wide. The City has planned a CIP in FY 17 to test reflectivity.
Sidewalk
A total of 70 miles of sidewalks were inspected for tripping hazards. An uplift of panel that is greater than a quarter
of an inch is considered a tripping hazard. Within the inspected sidewalks, there were 1,070 locations where the
sidewalk panel uplift was greater than 0.25 inch. Of those trip hazard locations, 63% had an uplift greater than 0.5
inch and less than 1 inch, 29% had uplift greater than 1 inch and less than 2 inches, and 7% had uplifts greater than
2 inches. Most of the uplifts were due to close proximity to trees. It is recommended that root barriers be installed
when planting new trees to prevent sidewalk uplifts.
Figure 2-9 Sidewalk Condition Assessment

15
3 Risk Analysis
Risk is a key component of asset management. Risk is used for effective prioritization of limited resources. The two
main components of risk are Probability of Failure (PoF) and Consequence of Failure (CoF). PoF provides an indication
of timing to failure. CoF provides an indication of the impact of a failure.
The following formula is used to calculate risk:
3.1 Probability of Failure
The PoF score indicates the projected time until the asset fails to function at the established levels of service. For
the assets that were inspected during condition assessment, the PoF score was based on the condition score. For
the assets that were not inspected, the PoF score was based on the age of the asset. The remaining useful life was
driven by consideration of multiple asset failure modes (i.e., mortality, capacity, level of service, financial efficiency).
The imminent failure mode (i.e., the most likely mode of failure) was used to identify as the PoF of the asset. PoF
was calculated on a score of 0 (low probability of failure) to 1 (extremely high probability of failure).
The PoF scores were classified into three categories: low, medium, and high probability. These classifications provide
guidance with respect to the anticipated timing of failure.
Risk Probability of
Failure
Consequence
of Failure
16
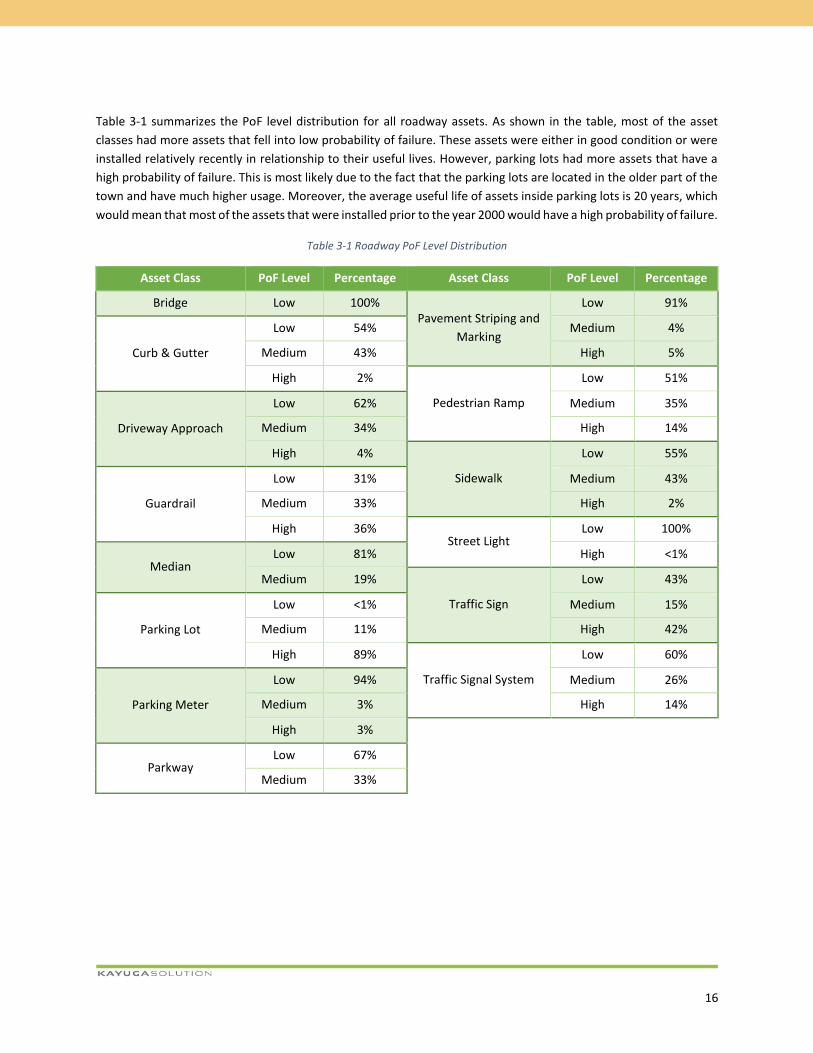
Table 3-1 summarizes the PoF level distribution for all roadway assets. As shown in the table, most of the asset
classes had more assets that fell into low probability of failure. These assets were either in good condition or were
installed relatively recently in relationship to their useful lives. However, parking lots had more assets that have a
high probability of failure. This is most likely due to the fact that the parking lots are located in the older part of the
town and have much higher usage. Moreover, the average useful life of assets inside parking lots is 20 years, which
would mean that most of the assets that were installed prior to the year 2000 would have a high probability of failure.
Table 3-1 Roadway PoF Level Distribution
Asset Class PoF Level Percentage Asset Class PoF Level Percentage
Bridge Low 100% Pavement Striping and
Marking
Low 91%
Curb & Gutter
Low 54% Medium 4%
Medium 43% High 5%
High 2%
Pedestrian Ramp
Low 51%
Driveway Approach
Low 62% Medium 35%
Medium 34% High 14%
High 4%
Sidewalk
Low 55%
Guardrail
Low 31% Medium 43%
Medium 33% High 2%
High 36% Street Light
Low 100%
Median Low 81% High <1%
Medium 19%
Traffic Sign
Low 43%
Parking Lot
Low <1% Medium 15%
Medium 11% High 42%
High 89%
Traffic Signal System
Low 60%
Parking Meter
Low 94% Medium 26%
Medium 3% High 14%
High 3%
Parkway Low 67%
Medium 33%

17
3.2 Consequence of Failure
CoF was also determined for each asset. CoF is a numerical measurement of the criticality of the asset, that is, how
large an impact the asset will have when it fails to function. The impact of failure was assessed with respect to the
triple bottom line factors of sustainability: economic, social, and environmental. In the case of the roadway assets,
the social and economic factors are of highest concern when considering the failure of an asset; these two areas
were the focus of the CoF score logic.
The social and economic factors were broken down into components. Table 3-2 and Table 3-3 show the definition
of CoF scoring scale for each of the components.
Table 3-2 Social, Community, and Organizational CoF Component
CoF Score 1 2 3 4 5
Loss of Service Can be out of
service indefinitely
Cannot be down for more than a
month
Cannot be down for more than a
week
Cannot be down for more than a
day
Cannot be down for more than
one hour
Safety No impact Minor
inconvenience Minor injury Moderate injury Major injury
City’s Image No media or no
consequence Neutral
coverage Adverse media
Widely adverse media
Nationally adverse media
Table 3-3 Economic CoF Component
CoF Score 1 2 3 4 5
Economic Impact No Impact Very Low Medium High Very High
18
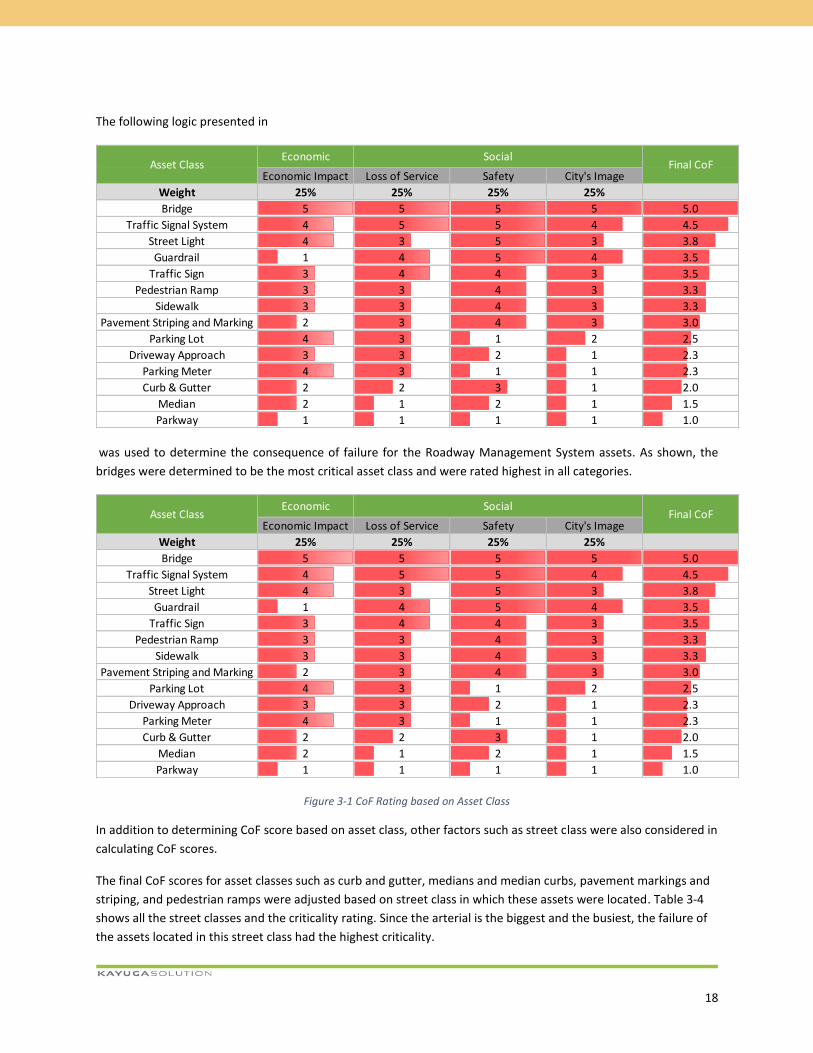
The following logic presented in
was used to determine the consequence of failure for the Roadway Management System assets. As shown, the
bridges were determined to be the most critical asset class and were rated highest in all categories.
Figure 3-1 CoF Rating based on Asset Class
In addition to determining CoF score based on asset class, other factors such as street class were also considered in
calculating CoF scores.
The final CoF scores for asset classes such as curb and gutter, medians and median curbs, pavement markings and
striping, and pedestrian ramps were adjusted based on street class in which these assets were located. Table 3-4
shows all the street classes and the criticality rating. Since the arterial is the biggest and the busiest, the failure of
the assets located in this street class had the highest criticality.
Economic
Economic Impact Loss of Service Safety City's Image
Weight 25% 25% 25% 25%
Bridge 5 5 5 5 5.0
Traffic Signal System 4 5 5 4 4.5
Street Light 4 3 5 3 3.8
Guardrail 1 4 5 4 3.5
Traffic Sign 3 4 4 3 3.5
Pedestrian Ramp 3 3 4 3 3.3
Sidewalk 3 3 4 3 3.3
Pavement Striping and Marking 2 3 4 3 3.0
Parking Lot 4 3 1 2 2.5
Driveway Approach 3 3 2 1 2.3
Parking Meter 4 3 1 1 2.3
Curb & Gutter 2 2 3 1 2.0
Median 2 1 2 1 1.5
Parkway 1 1 1 1 1.0
SocialAsset Class Final CoF

19
Table 3-4 CoF Score Adjustment Based on Street Class
Street Class Criticality Rating CoF Adjustment Multiplier
Six Lane Prime Arterial 5 1
Six Lane Major Arterial 5 1
Four Lane Major Arterial 4 0.95
Class I Collector 3 0.9
Class II Collector 2 0.85
Class III Collector 2 0.85
Residential 1 0.8

20
Traffic Signs
The final CoF scores of the traffic signs were also adjusted based on the different sign types. Table 3-5 lists
different types of traffic signs and their criticality rating. The regulatory, warning, and school signs have the highest
rating since these types of signs are related to safety issues.
Table 3-5 CoF Score Adjustment Based on Signage Types
Signage Types Criticality Rating CoF Adjustment Multiplier
Regulatory 5 1
Warning 5 1
School 5 1
Guide 3 0.9
Other (e.g. Object Marker, Transit, and Custom) 2 0.8
21
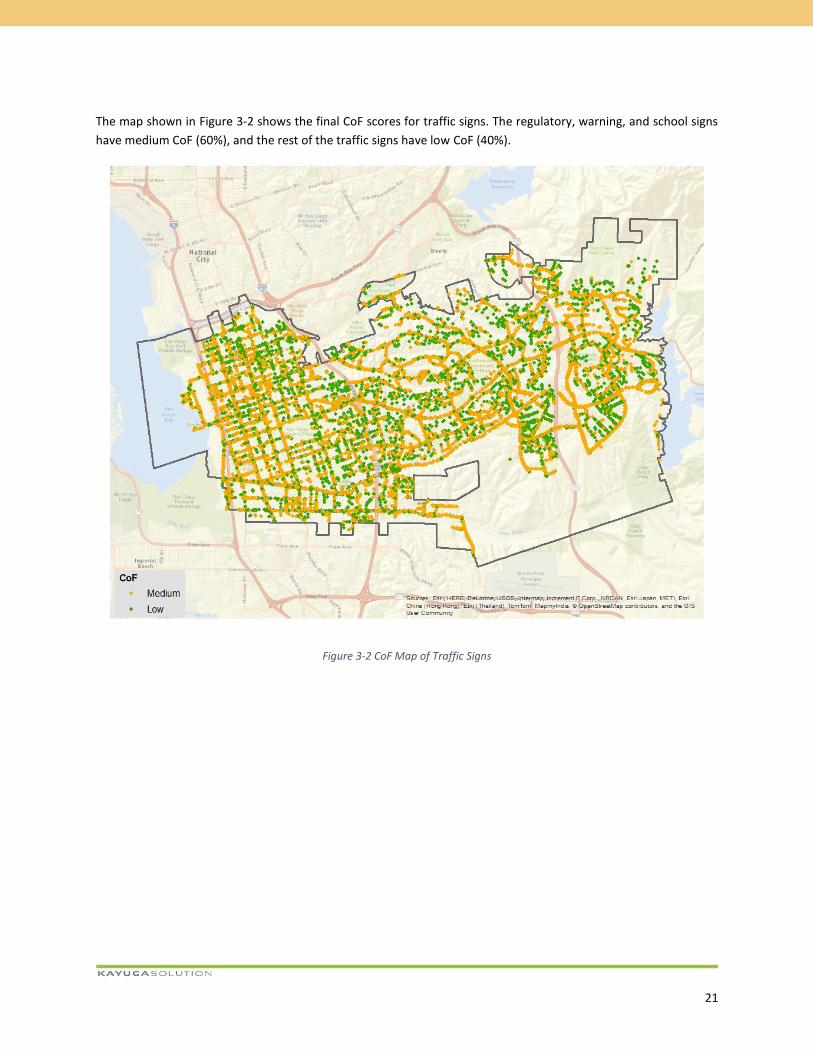
The map shown in Figure 3-2 shows the final CoF scores for traffic signs. The regulatory, warning, and school signs
have medium CoF (60%), and the rest of the traffic signs have low CoF (40%).
Figure 3-2 CoF Map of Traffic Signs

22
Parking Lots
The final CoF scores of the parking lots were adjusted based on the asset classes within parking lots. Table 3-6 lists
different types of parking lot asset classes and their criticality rating. The pay machine, parking meter, and lightings
had the highest criticality since these assets have high economic impact and/or are related to safety issues.
Table 3-6 CoF Score Adjustment Based on Parking Lot Asset Classes
Asset Classes Criticality Rating CoF Adjustment Multiplier
Pay Machine 5 1
Parking Meter 5 1
Lighting 5 1
Signage 3 0.9
Fencing 2 0.85
Bollard 2 0.85
Curb 2 0.85
Bench 1 0.8
Trash Bin 1 0.8

23
3.3 Risk
As defined earlier, risk is a combination of probability of failure and consequence of failure. The following figures show the resulting risk profile for the
Roadway Management System. The assets in the red zone present the highest risk to the City. These assets are likely to fail soon with a high impact of failure.
The assets in the red zone also include the backlog work (i.e., activities from previous years that have yet to take place). The summation of replacement cost
for all assets in the red zone equated to approximately $46 million. Most of the high risk assets consisted of traffic signal systems and sidewalks, many of
which were installed before the 1970’s.
Figure 3-3 Roadway System Risk Matrix
Pro
bab
ility
of
Failu
re
0.20
1.00
0.80
0.60
0.40
0 0.50 1.00 1.50 2.00 2.50 3.00 3.50 4.00 4.50 5.00
Consequence of Failure
24
4 Life Cycle Cost Analysis
4.1 Immediate Needs
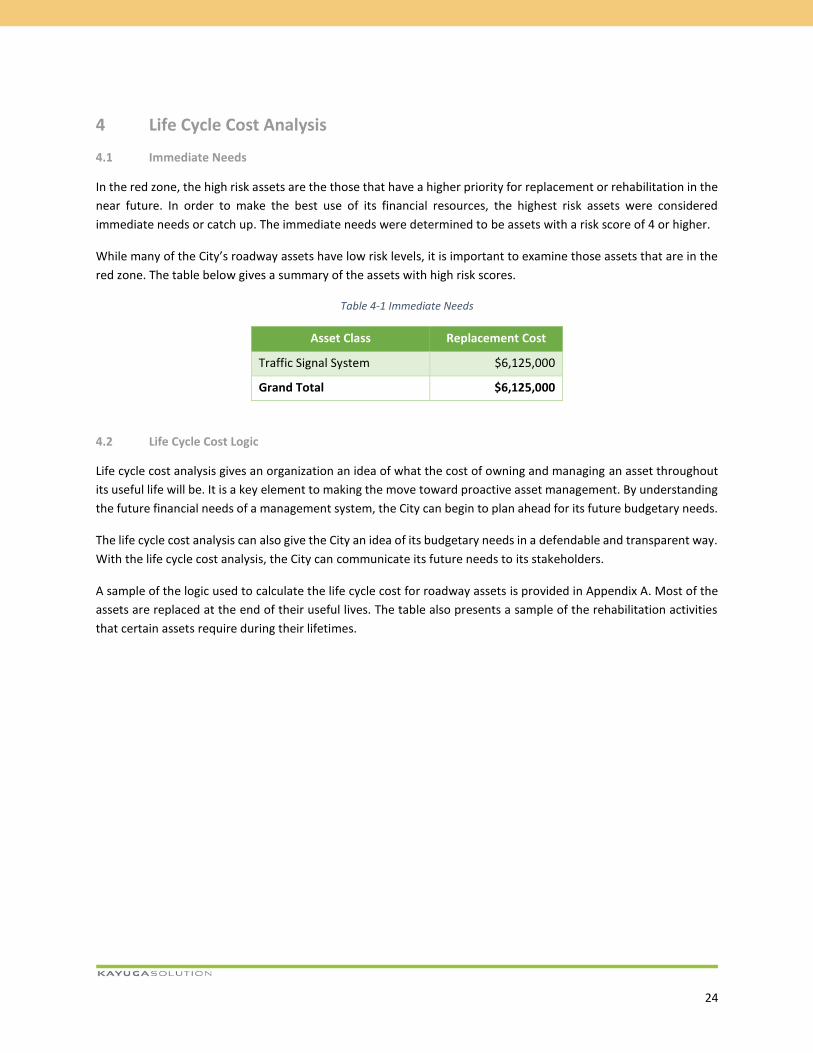
In the red zone, the high risk assets are the those that have a higher priority for replacement or rehabilitation in the
near future. In order to make the best use of its financial resources, the highest risk assets were considered
immediate needs or catch up. The immediate needs were determined to be assets with a risk score of 4 or higher.
While many of the City’s roadway assets have low risk levels, it is important to examine those assets that are in the
red zone. The table below gives a summary of the assets with high risk scores.
Table 4-1 Immediate Needs
Asset Class Replacement Cost
Traffic Signal System $6,125,000
Grand Total $6,125,000
4.2 Life Cycle Cost Logic
Life cycle cost analysis gives an organization an idea of what the cost of owning and managing an asset throughout
its useful life will be. It is a key element to making the move toward proactive asset management. By understanding
the future financial needs of a management system, the City can begin to plan ahead for its future budgetary needs.
The life cycle cost analysis can also give the City an idea of its budgetary needs in a defendable and transparent way.
With the life cycle cost analysis, the City can communicate its future needs to its stakeholders.
A sample of the logic used to calculate the life cycle cost for roadway assets is provided in Appendix A. Most of the
assets are replaced at the end of their useful lives. The table also presents a sample of the rehabilitation activities
that certain assets require during their lifetimes.

25
4.3 Preservation and Restoration Profile
Based on the life cycle cost logic, a long term prediction of the annual budget needs for the roadway management system was generated. A projection of the
Roadway Management System’s financial needs for the next 100 years is presented in Figure 4-1 below. A long planning horizon was used in order to capture
the long useful lives of the assets. Roadway assets such as concrete bridges and medians have long useful lives, so a 100-year outlook gives an indication as
to when these assets may finally need to be replaced.
The total average annual investment for the next 100 years is $12.5 million. There are no large investments that need to take place toward the beginning of
the planning horizon. However, there is a rise and peaks in the estimated investments starting from mid-2060’s to 2080’s. The huge peaks of investments in
these years are mostly caused by street lights that have reached the ends their useful lives.
Figure 4-1 Roadway Preservation and Restoration Profile

26
Figures 4-2, 4-3, and 4-4 show the 10-, 20-, and 30-year Preservation and Restoration profiles for the Roadway Management System. These profiles give a
more practical idea of the needs of the system in the near future. As the estimated financial needs are lower in the near future, the annual average over the
10-, 20-, and 30-year planning horizons are lower than that of the 100-year planning horizon.
Figure 4-2 10-Year Preservation and Restoration Profile
Figure 4-3 20-Year Preservation and Restoration Profile

27
Figure 4-4 30-Year Preservation and Restoration Profile
28
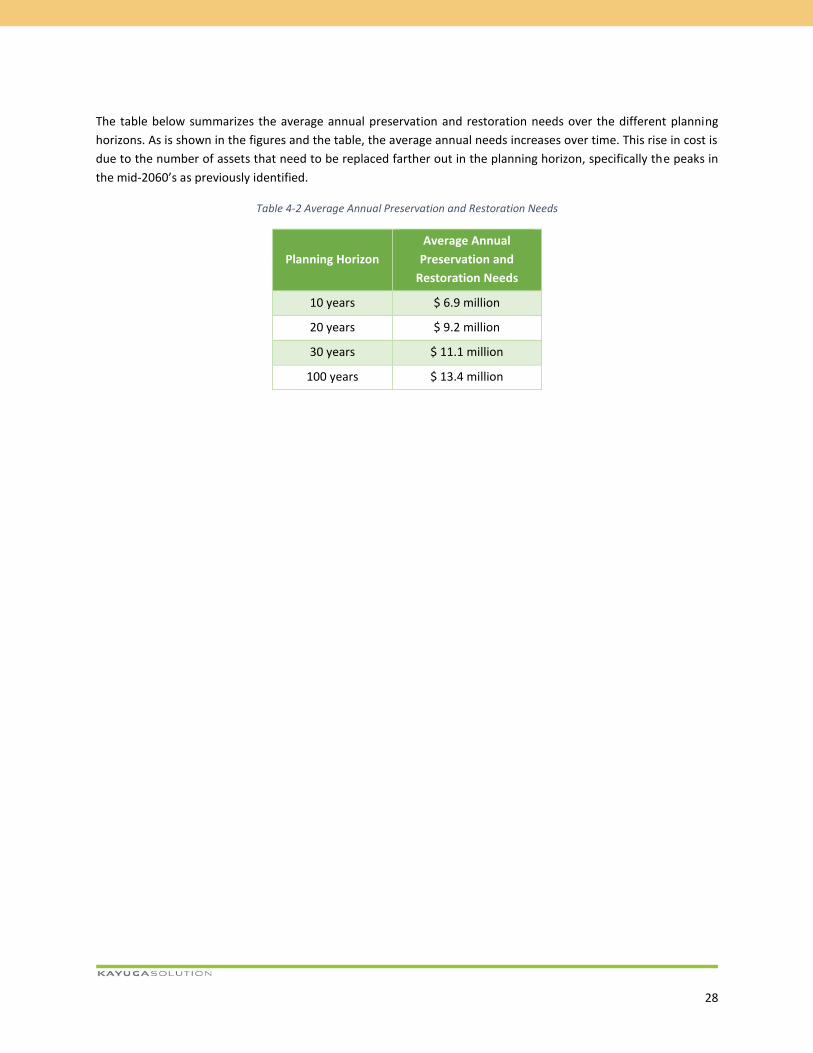
The table below summarizes the average annual preservation and restoration needs over the different planning
horizons. As is shown in the figures and the table, the average annual needs increases over time. This rise in cost is
due to the number of assets that need to be replaced farther out in the planning horizon, specifically the peaks in
the mid-2060’s as previously identified.
Table 4-2 Average Annual Preservation and Restoration Needs
Planning Horizon
Average Annual
Preservation and
Restoration Needs
10 years $ 6.9 million
20 years $ 9.2 million
30 years $ 11.1 million
100 years $ 13.4 million

29
Figure 4-5 shows restoration profile of the roadway assets. The average annual restoration needs for the next 100 years is $12.9 million. Knowing when these
rises in annual budget needs occur allows the City to prepare and manage their assets proactively.
Figure 4-5 Roadway Restoration Profile

30
Figure 4-6 shows preservation profile of the roadway assets. The average annual preservation needs for the next 100 years is $528 thousand. The peaks that
appear every 10 years are caused by the replacement of sign panels. Other preservation activities include controller upgrades for traffic signal systems, minor
repairs for medians, and replacment of truncated domes for the pedestrian ramps.
Figure 4-6 Roadway Preservation Profile

31
5 Confidence Level
Once the asset management plan has been established, it is important to examine the work that has been done in
order to identify future improvement opportunities. In this section, the asset management system is rated on the
confidence level of the data and methodology developed throughout the project.
The confidence level is rated based on the following factors:
1. Asset Inventory – examines the completeness of the asset data
2. Data Quality – examines the quality and completeness of the asset attribute data used to develop the asset
management plan
3. Condition Assessment – examines the quality and completeness of the condition assessment data
4. Asset Valuation – examines the accuracy of the methodology used to calculate asset value
5. Life-cycle Cost Logic – examines the accuracy and completeness of the methodology used to calculate the life-
cycle cost and the results
6. Risk – examines the accuracy of the risk assessment methodology and results
7. Staff Review – examines the staff involvement in the development and review of the asset management plan
8. Technical Committee Review – represents the review by the asset management program technical advisory
committee
The following table presents the confidence level factors and their respective weights used to calculate the
confidence level.
Table 5-1 Confidence Level Logic
Confidence Level Factor Weight
Asset Inventory 20%
Data Quality 15%
Condition Assessment 20%
Asset Valuation 10%
Life-cycle Cost Logic 10%
Risk 10%
Staff Review 5%
Technical Committee Review 10%
The confidence level factor weights are based on the City’s specific goals for the project. Completing the asset
inventory and condition assessment were of particular interest to the City in this phase of the development of the
asset management program. As such, these areas had a high weight in the overall confidence level rating. Another
of the City’s main goals was to encourage buy-in on the part of its and stakeholders, so the technical committee
review was given a significant weight.
32
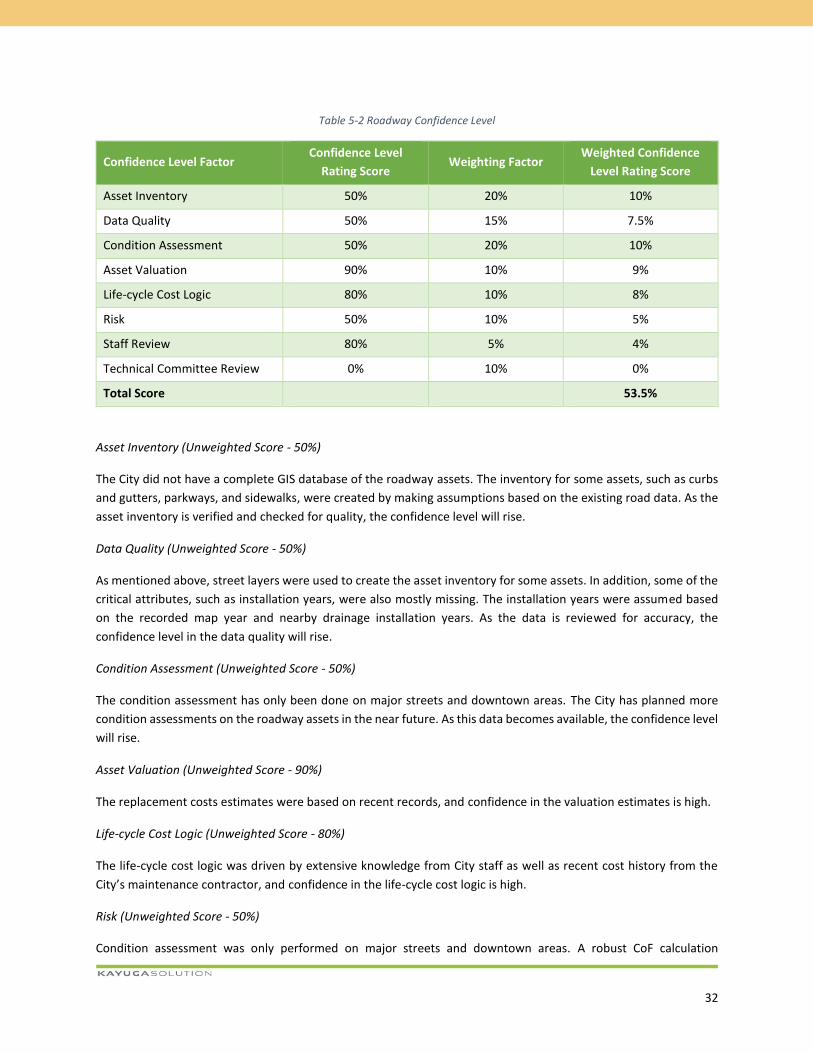
Table 5-2 Roadway Confidence Level
Confidence Level Factor Confidence Level
Rating Score Weighting Factor
Weighted Confidence
Level Rating Score
Asset Inventory 50% 20% 10%
Data Quality 50% 15% 7.5%
Condition Assessment 50% 20% 10%
Asset Valuation 90% 10% 9%
Life-cycle Cost Logic 80% 10% 8%
Risk 50% 10% 5%
Staff Review 80% 5% 4%
Technical Committee Review 0% 10% 0%
Total Score 53.5%
Asset Inventory (Unweighted Score - 50%)
The City did not have a complete GIS database of the roadway assets. The inventory for some assets, such as curbs
and gutters, parkways, and sidewalks, were created by making assumptions based on the existing road data. As the
asset inventory is verified and checked for quality, the confidence level will rise.
Data Quality (Unweighted Score - 50%)
As mentioned above, street layers were used to create the asset inventory for some assets. In addition, some of the
critical attributes, such as installation years, were also mostly missing. The installation years were assumed based
on the recorded map year and nearby drainage installation years. As the data is reviewed for accuracy, the
confidence level in the data quality will rise.
Condition Assessment (Unweighted Score - 50%)
The condition assessment has only been done on major streets and downtown areas. The City has planned more
condition assessments on the roadway assets in the near future. As this data becomes available, the confidence level
will rise.
Asset Valuation (Unweighted Score - 90%)
The replacement costs estimates were based on recent records, and confidence in the valuation estimates is high.
Life-cycle Cost Logic (Unweighted Score - 80%)
The life-cycle cost logic was driven by extensive knowledge from City staff as well as recent cost history from the
City’s maintenance contractor, and confidence in the life-cycle cost logic is high.
Risk (Unweighted Score - 50%)
Condition assessment was only performed on major streets and downtown areas. A robust CoF calculation

33
methodology was developed with input from City staff. As more condition assessment takes place, the risk level
confidence score will rise.
Staff Review (Unweighted Score - 80%)
City staff were involved in the development of the roadway asset management program, which led to a high
confidence level rating.
Technical Committee Review (Unweighted Score - 0%)
The technical committee will review the results of this asset management plan and its analysis.
5.1 Next Steps
The following areas are the recommended areas of focus to further improve the Roadway Asset Management Plan.
Data Quality
The attributes for some of the assets are incomplete. In order to close the data gap, assumptions were made, which
are stated in the asset register section report. It is recommended that the City gather all the information in order to
develop more accurate cost assumptions and life cycle cost logic. In addition, the data needs to be continuously
updated and maintained in order to keep a record of all the activities done to the asset.
Level of Service and Resources
Levels of service are specific activities developed to meet the City’s objectives, and they include specific performance
metrics to allow the City to measure how well they are achieving the target performance. Defined levels of service
can be used to track performance of the City’s activities and identify areas where activities are not in alignment with
the mission or goals of the organization. These levels also help to determine the levels of resources needed for the
management of the system. Part of the next steps for the Roadway Management System will be to establish levels
of service.
Risk
The City already has agreed on scoring criteria set for determining the CoF score. Although the CoF score will not
change unless there will be changes made to the scoring criteria, the PoF score will change depending on the
condition of the asset. It is highly recommended that the City continues to collect and update the condition data in
order to further improve the PoF scores, and maintain consistency among scoring, which will be aided by the updated
maintenance guidelines.
Life Cycle Logic
Assumptions, such as useful life, were made based on the deterioration characteristics of certain asset classes. In
the future, the useful life can be further improved by keeping record of replacement and rehabilitation data.
Furthermore, the management strategy is also affected by LOS. If there are changes in the LOS, then the
management strategies will need to change in order to meet the new LOS.

34
6 Appendix A
Asset Class Useful
Life
Preservation
Activity Frequency Cost
Preservation
Activity Frequency Cost
Curb &
Gutter 75
Median 100 Minor repair 5 $1,000
Sidewalk 75 Grinding 5
10% of
Replacement
cost
Pavement
Marking -
Paint
1
Pavement
Marking -
Other
5
Street Light 50 Bulb
replacement 10
10% of
Replacement
cost
Traffic Signal
System 50
Bulb
replacement 10
1% of
Replacement
cost
Controller
upgrade 15
2.5% of
Replacement
cost
Pedestrian
Ramp 75
Replace
truncated
domes
10 $350
Parkway 100
Driveway
Approach 75
Bridge 100
Parking
Meter 20
Traffic Sign 50 Replace sign
panel 10 $100
Guardrail 50
Bollard 30
Trash bin 15
Signage 10
Pay Machine 20

35
Asset Class Useful
Life
Preservation
Activity Frequency Cost
Preservation
Activity Frequency Cost
Lighting 35
Bench 20
Fencing 30


