28
Interstate 10 – Hassayampa Valley Roadway Framework Study Chapter 6 Alternative Transportation Network Description and Evaluation September 2007 Prepared for Prepared by

Interstate 10 – Hassayampa ValleyRoadway Framework Study
Chapter 6
Alternative Transportation Network Description andEvaluation
September 2007
Prepared for
Prepared by
6-i
Table of Contents
6.1 Alternatives Considered.................................................................................................................6-16.1.1 Alternative A (Base) ...................................................................................................................6-16.1.2 Additional Roadway Network Alternatives..........................................................................6-7
6.2 Tiered Evaluation of Alternatives .............................................................................................. 6-176.2.1 Tier 1 Screening........................................................................................................................ 6-176.2.2 Tier 2 Evaluation....................................................................................................................... 6-196.2.3 Results and Recommendation............................................................................................... 6-25
List of Figures
Figure 6-1 Alternative A ...........................................................................................................................6-2Figure 6-2 Generalized Parkway Cross-Section .................................................................................6-5Figure 6-3 Parkway to Arterial Intersection........................................................................................6-6Figure 6-4 Alternative A3.........................................................................................................................6-8Figure 6-5 Alternative A4.........................................................................................................................6-9Figure 6-6 Alternative A5...................................................................................................................... 6-10Figure 6-7 Alternative B......................................................................................................................... 6-11Figure 6-8 Alternative C........................................................................................................................ 6-12Figure 6-9 Alternative D........................................................................................................................ 6-13Figure 6-10 Alternative E......................................................................................................................... 6-14Figure 6-11 Alternative F ......................................................................................................................... 6-15
List of Tables
Table 6.1: Summary of Base Network Alternative A............................................................................6-4Table 6.2: Differences Between Base Alternative A and Other Alternatives .............................. 6-16Table 6.3: Total Lane Miles in Study Area by Alternative and Facility Class ................................ 6-17Table 6.4: Tier 1 Safety and Mobility Evaluation Matrix for Alternatives A, A3, A4, A5,
B, C, D, E and F........................................................................................................................ 6-18Table 6.5: Detailed Tier 2 Evaluation Matrix for Alternatives A, A3, A5, B and C .................... 6-20Table 6.6: Derivation of Planning-Level Capital Cost*....................................................................... 6-25Table 6.7: Planning-Level Capital Cost Breakdown by Alternative ... 6-26

Chapter 6: Alternative Transportation Network Description and EvaluationSeptember 2007
6-1
6.1 Alternatives Considered
6.1.1 Alternative A (Base)
During the extensive community involvement process that included more than 120 meetings with the FundingPartners, Study Review Team and individual (public and private) stakeholders—as well as three DevelopmentForums and one public Open House—the MAG Study Team developed and continually refined a network ofroadways to provide mobility to, from, and within the Hassayampa Valley study area under Buildoutconditions. As discussed in Chapter 5, this network was also designed to address the deficiencies identifiedwhen the existing plus committed (MAG Regional Transportation Plan) year 2026 roadway system was used asthe background network for an unconstrained traffic assignment. The socioeconomic (population, housingand employment) inputs to the MAG model were based on the latest Buildout projections supplied byjurisdictions within the study area, and on adopted year 2030 projections for the balance of Maricopa Countyoutside the study area.
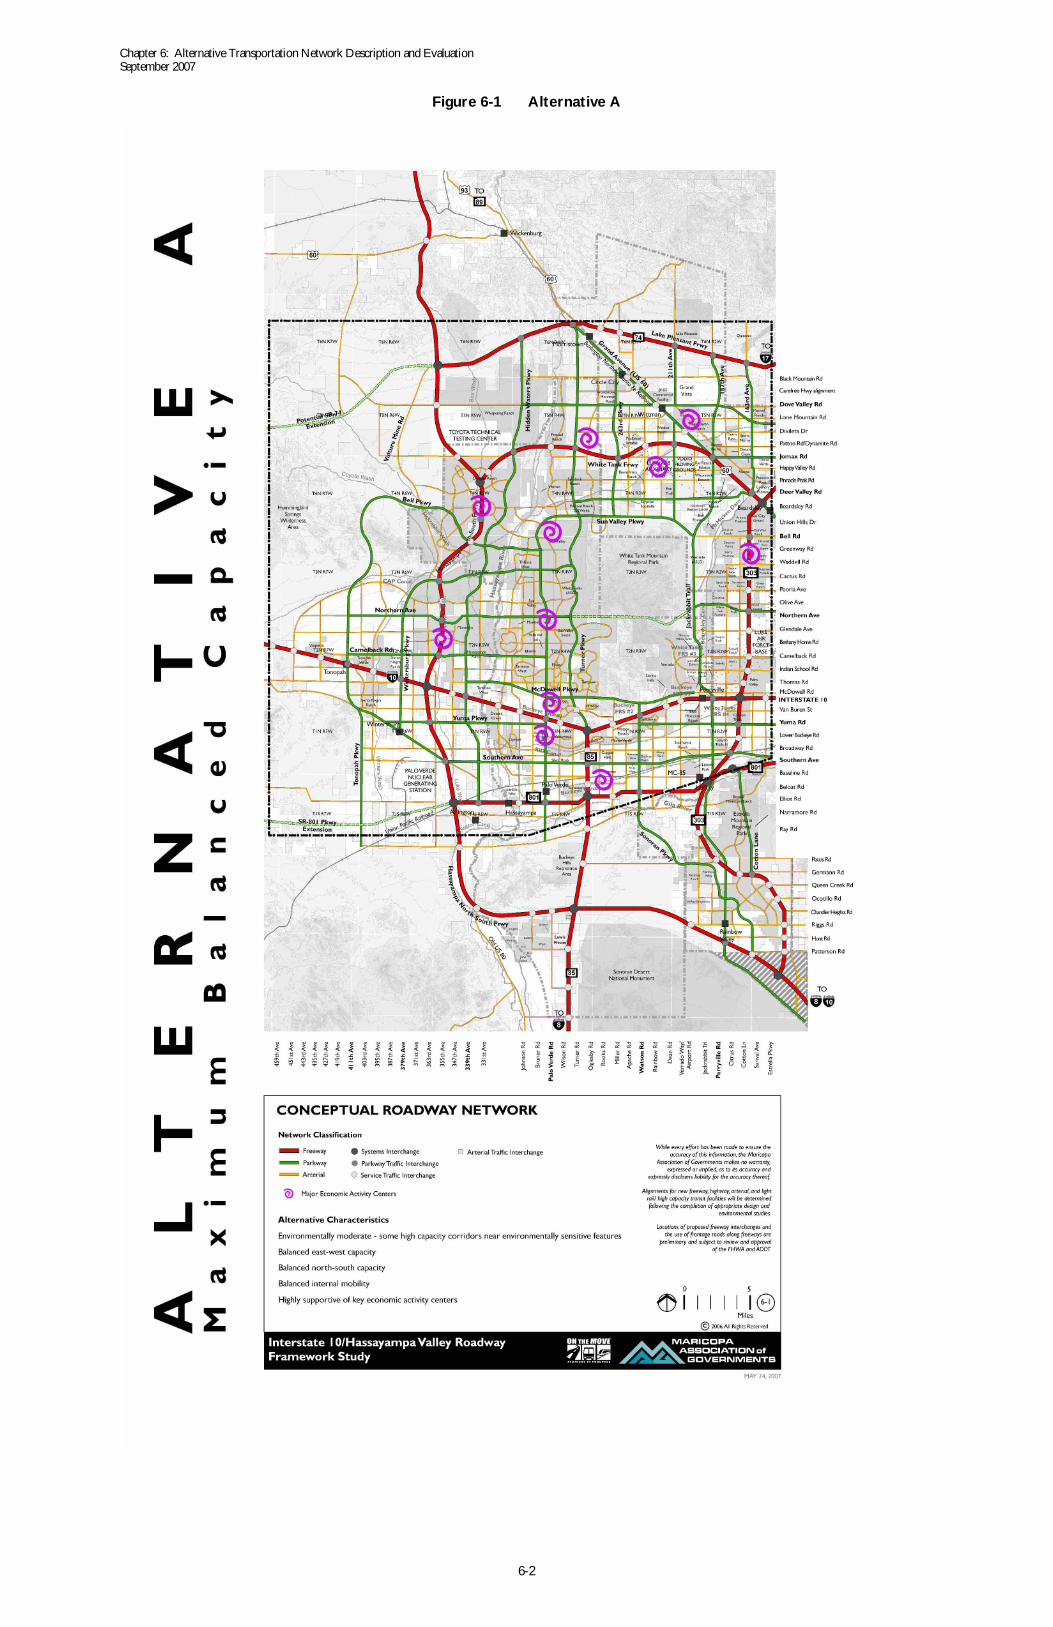
Alternative A, illustrated in Figure 6-1, is the “base” roadway network designed to serve the Hassayampa Valleystudy area under Buildout conditions. The map shows three types of roadway: freeways, arterial streets, and anintermediate facility called a parkway (or boulevard), designed to provide greater capacity than a standardarterial without the high cost and disruptive impacts of a freeway. Alternative A contains several freeways andnumerous parkways that no previous plan has proposed. These include the (mainly north-south) HassayampaFreeway, the east-west White Tanks Freeway, a westward extension of the future SR-74 freeway, and awestward extension of SR-801 beyond SR-85. Proposed local service and system traffic interchange (TI)locations, spaced at least two miles apart wherever possible, are also shown. This alternative is intended toprovide the a high level of geographically balanced capacity to handle long-term travel demand.
The following bullet points enumerate key high-capacity elements (freeways and parkways) of Alternative A.The list does not include facilities already scheduled and funded for construction as part of the currentRegional Transportation Plan (RTP).
Freeways (or similarly designed facilities with fully controlled access and four to five lanes per direction atBuildout):
• Lake Pleasant Freeway, extending along the approximate alignment of existing SR-74 from US-60 tothe east study area boundary, or approximately 15.4 miles. (The RTP funds right-of-way preservationfor a future freeway along SR-74.)
• Lake Pleasant Freeway (SR-74) Extension, generally east-west from US-60 at the north study areaboundary to the Hassayampa Freeway (approximately 10.7 miles).
• Hassayampa Freeway, extending generally north-south from beyond the north study area boundary tothe Gila River (approximately 41.2 miles in the study area). Figure 6-1 also shows this freewaycontinuing south outside the study area, turning east near the Riggs Road section line and extendingtoward the Hidden Valley area of Maricopa and Pinal counties. Regional planners envision thisfreeway as part of a potential future Interstate and international trade route (“I-11”) that could beginat I-10 in Cochise County, bypass the Tucson and Phoenix metropolitan areas, and carry traffic northto a junction with I-15 in the Las Vegas metropolitan area. (ADOT is currently conducting anInterstate 10 Bypass Study to assess the feasibility of this concept.) This corridor could also serve aportion of the north-south CANAMEX International Trade Corridor function in Arizona, from itspotential future junction with either I-8 or I-10 in the MAG Hidden Valley Roadway FrameworkStudy area to its intersection with US 93 near Wickenburg.
• White Tanks Freeway (approximately 24.1 miles). The 19 miles from the Hassayampa Freeway toexisting US-60 would be a primarily east-west facility on an alignment between Happy Valley Roadand Dixileta Drive. The last 5 miles would follow the existing US-60 alignment from roughly JomaxRoad to the junction with SR-303L.
Chapter 6: Alternative Transportation Network Description and EvaluationSeptember 2007
6-2
Figure 6-1 Alternative A

Chapter 6: Alternative Transportation Network Description and EvaluationSeptember 2007
6-3
• SR-85, improved to a full freeway from I-10 south to I-8. (The RTP funds construction of a four-lanedivided highway, with right-of-way preserved for future upgrade to a freeway.)
• Development of SR-801 into a full freeway from SR-303L west to the Hassayampa Freeway, orapproximately 21.8 miles. (The RTP funds right-of-way preservation and construction of an interimroadway as far west as SR-85.)
• An extension of SR-303L from SR-801 beyond the study area boundary to a junction with theHassayampa Freeway.
• Existing I-10 would eventually be widened west of SR-303L to approximately five lanes per direction.Interchanges are proposed for the following locations, generally preserving the minimum two-milespacing between TIs prescribed by ADOT and FHWA policy for Interstate highways:
Ø 459th Avenue (near milepost (MP) 88.2)Ø 443rd Avenue (near MP 90.2)Ø 427th Avenue (near MP 92.2)Ø 411th Avenue/Tonopah Parkway (existing TI at MP 94.2)Ø 395th Avenue (MP 96.3)Ø Wintersburg Parkway (existing TI at MP 98.3)Ø Hassayampa Freeway (system TI at MP 100.5, with potential CANAMEX Corridor route)Ø 347th Avenue (previously approved near MP 102.5)Ø 339th Avenue/Hidden Waters Parkway (existing TI at MP 103.5, and one of two exceptions
to two-mile spacing)Ø Desert Creek Parkway (MP 105.5)Ø Johnson Road (MP 107.6)Ø Sun Valley Parkway/Palo Verde Road (existing TI at MP 109.7)Ø SR-85 (existing TI at MP 112.8; to be completely rebuilt as a system TI including Turner
Parkway as north leg)Ø Miller Road (existing TI at MP 114.9)Ø Watson Road (existing TI at MP 117.0)Ø Dean Road (near MP 119.0)Ø Verrado Way (existing TI near MP 120.0; the second exception to two-mile spacing)Ø Jackrabbit Trail (existing TI at MP 121.7)Ø Perryville Road (near MP 122.7; included in current RTP)Ø SR-303L (existing TI near MP 124.7; to be completely rebuilt as a system TI)
Parkways (intermediate-capacity, six- to eight-lane divided highways with partial access control and no direct leftturns permitted at major intersections), generally spaced every three to five miles:
• 163rd Avenue (north of US-60)• Cotton Lane (SR-801 to SR-303L extension)• Jackrabbit Trail, as a continuous north-south route across the study area east of the White Tank
Mountains• 211th Avenue, Sun Valley Parkway to US-60 and Dove Valley Road to SR-74• Sonoran Parkway (I-10 at Watson Road to SR-303L/Hassayampa Freeway outside study area limits)• 243rd Avenue (Sun Valley Parkway to US-60)• Turner Parkway (I-10 at SR-85 to US-60/Lake Pleasant Freeway)• Sun Valley Parkway (existing Maricopa County route to be improved to full parkway standard; to be
extended south to Gila River via Palo Verde Road alignment)• Hidden Waters Parkway (SR-801 to Lake Pleasant Freeway extension)• Wintersburg Parkway (Tonopah-Salome Parkway to Hassayampa Freeway)• Tonopah Parkway/Vulture Mine Road (future SR-801 extension to future SR-74 extension near
Hassayampa Freeway)• Lone Mountain/Dove Valley Parkway (east study area boundary to Hidden Waters Parkway)

Chapter 6: Alternative Transportation Network Description and EvaluationSeptember 2007
6-4
• Jomax Parkway (east study area boundary to US-60)• Deer Valley Parkway (US-60 to Turner Parkway)• Bell Parkway (Sun Valley Parkway to Tonopah Parkway/Vulture Mine Road)• Waddell/Cactus Parkway (Turner Parkway to Hassayampa Freeway)• Northern Parkway (continuous east-west parkway from Phoenix and Glendale to Tonopah Parkway,
using a tunnel to be constructed through the White Tank Mountains)• Camelback Parkway (Sun Valley Parkway to Tonopah Parkway)• McDowell Parkway (Jackrabbit Trail to Wintersburg Parkway)• Yuma Parkway (east study area boundary to Sonoran Parkway; and Sun Valley Parkway to Tonopah-
Salome Parkway)• Southern Parkway (east study area boundary to Hassayampa Freeway)• Tonopah-Salome Parkway (Hassayampa Freeway to Tonopah Parkway)• Potential long-term extension of SR-74 as a parkway west of Hassayampa Freeway• Potential long-term extension of SR-801 as a parkway west of Hassayampa Freeway
A fully directional system TI would be provided at each junction between freeways. In addition, smaller-scalesystem TIs are envisioned for freeway-parkway junctions, and grade-separated intersections may be provided atjunctions between two parkways. Figure 6-1 also shows a proposed background network of arterial streets thatwould accommodate shorter trips within and between Hassayampa Valley communities. The arterial networkwould most likely be funded by developers in cooperation with local governments.
It is important to recognize that the roadway locations shown in Figure 6-1 are intended to show generalizedcorridors, not specific alignments. All of the routes are subject to modification and refinement as detailedcorridor studies are conducted and local circulation plans are further developed.
Table 6.1 summarizes key characteristics of the base network presented as Alternative A. Figures 6-2 and 6-3illustrate typical parkway design features, including sample cross-sections and the indirect or “Michigan” leftturn concept that MAG and several of its member jurisdictions are considering.
Table 6.1 Summary of Base Network Alternative A
Network Characteristic Description
Anticipated Completion BuildoutTypes of Roadways Included Freeways, Parkways, Arterials
Minimum 200-foot right-of-way60-foot landscaped medianStrong access management with right-in, right-out access predominantMinimum six-lane divided with limited median breaksNo direct left turns at major intersections (replaced by indirect methods:U-turn or multiple rights)Small-scale system TIs at junctions with freeways
Parkway Design Features
Grade separations at major intersections, especially with other parkwaysHigh-Capacity Roads Includes many freeways and parkways not proposed in previous plansNetwork Operation Network based on analysis of deficiencies of MAG RTP network under
Buildout conditionsEast-West Capacity Enhanced with parkway tunnel through White Tank MountainsNorth-South Capacity Balanced, with reasonably frequent and consistent freeway and parkway
spacingInternal Mobility Balanced overallSupport of Economic Activity Centers High, with generally good freeway and parkway accessSpecial Facilities East-west tunnel (parkway) through White Tank Mountains
Source: MAG Study Team, April 2007

Chapter 6: Alternative Transportation Network Description and EvaluationSeptember 2007
6-5
Figure 6-2 Generalized Parkway Cross-Section

Chapter 6: Alternative Transportation Network Description and EvaluationSeptember 2007
6-6
Figure 6-3 Parkway/Arterial Intersection with Indirect Left Turn
Chapter 6: Alternative Transportation Network Description and EvaluationSeptember 2007
6-7
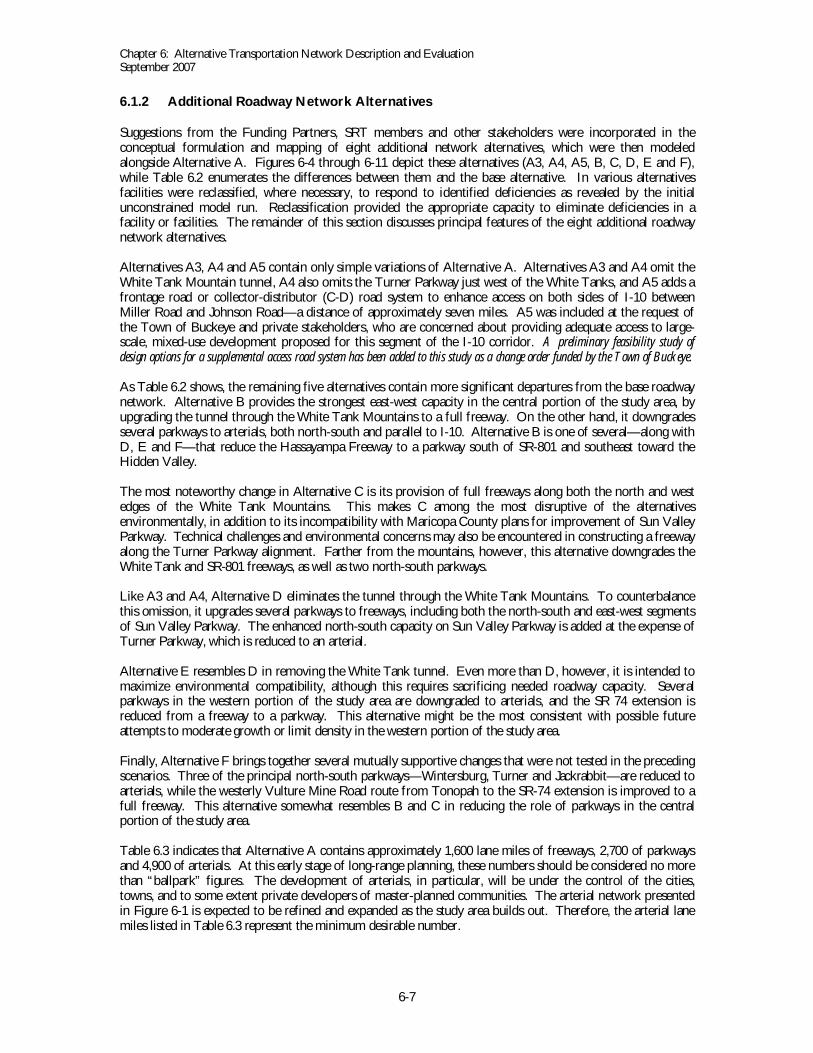
6.1.2 Additional Roadway Network Alternatives
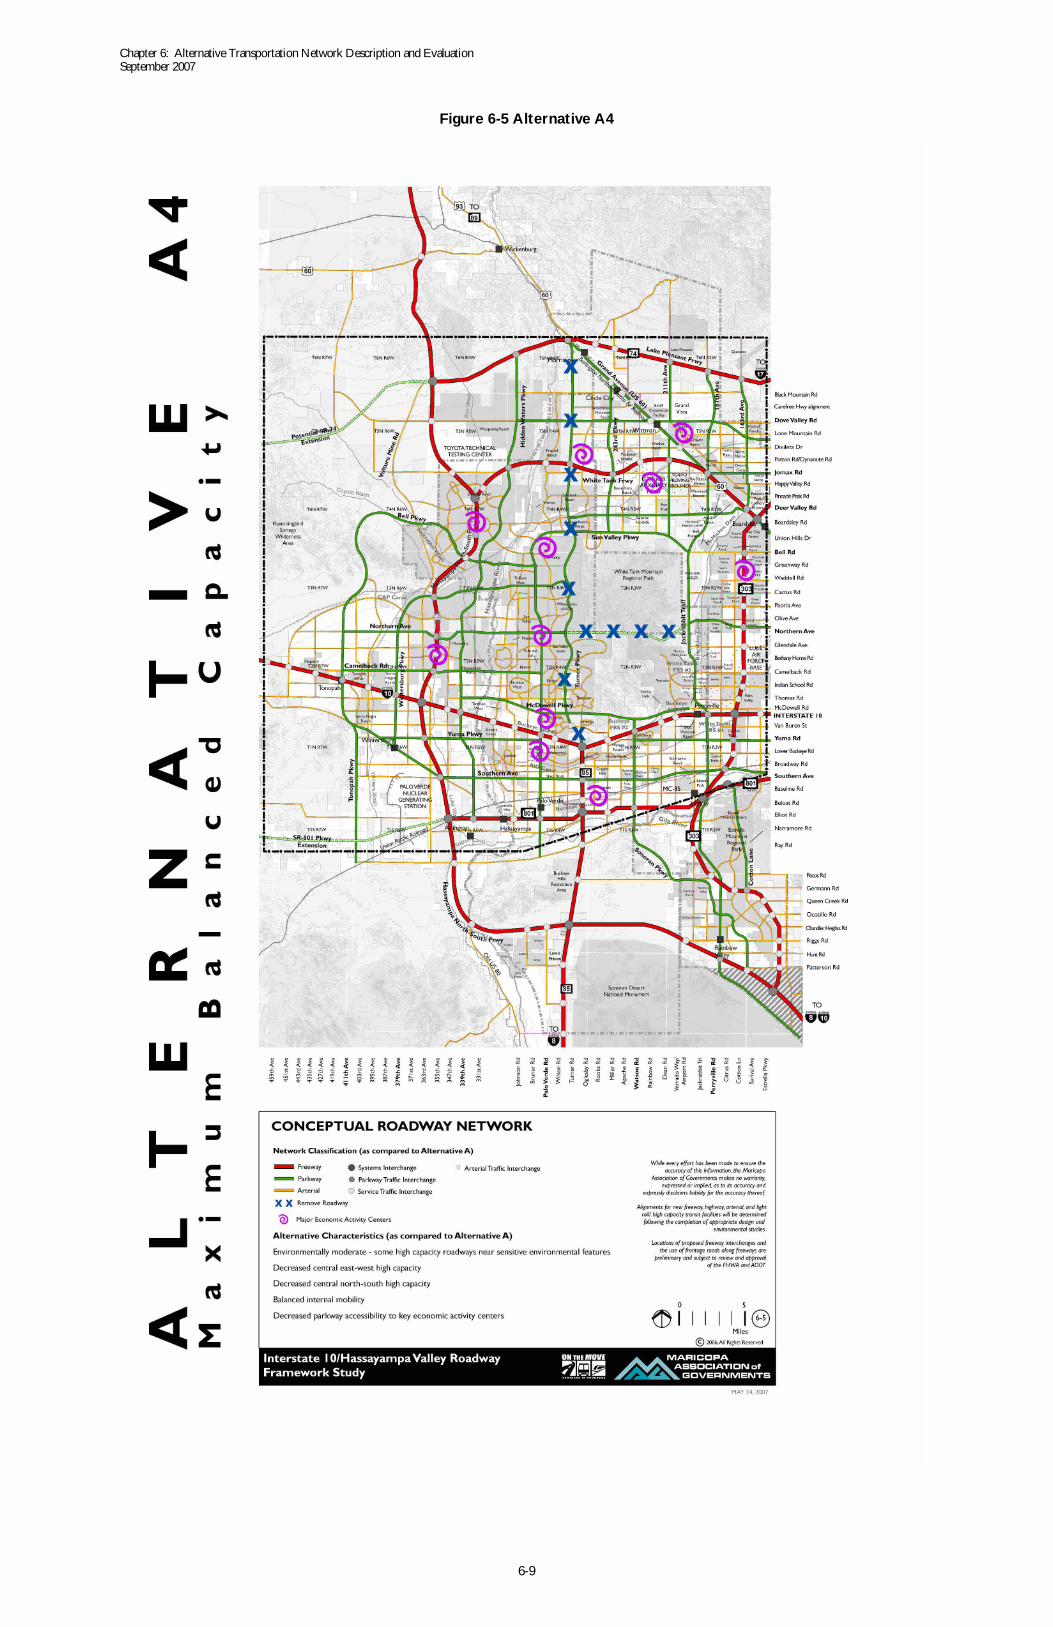
Suggestions from the Funding Partners, SRT members and other stakeholders were incorporated in theconceptual formulation and mapping of eight additional network alternatives, which were then modeledalongside Alternative A. Figures 6-4 through 6-11 depict these alternatives (A3, A4, A5, B, C, D, E and F),while Table 6.2 enumerates the differences between them and the base alternative. In various alternativesfacilities were reclassified, where necessary, to respond to identified deficiencies as revealed by the initialunconstrained model run. Reclassification provided the appropriate capacity to eliminate deficiencies in afacility or facilities. The remainder of this section discusses principal features of the eight additional roadwaynetwork alternatives.
Alternatives A3, A4 and A5 contain only simple variations of Alternative A. Alternatives A3 and A4 omit theWhite Tank Mountain tunnel, A4 also omits the Turner Parkway just west of the White Tanks, and A5 adds afrontage road or collector-distributor (C-D) road system to enhance access on both sides of I-10 betweenMiller Road and Johnson Road—a distance of approximately seven miles. A5 was included at the request ofthe Town of Buckeye and private stakeholders, who are concerned about providing adequate access to large-scale, mixed-use development proposed for this segment of the I-10 corridor. A preliminary feasibility study ofdesign options for a supplemental access road system has been added to this study as a change order funded by the Town of Buckeye.
As Table 6.2 shows, the remaining five alternatives contain more significant departures from the base roadwaynetwork. Alternative B provides the strongest east-west capacity in the central portion of the study area, byupgrading the tunnel through the White Tank Mountains to a full freeway. On the other hand, it downgradesseveral parkways to arterials, both north-south and parallel to I-10. Alternative B is one of several—along withD, E and F—that reduce the Hassayampa Freeway to a parkway south of SR-801 and southeast toward theHidden Valley.
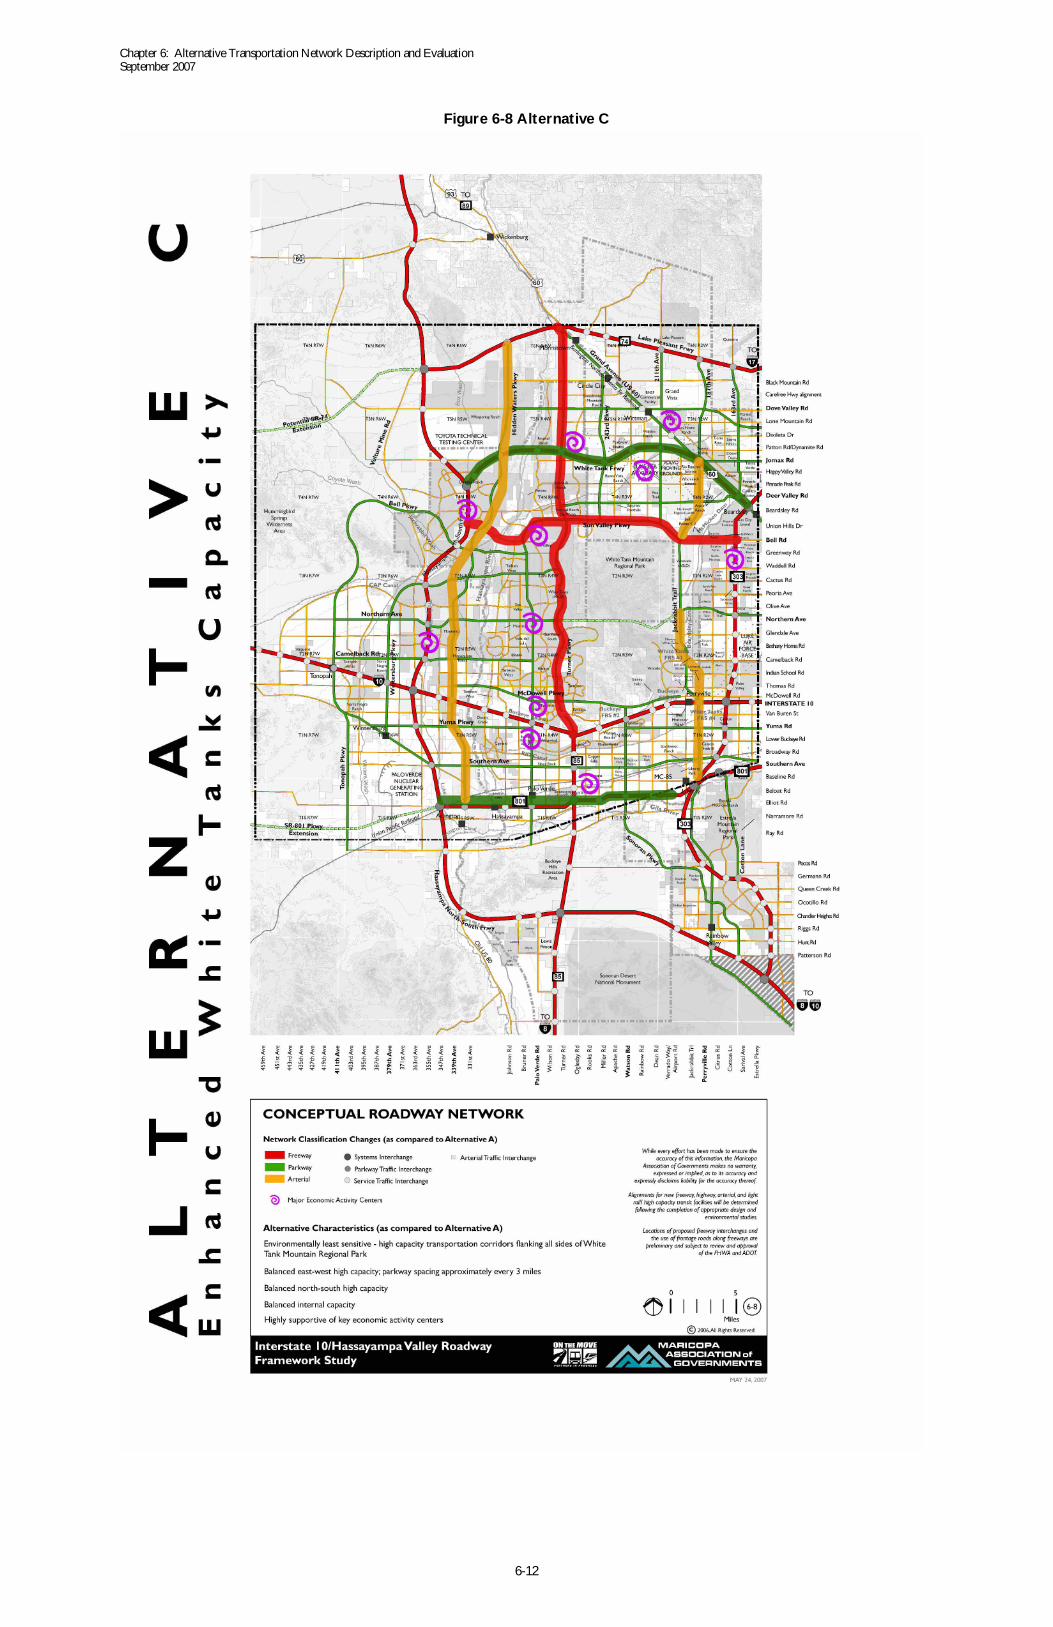
The most noteworthy change in Alternative C is its provision of full freeways along both the north and westedges of the White Tank Mountains. This makes C among the most disruptive of the alternativesenvironmentally, in addition to its incompatibility with Maricopa County plans for improvement of Sun ValleyParkway. Technical challenges and environmental concerns may also be encountered in constructing a freewayalong the Turner Parkway alignment. Farther from the mountains, however, this alternative downgrades theWhite Tank and SR-801 freeways, as well as two north-south parkways.
Like A3 and A4, Alternative D eliminates the tunnel through the White Tank Mountains. To counterbalancethis omission, it upgrades several parkways to freeways, including both the north-south and east-west segmentsof Sun Valley Parkway. The enhanced north-south capacity on Sun Valley Parkway is added at the expense ofTurner Parkway, which is reduced to an arterial.
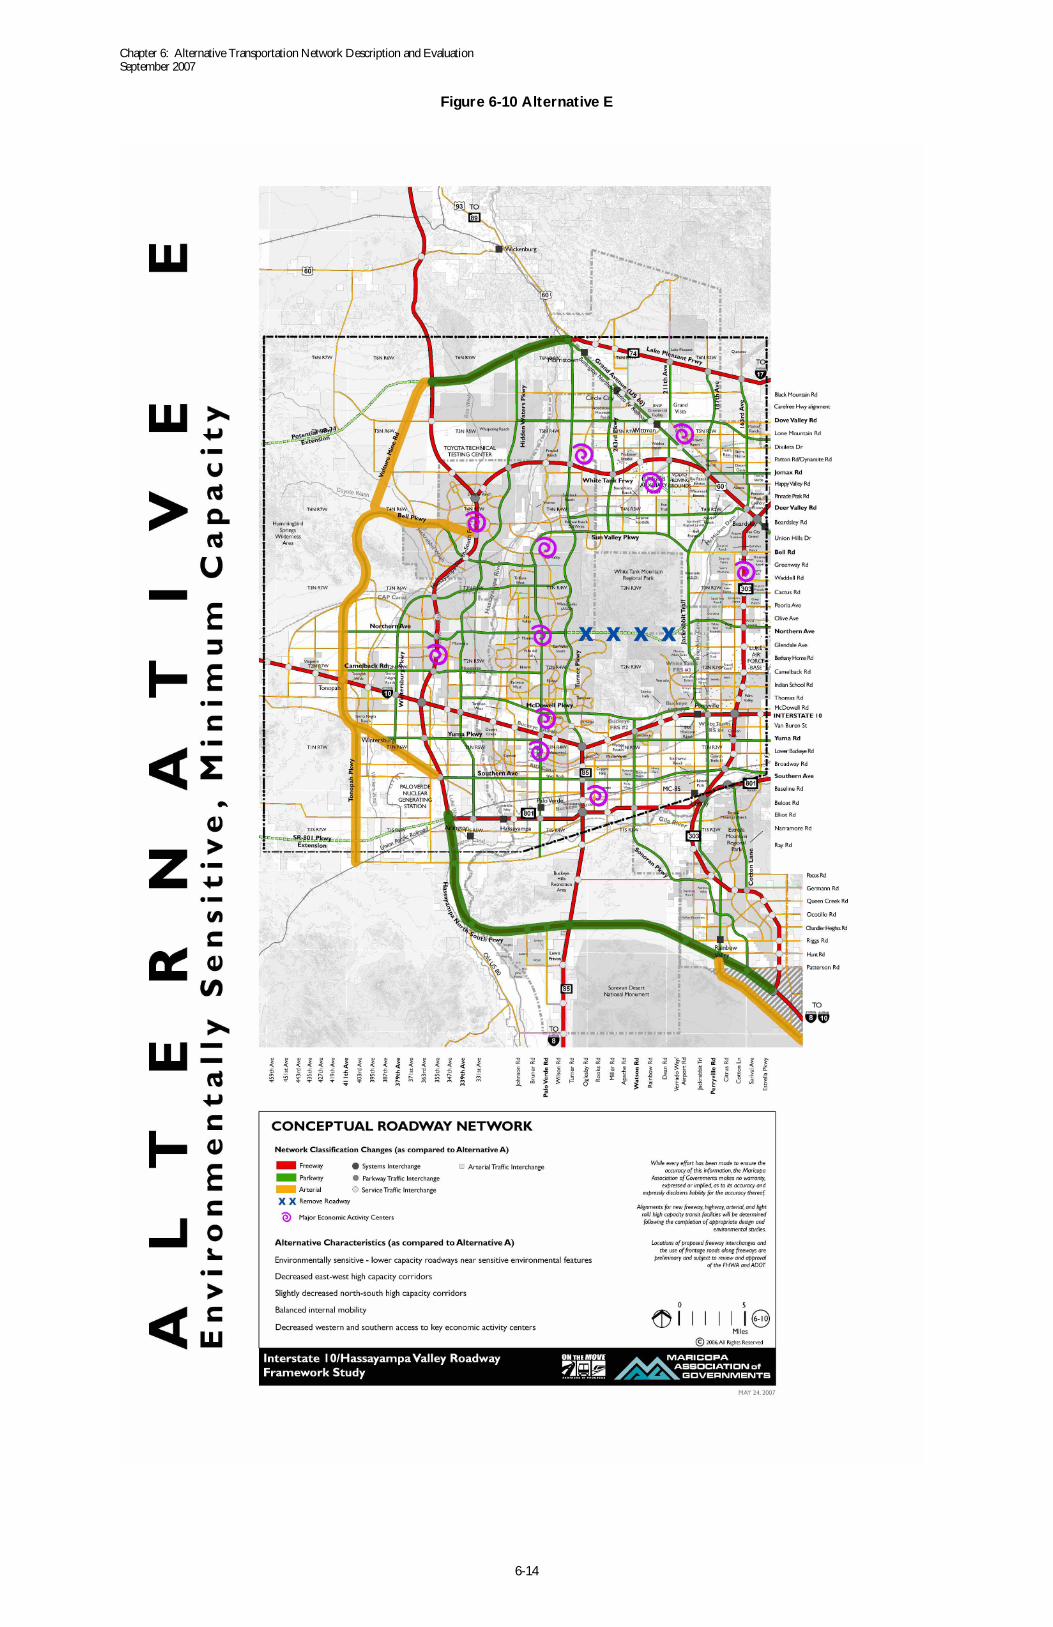
Alternative E resembles D in removing the White Tank tunnel. Even more than D, however, it is intended tomaximize environmental compatibility, although this requires sacrificing needed roadway capacity. Severalparkways in the western portion of the study area are downgraded to arterials, and the SR 74 extension isreduced from a freeway to a parkway. This alternative might be the most consistent with possible futureattempts to moderate growth or limit density in the western portion of the study area.
Finally, Alternative F brings together several mutually supportive changes that were not tested in the precedingscenarios. Three of the principal north-south parkways—Wintersburg, Turner and Jackrabbit—are reduced toarterials, while the westerly Vulture Mine Road route from Tonopah to the SR-74 extension is improved to afull freeway. This alternative somewhat resembles B and C in reducing the role of parkways in the centralportion of the study area.
Table 6.3 indicates that Alternative A contains approximately 1,600 lane miles of freeways, 2,700 of parkwaysand 4,900 of arterials. At this early stage of long-range planning, these numbers should be considered no morethan “ballpark” figures. The development of arterials, in particular, will be under the control of the cities,towns, and to some extent private developers of master-planned communities. The arterial network presentedin Figure 6-1 is expected to be refined and expanded as the study area builds out. Therefore, the arterial lanemiles listed in Table 6.3 represent the minimum desirable number.

Chapter 6: Alternative Transportation Network Description and EvaluationSeptember 2007
6-8
Figure 6-4 Alternative A3
Chapter 6: Alternative Transportation Network Description and EvaluationSeptember 2007
6-9
Figure 6-5 Alternative A4

Chapter 6: Alternative Transportation Network Description and EvaluationSeptember 2007
6-10
Figure 6-6 Alternative A5

Chapter 6: Alternative Transportation Network Description and EvaluationSeptember 2007
6-11
Figure 6-7 Alternative B
Chapter 6: Alternative Transportation Network Description and EvaluationSeptember 2007
6-12
Figure 6-8 Alternative C

Chapter 6: Alternative Transportation Network Description and EvaluationSeptember 2007
6-13
Figure 6-9 Alternative D
Chapter 6: Alternative Transportation Network Description and EvaluationSeptember 2007
6-14
Figure 6-10 Alternative E

Chapter 6: Alternative Transportation Network Description and EvaluationSeptember 2007
6-15
Figure 6-11 Alternative F

Chapter 6: Alternative Transportation Network Description and EvaluationSeptember 2007
6-16
Table 6.2 Differences Between Base Alternative A and Other Alternatives
AlternativesNetworkCharacteristics A3 A4 A5 B C D E F
Degree of Difference Minor, excepttunnel omitted
Minor, except tunnelomitted
Minor Substantial Substantial Substantial Substantial Substantial
Roadway Upgrades None None None -Northern Parkwaynow freeway(HassayampaFreeway to SR-303)-US-60 now freeway(White TanksFreeway to SR-74)
-Turner, Sun ValleyParkway (east-west),Bell Parkway (e. ofHassayampaFreeway) nowfreeways
-To freeway: SunValley Parkway, BellParkway, VultureMine Rd (s. of BellParkway)
None Vulture MineFreeway
Roadway Downgrades None None None -HassayampaFreeway nowparkway (s. of SR-801)-Parkways becomearterials:Wintersburg,McDowell, Yuma,Jackrabbit (I-10 toUS-60)
-White TanksFreeway, most of SR-801, all of US-60 nowparkways-Parkways becomearterials: HiddenWaters, Jackrabbit(SR-801 to Northern& Sun Valley Parkwayto US-60)
-HassayampaFreeway nowparkway (s. of SR-801)-Turner Parkwaynow arterial (s. ofSun Valley Parkway)
-HassayampaFreeway nowparkway (s. of SR-801)-SR-74 extensionalso parkway, notfreeway-Parkways becomearterials w. ofHassayampaFreeway: VultureMine Rd, Tonopah &Tonopah-SalomeParkways, BellParkway
-HassayampaFreeway nowparkway (s. of SR-801)-Parkways becomearterials:Wintersburg, Turner(s. of Sun ValleyParkway), Jackrabbit(I-10 to US-60)
Other Differences No tunnel -No tunnel-No Turner Parkway
Frontage or C-D roadsystem along I-10between Johnson,Miller rds
Tunnel upgradedfrom parkway tofreeway
None No tunnel No tunnel None
Environmental Similar toAlt A
Similar toAlt A
Similar to Alt A Greater potentialimpact to WhiteTank Regional Park
Greatest potentialimpact to WhiteTank Regional Park
Generally moderate,similar to Alt A
Most sensitive toenvironment
Generally moderate,similar to Alt A
East-West Capacity Decreased incentral area
Decreased in centralarea
Similar to Alt A Highly balanced Similar to Alt A Decreased in centralarea
Significantlydecreased
Similar to Alt A
North-South Capacity Similar toAlt A
Decreased (noTurner Parkway)
Similar toAlt A
Decreased (roaddowngrades)
Similar to Alt A Similar to Alt A Slightly decreased Reduced parkwaydensity
Internal Mobility Similar toAlt A
Similar toAlt A
Similar to Alt A Similar to Alt A Similar to Alt A Similar to Alt A Similar to Alt A Enhanced in centralstudy area
Support of EconomicActivity Centers
Similar toAlt A
Decreased parkwayaccessibility
May be higher alongportion of I-10corridor
Similar to Alt A Similar to Alt A Similar to Alt A Decreased western& southern access
Decreased parkwayaccessibility
Source: MAG Study Team, April 2007

Chapter 6: Alternative Transportation Network Description and EvaluationSeptember 2007
6-17
Table 6.3 Total Lane Miles in Study Area by Alternative and Facility Class
Lane Miles by Alternative*ClassA A3 A4 A5 B C D E F
Freeway 1,628 1,628 1,628 1,628 1,735 1,747 1,891 1,518 1,603Parkway 2,662 2,608 2,379 2,662 2,033 2,224 2,178 2,329 2,226Arterial 4,949 4,949 4,919 5,025 5,362 5,315 5,047 5,281 5,257Total 9,239 9,185 8,926 9,315 9,130 9,286 9,116 9,128 9,086
*Includes existing facilitiesSource: MAG Study Team, April 2007
6.2 Tiered Evaluation of Alternatives
The I-10/Hassayampa Valley roadway network alternatives were evaluated in a two-tiered process by applyingthe criteria and performance measures developed in Chapter 3. In Tier 1, the nine original alternatives werescreened down to five, using only the safety and mobility criteria. The more detailed Tier 2 evaluation used allof the criteria and performance measures to evaluate the remaining alternatives in more depth, and to select apreferred alternative.
The (quantitative) safety and mobility portion of the evaluation was conducted by applying constrained traveltimes, based on roadway link capacities identified within the network and the effects of congestion. Traveltime constraints recognized the differing functional characteristics of the alternative networks, permittingplanners to equilibrate the magnitude of traffic flows and patterns. In effect, imposing travel time constraintsrecognized specific limitations of network links and enabled the Study Team to identify deficiencies and definepotential opportunities for improvements.
6.2.1 Tier 1 Screening
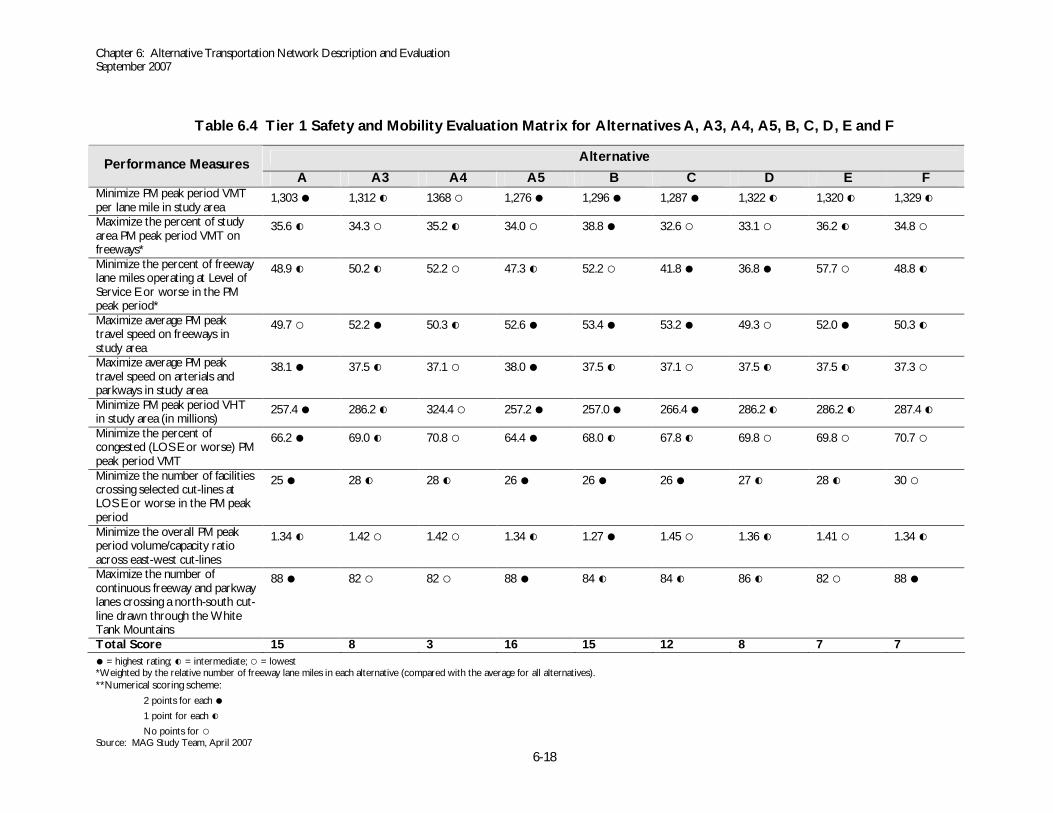
Table 6.4 shows how Alternatives A, A3, A4, A5, B, C, D, E and F were first evaluated using the ten safety andmobility criteria introduced in Chapter 3. The left column of the table lists the performance measuresassociated with the pertinent evaluation criteria from that document. As in Chapter 3, each performancemeasure is phrased in the form of an objective involving measurement of a specific characteristic. Theremaining columns report the numerical performance of the alternatives and compare their scores with eachother. For some measures of effectiveness (e.g., travel speed) a higher number means superior performance.In other cases, such as vehicle hours of travel (an indicator of congestion), a lower number is better.
The MAG Study Team then translated each numerical score into either a full circle ( ), a half circle ( ), or anempty circle ( ). The alternatives with the best performance were assigned a full circle, while those that faredworst were given an empty circle. In each case, the intermediate group received a half circle. The distributionof circles among alternatives followed logical breaks between groupings whenever possible. In two cases, forexample, only one alternative (that clearly stood out from the rest) was assigned to the highest-performinggroup ( ).
The next step in this portion of the evaluation consisted of computing streamlined point scores for eachalternative. A value of two points was assigned to each full circle ( ) and one point to each half circle ( ).Alternatives in the poorest-performing group ( ) received no points. Finally, the team calculated the total scorefor each alternative by adding the partial scores across rows.
The last row of Table 6.4 shows a clear division into a higher-performing group of alternatives and a lower-performing group. Four of the alternatives (A, A5, B and C) have scores of 12 to 16, while the remaining fivehave scores of 3 to 8. The most obvious common element of the four highest-scoring alternatives is the WhiteTank Mountain tunnel. Although Alternative F also includes the tunnel, this scenario has fewer total roadwayand freeway lane miles than the other four. This alternative upgrades only one lower-level facility to a freeway:Vulture Mine Road corridor, which is located in a peripheral area.
Chapter 6: Alternative Transportation Network Description and EvaluationSeptember 2007
6-18
Table 6.4 Tier 1 Safety and Mobility Evaluation Matrix for Alternatives A, A3, A4, A5, B, C, D, E and F
AlternativePerformance MeasuresA A3 A4 A5 B C D E F
Minimize PM peak period VMTper lane mile in study area
1,303 1,312 1368 1,276 1,296 1,287 1,322 1,320 1,329
Maximize the percent of studyarea PM peak period VMT onfreeways*
35.6 34.3 35.2 34.0 38.8 32.6 33.1 36.2 34.8
Minimize the percent of freewaylane miles operating at Level ofService E or worse in the PMpeak period*
48.9 50.2 52.2 47.3 52.2 41.8 36.8 57.7 48.8
Maximize average PM peaktravel speed on freeways instudy area
49.7 52.2 50.3 52.6 53.4 53.2 49.3 52.0 50.3
Maximize average PM peaktravel speed on arterials andparkways in study area
38.1 37.5 37.1 38.0 37.5 37.1 37.5 37.5 37.3
Minimize PM peak period VHTin study area (in millions)
257.4 286.2 324.4 257.2 257.0 266.4 286.2 286.2 287.4
Minimize the percent ofcongested (LOS E or worse) PMpeak period VMT
66.2 69.0 70.8 64.4 68.0 67.8 69.8 69.8 70.7
Minimize the number of facilitiescrossing selected cut-lines atLOS E or worse in the PM peakperiod
25 28 28 26 26 26 27 28 30
Minimize the overall PM peakperiod volume/capacity ratioacross east-west cut-lines
1.34 1.42 1.42 1.34 1.27 1.45 1.36 1.41 1.34
Maximize the number ofcontinuous freeway and parkwaylanes crossing a north-south cut-line drawn through the WhiteTank Mountains
88 82 82 88 84 84 86 82 88
Total Score 15 8 3 16 15 12 8 7 7 = highest rating; = intermediate; = lowest
*Weighted by the relative number of freeway lane miles in each alternative (compared with the average for all alternatives).**Numerical scoring scheme:
2 points for each
1 point for each
No points forSource: MAG Study Team, April 2007
Chapter 6: Alternative Transportation Network Description and EvaluationSeptember 2007
6-19
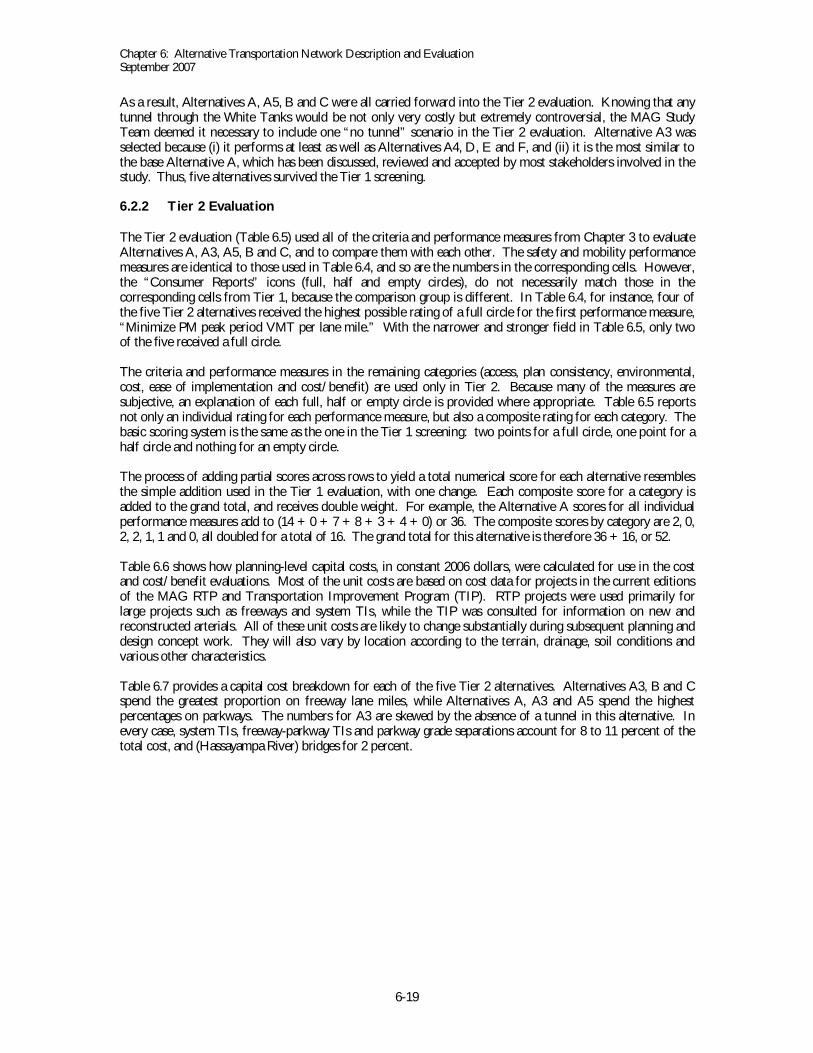
As a result, Alternatives A, A5, B and C were all carried forward into the Tier 2 evaluation. Knowing that anytunnel through the White Tanks would be not only very costly but extremely controversial, the MAG StudyTeam deemed it necessary to include one “no tunnel” scenario in the Tier 2 evaluation. Alternative A3 wasselected because (i) it performs at least as well as Alternatives A4, D, E and F, and (ii) it is the most similar tothe base Alternative A, which has been discussed, reviewed and accepted by most stakeholders involved in thestudy. Thus, five alternatives survived the Tier 1 screening.
6.2.2 Tier 2 Evaluation
The Tier 2 evaluation (Table 6.5) used all of the criteria and performance measures from Chapter 3 to evaluateAlternatives A, A3, A5, B and C, and to compare them with each other. The safety and mobility performancemeasures are identical to those used in Table 6.4, and so are the numbers in the corresponding cells. However,the “Consumer Reports” icons (full, half and empty circles), do not necessarily match those in thecorresponding cells from Tier 1, because the comparison group is different. In Table 6.4, for instance, four ofthe five Tier 2 alternatives received the highest possible rating of a full circle for the first performance measure,“Minimize PM peak period VMT per lane mile.” With the narrower and stronger field in Table 6.5, only twoof the five received a full circle.
The criteria and performance measures in the remaining categories (access, plan consistency, environmental,cost, ease of implementation and cost/benefit) are used only in Tier 2. Because many of the measures aresubjective, an explanation of each full, half or empty circle is provided where appropriate. Table 6.5 reportsnot only an individual rating for each performance measure, but also a composite rating for each category. Thebasic scoring system is the same as the one in the Tier 1 screening: two points for a full circle, one point for ahalf circle and nothing for an empty circle.
The process of adding partial scores across rows to yield a total numerical score for each alternative resemblesthe simple addition used in the Tier 1 evaluation, with one change. Each composite score for a category isadded to the grand total, and receives double weight. For example, the Alternative A scores for all individualperformance measures add to (14 + 0 + 7 + 8 + 3 + 4 + 0) or 36. The composite scores by category are 2, 0,2, 2, 1, 1 and 0, all doubled for a total of 16. The grand total for this alternative is therefore 36 + 16, or 52.
Table 6.6 shows how planning-level capital costs, in constant 2006 dollars, were calculated for use in the costand cost/benefit evaluations. Most of the unit costs are based on cost data for projects in the current editionsof the MAG RTP and Transportation Improvement Program (TIP). RTP projects were used primarily forlarge projects such as freeways and system TIs, while the TIP was consulted for information on new andreconstructed arterials. All of these unit costs are likely to change substantially during subsequent planning anddesign concept work. They will also vary by location according to the terrain, drainage, soil conditions andvarious other characteristics.
Table 6.7 provides a capital cost breakdown for each of the five Tier 2 alternatives. Alternatives A3, B and Cspend the greatest proportion on freeway lane miles, while Alternatives A, A3 and A5 spend the highestpercentages on parkways. The numbers for A3 are skewed by the absence of a tunnel in this alternative. Inevery case, system TIs, freeway-parkway TIs and parkway grade separations account for 8 to 11 percent of thetotal cost, and (Hassayampa River) bridges for 2 percent.

Chapter 6: Alternative Transportation Network Description and EvaluationSeptember 2007
6-20
Table 6.5 Detailed Tier 2 Evaluation Matrix for Alternatives A, A3, A5, B and C
Alternative*Performance MeasuresA A3 A5 B C
Safety & MobilityMinimize PM peak period VMTper lane mile in study area
1,303 1,312 1,276 1,296 1,287
Maximize the percent of studyarea PM peak period VMT onfreeways**
35.6 34.3 34.0 38.8 32.6
Minimize the percent offreeway lane miles operating atLevel of Service E or worse inthe PM peak period**
48.9 50.2 47.3 52.2 41.8
Maximize average PM peaktravel speed on freeways instudy area
49.7 52.2 52.6 53.4 53.2
Maximize average PM peaktravel speed on arterials andparkways in study area
38.1 37.5 38.0 37.5 37.1
Minimize PM peak period VHTin study area
257.4 million 286.2 million 257.2 million 257.0 million 266.4 million
Minimize the percent ofcongested (LOS E or worse)PM peak period VMT
66.2 69.0 64.4 68.0 67.8
Minimize the number offacilities crossing selected cut-lines at LOS E or worse in thePM peak period
25 28 26 26 26
Minimize the overall PM peakperiod volume/capacity ratioacross east-west cut-lines
1.34 1.42 1.34 1.27 1.45
Maximize the number ofcontinuous freeway andparkway lanes crossing anorth-south cut-line drawnthrough the White TankMountains
88 82 88 84 84
Composite (counts double)
Safety & Mobility Total 18 3 19 17 12

Chapter 6: Alternative Transportation Network Description and EvaluationSeptember 2007
6-21
Table 6.5 – Continued
Alternative*Performance MeasuresA A3 A5 B C
AccessMaximize the percent of studyarea residents within twomiles of a (local service)freeway TI
41% 41% 41% 49% 48%
Maximize the percent of studyarea employment within twomiles of a (local service)freeway TI
54% 54% 54% 64% 53%
Composite (counts double)
Access Total 0 0 0 8 4Plan ConsistencyMaximize land use planningconsistency1
Overall
Component I =
Component II =Component III =
Overall (same as A) Overall(Similar to A, but I evenbetter due to frontageroads)
Overall
Component I =
Component II =Component III =
Overall
Component I =
Component II =Component III =
Maximize circulation planningconsistency2
Maximize consistency withjurisdictional economicdevelopment plans3
34 points5 primary centers onfreeways (20 points); 1on parkway (3 points);4 secondary centers onfreeways (8); 3 onparkways (3)
34 points (same as A) 36 pointsSame as A, but extrapoints due to frontageroads along I-10 inBuckeye area
37 points6 primary centers onfreeways (24 points);6 secondary centers onfreeways (12); 1secondary on parkway(1)
35 points5 primary centers onfreeways (20 points); 1on parkway (3);5 secondary centers onfreeways (10); 2 onparkways (2)
Maximize consistency withdevelopment master plans
Base alternativedesigned forconsistency &consensus
Similar to A, but notunnel
Similar to A, but I-10frontage roads furtherimprove access
Additional freewayscreate conflicts alongGrand & Northern Avecorridors
Sun Valley & Turnerfreeways totallyinconsistent w/ ASLD &other plans
Composite (counts double)
Plan Consistency Total 11 11 12 7 1

Chapter 6: Alternative Transportation Network Description and EvaluationSeptember 2007
6-22
Table 6.5 - Continued
Alternative*Performance MeasuresA A3 A5 B C
EnvironmentalMinimize impacts to existingcanals and flood controlstructures
Parkway acrossMcMicken Dam;Jackrabbit is parkway;McDowell & Yuma Rdsare parkways
Similar to A Similar to A Parkway acrossMcMicken Dam;Jackrabbit is arterial;McDowell & Yuma arearterials
Freeway acrossMcMicken Dam; part ofJackrabbit is parkway;McDowell & Yuma areparkways;
Minimize impacts associatedwith crossing of floodplains ordisturbance of drainagefeatures, including Waters ofthe U.S. under jurisdiction ofthe U.S. Army Corps ofEngineers
Hidden WatersParkway; 4 new freewayriver crossings; WhiteTanks Freeway crossingdifficult
Similar to A Similar to A Similar to A (still 4new freeway rivercrossings Safety &Mobility ; Northerninstead of HassayampaFreeway)
Hidden Watersbecomes arterial; only 3new freeway rivercrossings
Minimize impacts to resourcesprotected under Section 4(f)or 6(f)4
Tunnel (parkway) No tunnel; leastintrusive to regionalpark
Similar to A Tunnel (freeway);highly intrusive to park
Parkway tunnel, plusfreeways near north &west sides of park
Minimize impacts to areascontaining known or likelyhabitat for Threatened,Endangered and othersensitive species
Tunnel (parkway) No tunnel; leastintrusive to regionalpark
Similar to A Tunnel (freeway), butarterials only onMcDowell Rd &Wintersburg alignment;parkway only on Hass.Freeway alignmentsouth of Gila
Parkway tunnel, plusfreeways near north &west sides of park
Minimize impacts to wildlifecorridors5
50 parkway crossingequivalents
50 parkway crossingequivalents
50 parkway crossingequivalents
56 parkway crossingequivalents
53 parkway crossingequivalents
Air quality: Minimize PM peakVHT in the study area (usedalso as a mobility criterion)
257.4 million 286.2 million 257.2 million 257.0 million 266.4 million
Composite (counts double)
Environmental Total 12 12 12 8 4

Chapter 6: Alternative Transportation Network Description and EvaluationSeptember 2007
6-23
Table 6.5 - Continued
Alternative*Performance MeasuresA A3 A5 B C
Cost
Minimize capital cost6 $21.44 billion $19.16 billion $21.53 billion7 $21.45 billion $21.54 billionMinimize operating andmaintenance cost
1,444 new freewaylane miles5,375 new parkway/artlane miles7 system TIsTunnel parkway
1,444 new freewaylane miles5,321 new parkway/artlane miles7 system TIsNo tunnel
1,444 new freewaylane miles5,451 new parkway/artlane miles7 system TIsTunnel--parkway
1,551 new freewaylane miles5,159 new parkway/artlane miles10 system TIsTunnel freeway
1,563 new freewaylane miles5,303 new parkway/artlane miles7 system TIsTunnel parkway
Minimize right-of-way cost 1,444 new freewaylane miles
1,444 new freewaylane miles
1,444 new freewaylane miles
1,551 new freewaylane miles
1,563 new freewaylane miles
Composite8 (counts double)
Cost Total 5 10 5 1 2Ease of ImplementationObtain strong support fromthe Study Review Team &Funding Partners
Base developed withFunding Partners & SRT
Same as A withouttunnel
I-10 frontage roadsnot unanimouslysupported
Grand Ave freeway;freeway tunnel; removalof needed freewaysegments
Turner freeway; nofreeway along 801; noWhite Tanks Freeway
Maximize the likelihood ofacceptance by outsideagencies, stakeholders & thecommunity
Tunnel No tunnel Tunnel & frontageroads
Freeway tunnelthrough White Tanks
Tunnel plus SunValley & Turnerfreeways
Minimize any legal orinstitutional barriers that maymake one alternative harderto implement than others
Tunnel; Proximity toPalo Verde nuclearplant common to all alts
No tunnel Similar to A Similar to A Tunnel; Bell Rd asfreeway over McMickenDam
Composite (counts double)
Ease of ImplementationTotal
6 10 5 1 0
Cost/BenefitMinimize “planning-level”capital cost per PM peakVMT accommodated(counts double)
$1,781 $1,590 $1,812 $1,813 $1,803
Cost/Benefit Total 0 4 0 0 0Grand Total Score 52 50 53 42 23

Chapter 6: Alternative Transportation Network Description and EvaluationSeptember 2007
6-24
Table 6.5 - Continued
= highest rating; = intermediate; = lowest
*Numerical scoring scheme: 2 points for each 1 point for each No points for Scores in composite rows (including /cost/benefit) are doubled
**Weighted by the relative number of freeway lane miles in each alternative (compared with the average for all alternatives).
1I = Roadway network compatibility with (existing and proposed) adjacent land uses II = Balanced facility spacing (approximately 8-10 miles for freeways; 3-4 miles for arterials)III = Consistency with jurisdictional land use and circulation plan elements
2Based on consistency with jurisdictional land use and circulation plan elements (component #III above).
3Primary activity center on freeway = 4 points; primary center on parkway = 3 points; secondary activity center on freeway = 2 points; secondarycenter on parkway = 1 point
4Section 4(f) of the U.S Department of Transportation Act and Section 6(f) of the Land and Water Conservation Fund Act (LWCFA) provide certainprotections for land acquired and developed for public recreational purposes. Section 4(f) applies to federally funded transportation projects, andprojects on federal land, with a potential impact on recreational resources. Section 6(f) applies to all projects, whether federally funded or not, thatmay affect land acquired under the LWCFA.
5Based on the number of freeway and parkway intersections with wildlife linkage zones, according to ADOT Wildlife Linkages Assessment mapping. Afreeway crossing is considered the equivalent of three parkway crossings.
6Based on planning-level unit costs for new freeway lane miles, parkway lane miles, arterial lane miles, bridges (river crossings), new system TIs, andparkway grade separations; and on estimated tunnel cost of $140,000 per linear foot for two four-lane bores using New Austrian Tunneling Method.Costs are in constant 2006 dollars and based primarily on projects in the MAG Transportation Improvement Program and Regional TransportationPlan. See Table 6.6 for details.
7Does not include additional allowance for frontage roads or C-D road system along a portion of I-10.
8Capital cost is the predominant element in determining the composite rating.
Source: MAG Study Team, April 2007

Chapter 6: Alternative Transportation Network Description and EvaluationSeptember 2007
6-25
Table 6.6 Derivation of Planning-Level Capital Cost*
Cost Element Estimated CostPer Unit Source of Estimate
Lane Mile Freeway** $7 million MAG RTP: SR-303L and SR-801Lane Mile Parkway*** $1.5 million 150% of arterial costLane Mile Arterial $1.0 million 10 projects in MAG TIP and RTPSystem TI (Freeway-Freeway) $50 million 2 projects in RTP: SR-303L at I-17 and I-10Freeway-Parkway TI $30 million Scaled down from freeway-freeway (system) TIParkway Grade Separation $15 million Scaled down from freeway-freeway (system) TIHassayampa River Bridge $20 million Based on 2 projects in MAG TIPTunnel (White Tank Mountains) $2.218 billion 3-mile tunnel, based on MAG estimate of $140,000
per linear foot for twin four-lane bores, using NewAustrian Tunneling Method
*2006 dollars**Includes local service TIs***Includes all capital costs except for freeway-parkway TIs and parkway grade separations
6.2.3 Results and Recommendation
The last line of Table 6.5 gives the total score of each Tier 2 alternative based on all the evaluation criteria andperformance measures. Alternative C performs poorly in most evaluation categories and lags far behind theothers, with only 23 points. Alternative B performs much better than C, with 42 points—partly because thefreeway tunnel improves its mobility score—but not as well as A, A3 or A5. Of these three, only AlternativeA3 lacks the White Tank Mountain tunnel. The resulting cost saving partially counterbalances the low mobilityoffered by this scenario.
Alternatives A, A3 and A5 all have total scores from 50 to 53 points. Because of the expected controversy overthe White Tank tunnel, two options are recommended for further planning:
• Alternative A3 (no tunnel), but with the frontage road or C-D road element of Alternative A5 addedto meet the needs of the Town of Buckeye.
• Alternative A5, in case a tunnel turns out to be acceptable and affordable at a future date, based onthe preparation of a detailed feasibility study and more extensive discussion with potentially affectedstakeholders.

Chapter 6: Alternative Transportation Network Description and EvaluationSeptember 2007
6-26
Table 6.7 Planning-Level Capital Cost Breakdown by Alternative
Cost ($Million) and Percent of Total by Alternative
A A3 A5 B CElement
Cost Percent Cost Percent Cost Percent Cost Percent Cost PercentFreeways1 $10,108 47 $10,108 53 $10,1082 47 $10,857 51 $10,941 51Parkways 3,993 19 3,912 20 3,993 19 3,050 14 3,336 15Arterials 2,713 13 2,713 14 2,789 13 3,126 15 3,079 14TIs (except local service) 2,045 9 2,045 11 2,045 9 1,820 8 1,610 8 System 350 2 350 2 350 2 500 2 350 2 Freeway-Parkway 960 4 960 5 960 4 900 4 870 4Parkway GradeSeparations
735 3 735 4 735 3 420 2 390 2
Bridges 360 2 380 2 380 2 380 2 360 2White Tank Tunnel 2,218 10 0 0 2,218 10 2,218 10 2,218 10Total $21,437 100 $19,158 100 $21,533 100 $21,451 100 $21,544 100
1Freeway capital cost per lane mile is based on programmed cost (from the MAG RTP) for portions of the SR-303L and SR-801 freeways. TIs along these freeways will typically be one mileapart, whereas the spacing on freeways in the Hassayampa Valley study area will generally be two miles. However, this apparent cost saving will be offset by the construction of additionalgrade-separated crossings (approximately two per mile) on study area freeways.
2Does not include additional allowance for frontage roads or C-D road system along a portion of I-10. Municipalities and benefiting property owners will bear this cost through cost-sharing arrangements to be established after detailed planning and design.
Source: MAG Study Team, April 2007


