Meso-Scale Simulation and Measurement of Dislocation/Grain Boundary Interactions AFOSR Grant Number: FA9550-05-0068, 0088. Robert H. Wagoner, PI, Myoung-Gyu Lee, Hojun Lim Department of Materials Science and Engineering Ohio State University B. L. Adams, PI, Colin Landon, Josh Kacher - PowerPoint PPT Presentation
Meso-Scale Simulation and Measurement of Dislocation/Grain Boundary Interactions AFOSR Grant Number: FA9550-05-0068, 0088 Robert H. Wagoner, PI, Myoung-Gyu Lee, Hojun Lim Department of Materials Science and Engineering Ohio State University B. L. Adams, PI, Colin Landon, Josh Kacher Department of Mechanical Engineering Brigham Young University
Transcript
Meso-Scale Simulation and Measurementof Dislocation/Grain Boundary Interactions
AFOSR Grant Number: FA9550-05-0068, 0088
Robert H. Wagoner, PI, Myoung-Gyu Lee, Hojun Lim
Department of Materials Science and Engineering
Ohio State University
B. L. Adams, PI, Colin Landon, Josh Kacher
Department of Mechanical Engineering
Brigham Young University
(Lee, Wagoner, OSU)
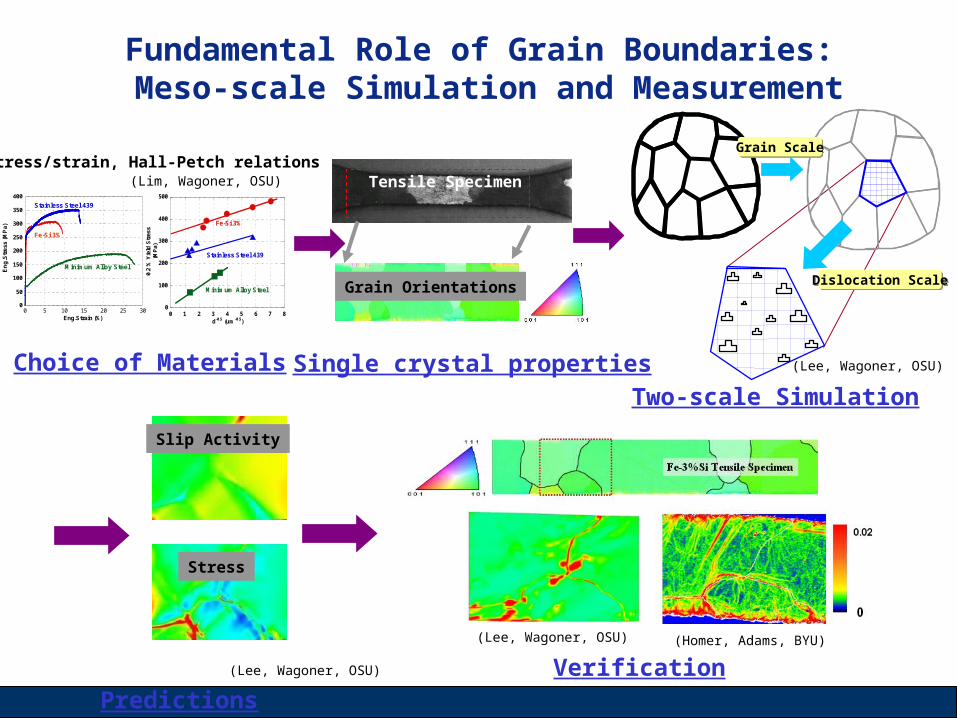
Fundamental Role of Grain Boundaries: Meso-scale Simulation and Measurement
SCCE-T: Single Crystal Constitutive Equations - Texture
• Arbitrary parameters: ≥ 6 (m, hii, hij, h1, h2
, h3
9
Constitutive Equations: SCCE-D
sign
1
0
m
g
0
94.047.00
H
)(
1
1
b
k
kbb
n
a
Slip activities(Asaro & Needleman, 1985)
Hardening of slip systems
SCCE-D: Single Crystal Constitutive Equations - Dislocation
• Arbitrary parameters: 4 (m, 0, ka, kb
10
SCCE-D: Orowan hardening modelForest dislocation
Active (moving) dislocation
Slip plane
l
)()(
l
bg )(
)(
1
l
Effective forest dislocation density
)()()()()( ξncos H
Orowan model [ E. Orowan, 1948]
n()
11
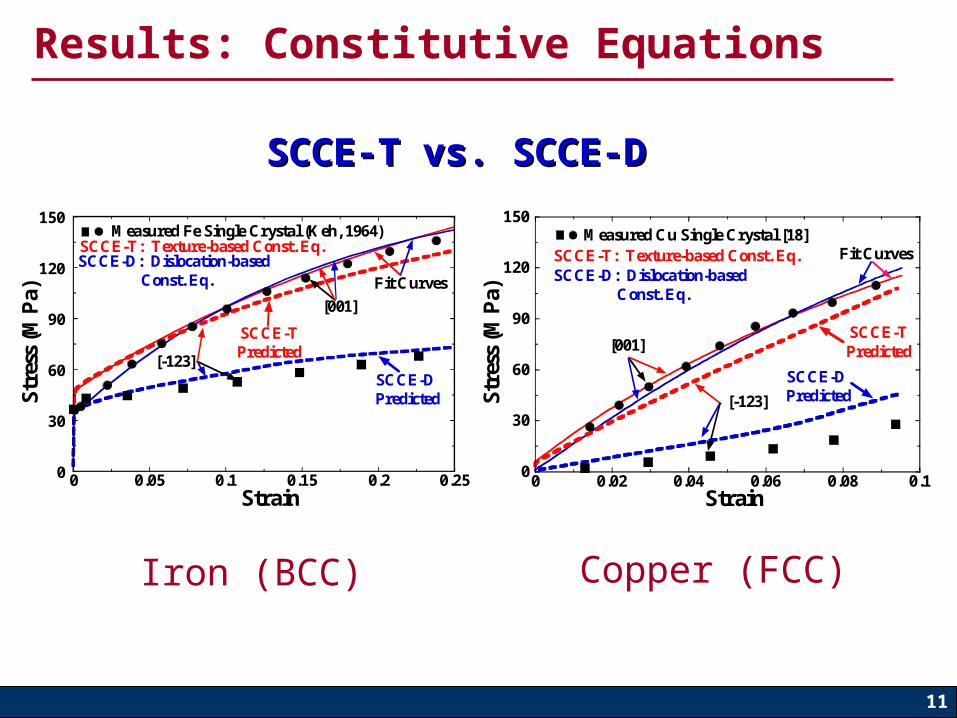
Results: Constitutive Equations
0
30
60
90
120
150
0 0.05 0.1 0.15 0.2 0.25Strain
SCCE-D Predicted
SCCE-TPredicted
Stre
ss (
MP
a)
[001]
SCCE-T: Texture-based Const. Eq.Measured Fe Single Crystal (Keh, 1964)
SCCE-D: Dislocation-based Const. Eq. Fit Curves
[-123]
Iron (BCC) Copper (FCC)
SCCE-T vs. SCCE-D SCCE-T vs. SCCE-D
0
30
60
90
120
150
0 0.02 0.04 0.06 0.08 0.1S
tres
s (M
Pa)
Strain
[001]
SCCE-D Predicted
SCCE-TPredicted
Fit CurvesSCCE-D: Dislocation-based
Const. Eq.
SCCE-T: Texture-based Const. Eq.Measured Cu Single Crystal [18]
[-123]
Measurement
13
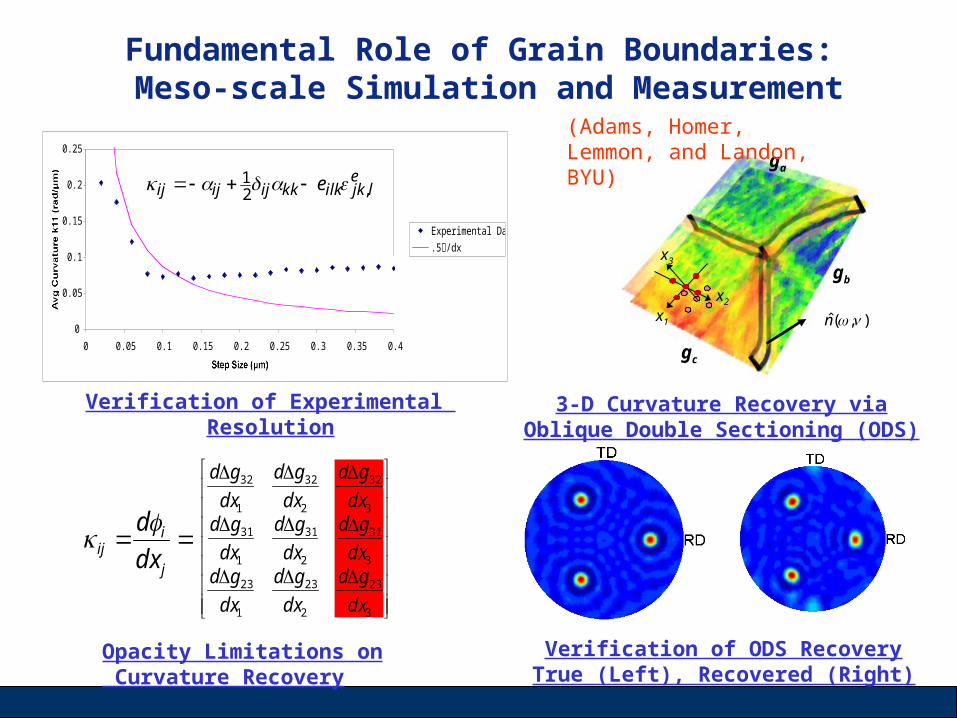
Characterization of complete curvature tensor
κ - 6 of 9 lattice curvatures
1 of 2 boundary inclination parameters,
Full orientation characterization, g
ˆ n ()
3-D Curvature(Under Development)
2-D Curvature(Currently Available)
gc
gb
Lattice Curvature
ga
3
23
2
23
1
23
3
31
2
31
1
31
3
32
2
32
1
32
dx
gd
dx
gd
dx
gddx
gd
dx
gd
dx
gddx
gd
dx
gd
dx
gd
3-D only
j
iij dx
d
ga
gbgc
x1
x2
x3
x1
x2
x3
)(ˆ n
),(ˆ n
κ - All 9 lattice curvatures
Full boundary inclination description,
Full orientation characterization, g
),(ˆ n
14
Experimental resolution limits for lattice curvature
0
0.05
0.1
0.15
0.2
0.25
0 0.05 0.1 0.15 0.2 0.25 0.3 0.35 0.4
Experimental Data
.5/dx
ij ij 12ijkk eilk jk,l
e
Exp. data
.5/dx
15
Oblique Double-Sectioning
• Oblique Double-Sectioning– Combination of serial
sectioning and stereology
– 2 parallel section-cuts for direct measurement of grain boundary character
16
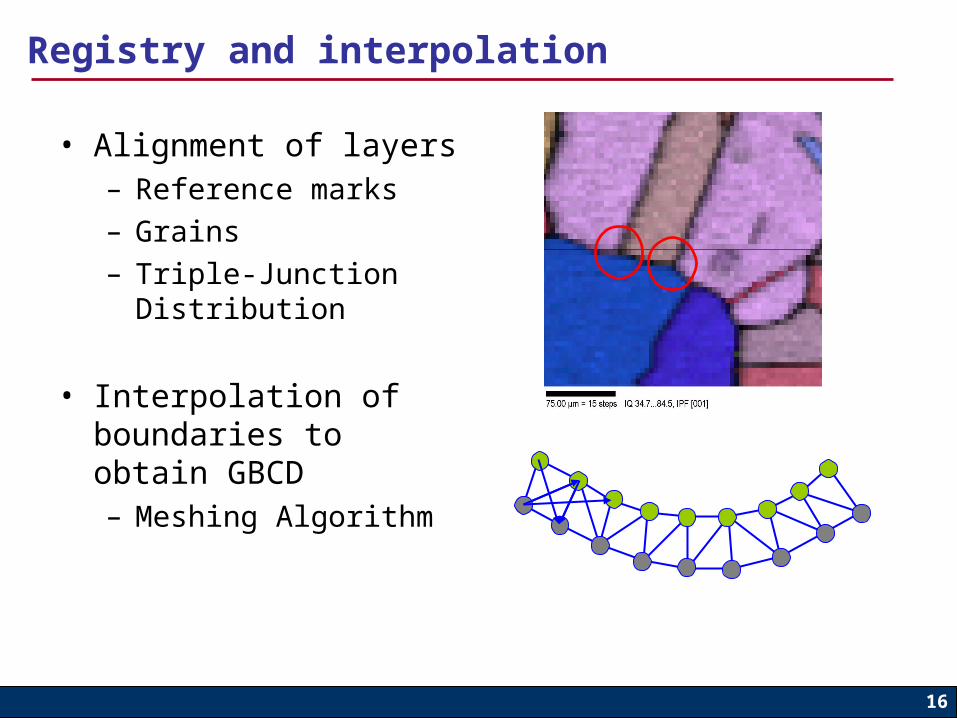
Registry and interpolation
• Alignment of layers– Reference marks
– Grains
– Triple-Junction Distribution
• Interpolation of boundaries to obtain GBCD– Meshing Algorithm
17
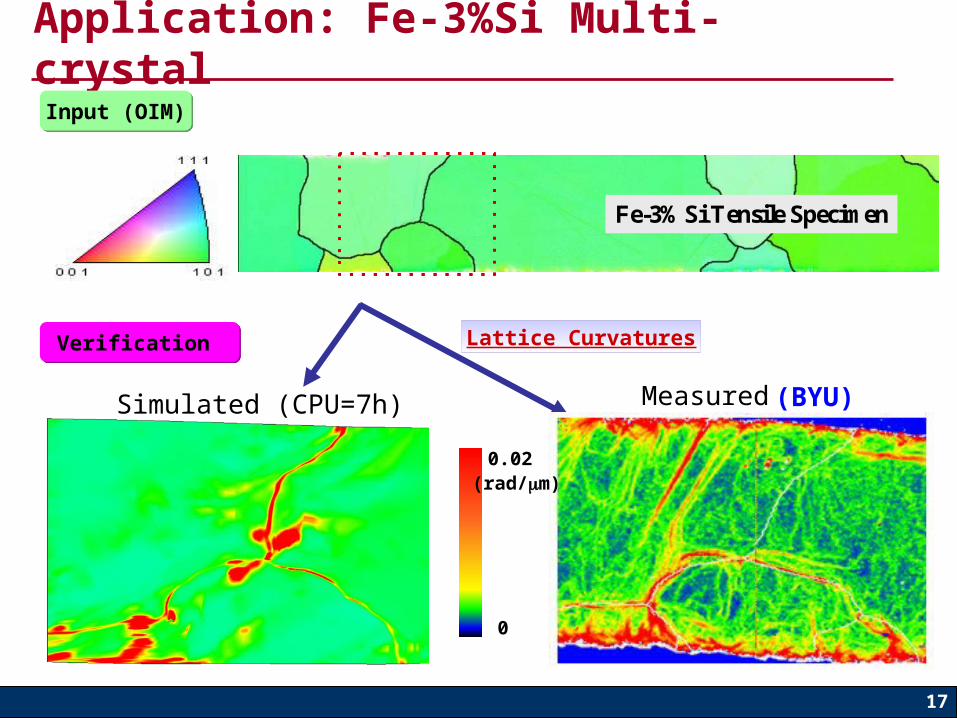
Application: Fe-3%Si Multi-crystal
Input (OIM)Input (OIM)
Verification Verification Lattice Curvatures
0
0.02
Fe-3%Si Tensile SpecimenFe-3%Si Tensile Specimen
Simulated (CPU=7h) Measured
(rad/m)
(BYU)
Results since AFOSR Review, Nov. 3, 2006
Simulations
20
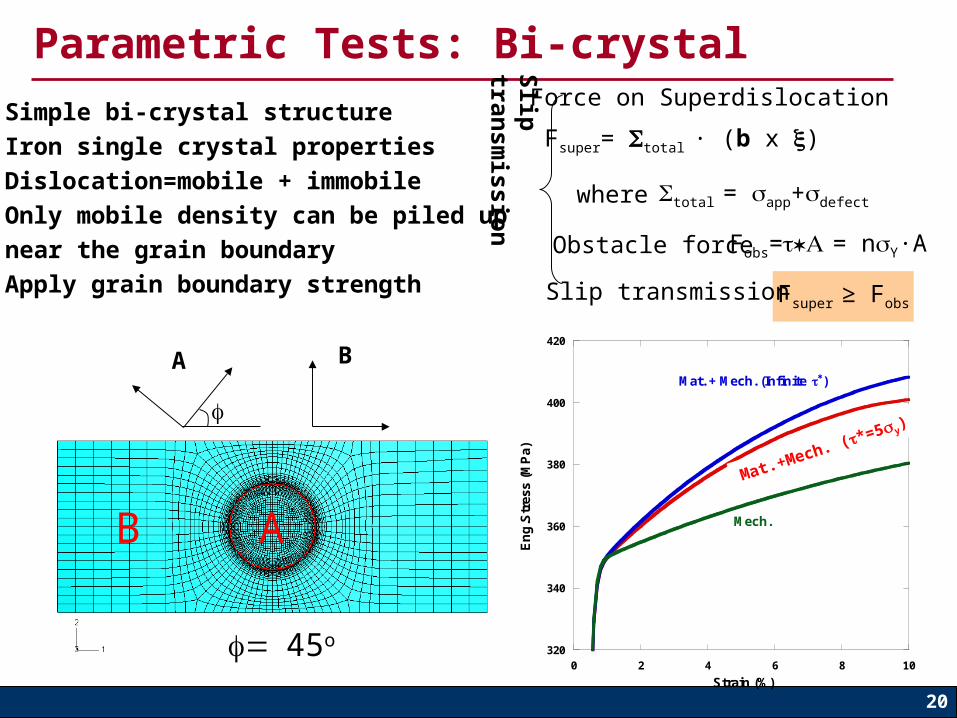
Parametric Tests: Bi-crystal
B A
• Simple bi-crystal structure• Iron single crystal properties • Dislocation=mobile + immobile• Only mobile density can be piled up
near the grain boundary• Apply grain boundary strength
A B
45o320
340
360
380
400
420
0 2 4 6 8 10
En
g.S
tres
s (M
Pa)
Mat. + Mech. (Infinite )
Mech.
Strain (%)
Mat.+Mech. (*=5y
)
total = app+defect
Fsuper= total · (b x )
Force on Superdislocation
where
Obstacle force Fobs= = nY·A
Slip transmission Fsuper ≥ Fobs
Slip
tran
smissio
n
21
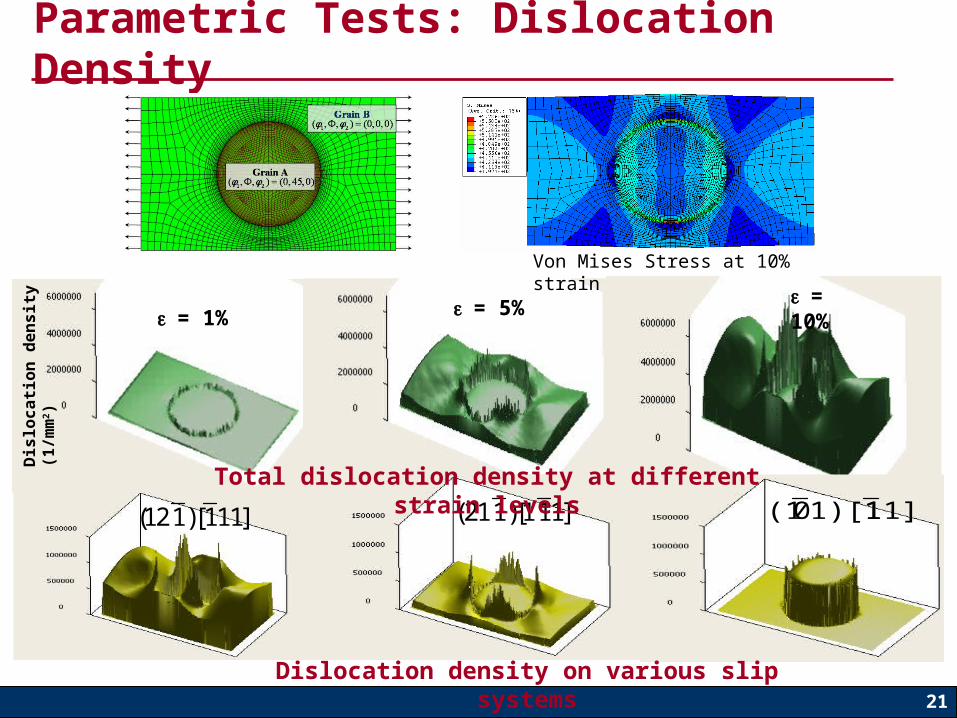
Parametric Tests: Dislocation DensityD
islo
ca
tio
n d
en
sit
y (
1/m
m2)
= 1% = 5%= 10%
Von Mises Stress at 10% strain
(121)[111] (211)[111] 1]11)[10(1
Dislocation density on various slip systems
Total dislocation density at different strain levels
22
Parametric Tests: Size dependence
398
400
402
404
406
408
410
0 200 400 600 800 1000
Hall-Petch Slopes
Str
ess
at
10
% s
tra
in (
MP
a)
d-0.5(m-0.5)
1 um10 um100 um
Stress at infinite grain boundary strength
= 1.5 GPa398
400
402
404
406
408
410
10-5 0.0001 0.001 0.01 0.1 1 10 100 1000
Stress at 10% strain (MPa) vs. grain size (mm)
Str
ess
at
10
% s
trai
n(M
Pa)
Grain size d (mm)
Stress at infinite grain boundary strength
= 1.5 GPa
Stress vs. grain size (d) Stress vs. grain size-1/2 (d-1/2)
• Constant grain boundary strength: 5*300 MPa• Different grain sizes with same grain configuration
*=5y=1,500 MPa *=5y=1,500 MPa
23
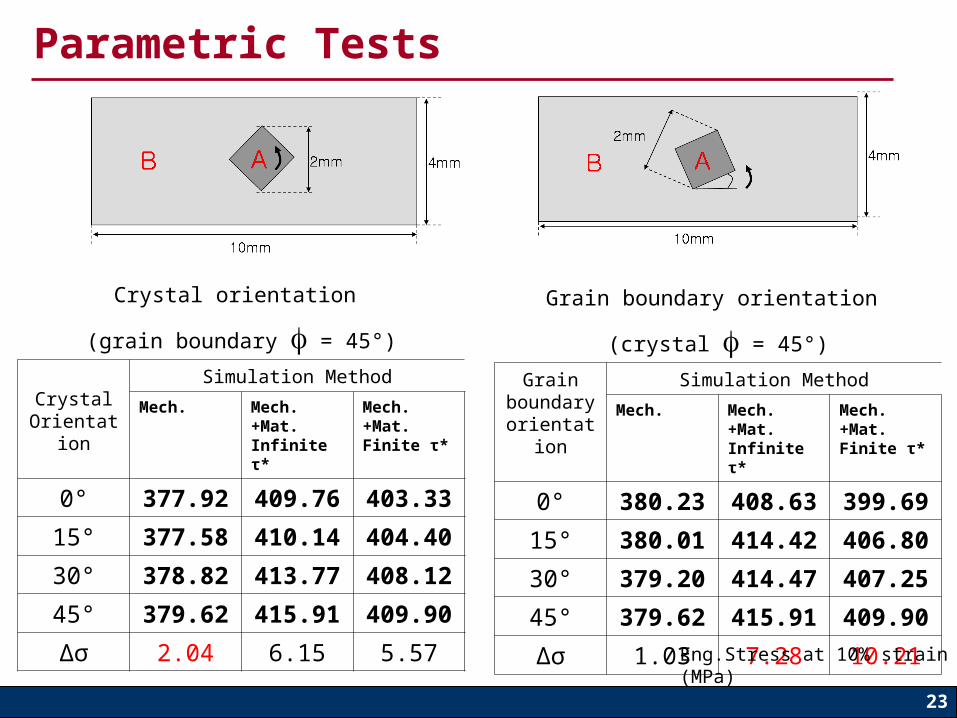
Parametric Tests
Crystal orientation
(grain boundary = 45°)
CrystalOrientation
Simulation Method
Mech. Mech.+Mat.Infinite τ*
Mech.+Mat. Finite τ*
0° 377.92 409.76 403.33
15° 377.58 410.14 404.40
30° 378.82 413.77 408.12
45° 379.62 415.91 409.90
Δσ 2.04 6.15 5.57
Grain boundary orientation
(crystal = 45°)
Grain boundaryorientation
Simulation Method
Mech. Mech.+Mat.Infinite τ*
Mech.+Mat. Finite τ*
0° 380.23 408.63 399.69
15° 380.01 414.42 406.80
30° 379.20 414.47 407.25
45° 379.62 415.91 409.90
Δσ 1.03 7.28 10.21
Eng.Stress at 10% strain (MPa)
Experiments
25
• Measuring shifts to 1/20 of a pixel increase resolution of rotation by at least a factor of ten
• The correlation based method is also sensitive to lattice strains
Cross Correlation Technique: Promising New Method
Ref: Angus Wilkinson (Oxford University)
26
Cross Correlation Technique
• Reference Image• Comparison image at
adjacent scan point
A region in the reference image is placed over the comparison image and progressively shifted. The correlation intensity is recorded and forms the correlation image.
27
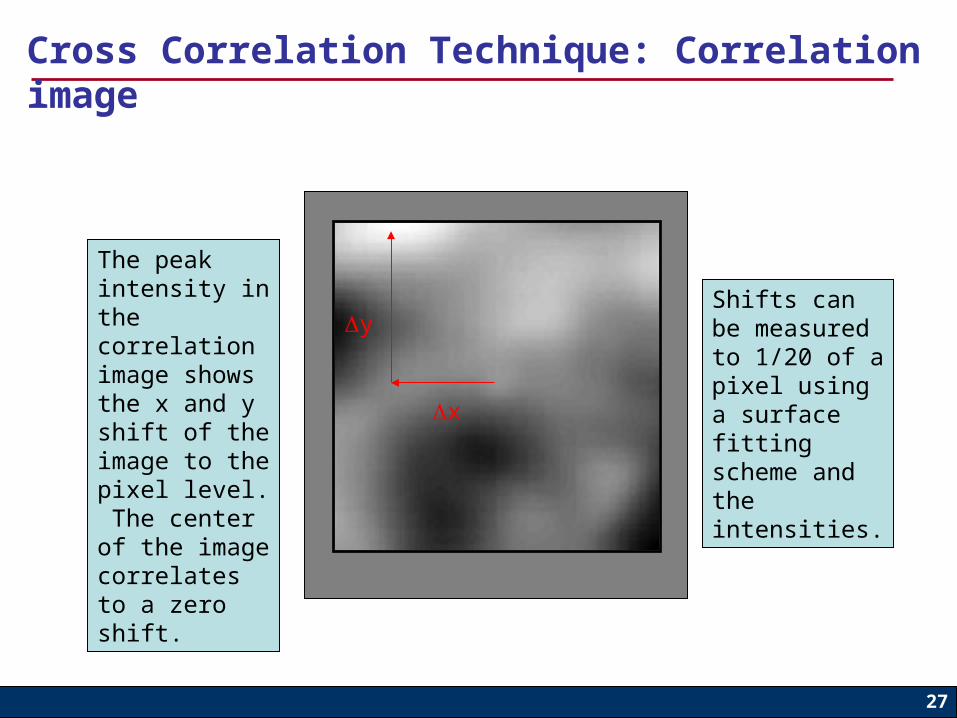
Cross Correlation Technique: Correlation image
The peak intensity in the correlation image shows the x and y shift of the image to the pixel level. The center of the image correlates to a zero shift.
Shifts can be measured to 1/20 of a pixel using a surface fitting scheme and the intensities.
x
y
28
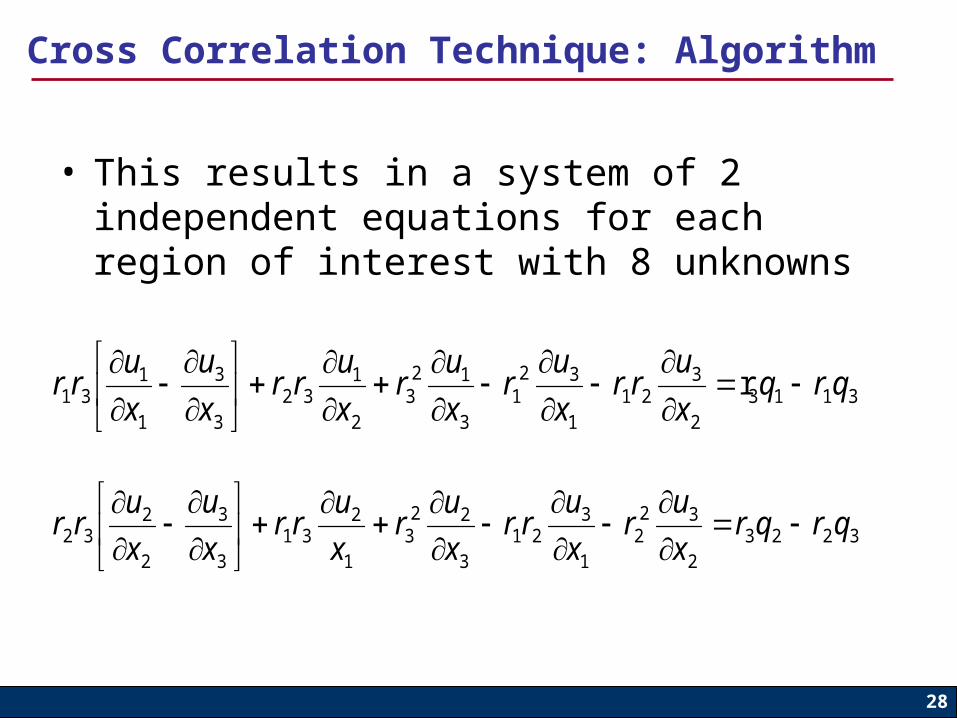
Cross Correlation Technique: Algorithm
• This results in a system of 2 independent equations for each region of interest with 8 unknowns
31132
321
1
321
3
123
2
132
3
3
1
131 r qrq
x
urr
x
ur
x
ur
x
urr
x
u
x
urr
32232
322
1
321
3
223
1
231
3
3
2
232 qrqr
x
ur
x
urr
x
ur
x
urr
x
u
x
urr
29
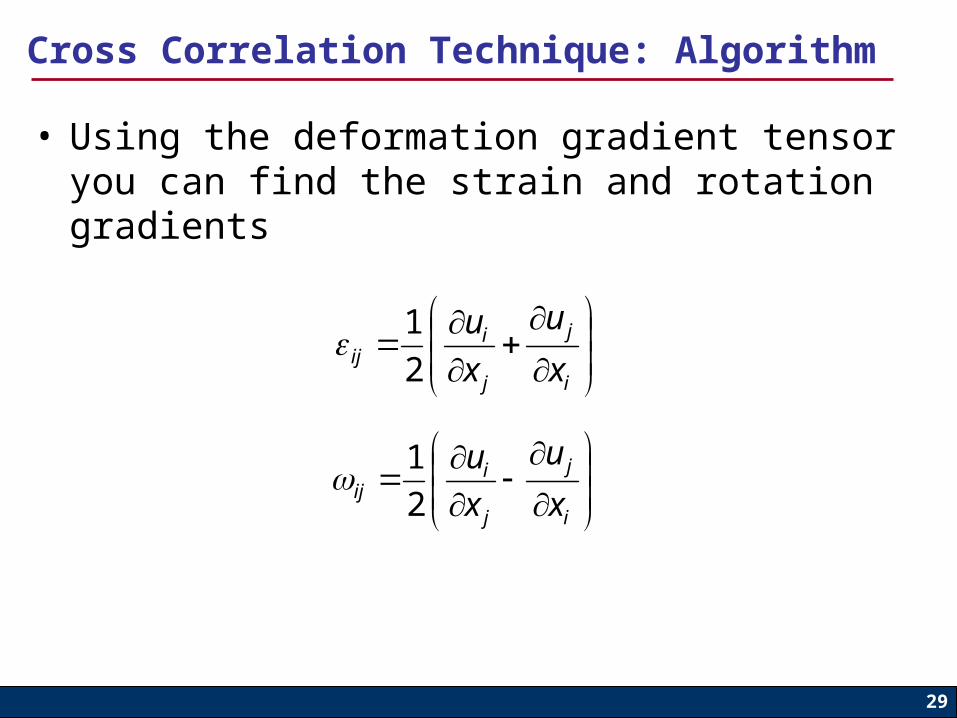
• Using the deformation gradient tensor you can find the strain and rotation gradients
i
j
j
iij x
u
x
u
2
1
i
j
j
iij x
u
x
u
2
1
Cross Correlation Technique: Algorithm
30
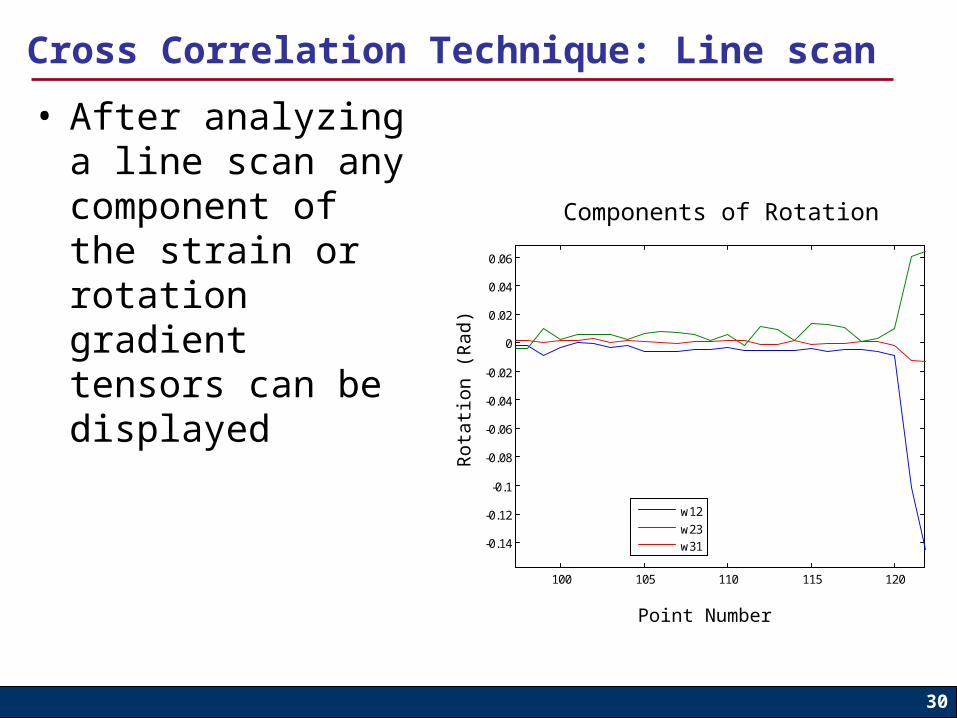
• After analyzing a line scan any component of the strain or rotation gradient tensors can be displayed
Components of Rotation
Point Number
Rot
atio
n (R
ad)
100 105 110 115 120
-0.14
-0.12
-0.1
-0.08
-0.06
-0.04
-0.02
0
0.02
0.04
0.06
w12
w23w31
Cross Correlation Technique: Line scan
31
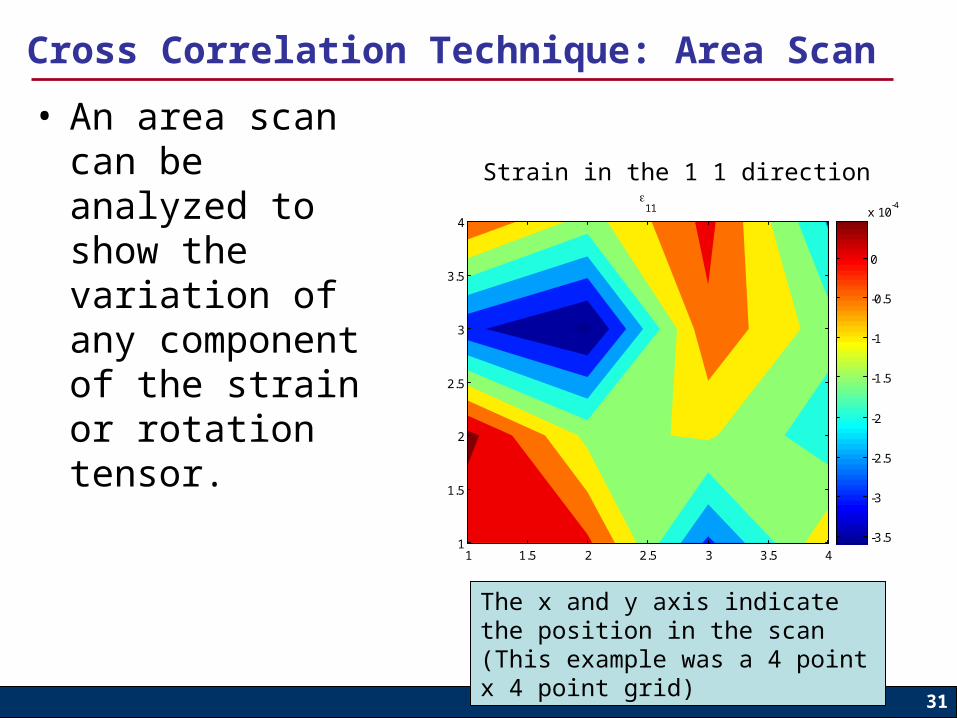
• An area scan can be analyzed to show the variation of any component of the strain or rotation tensor.
11
1 1.5 2 2.5 3 3.5 41
1.5
2
2.5
3
3.5
4
-3.5
-3
-2.5
-2
-1.5
-1
-0.5
0
x 10-4
The x and y axis indicate the position in the scan (This example was a 4 point x 4 point grid)
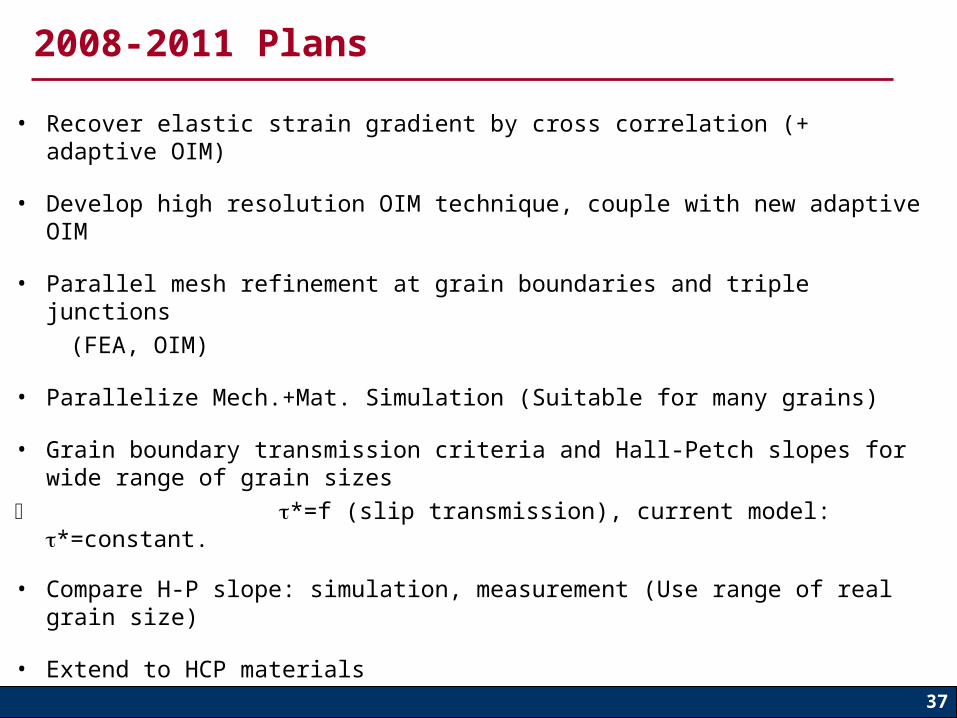
• Develop high resolution OIM technique, couple with new adaptive OIM
• Parallel mesh refinement at grain boundaries and triple junctions
(FEA, OIM)
• Parallelize Mech.+Mat. Simulation (Suitable for many grains)
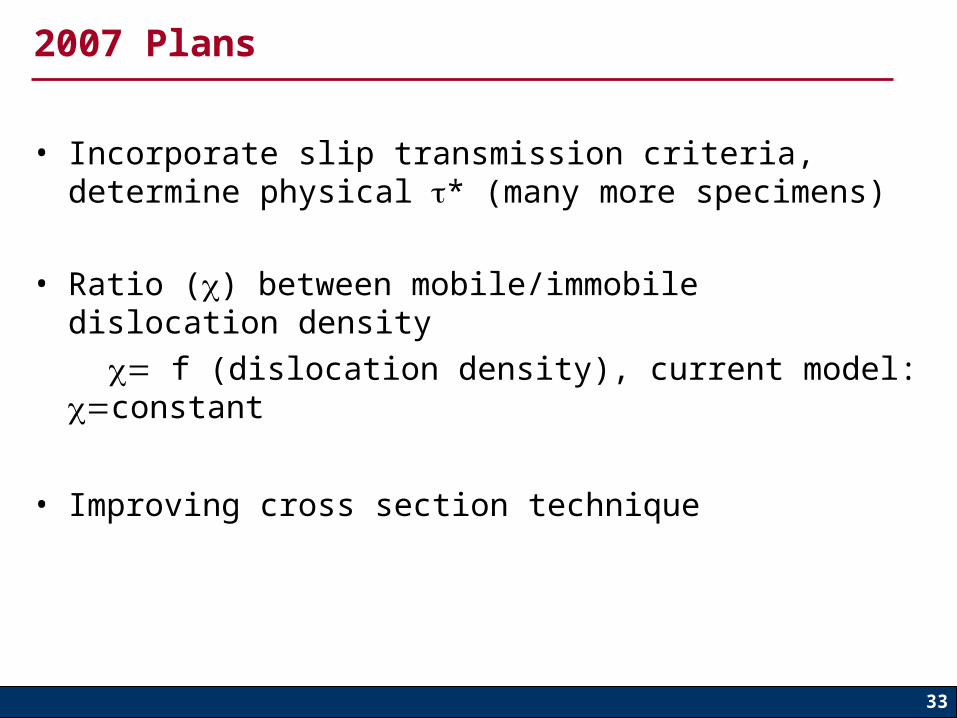
• Grain boundary transmission criteria and Hall-Petch slopes for wide range of grain sizes
*=f (slip transmission), current model: *=constant.
• Compare H-P slope: simulation, measurement (Use range of real grain size)
• Extend to HCP materials
38
2007 work : Grain boundary transmission
Curvature plot with infinite GB Exp. curvature
Obstacle strength with slip transmissivity*)1( NN CRSSobstacle
39
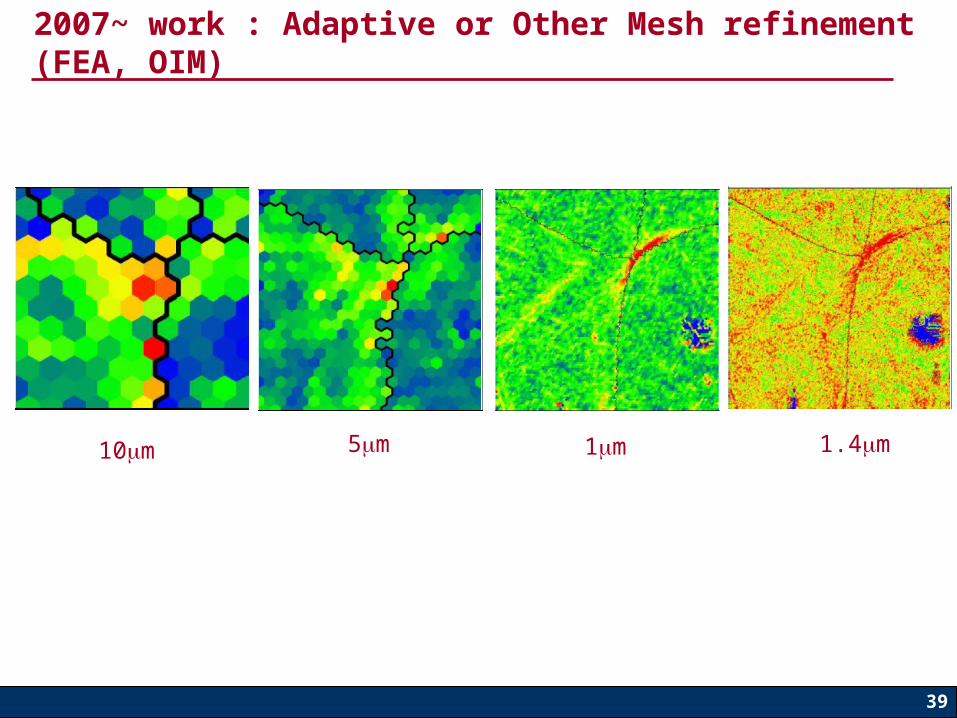
2007~ work : Adaptive or Other Mesh refinement (FEA, OIM)
10m 5m 1m 1.4m
Extra Slides
41
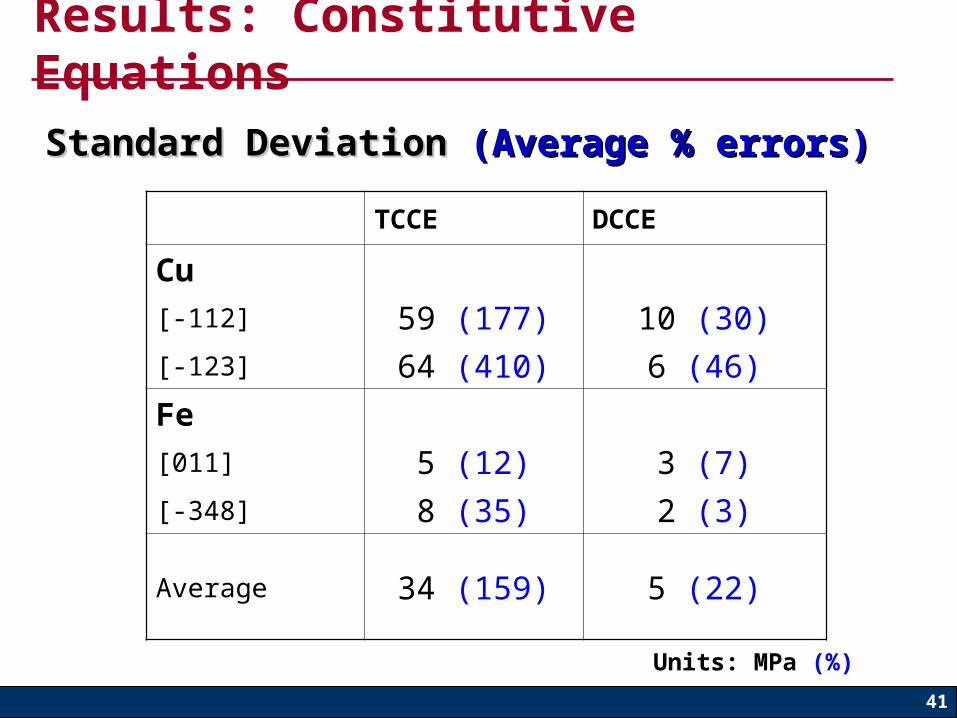
Results: Constitutive Equations
TCCE DCCE
Cu
[-112] 59 (177) 10 (30)
[-123] 64 (410) 6 (46)
Fe
[011] 5 (12) 3 (7)
[-348] 8 (35) 2 (3)
Average 34 (159) 5 (22)
Units: MPa (%)
Standard DeviationStandard Deviation (Average % errors) (Average % errors)
42
Results: Constitutive Equations
Iron (BCC)Copper (FCC)
Uni-axial Compression of PolycrystalsUni-axial Compression of Polycrystals
43
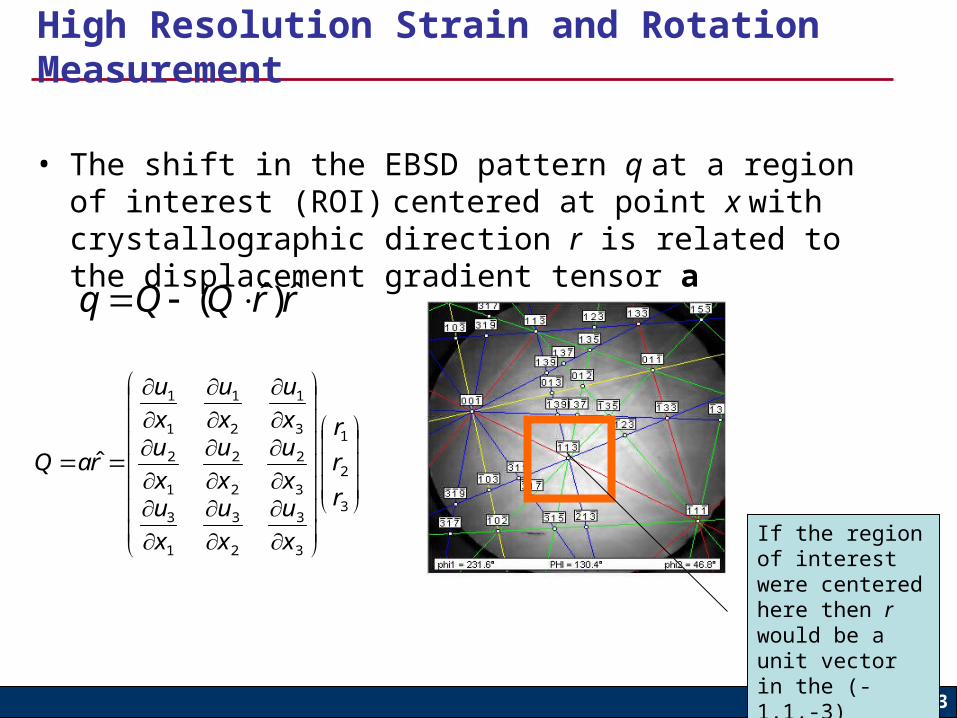
• The shift in the EBSD pattern q at a region of interest (ROI) centered at point x with crystallographic direction r is related to the displacement gradient tensor a
rrQQq ˆ)ˆ(
3
2
1
3
3
2
3
1
3
3
2
2
2
1
2
3
1
2
1
1
1
ˆ
r
r
r
x
u
x
u
x
ux
u
x
u
x
ux
u
x
u
x
u
raQ
High Resolution Strain and Rotation Measurement
If the region of interest were centered here then r would be a unit vector in the (-1,1,-3) direction
44
Summary I: single Xl constitutive equations
• Novel two-scale simulation model based on Finite Element Method was developed
• Superdislocation concept is well validated with analytical pileup solution
• SCCE-D (4 parameters) fits real single Xl (no gb effects)
• SCCE-T (≥6 parameters) does not match single Xl (gb effects)
• Stress-strain response and texture evolution are similar with different single Xl models


![Press Release SAGA-GYU 3 Year Anniversaryadirectholdings.com/images/press/SAGAGYU B2B Press Relaese ENG[3].pdfPress Release June 9th, 2016 SAGA-GYU 3rd Year Anniversary ... Our company](https://static.documents.pub/doc/80x56/5f0eeec77e708231d441a6ee/press-release-saga-gyu-3-year-annive-b2b-press-relaese-eng3pdf-press-release.jpg)


