Tooth Decay and Liver Decay: Tooth Decay and Liver Decay: The Nexus Between The Nexus Between Doctors and Dentists Doctors and Dentists Robert H. Lustig, M.D., M.S.L. Robert H. Lustig, M.D., M.S.L. Division of Endocrinology Division of Endocrinology Department of Pediatrics Department of Pediatrics Member, Institute for Health Policy Studies Member, Institute for Health Policy Studies University of California, San Francisco University of California, San Francisco Adjunct Faculty, UC Hastings College of the Law Adjunct Faculty, UC Hastings College of the Law President, Institute for Responsible Nutrition President, Institute for Responsible Nutrition NOHC, Cincinnati, OH, April 18, 2016
Transcript
Tooth Decay and Liver Decay:Tooth Decay and Liver Decay:The Nexus Between The Nexus Between Doctors and DentistsDoctors and Dentists
Robert H. Lustig, M.D., M.S.L.Robert H. Lustig, M.D., M.S.L.Division of EndocrinologyDivision of EndocrinologyDepartment of PediatricsDepartment of Pediatrics
Member, Institute for Health Policy StudiesMember, Institute for Health Policy StudiesUniversity of California, San FranciscoUniversity of California, San Francisco
Adjunct Faculty, UC Hastings College of the LawAdjunct Faculty, UC Hastings College of the Law
President, Institute for Responsible NutritionPresident, Institute for Responsible Nutrition
NOHC, Cincinnati, OH, April 18, 2016
• No disclosures(except I wrote a book)
Tooth DecayTooth Decay
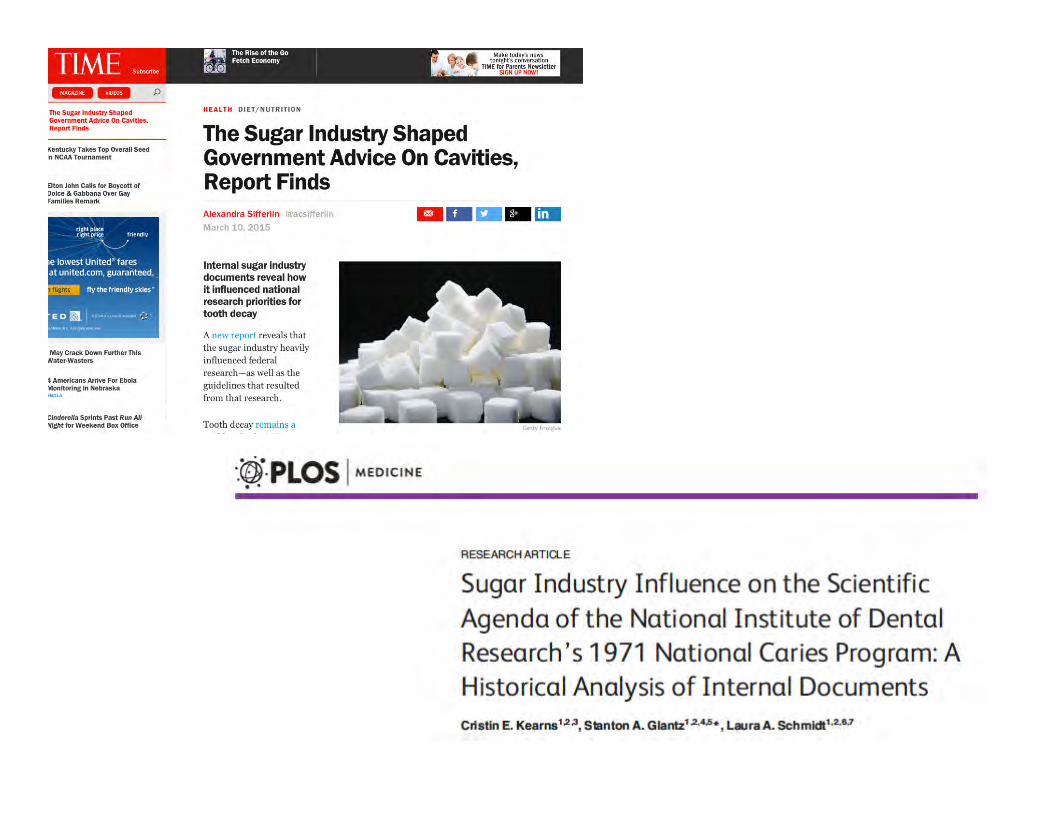
Dentists were the firstDentists were the firstantianti--sugar advocatessugar advocates
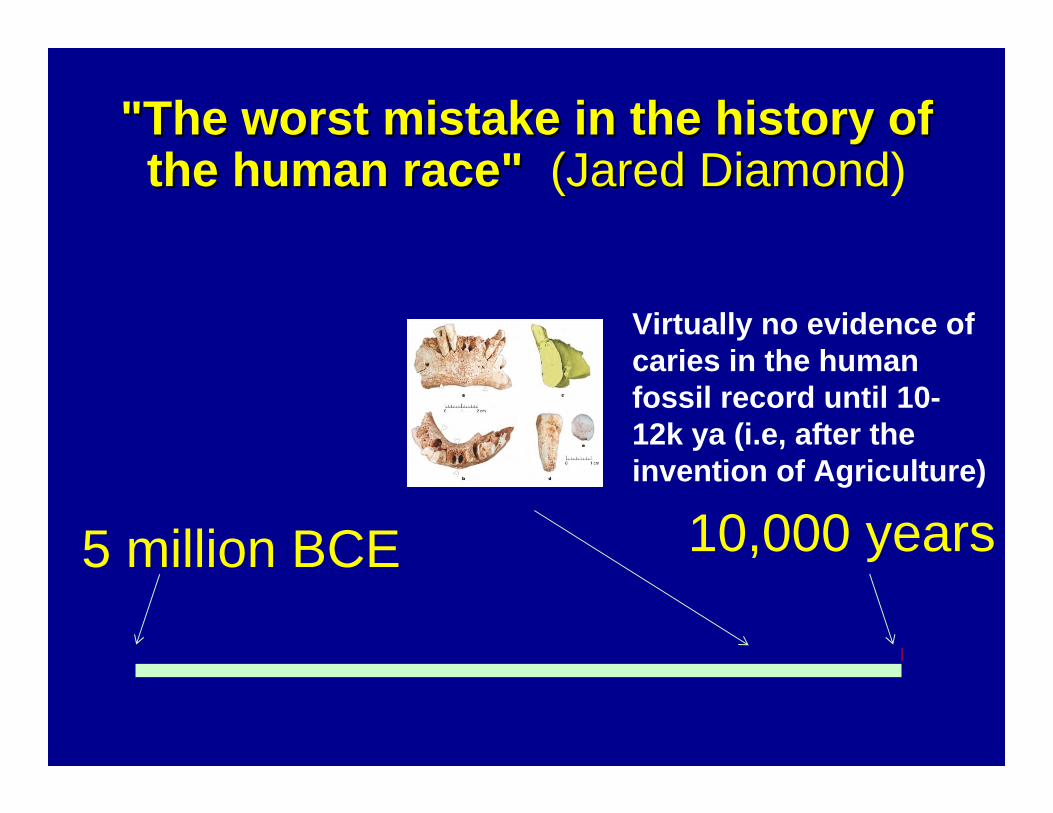
5 million BCE 10,000 years
"The worst mistake in the history of "The worst mistake in the history of the human race"the human race" (Jared Diamond(Jared Diamond)
Virtually no evidence of caries in the human fossil record until 10-12k ya (i.e, after the invention of Agriculture)
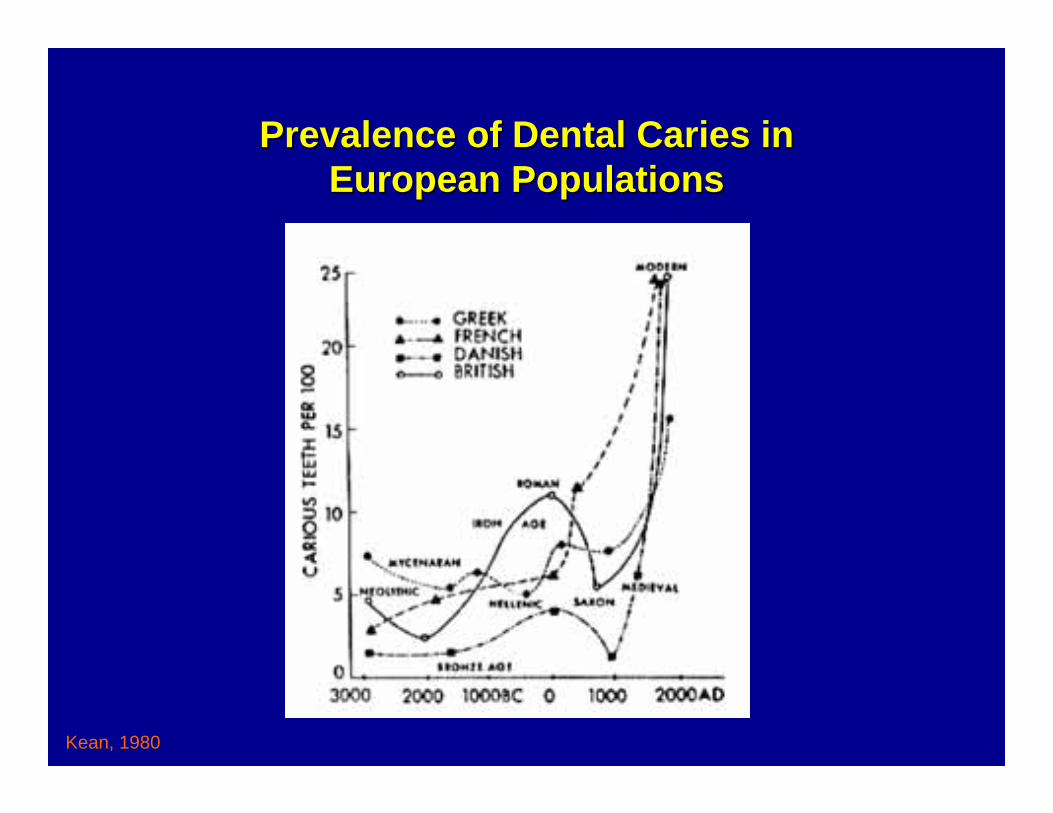
Prevalence of Dental Caries in Prevalence of Dental Caries in European PopulationsEuropean Populations
Kean, 1980
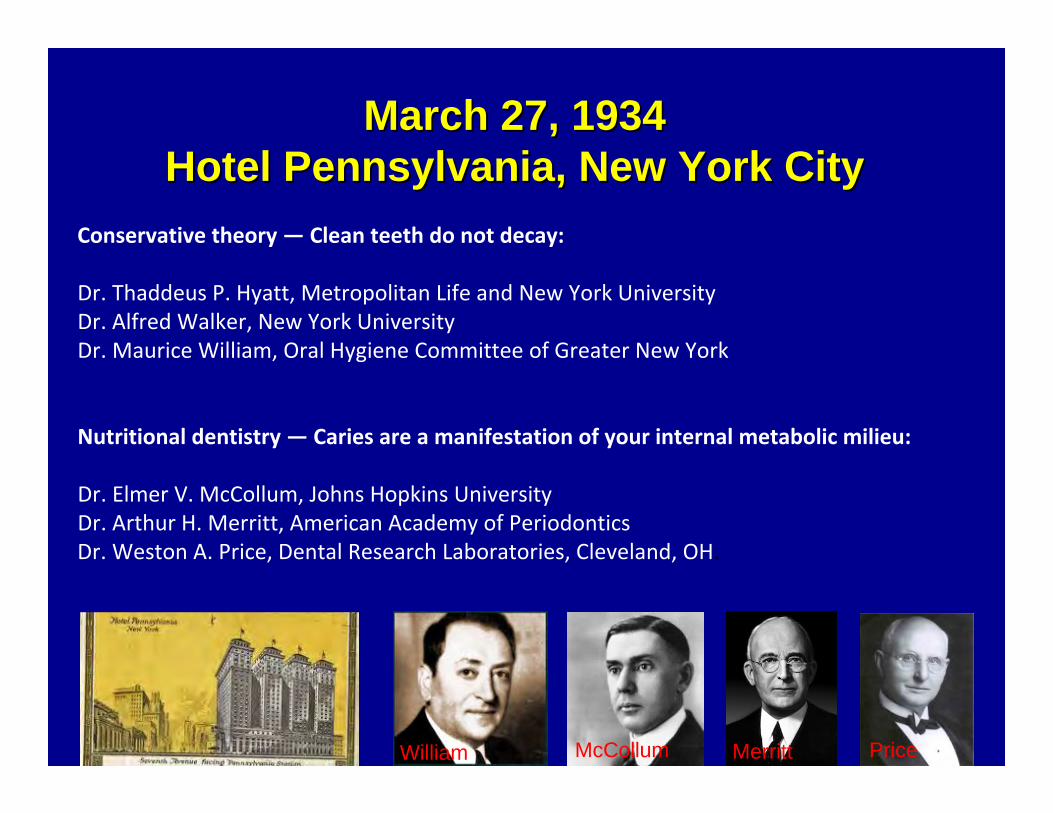
March 27, 1934March 27, 1934Hotel Pennsylvania, New York CityHotel Pennsylvania, New York City
Conservative theory — Clean teeth do not decay:
Dr. Thaddeus P. Hyatt, Metropolitan Life and New York UniversityDr. Alfred Walker, New York University Dr. Maurice William, Oral Hygiene Committee of Greater New York
Nutritional dentistry — Caries are a manifestation of your internal metabolic milieu:
Dr. Elmer V. McCollum, Johns Hopkins University Dr. Arthur H. Merritt, American Academy of Periodontics Dr. Weston A. Price, Dental Research Laboratories, Cleveland, OH.
William Merritt PriceMcCollum
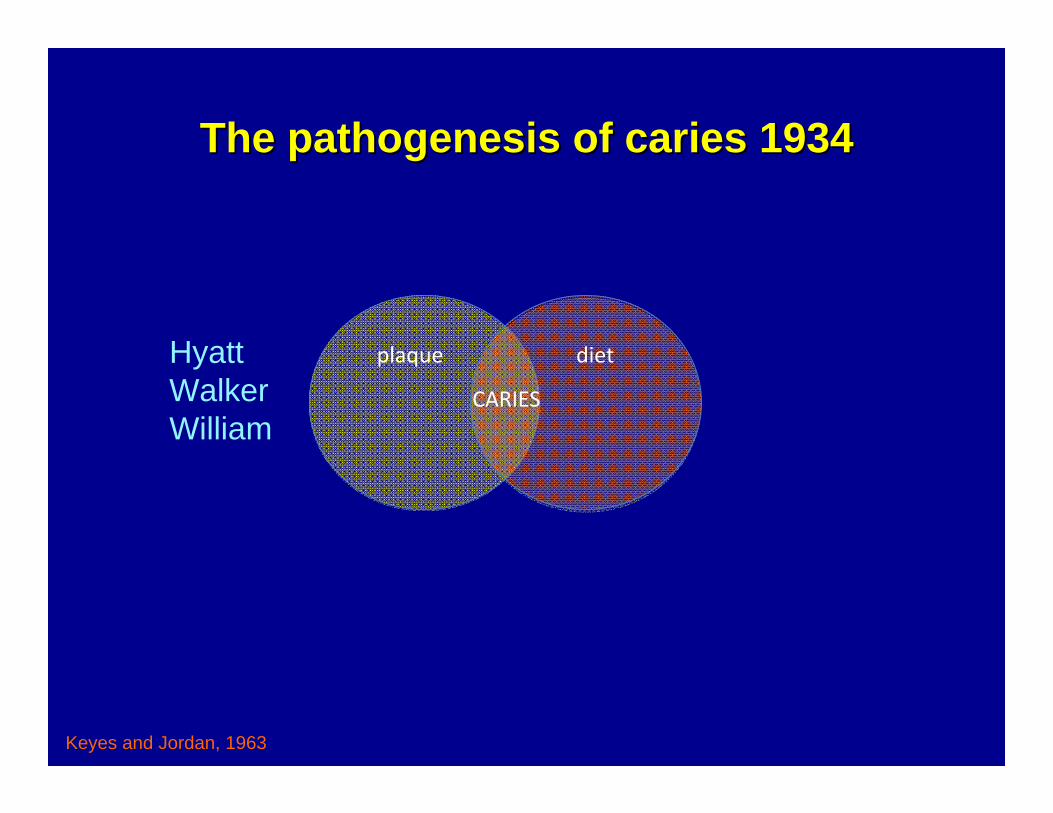
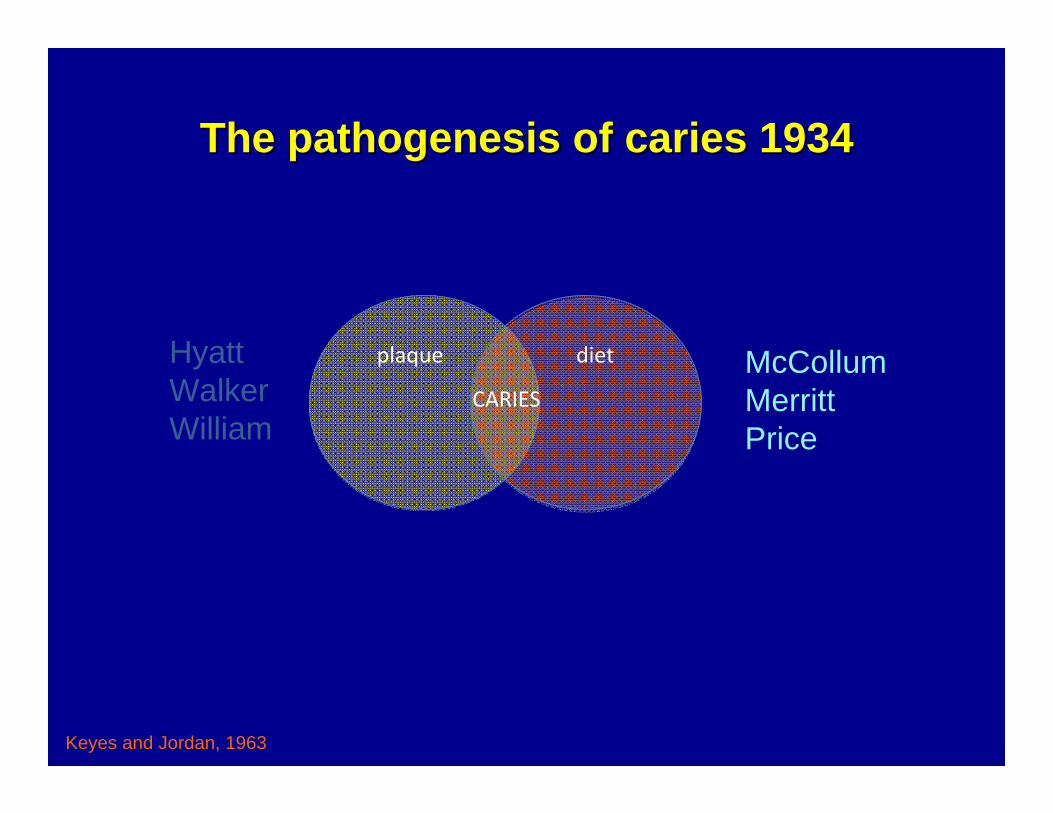
The pathogenesis of caries 1934The pathogenesis of caries 1934
plaque diet
CARIES
Keyes and Jordan, 1963
HyattWalkerWilliam
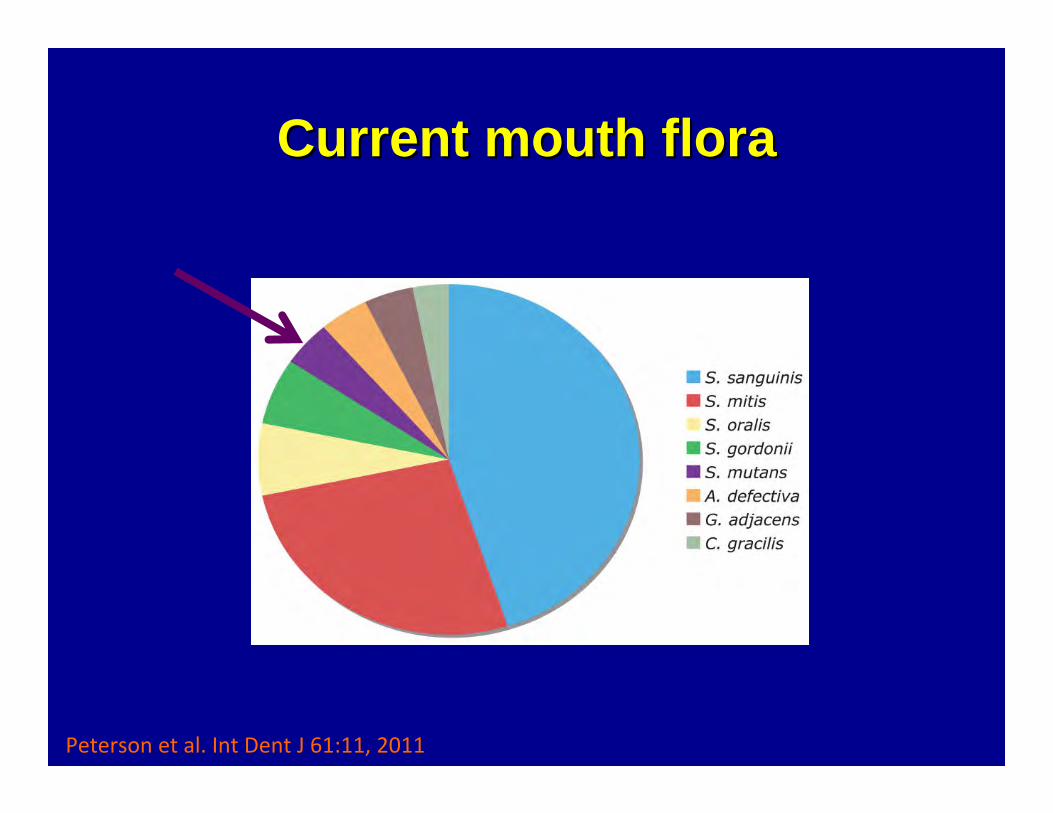
Current mouth floraCurrent mouth flora
Peterson et al. Int Dent J 61:11, 2011
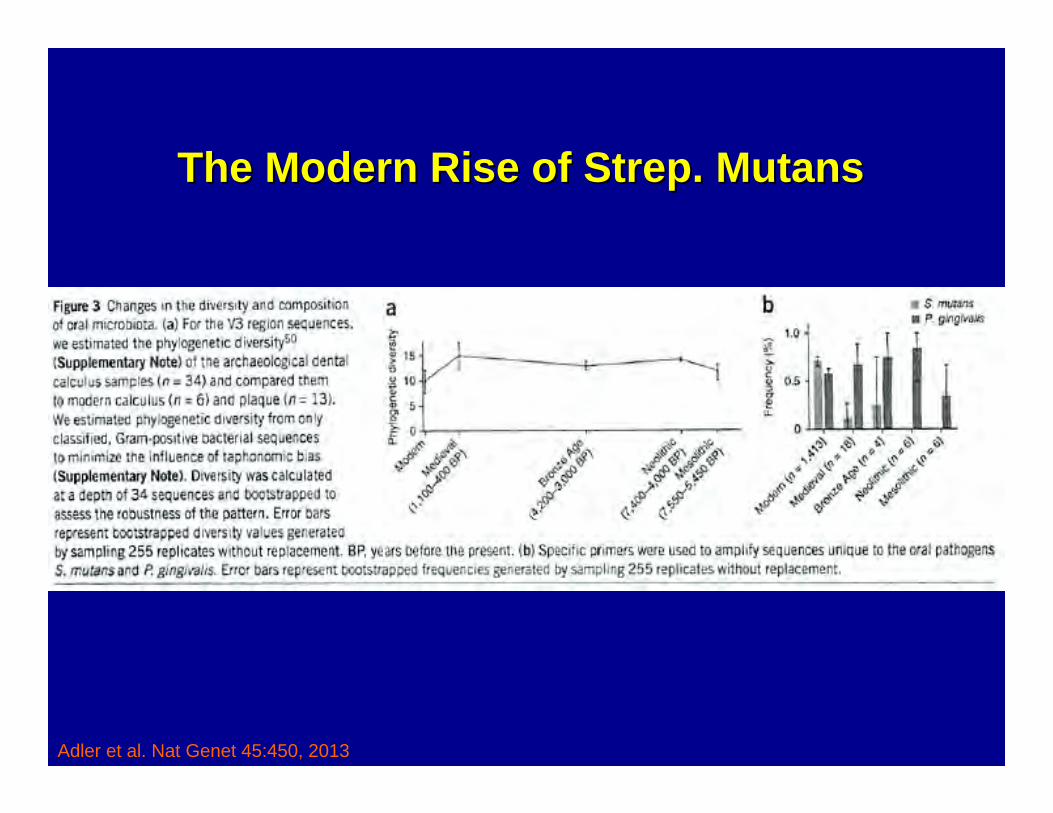
Adler et al. Nat Genet 45:450, 2013
The Modern Rise of Strep. The Modern Rise of Strep. MutansMutans
The pathogenesis of caries 1934The pathogenesis of caries 1934
plaque diet
CARIES
Keyes and Jordan, 1963
HyattWalkerWilliam
McCollumMerrittPrice
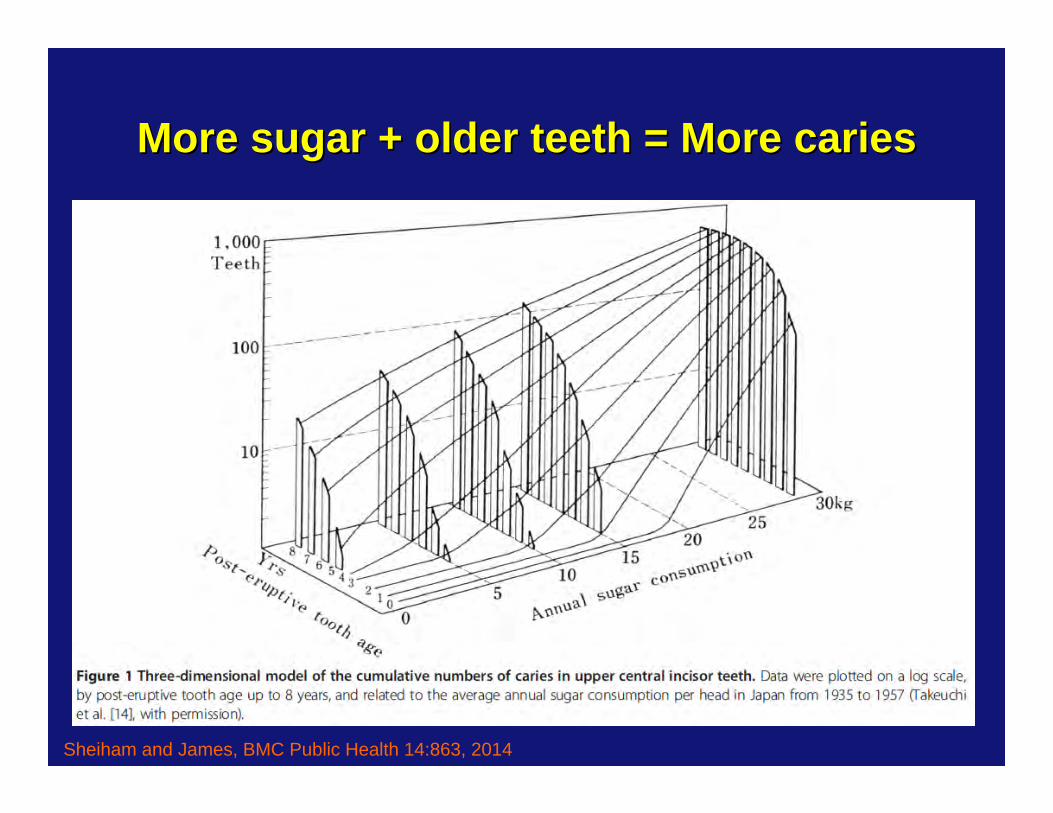
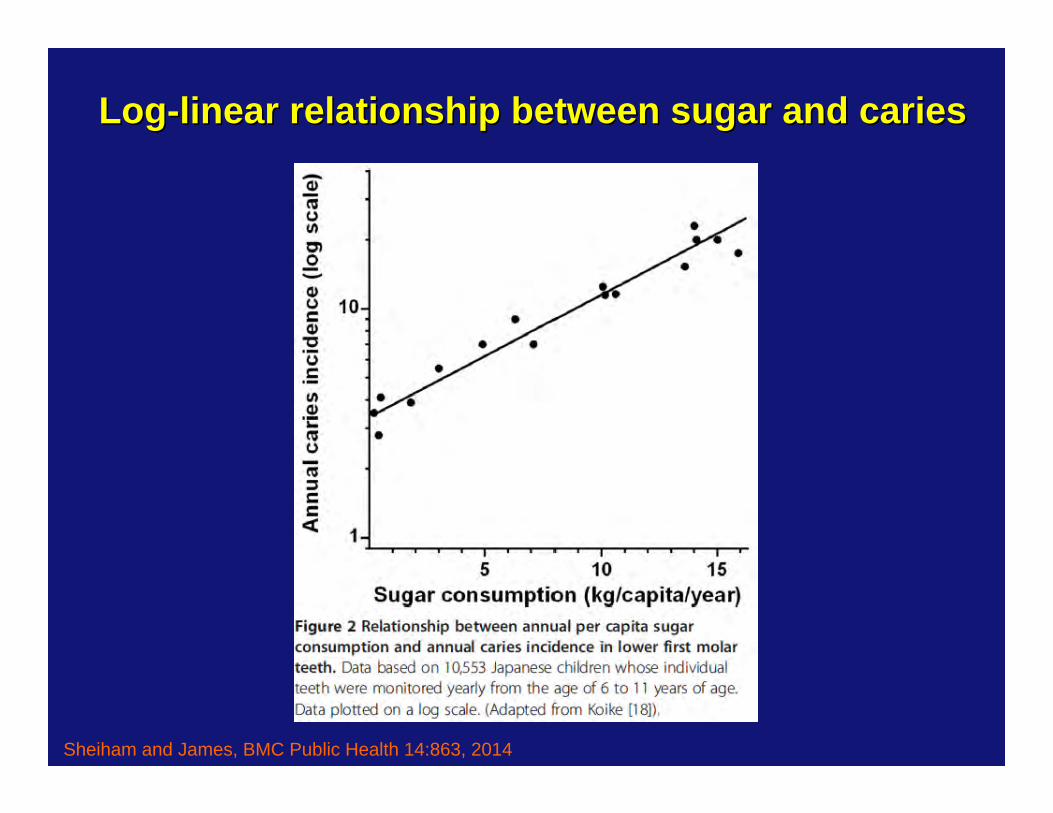
More sugar + older teeth = More cariesMore sugar + older teeth = More caries
Sheiham and James, BMC Public Health 14:863, 2014
LogLog--linear relationship between sugar and carieslinear relationship between sugar and caries
Sheiham and James, BMC Public Health 14:863, 2014
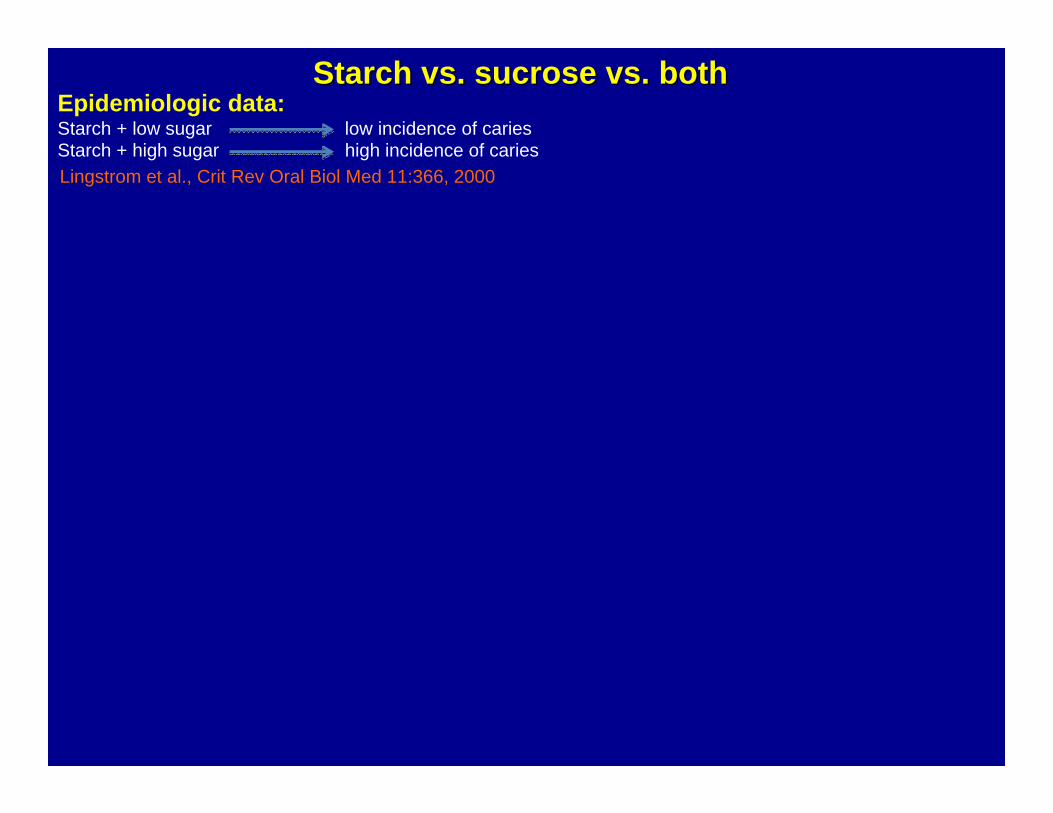
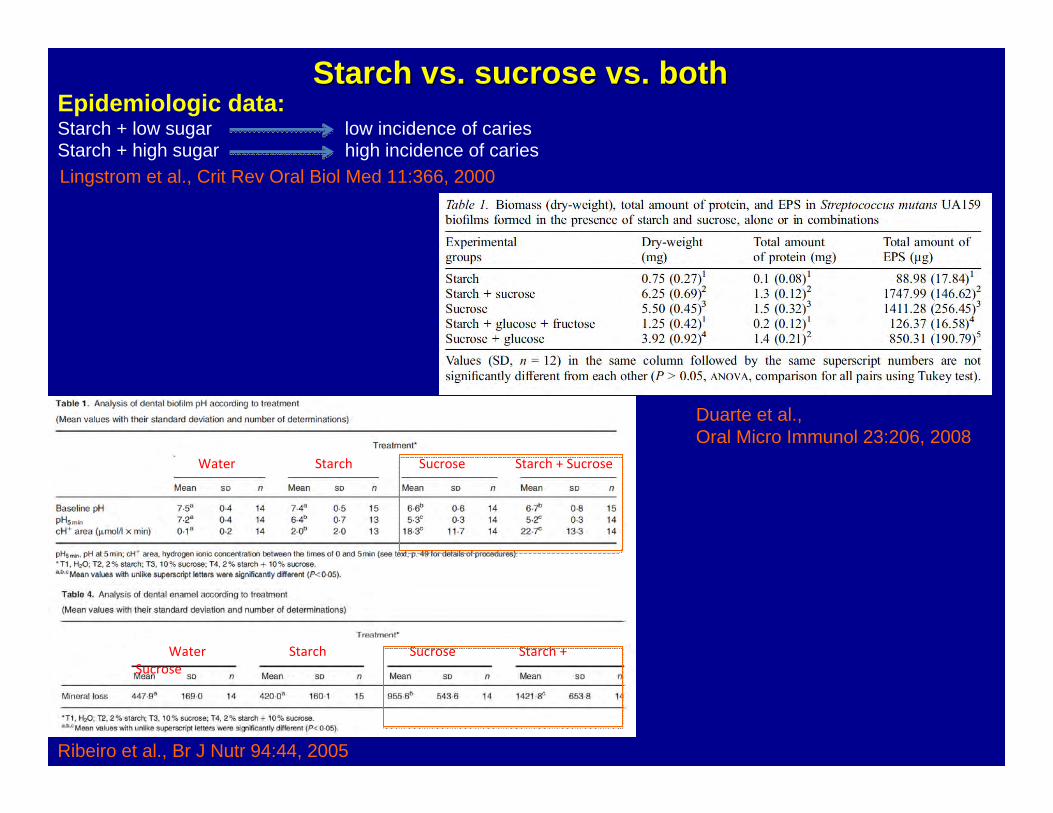
Epidemiologic data:Starch + low sugar low incidence of cariesStarch + high sugar high incidence of caries Lingstrom et al., Crit Rev Oral Biol Med 11:366, 2000
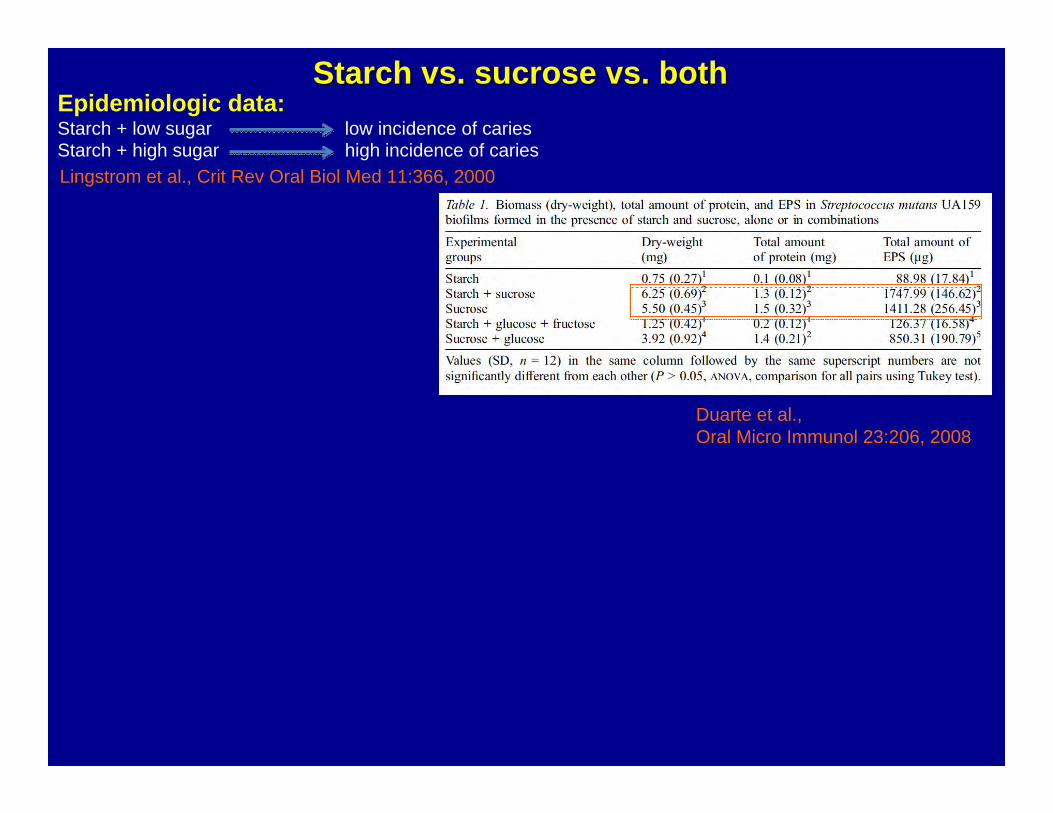
Starch vs. sucrose vs. bothStarch vs. sucrose vs. both
Epidemiologic data:Starch + low sugar low incidence of cariesStarch + high sugar high incidence of caries Lingstrom et al., Crit Rev Oral Biol Med 11:366, 2000
Duarte et al., Oral Micro Immunol 23:206, 2008
Starch vs. sucrose vs. bothStarch vs. sucrose vs. both
Ribeiro et al., Br J Nutr 94:44, 2005
Epidemiologic data:Starch + low sugar low incidence of cariesStarch + high sugar high incidence of caries Lingstrom et al., Crit Rev Oral Biol Med 11:366, 2000
Water Starch Sucrose Starch + Sucrose
Water Starch Sucrose Starch + Sucrose
Duarte et al., Oral Micro Immunol 23:206, 2008
Starch vs. sucrose vs. bothStarch vs. sucrose vs. both
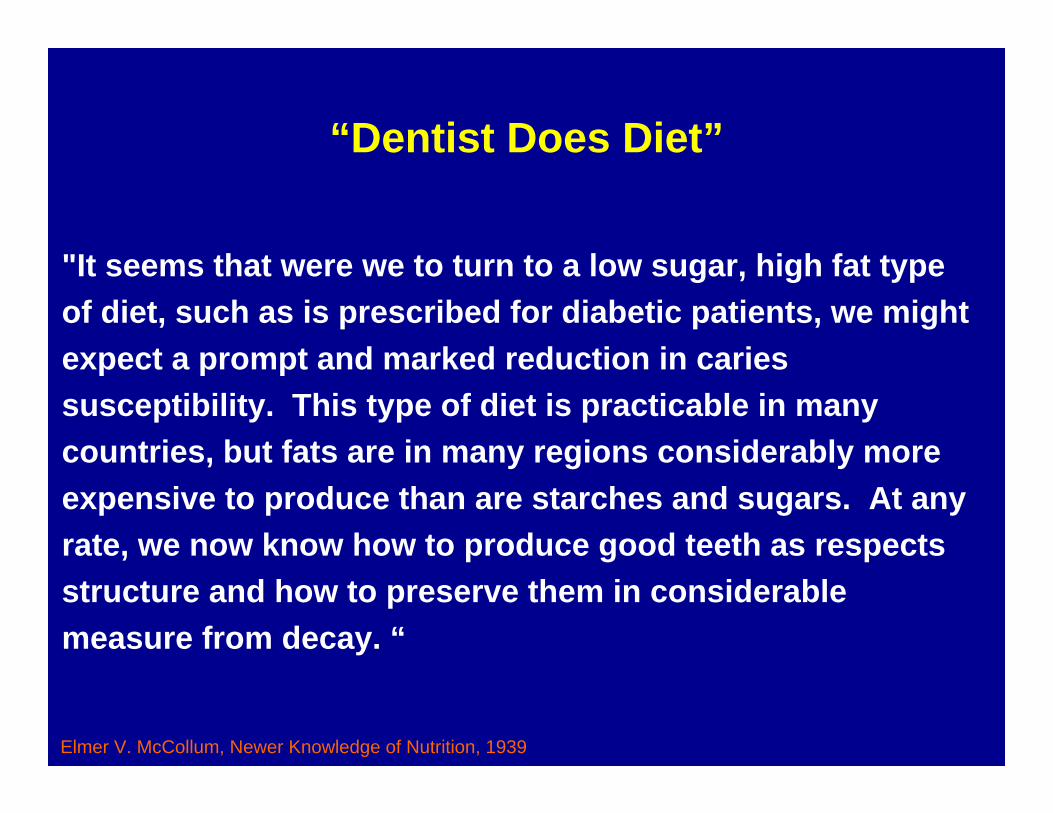
“Dentist Does Diet”
"It seems that were we to turn to a low sugar, high fat type of diet, such as is prescribed for diabetic patients, we might expect a prompt and marked reduction in caries susceptibility. This type of diet is practicable in many countries, but fats are in many regions considerably more expensive to produce than are starches and sugars. At any rate, we now know how to produce good teeth as respects structure and how to preserve them in considerable measure from decay. “
Elmer V. McCollum, Newer Knowledge of Nutrition, 1939
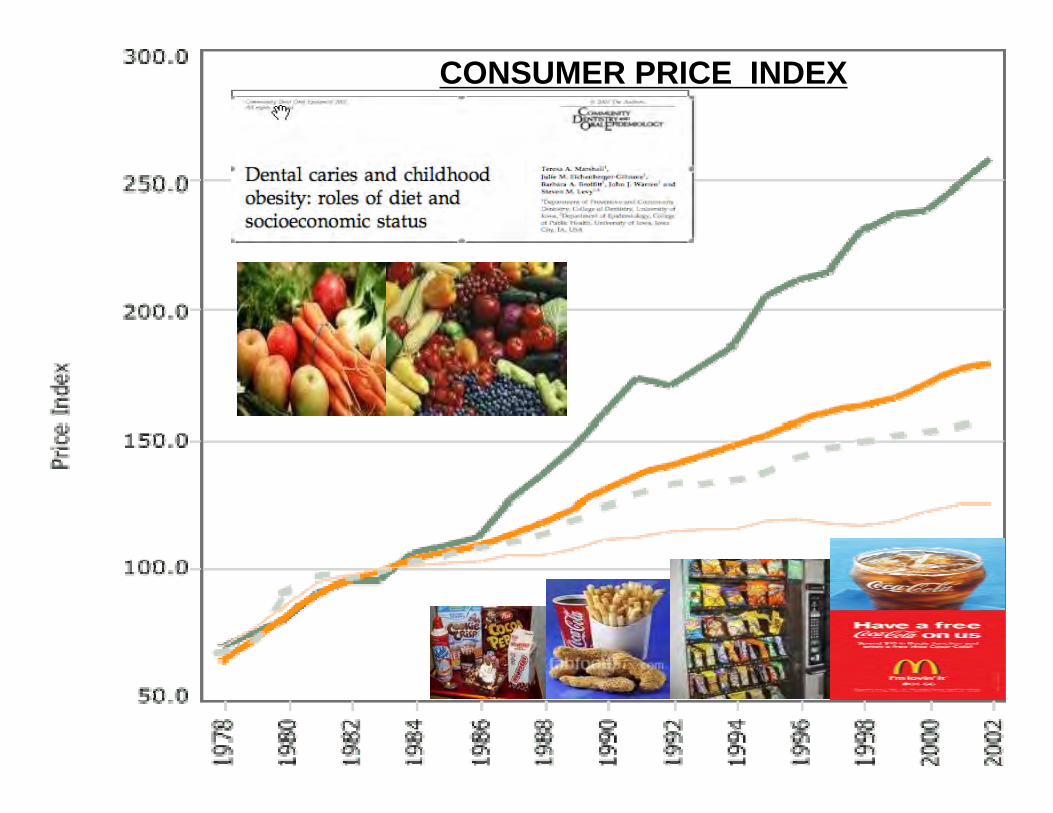
CONSUMER PRICE INDEX
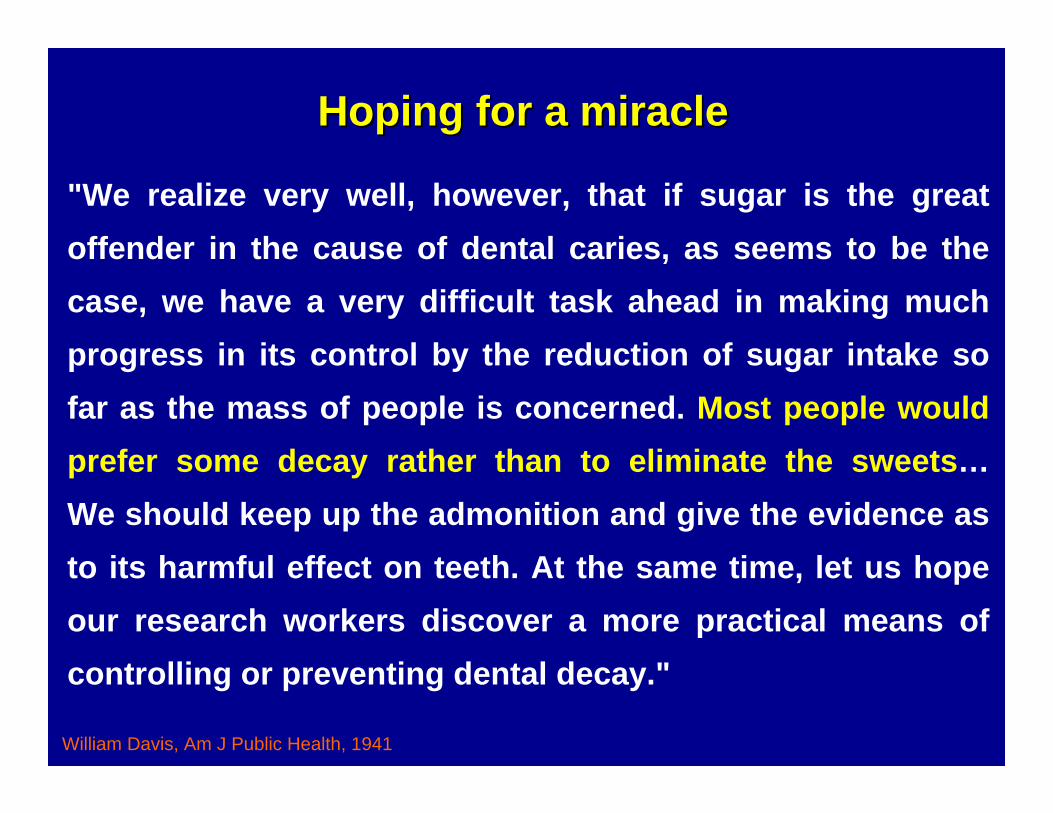
"We realize very well, however, that if sugar is the great offender in the cause of dental caries, as seems to be the case, we have a very difficult task ahead in making much progress in its control by the reduction of sugar intake so far as the mass of people is concerned. Most people would prefer some decay rather than to eliminate the sweets…We should keep up the admonition and give the evidence as to its harmful effect on teeth. At the same time, let us hope our research workers discover a more practical means of controlling or preventing dental decay."
William Davis, Am J Public Health, 1941
Hoping for a miracleHoping for a miracle
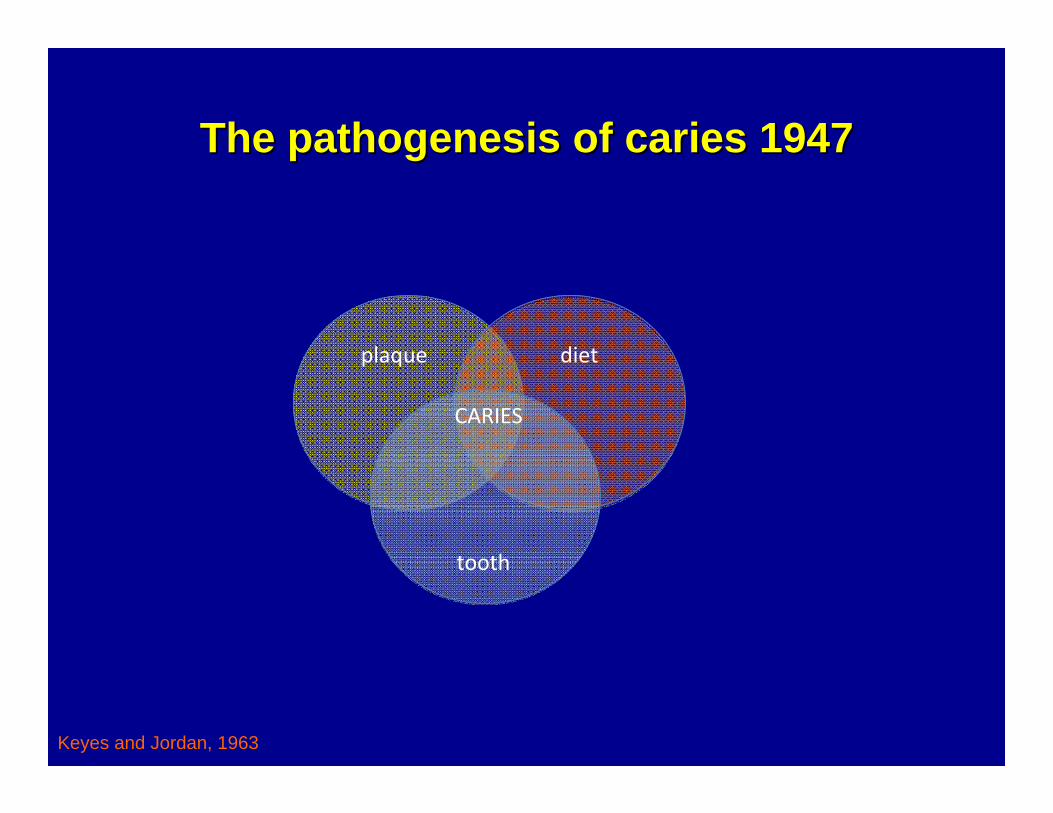
The pathogenesis of caries 1947The pathogenesis of caries 1947
plaque diet
tooth
CARIES
Keyes and Jordan, 1963
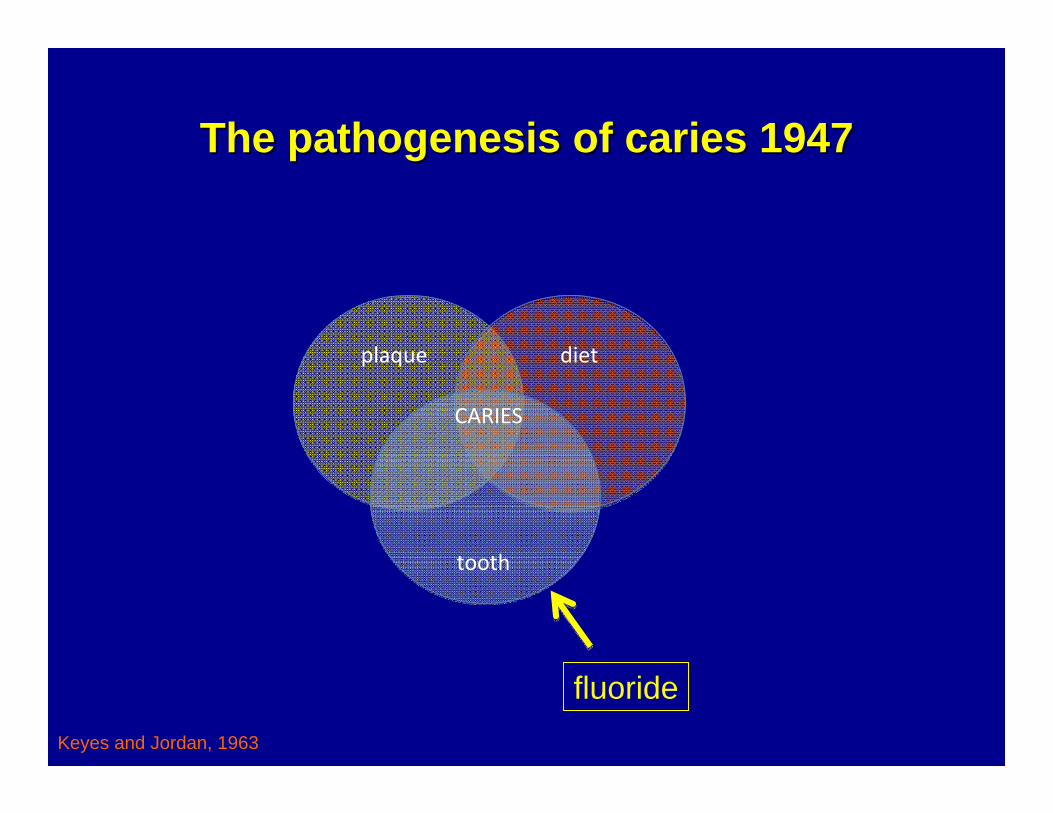
The pathogenesis of caries 1947The pathogenesis of caries 1947
plaque diet
CARIES
Keyes and Jordan, 1963
fluoride
tooth
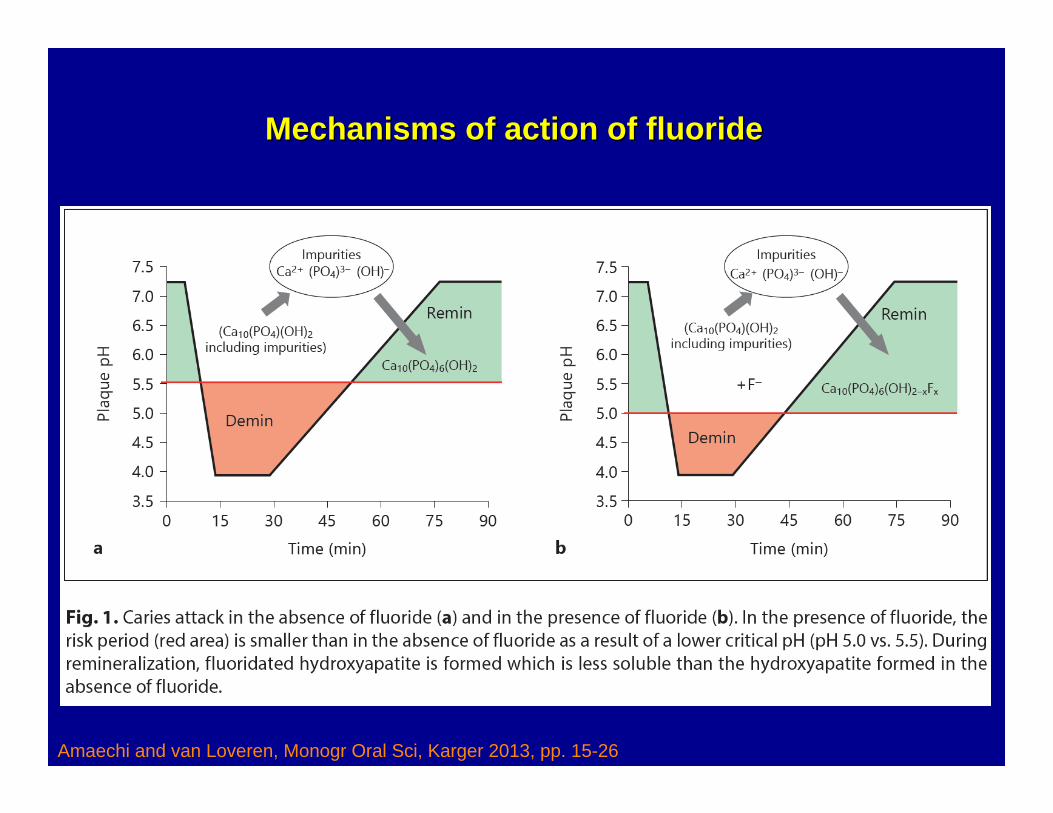
Amaechi and van Loveren, Monogr Oral Sci, Karger 2013, pp. 15-26
Mechanisms of action of fluorideMechanisms of action of fluoride
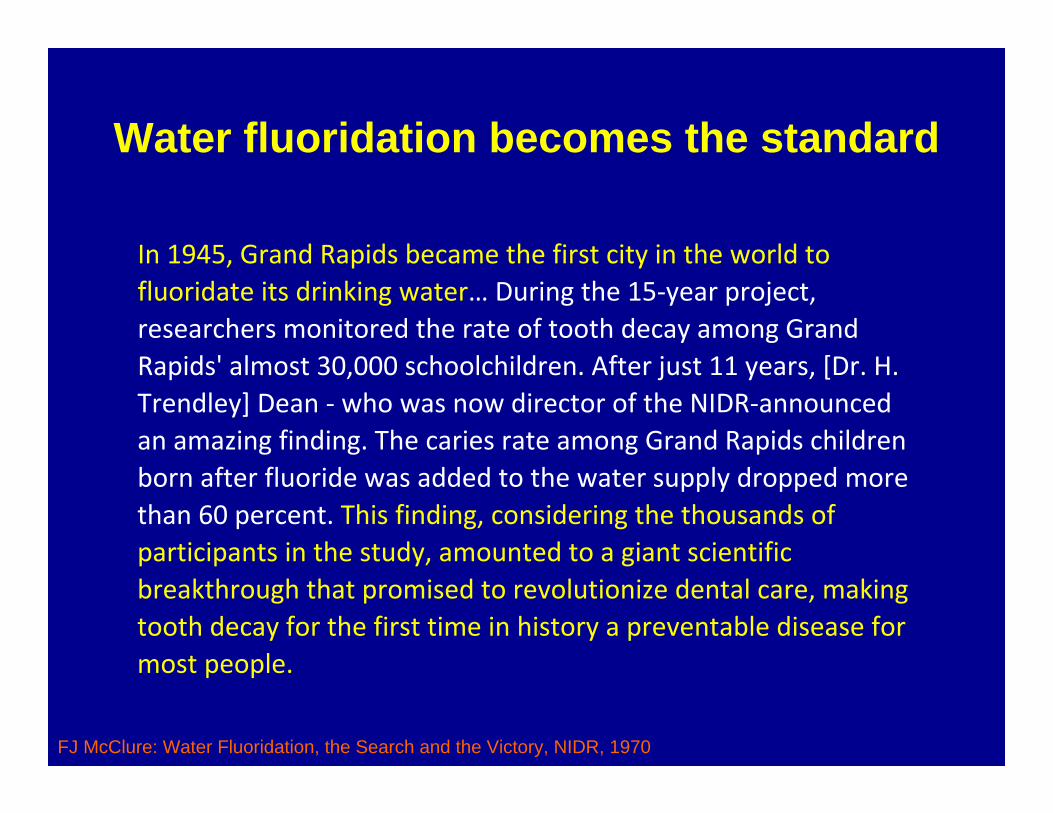
Water fluoridation becomes the standard
In 1945, Grand Rapids became the first city in the world to fluoridate its drinking water… During the 15‐year project, researchers monitored the rate of tooth decay among Grand Rapids' almost 30,000 schoolchildren. After just 11 years, [Dr. H. Trendley] Dean ‐ who was now director of the NIDR‐announced an amazing finding. The caries rate among Grand Rapids children born after fluoride was added to the water supply dropped more than 60 percent. This finding, considering the thousands of participants in the study, amounted to a giant scientific breakthrough that promised to revolutionize dental care, making tooth decay for the first time in history a preventable disease for most people.
FJ McClure: Water Fluoridation, the Search and the Victory, NIDR, 1970
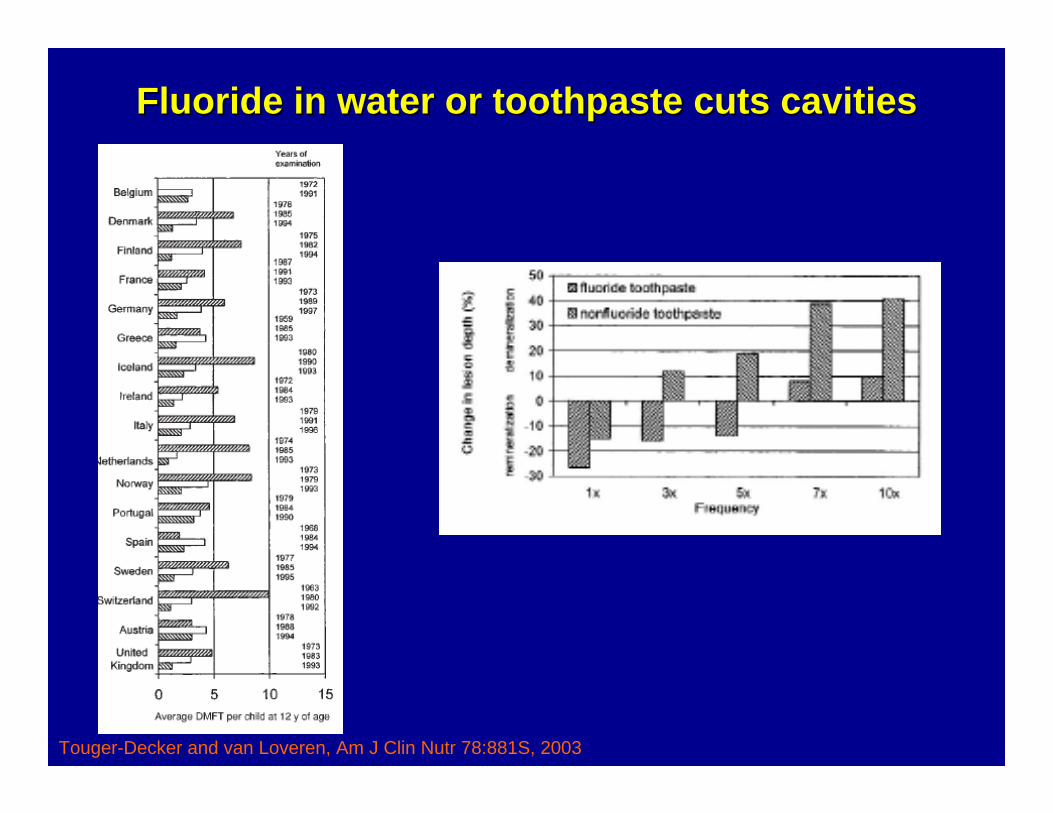
Fluoride in water or toothpaste cuts cavitiesFluoride in water or toothpaste cuts cavities
Touger-Decker and van Loveren, Am J Clin Nutr 78:881S, 2003
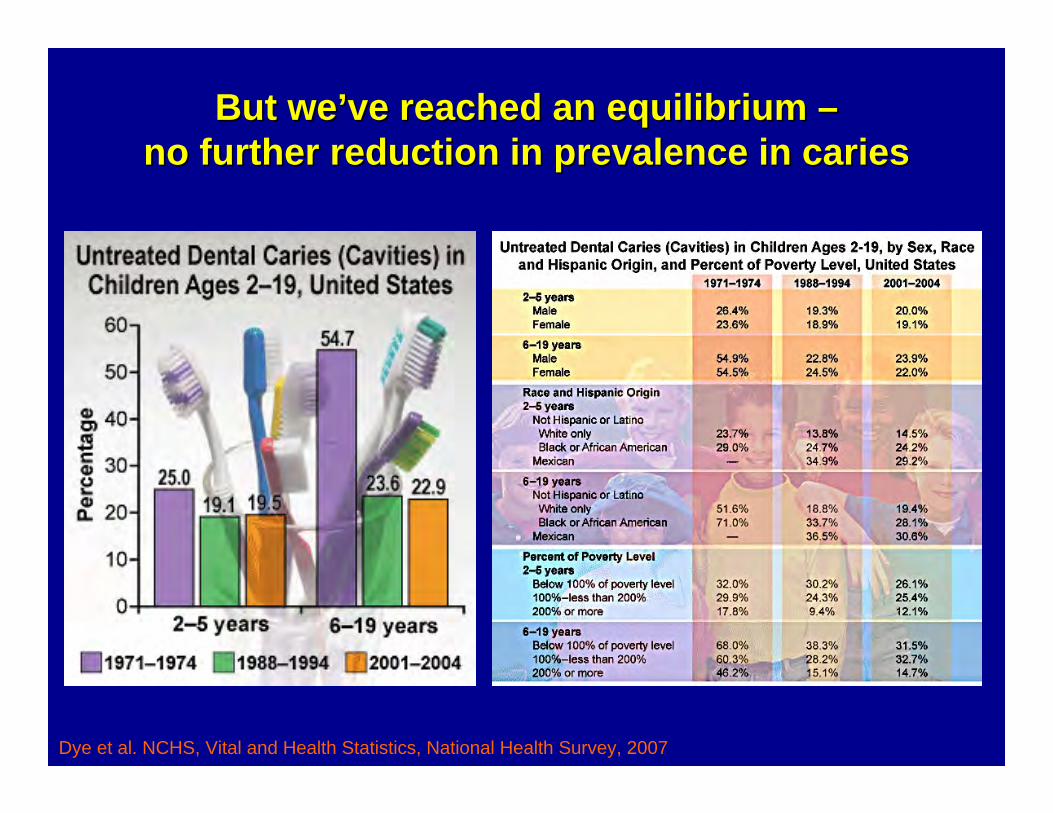
But weBut we’’ve reached an equilibrium ve reached an equilibrium ––no further reduction in prevalence in cariesno further reduction in prevalence in caries
Dye et al. NCHS, Vital and Health Statistics, National Health Survey, 2007
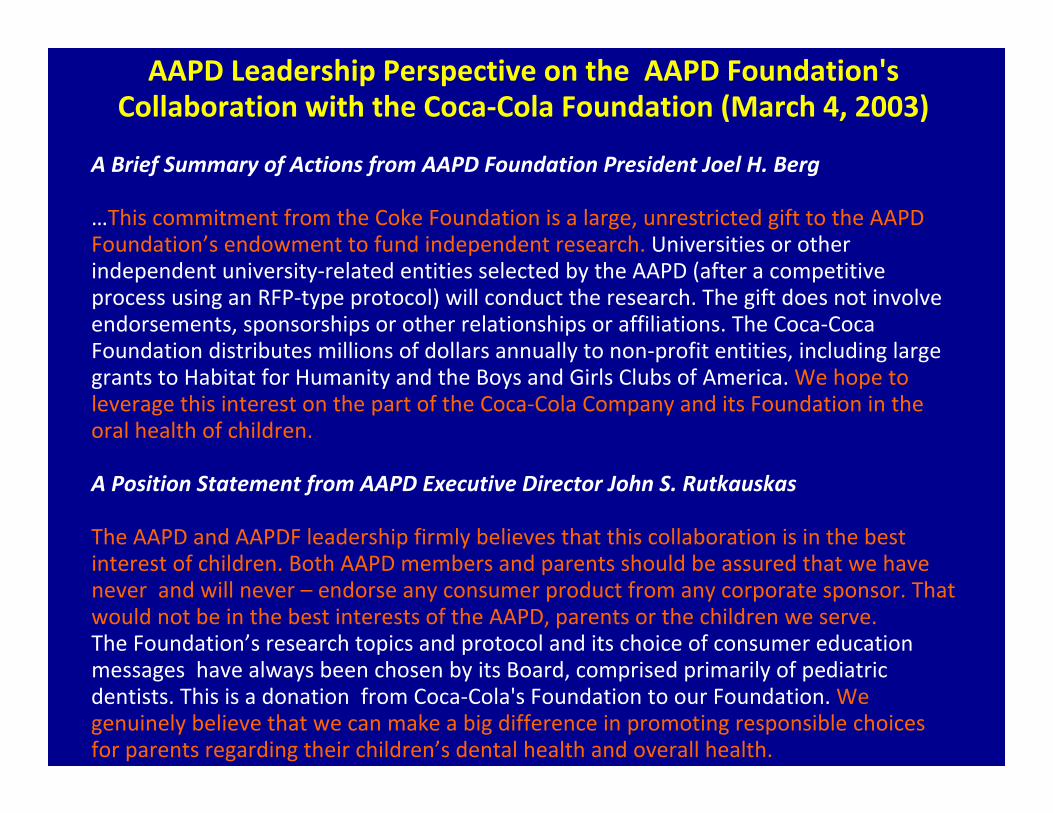
AAPD Leadership Perspective on the AAPD Foundation's Collaboration with the Coca‐Cola Foundation (March 4, 2003)
A Brief Summary of Actions from AAPD Foundation President Joel H. Berg
…This commitment from the Coke Foundation is a large, unrestricted gift to the AAPD Foundation’s endowment to fund independent research. Universities or other independent university‐related entities selected by the AAPD (after a competitive process using an RFP‐type protocol) will conduct the research. The gift does not involve endorsements, sponsorships or other relationships or affiliations. The Coca‐Coca Foundation distributes millions of dollars annually to non‐profit entities, including large grants to Habitat for Humanity and the Boys and Girls Clubs of America. We hope to leverage this interest on the part of the Coca‐Cola Company and its Foundation in the oral health of children.
A Position Statement from AAPD Executive Director John S. Rutkauskas
The AAPD and AAPDF leadership firmly believes that this collaboration is in the best interest of children. Both AAPD members and parents should be assured that we have never and will never – endorse any consumer product from any corporate sponsor. That would not be in the best interests of the AAPD, parents or the children we serve. The Foundation’s research topics and protocol and its choice of consumer education messages have always been chosen by its Board, comprised primarily of pediatric dentists. This is a donation from Coca‐Cola's Foundation to our Foundation. We genuinely believe that we can make a big difference in promoting responsible choices for parents regarding their children’s dental health and overall health.
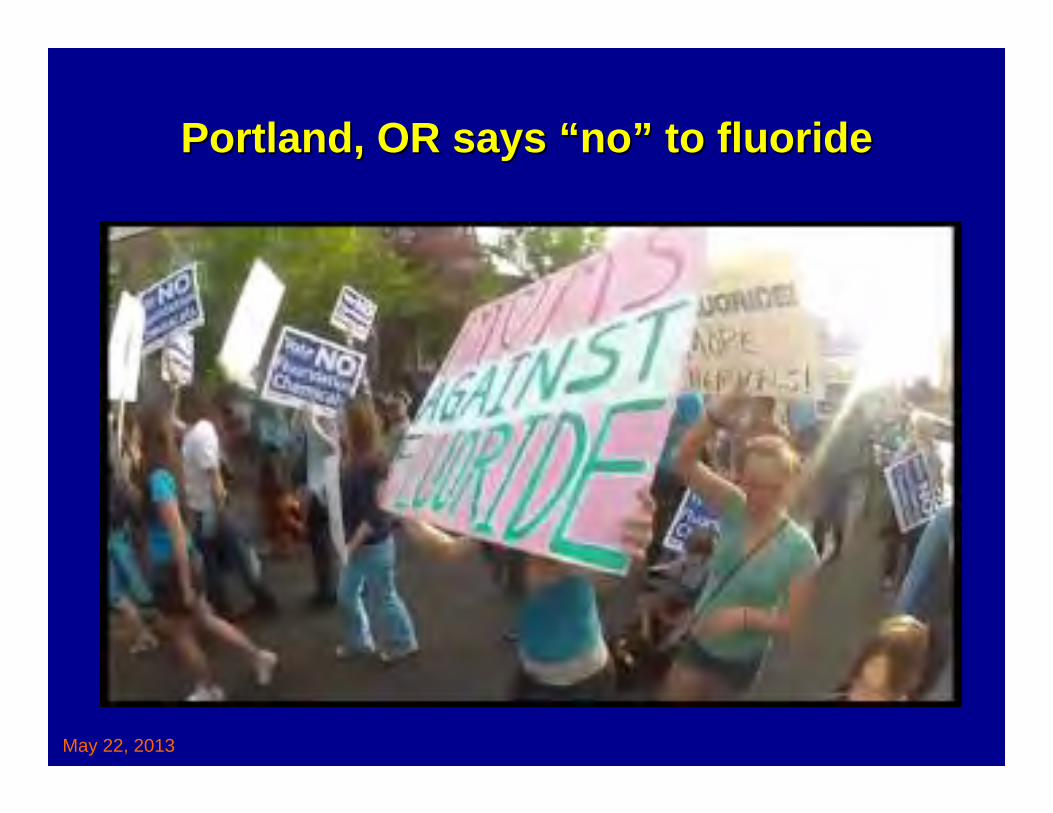
Portland, OR says Portland, OR says ““nono”” to fluorideto fluoride
May 22, 2013
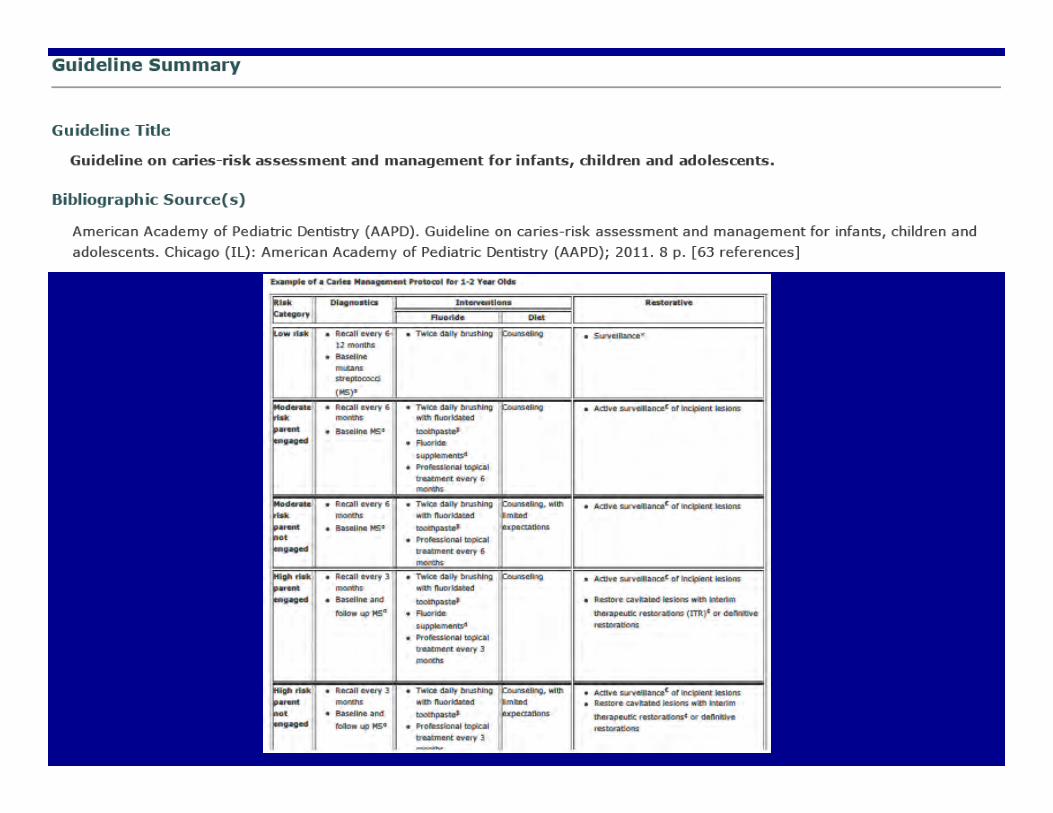
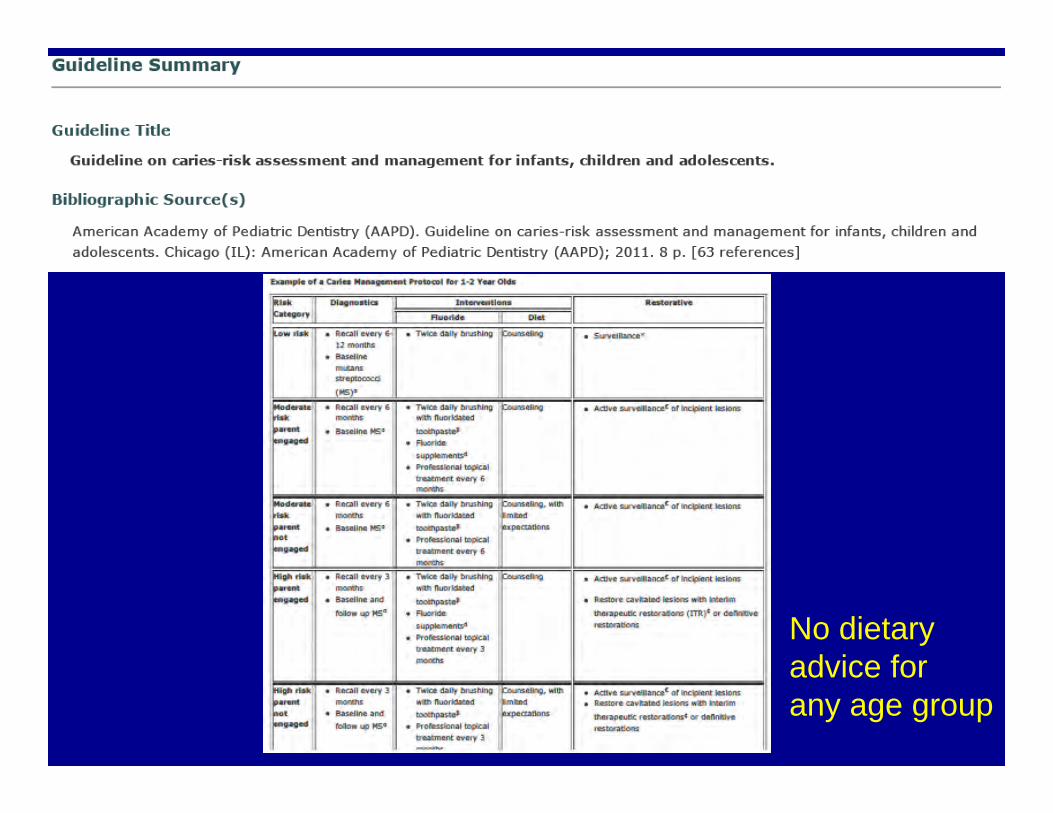
No dietaryadvice for any age group
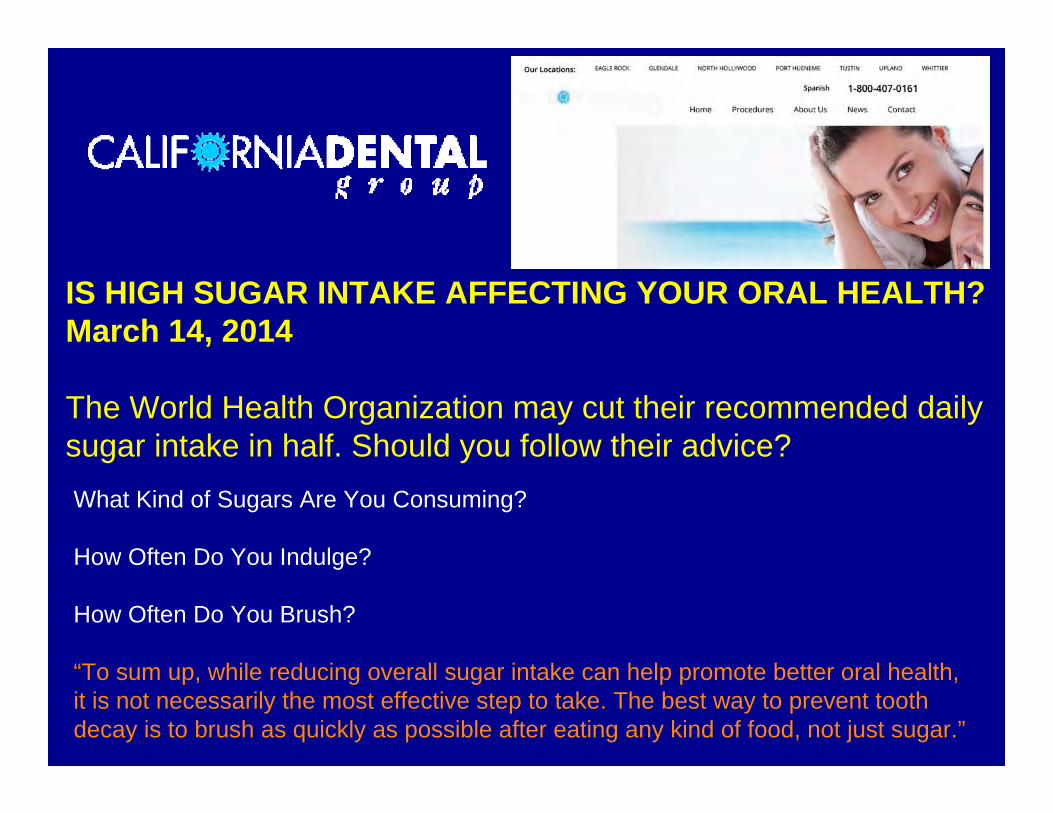
IS HIGH SUGAR INTAKE AFFECTING YOUR ORAL HEALTH?March 14, 2014
The World Health Organization may cut their recommended daily sugar intake in half. Should you follow their advice?What Kind of Sugars Are You Consuming?
How Often Do You Indulge?
How Often Do You Brush?
“To sum up, while reducing overall sugar intake can help promote better oral health, it is not necessarily the most effective step to take. The best way to prevent tooth decay is to brush as quickly as possible after eating any kind of food, not just sugar.”
Liver DecayLiver Decay
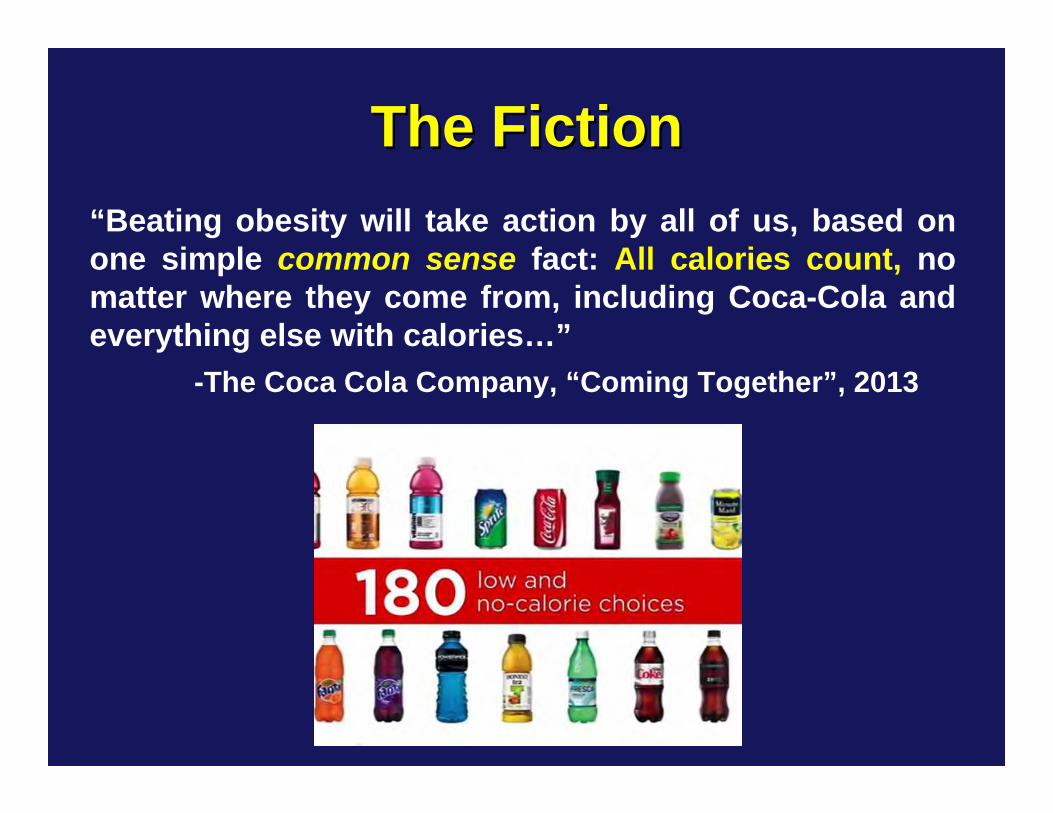
The FictionThe Fiction“Beating obesity will take action by all of us, based on one simple common sense fact: All calories count, no matter where they come from, including Coca-Cola and everything else with calories…”
-The Coca Cola Company, “Coming Together”, 2013
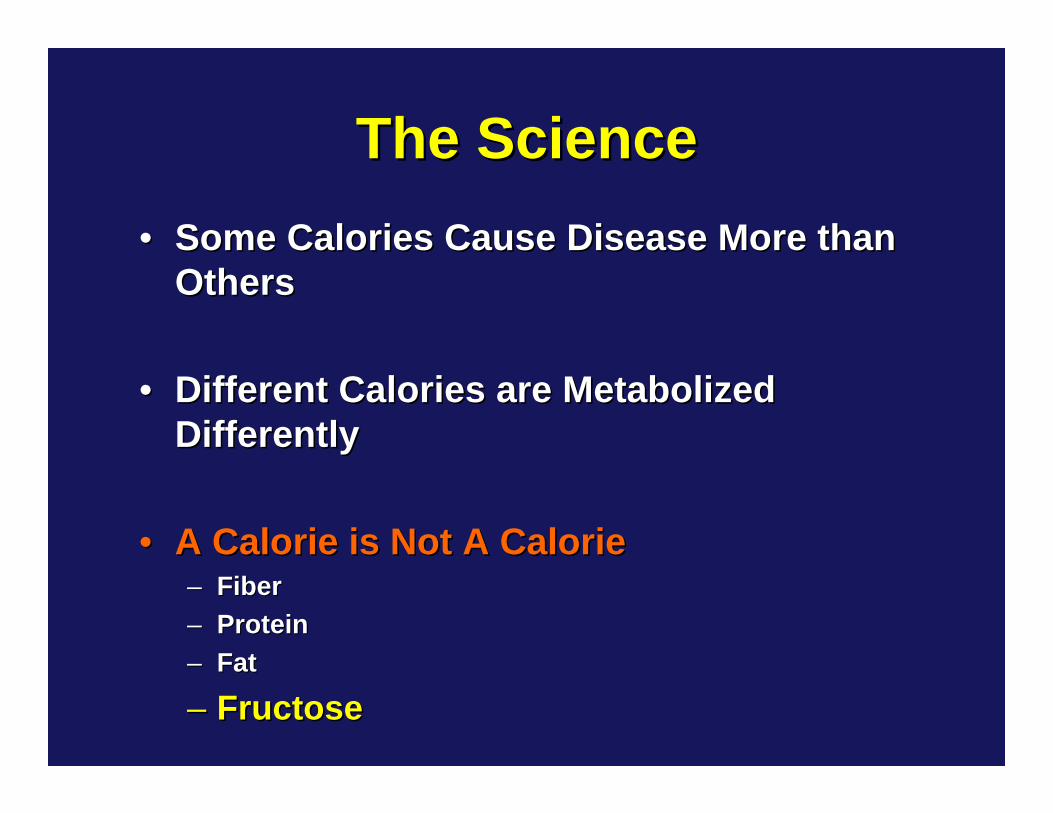
•• Some Calories Cause Disease More than Some Calories Cause Disease More than OthersOthers
•• Different Calories are Metabolized Different Calories are Metabolized DifferentlyDifferently
•• A Calorie is Not A CalorieA Calorie is Not A Calorie–– FiberFiber–– ProteinProtein–– FatFat
–– FructoseFructose
The ScienceThe Science
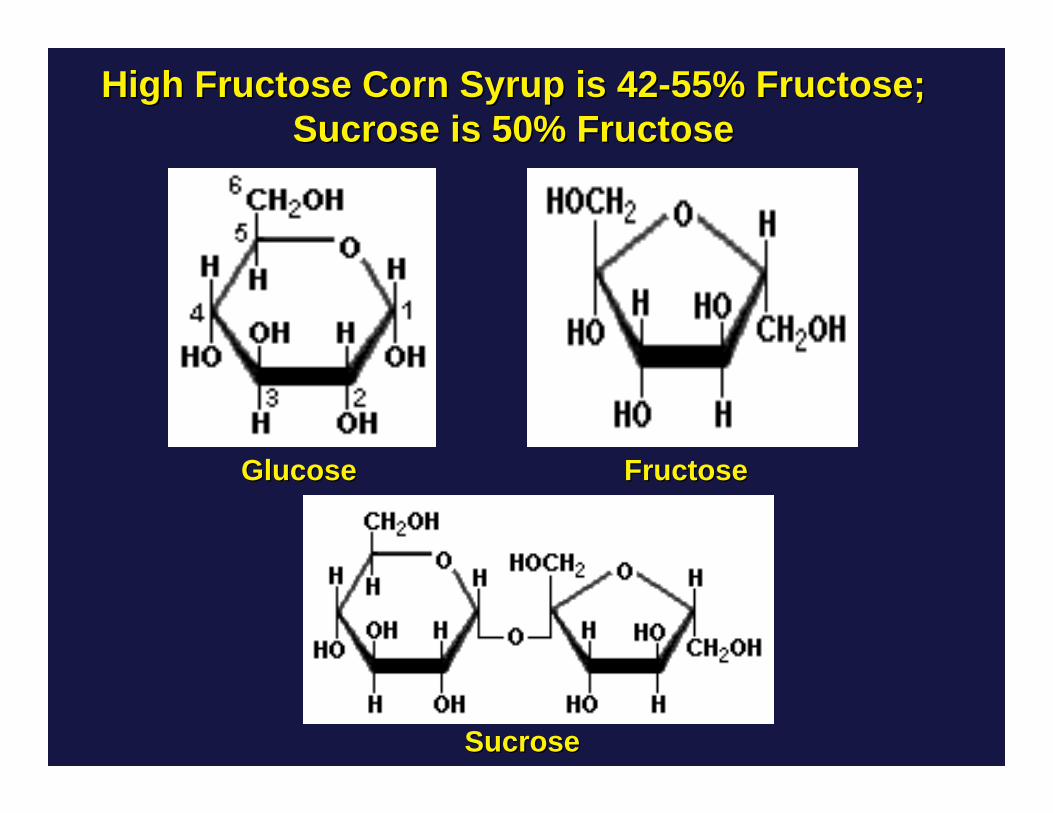
High Fructose Corn Syrup is 42High Fructose Corn Syrup is 42--55% Fructose;55% Fructose;Sucrose is 50% FructoseSucrose is 50% Fructose
GlucoseGlucose FructoseFructose
SucroseSucrose
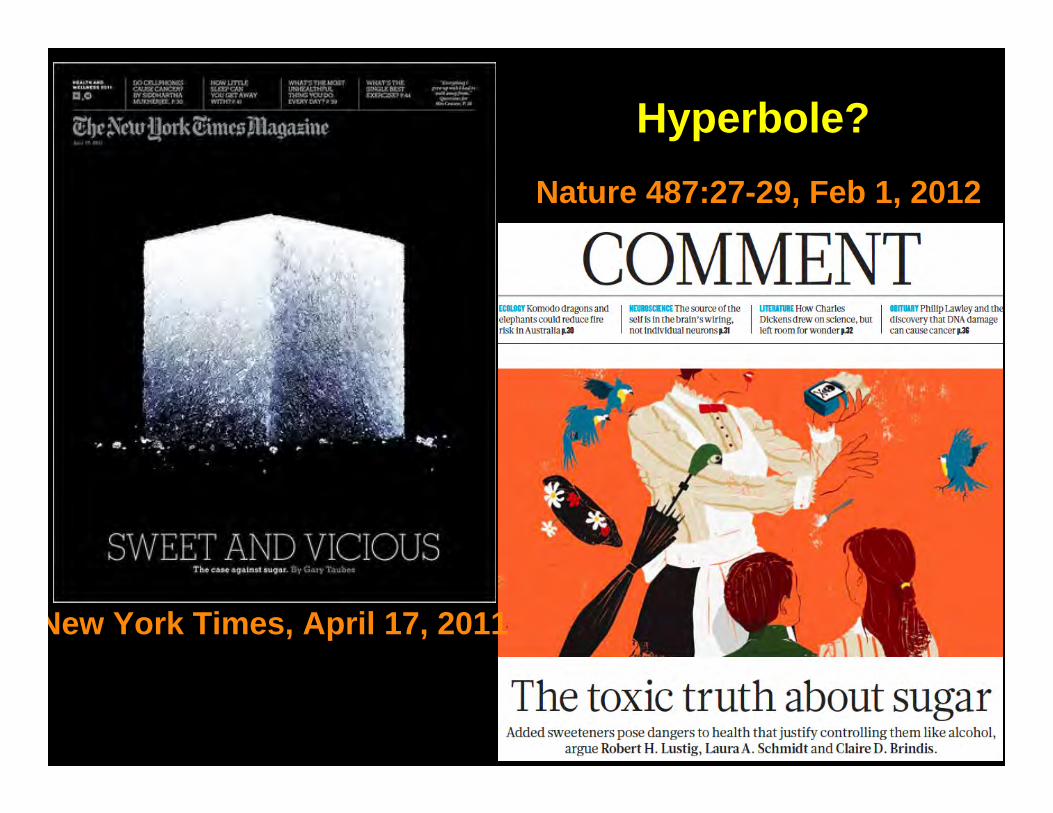
New York Times, April 17, 2011
Nature 487:27-29, Feb 1, 2012
New York Times, April 17, 2011
Nature 487:27-29, Feb 1, 2012
Hyperbole?
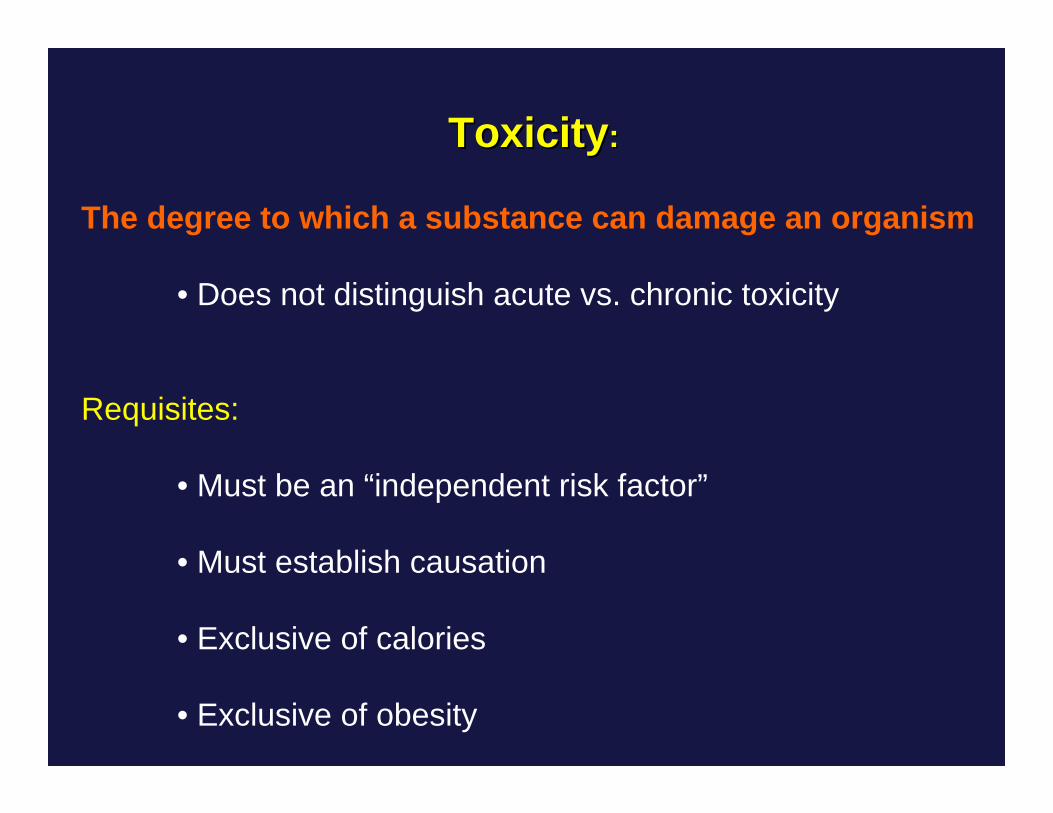
ToxicityToxicity::
The degree to which a substance can damage an organism
• Does not distinguish acute vs. chronic toxicity
Requisites:
• Must be an “independent risk factor”
• Must establish causation
• Exclusive of calories
• Exclusive of obesity
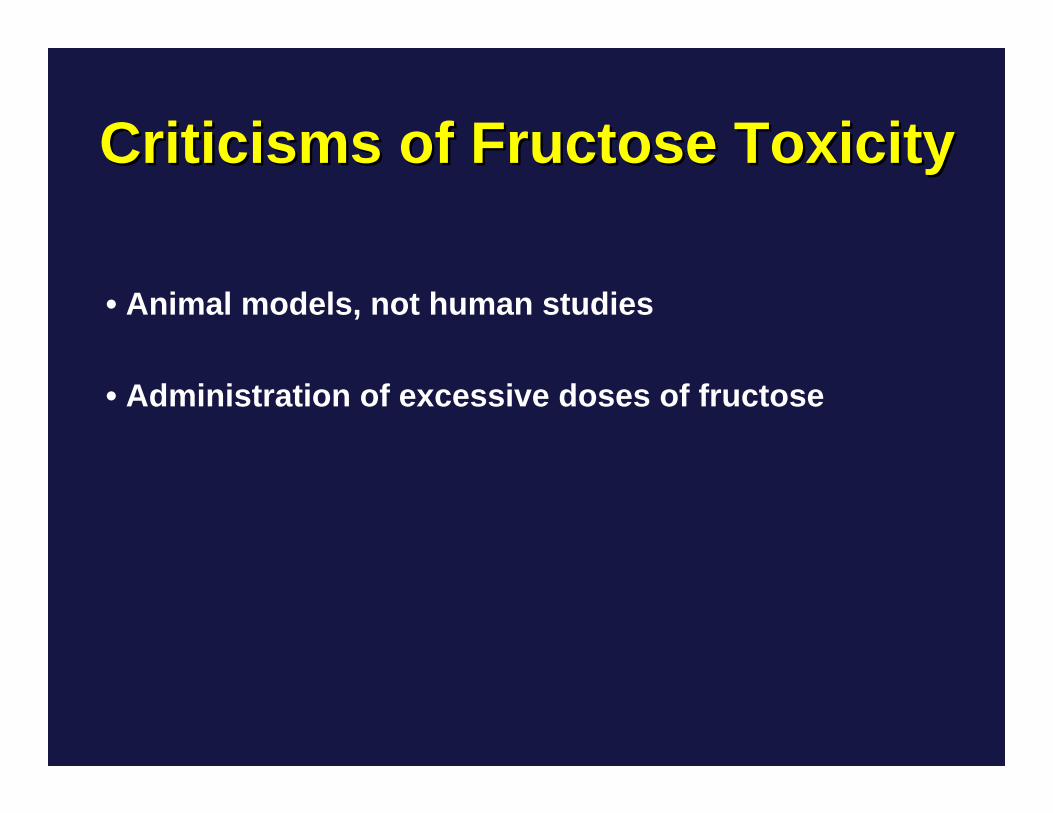
Criticisms of Fructose ToxicityCriticisms of Fructose Toxicity
• Animal models, not human studies
• Administration of excessive doses of fructose
Criticisms of Fructose ToxicityCriticisms of Fructose Toxicity
• Animal models, not human studies
• Administration of excessive doses of fructose
WILL LIMIT DISCUSSION TO: HUMAN DATA, HUMAN CONSUMPTION,AND IN DOSES ROUTINELY INGESTED
150
125
100
75
50
25
0
150
125
100
75
50
25
0
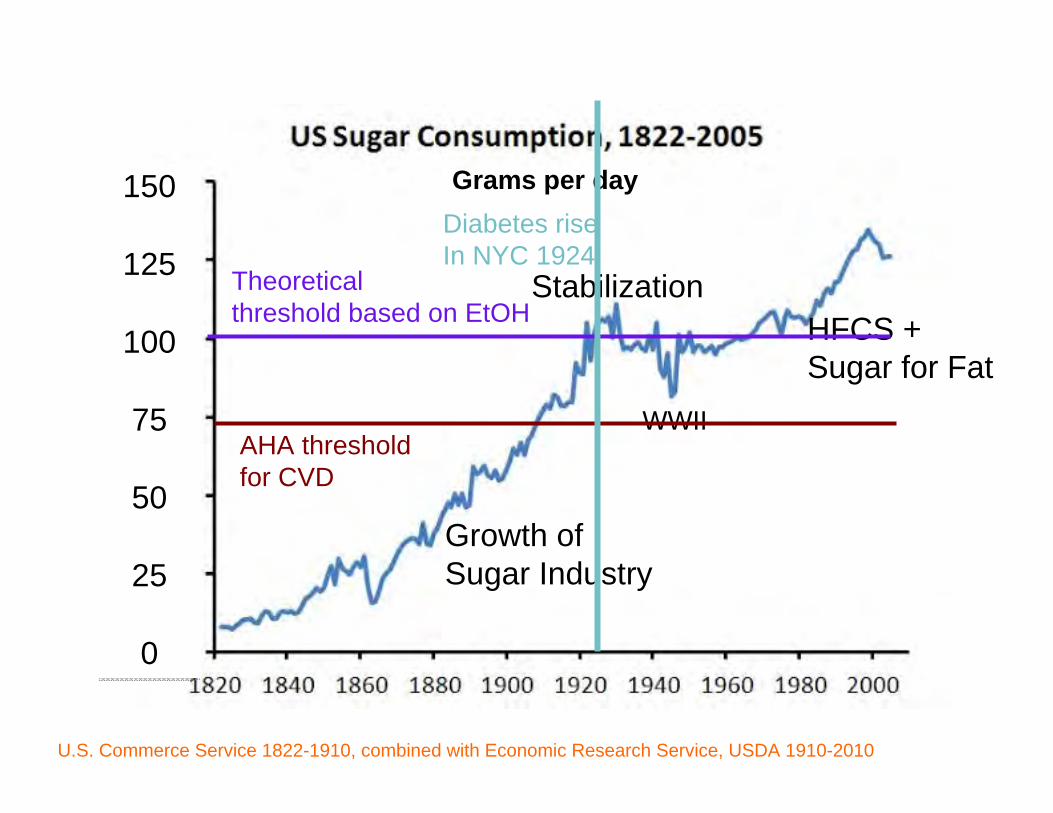
Grams per day
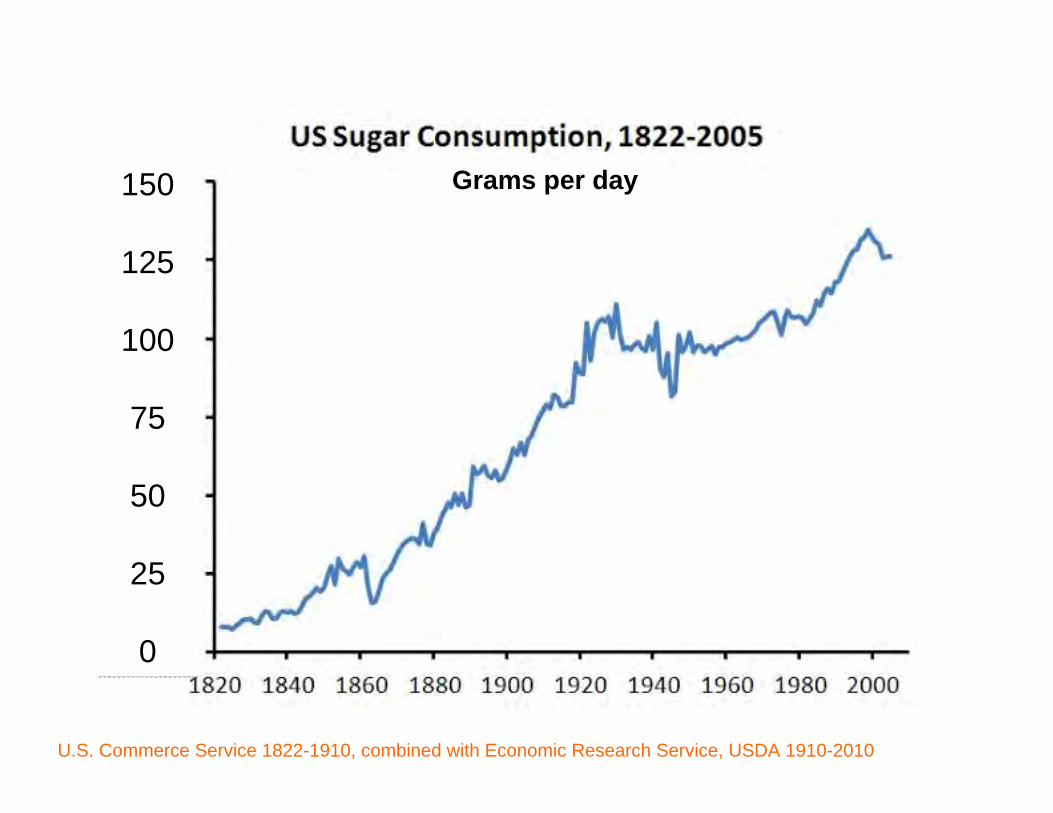
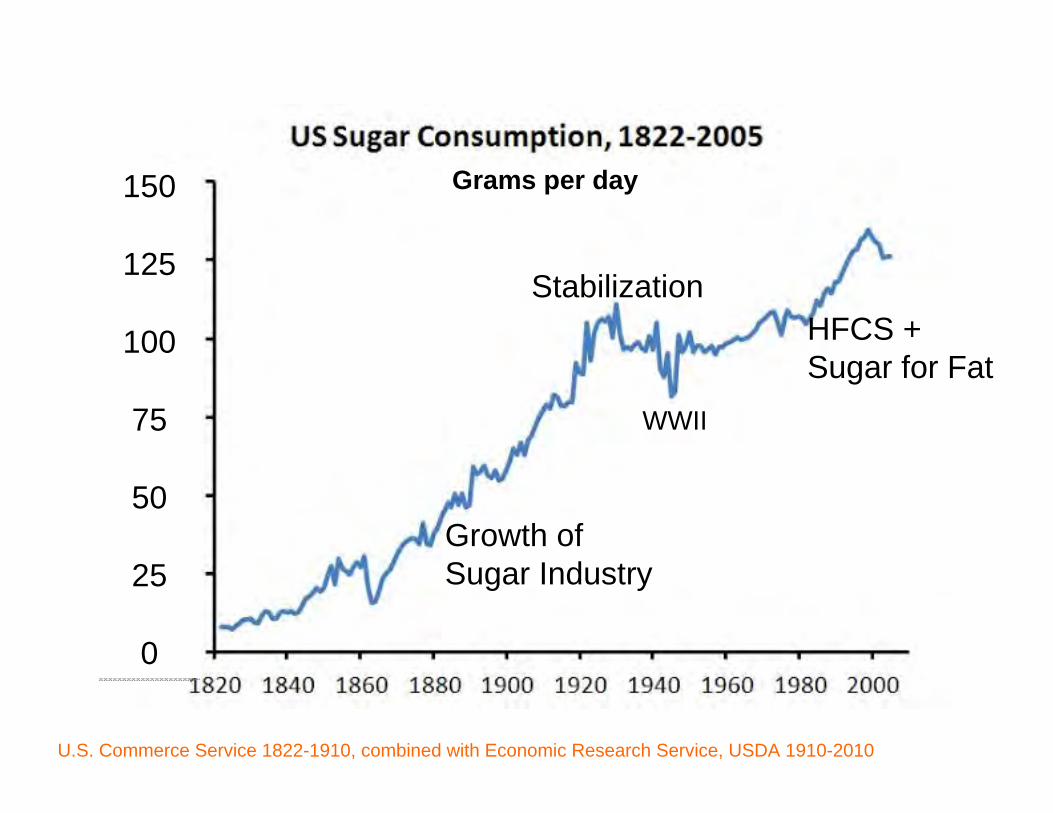
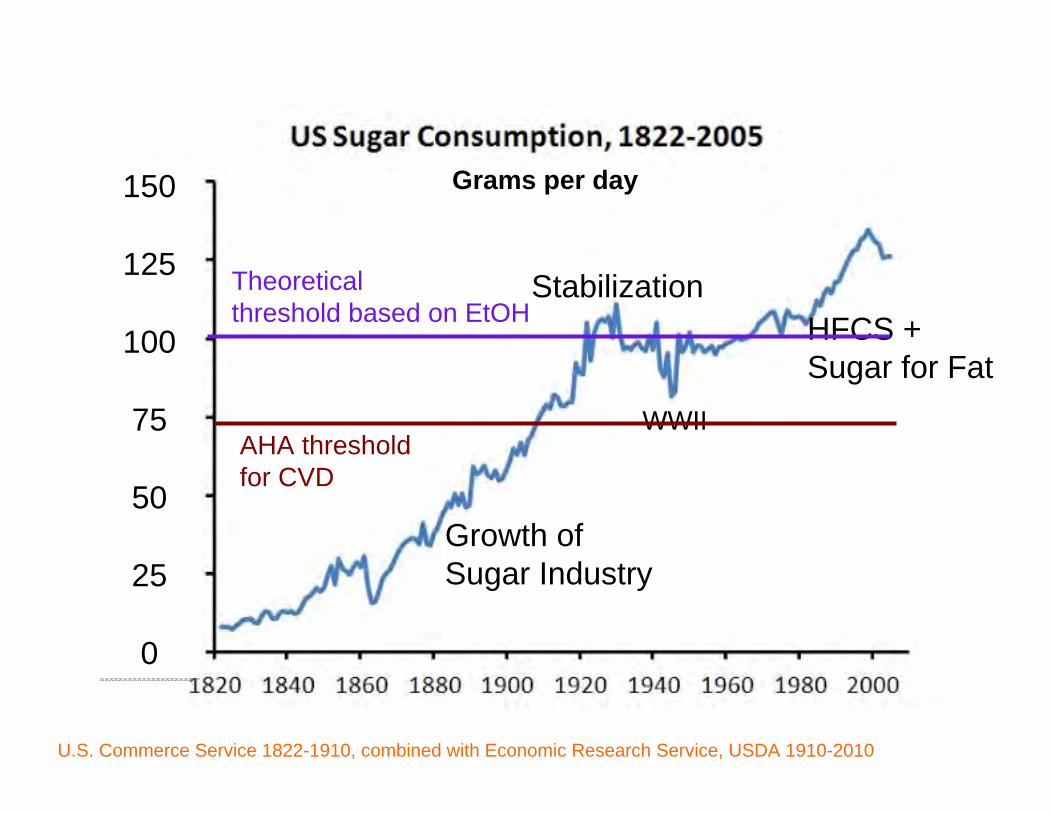
U.S. Commerce Service 1822-1910, combined with Economic Research Service, USDA 1910-2010
150
125
100
75
50
25
0
150
125
100
75
50
25
0
Grams per day
U.S. Commerce Service 1822-1910, combined with Economic Research Service, USDA 1910-2010
Growth ofSugar Industry
StabilizationHFCS +Sugar for Fat
WWII
150
125
100
75
50
25
0
150
125
100
75
50
25
0
Grams per day
U.S. Commerce Service 1822-1910, combined with Economic Research Service, USDA 1910-2010
Growth ofSugar Industry
StabilizationHFCS +Sugar for Fat
WWII
Theoreticalthreshold based on EtOH
AHA threshold for CVD
150
125
100
75
50
25
0
150
125
100
75
50
25
0
Grams per day
U.S. Commerce Service 1822-1910, combined with Economic Research Service, USDA 1910-2010
Growth ofSugar Industry
Stabilization
WWII
HFCS +Sugar for Fat
AHA threshold for CVD
Theoreticalthreshold based on EtOH
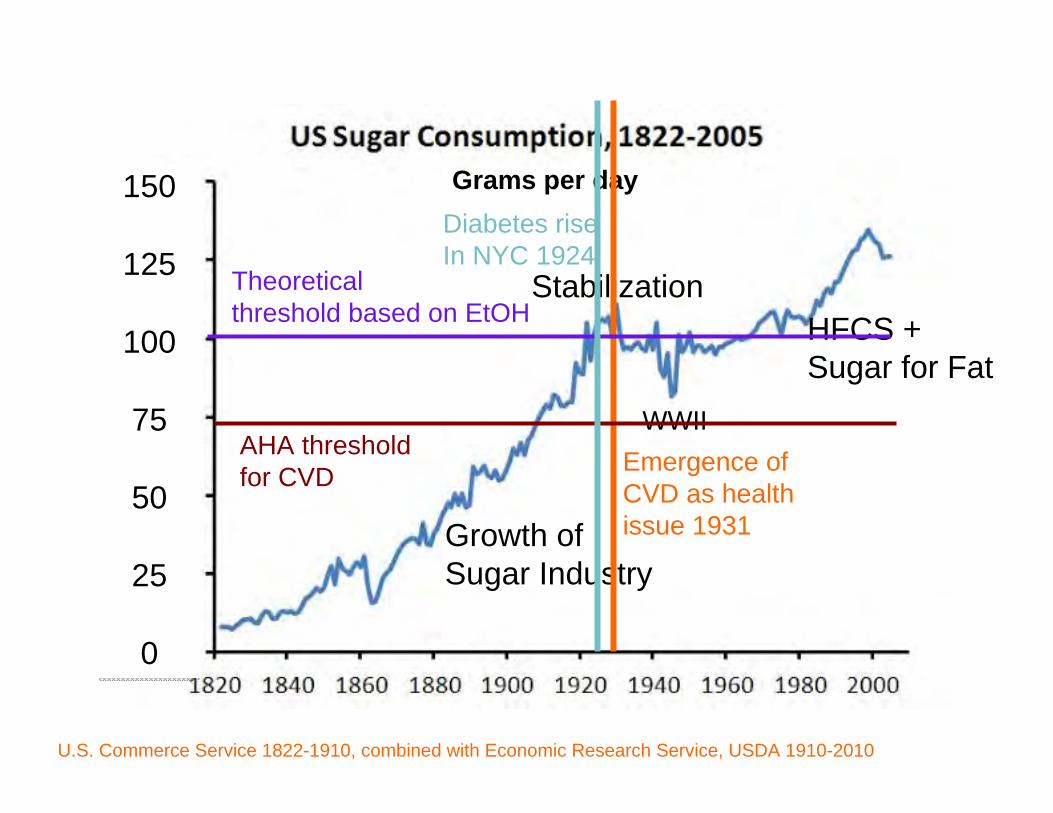
Diabetes riseIn NYC 1924
150
125
100
75
50
25
0
150
125
100
75
50
25
0
Grams per day
U.S. Commerce Service 1822-1910, combined with Economic Research Service, USDA 1910-2010
Growth ofSugar Industry
Stabilization
WWIIEmergence of CVD as health issue 1931
HFCS +Sugar for Fat
AHA threshold for CVD
Theoreticalthreshold based on EtOH
Diabetes riseIn NYC 1924
150
125
100
75
50
25
0
150
125
100
75
50
25
0
Grams per day
U.S. Commerce Service 1822-1910, combined with Economic Research Service, USDA 1910-2010
Growth ofSugar Industry
Stabilization
WWIIEmergence of CVD as health issue 1931
HFCS +Sugar for Fat
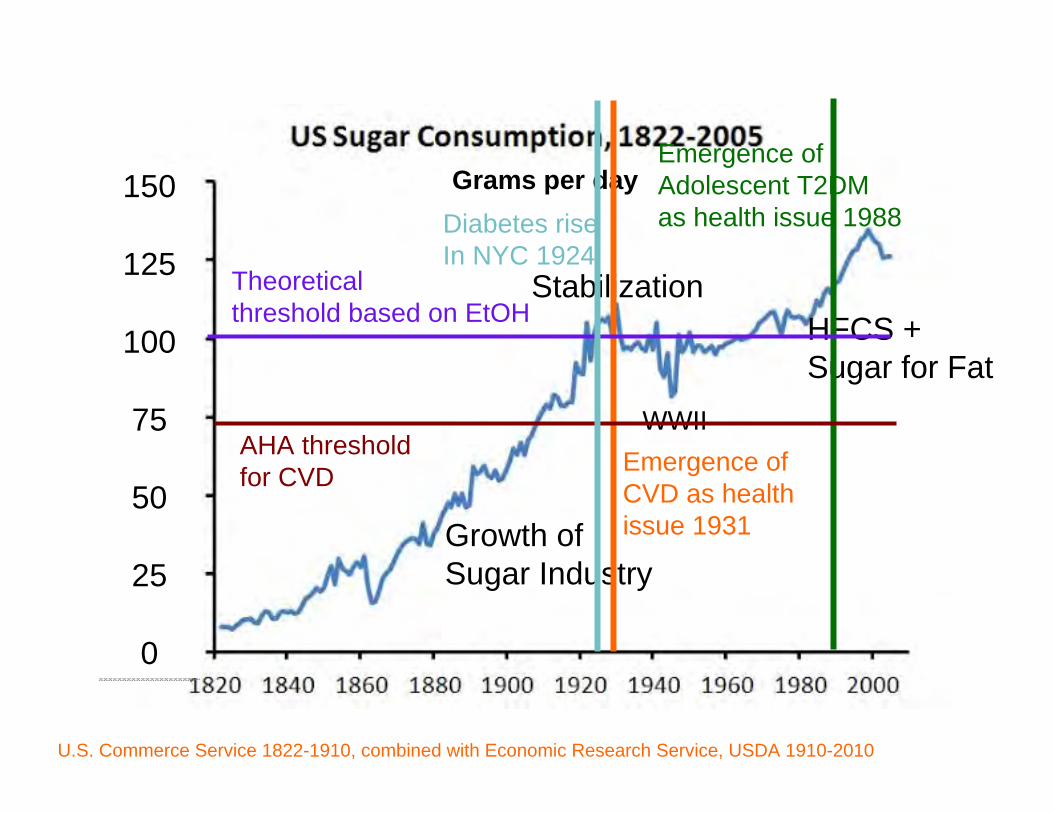
Emergence of Adolescent T2DM as health issue 1988
AHA threshold for CVD
Theoreticalthreshold based on EtOH
Diabetes riseIn NYC 1924
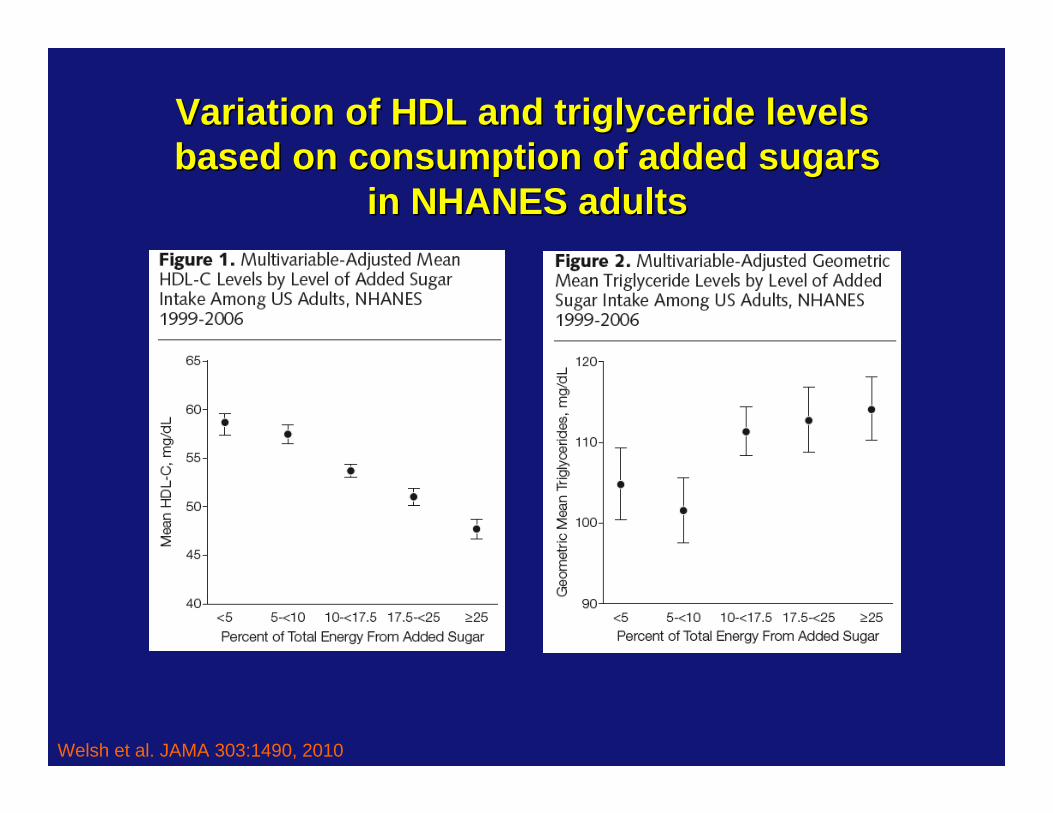
Sugar and Heart DiseaseSugar and Heart Disease
Welsh et al. JAMA 303:1490, 2010
Variation of HDL and triglyceride levels Variation of HDL and triglyceride levels based on consumption of added sugarsbased on consumption of added sugars
in NHANES adultsin NHANES adults
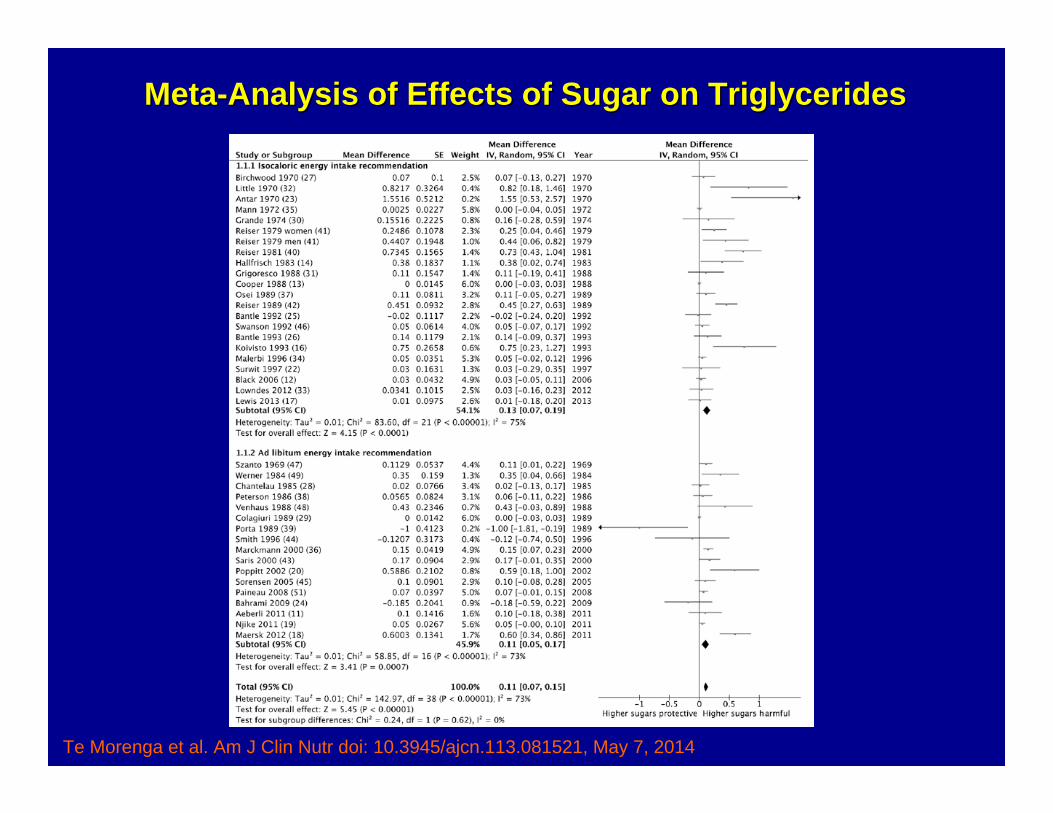
MetaMeta--Analysis of Effects of Sugar on TriglyceridesAnalysis of Effects of Sugar on Triglycerides
Te Morenga et al. Am J Clin Nutr doi: 10.3945/ajcn.113.081521, May 7, 2014
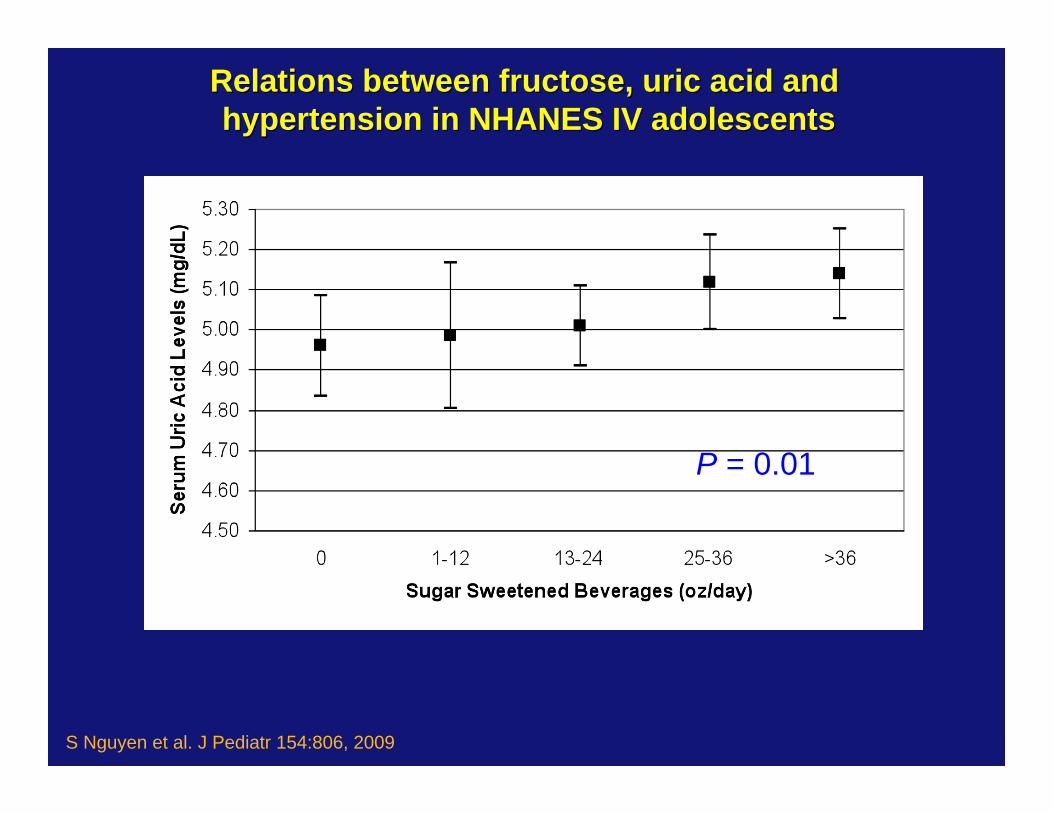
S Nguyen et al. J Pediatr 154:806, 2009
Relations between fructose, uric acid and Relations between fructose, uric acid and hypertension in NHANES IV adolescentshypertension in NHANES IV adolescents
P = 0.01
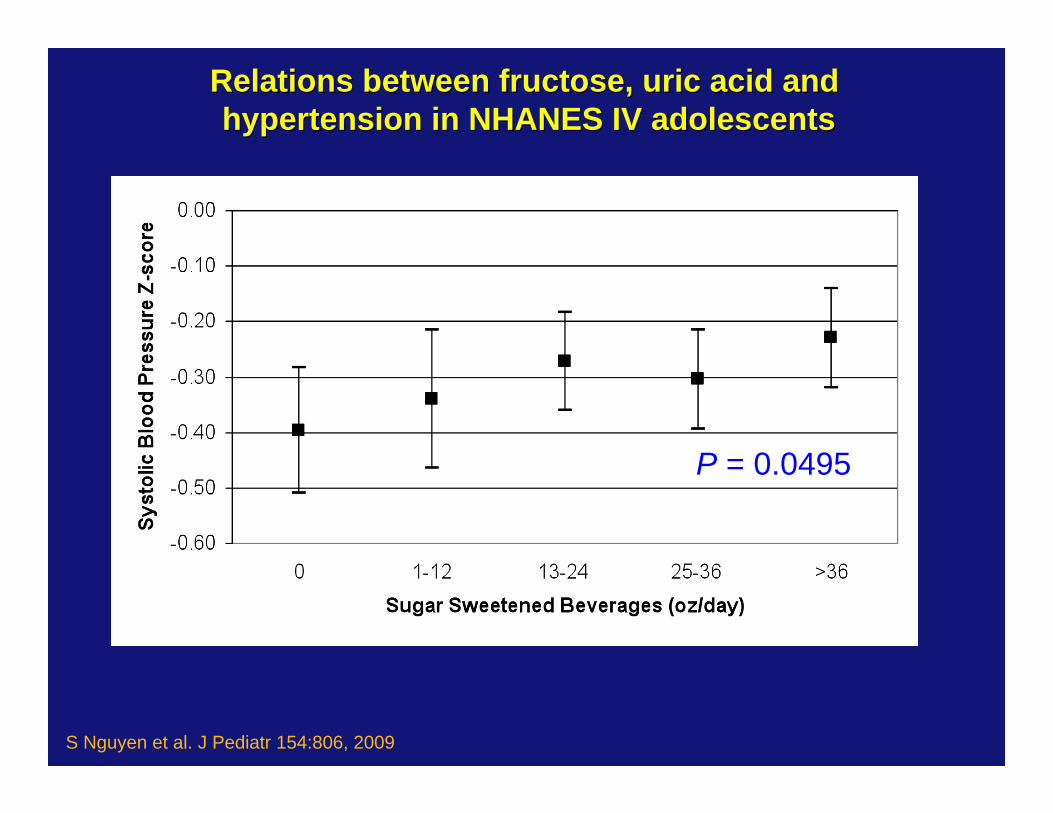
Relations between fructose, uric acid and Relations between fructose, uric acid and hypertension in NHANES IV adolescentshypertension in NHANES IV adolescents
P = 0.0495
S Nguyen et al. J Pediatr 154:806, 2009
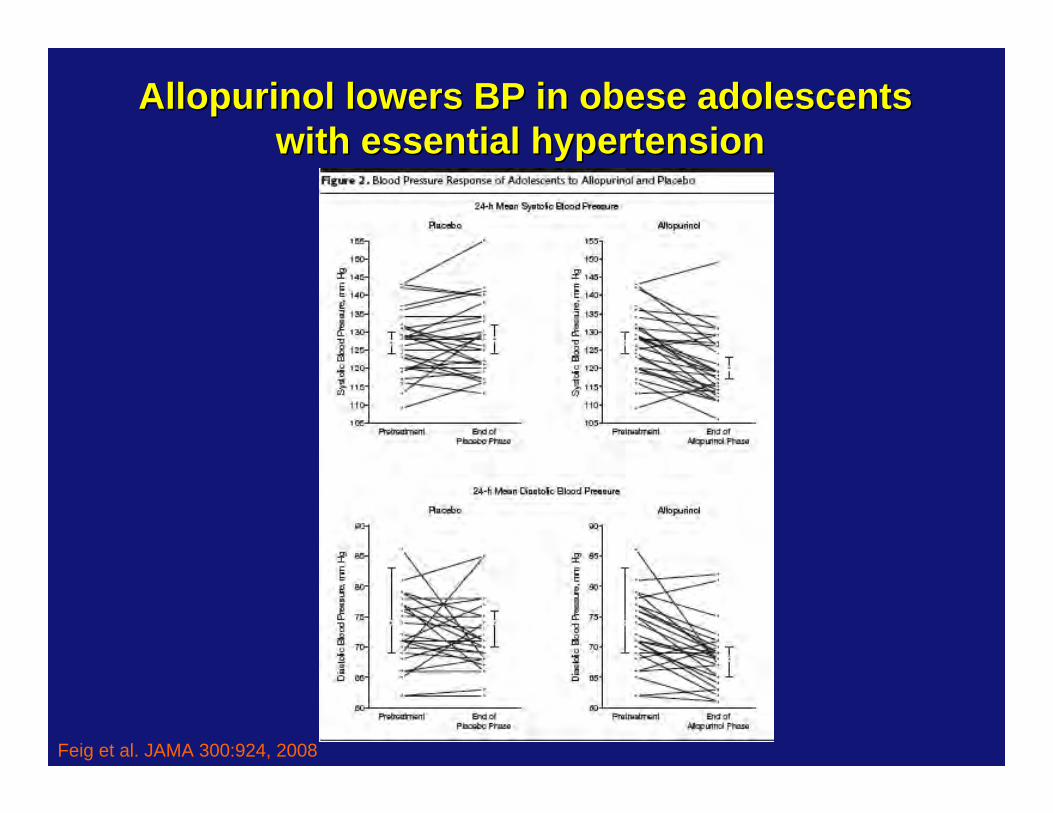
Feig et al. JAMA 300:924, 2008
Allopurinol lowers BP in obese adolescentsAllopurinol lowers BP in obese adolescentswith essential hypertension with essential hypertension
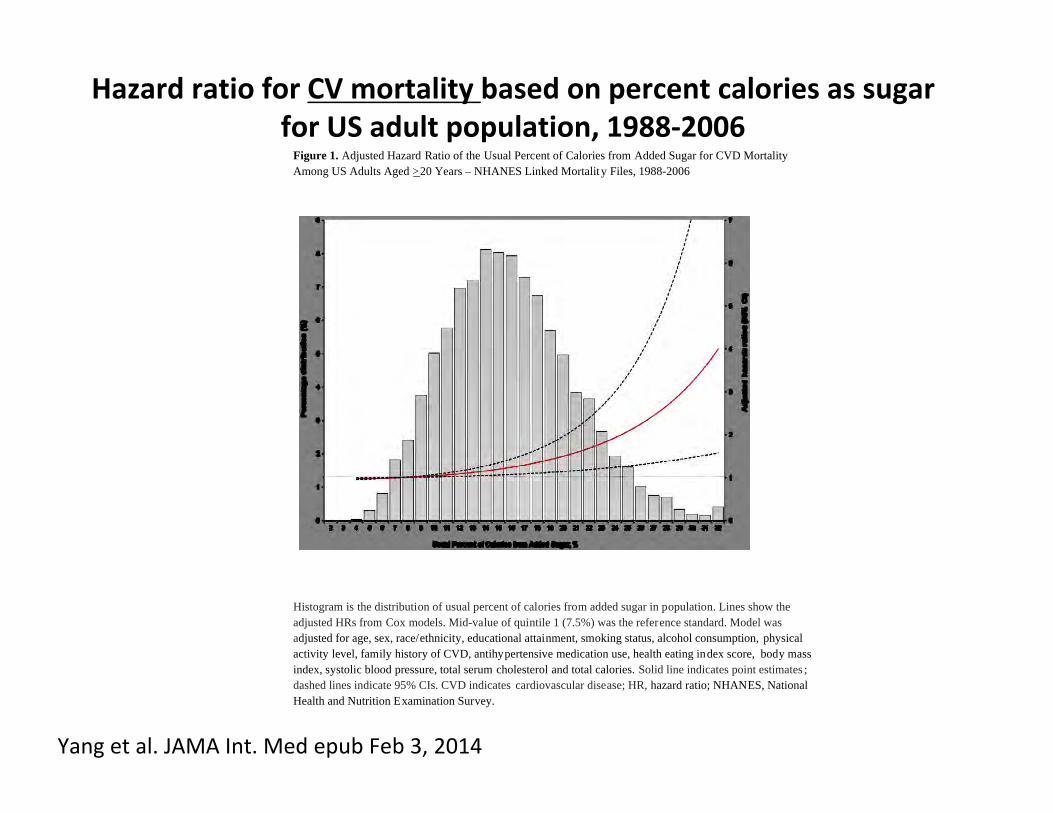
Figure 1. Adjusted Hazard Ratio of the Usual Percent of Calories from Added Sugar for CVD Mortality Among US Adults Aged >20 Years – NHANES Linked Mortality Files, 1988-2006
Histogram is the distribution of usual percent of calories from added sugar in population. Lines show the adjusted HRs from Cox models. Mid-value of quintile 1 (7.5%) was the reference standard. Model was adjusted for age, sex, race/ethnicity, educational attainment, smoking status, alcohol consumption, physical activity level, family history of CVD, antihypertensive medication use, health eating index score, body mass index, systolic blood pressure, total serum cholesterol and total calories. Solid line indicates point estimates ; dashed lines indicate 95% CIs. CVD indicates cardiovascular disease; HR, hazard ratio; NHANES, National Health and Nutrition Examination Survey.
Yang et al. JAMA Int. Med epub Feb 3, 2014
Hazard ratio for CV mortality based on percent calories as sugarfor US adult population, 1988‐2006
Sugar and DiabetesSugar and Diabetes
—— Confound by Obesity Confound by Obesity
—— PlausibilityPlausibility
—— MechanismsMechanisms
—— Human CorrelationHuman Correlation
—— Human CausationHuman Causation
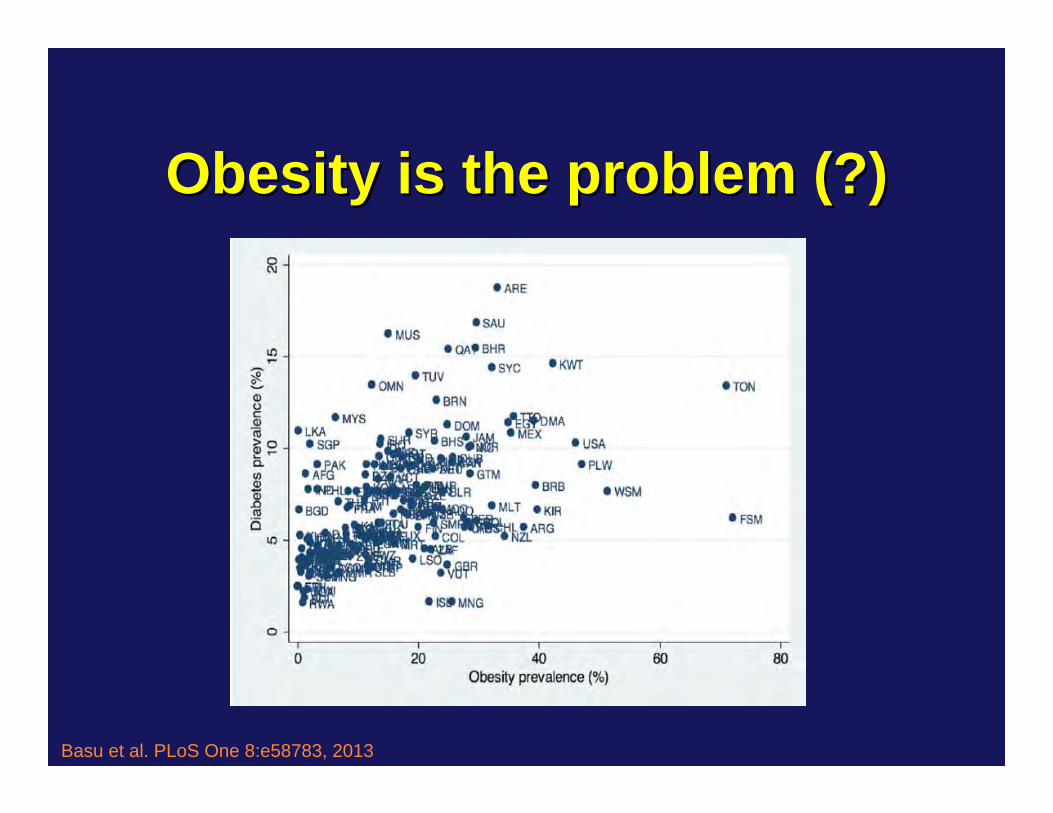
Sugar and Diabetes: Sugar and Diabetes: Confound by ObesityConfound by Obesity
Obesity is the problem (?)Obesity is the problem (?)
Basu et al. PLoS One 8:e58783, 2013
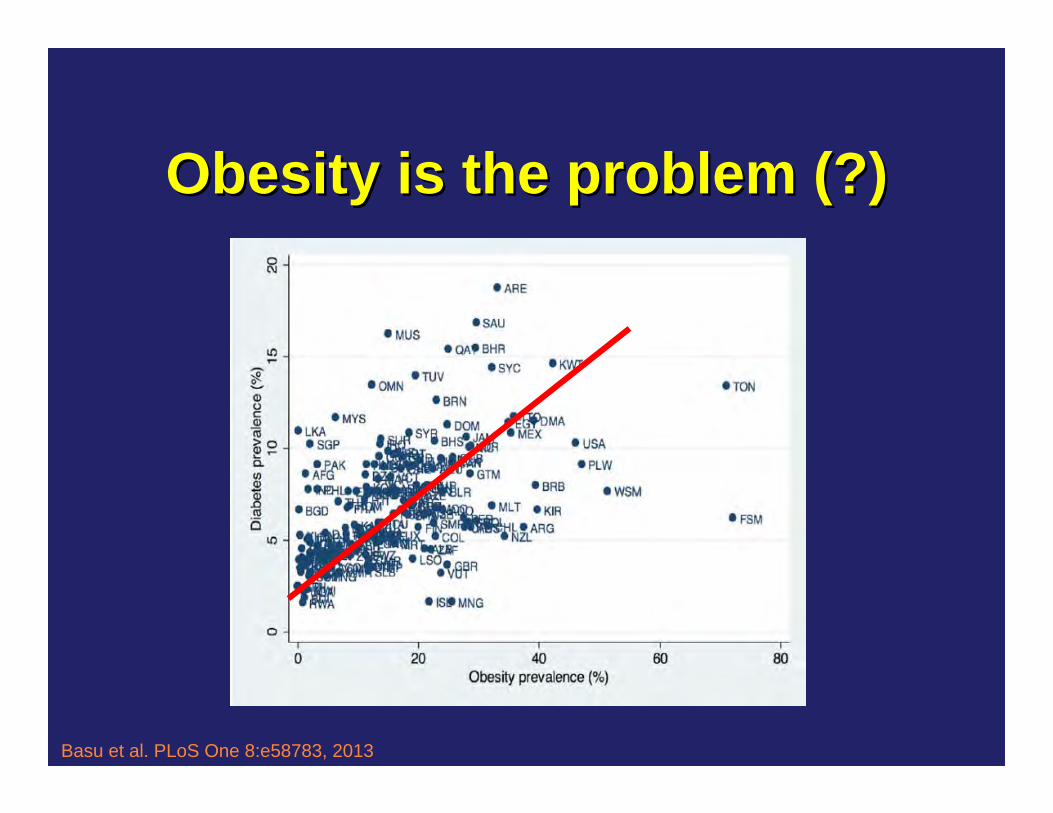
Obesity is the problem (?)Obesity is the problem (?)
Basu et al. PLoS One 8:e58783, 2013
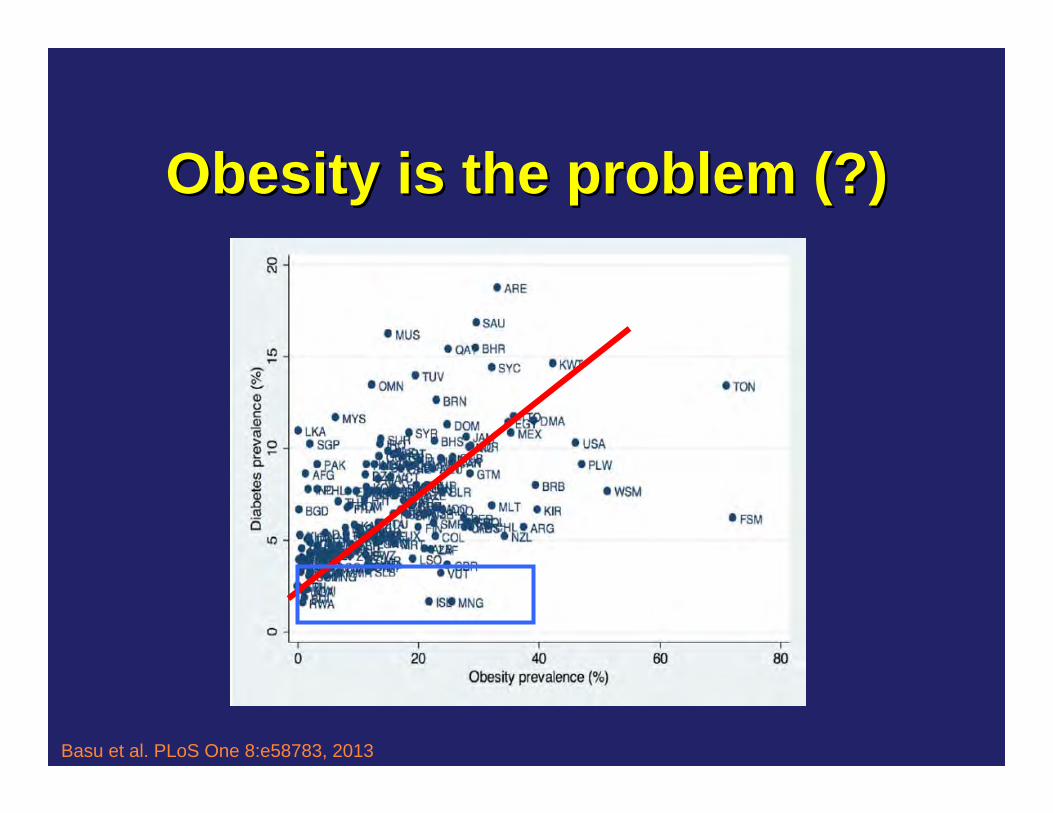
Obesity is the problem (?)Obesity is the problem (?)
Basu et al. PLoS One 8:e58783, 2013
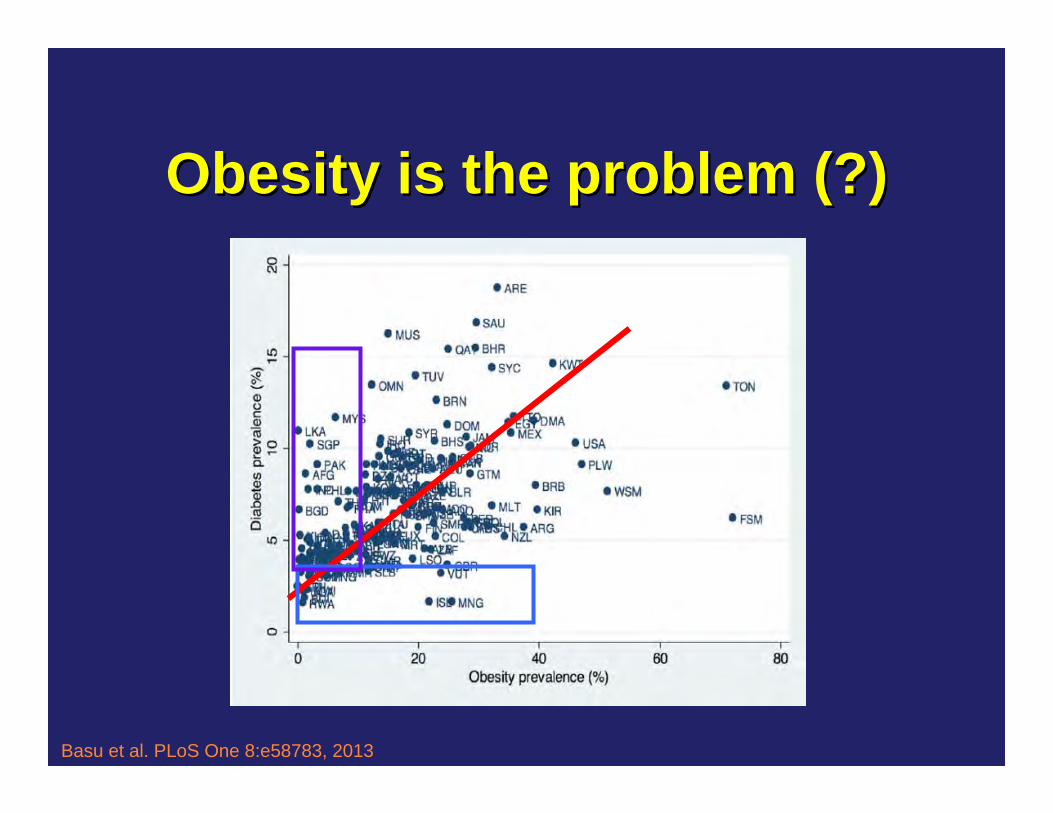
Obesity is the problem (?)Obesity is the problem (?)
Basu et al. PLoS One 8:e58783, 2013
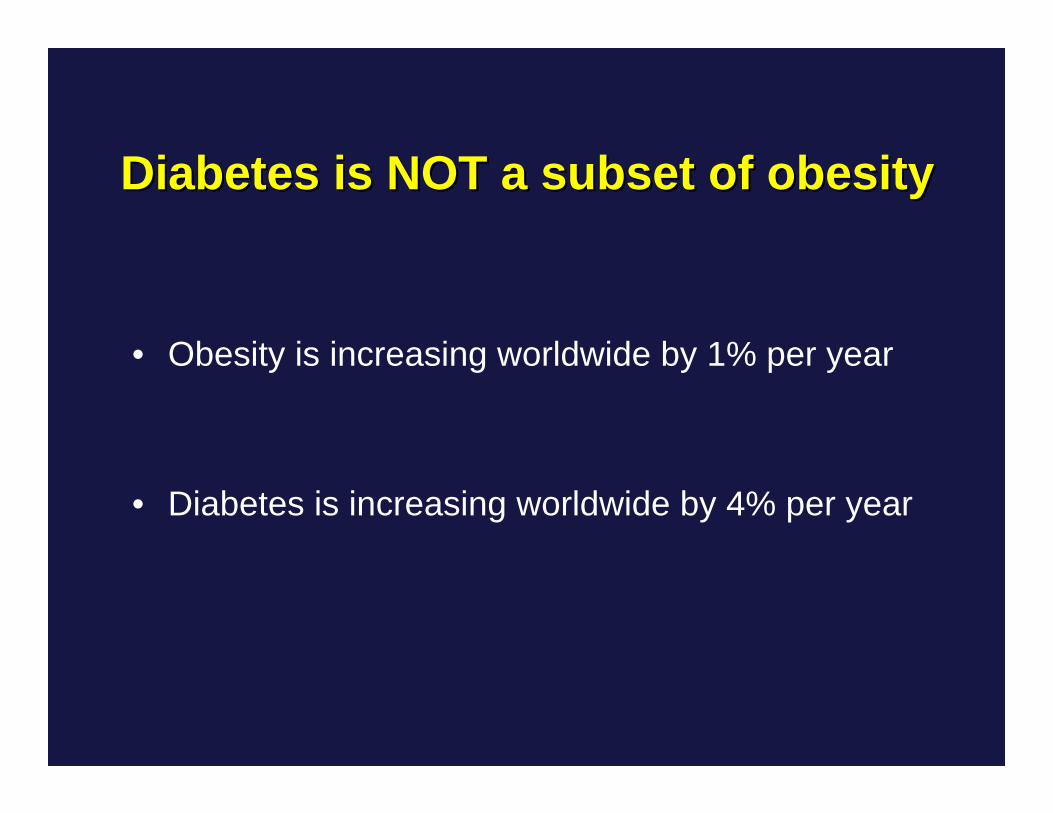
Diabetes is NOT a subset of obesityDiabetes is NOT a subset of obesity
• Obesity is increasing worldwide by 1% per year
• Diabetes is increasing worldwide by 4% per year
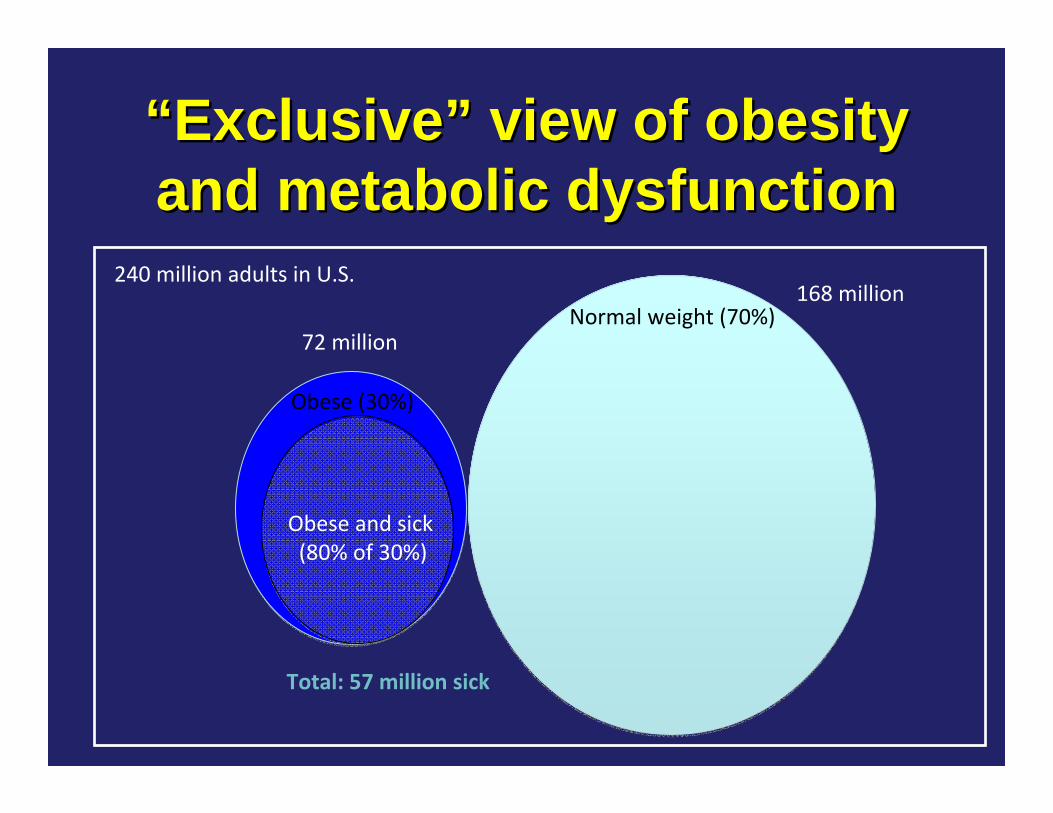
““ExclusiveExclusive”” view of obesity view of obesity and metabolic dysfunctionand metabolic dysfunction
Obese (30%)
Normal weight (70%)
240 million adults in U.S.
72 million
168 million
Obese (30%)
Obese and sick(80% of 30%)
Normal weight (70%)
240 million adults in U.S.
72 million
168 million
Total: 57 million sick
““ExclusiveExclusive”” view of obesity view of obesity and metabolic dysfunctionand metabolic dysfunction
Obese (30%)
Normal weight (70%)
240 million adults in U.S.
72 million
168 million
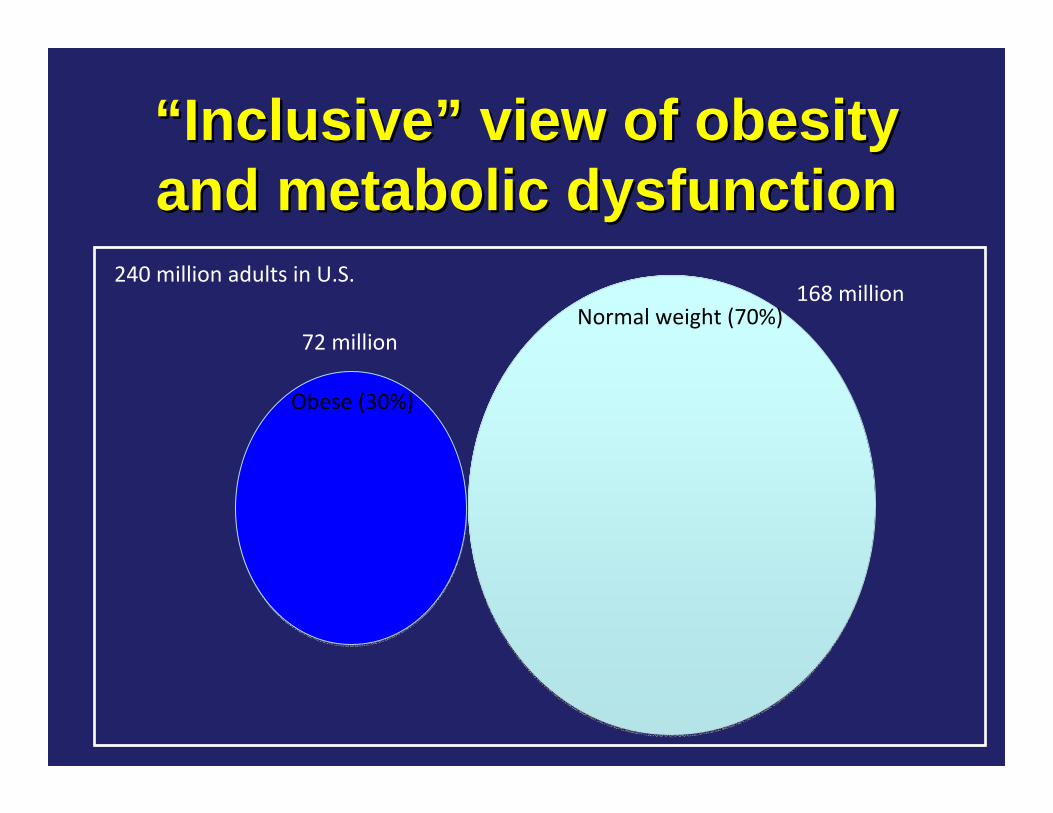
““InclusiveInclusive”” view of obesity view of obesity and metabolic dysfunctionand metabolic dysfunction
Obese (30%)
Normal weight (70%)
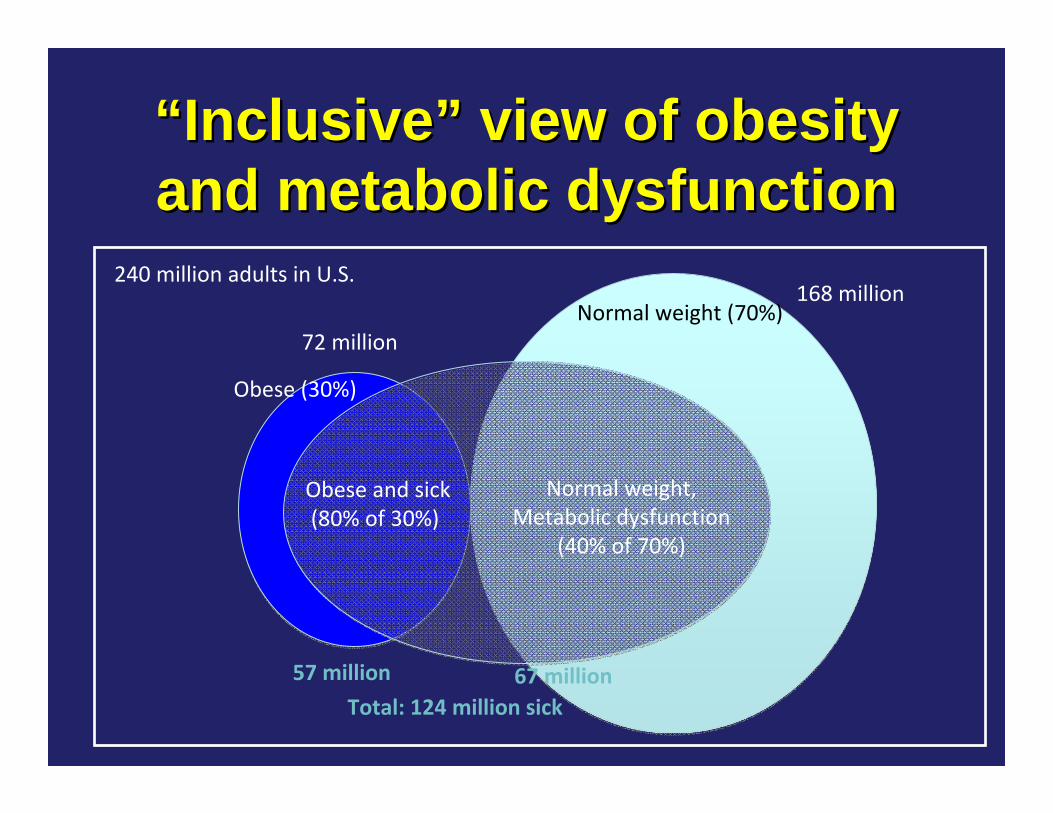
240 million adults in U.S.
Normal weight,Metabolic dysfunction
(40% of 70%)
Obese and sick(80% of 30%)
57 million 67 million Total: 124 million sick
72 million
168 million
““InclusiveInclusive”” view of obesity view of obesity and metabolic dysfunctionand metabolic dysfunction
Sugar and Diabetes: Sugar and Diabetes: PlausibilityPlausibility
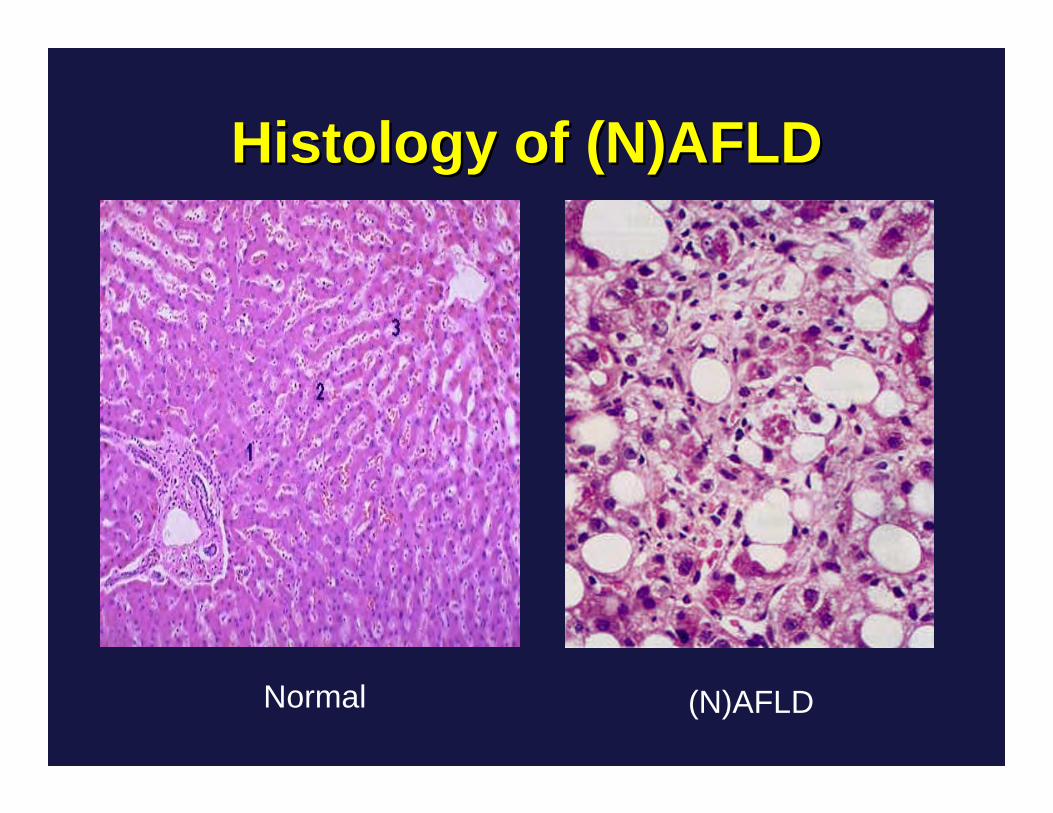
Histology of (N)AFLDHistology of (N)AFLD
Normal (N)AFLD
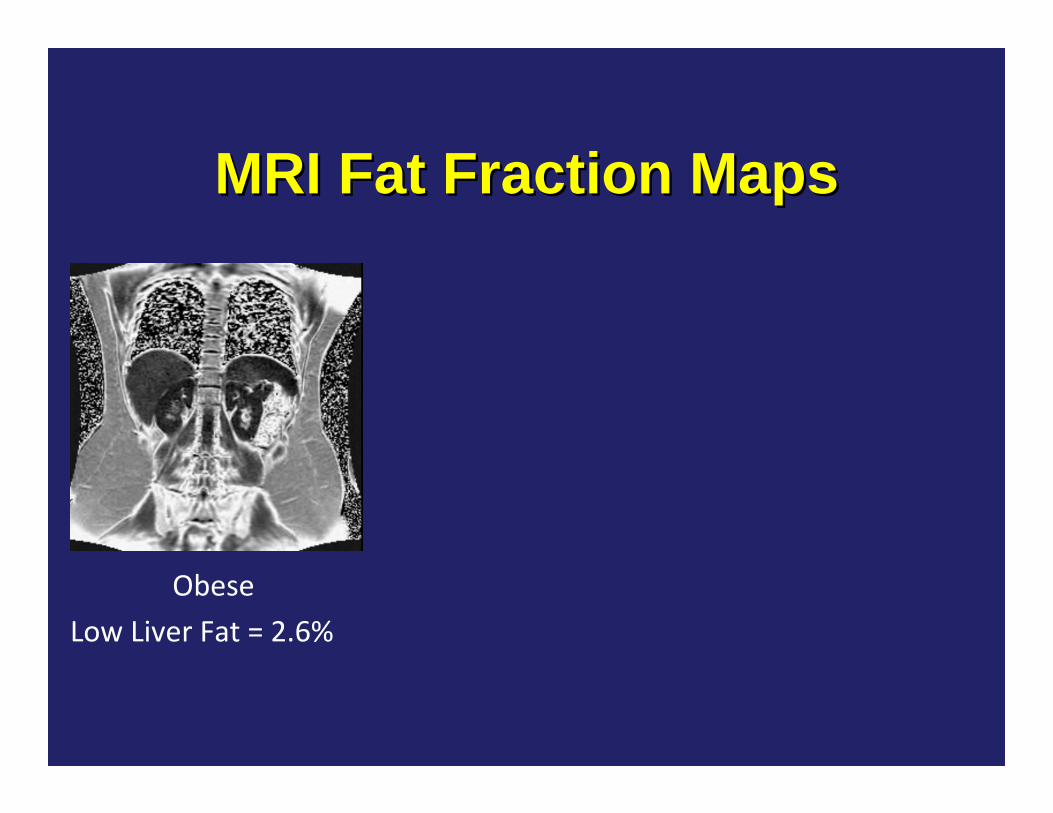
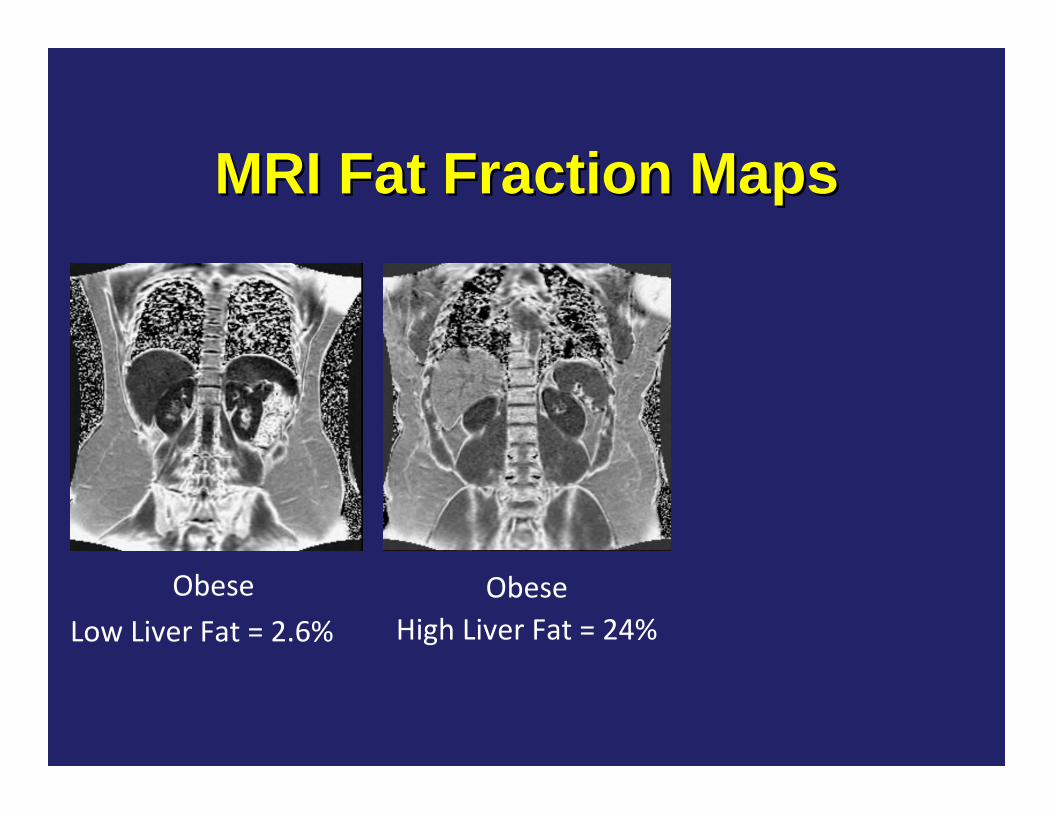
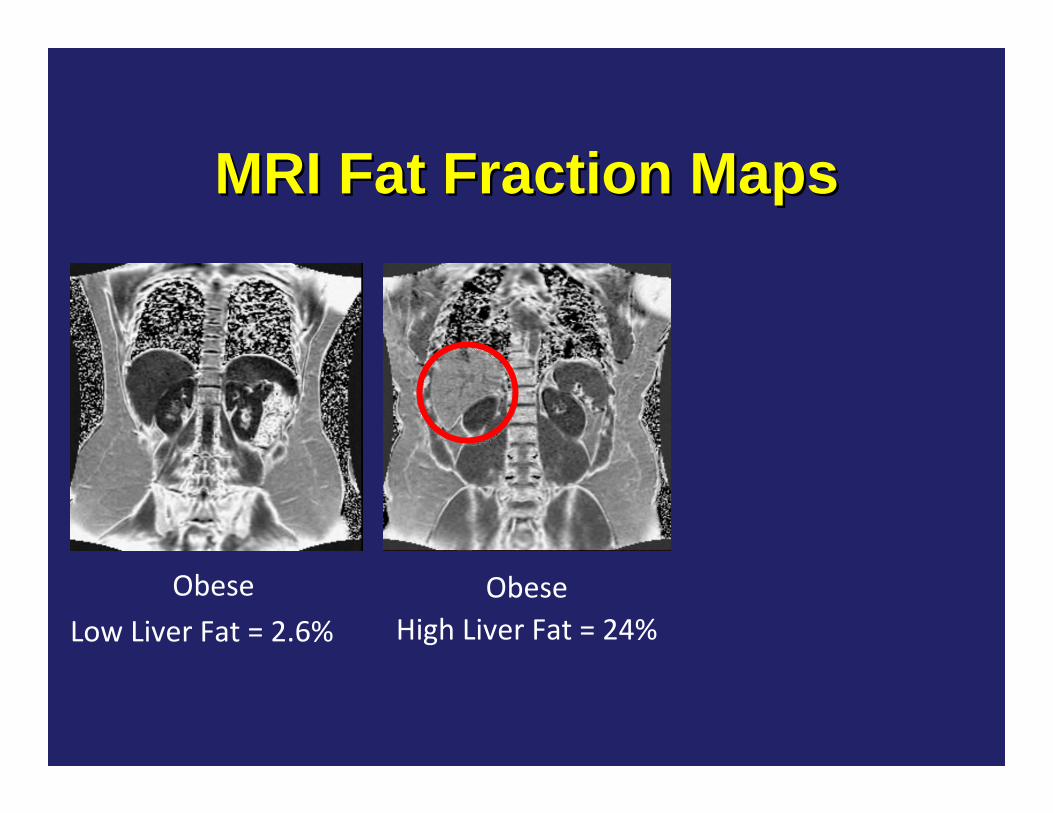
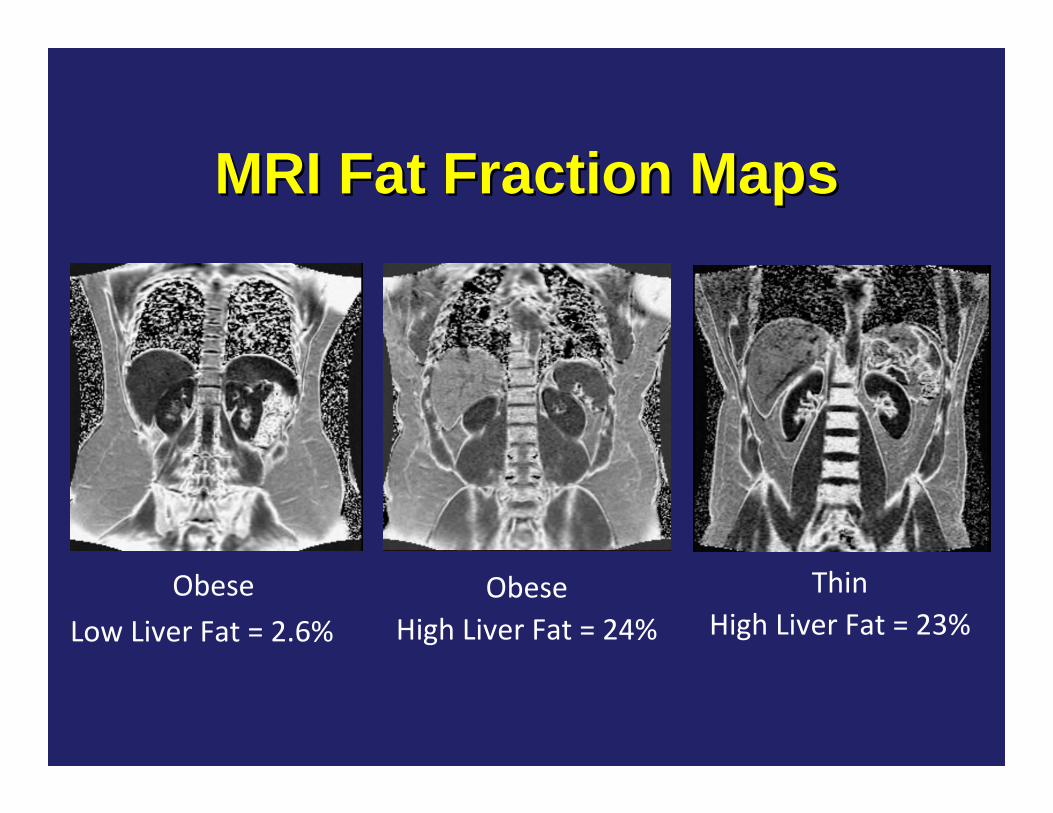
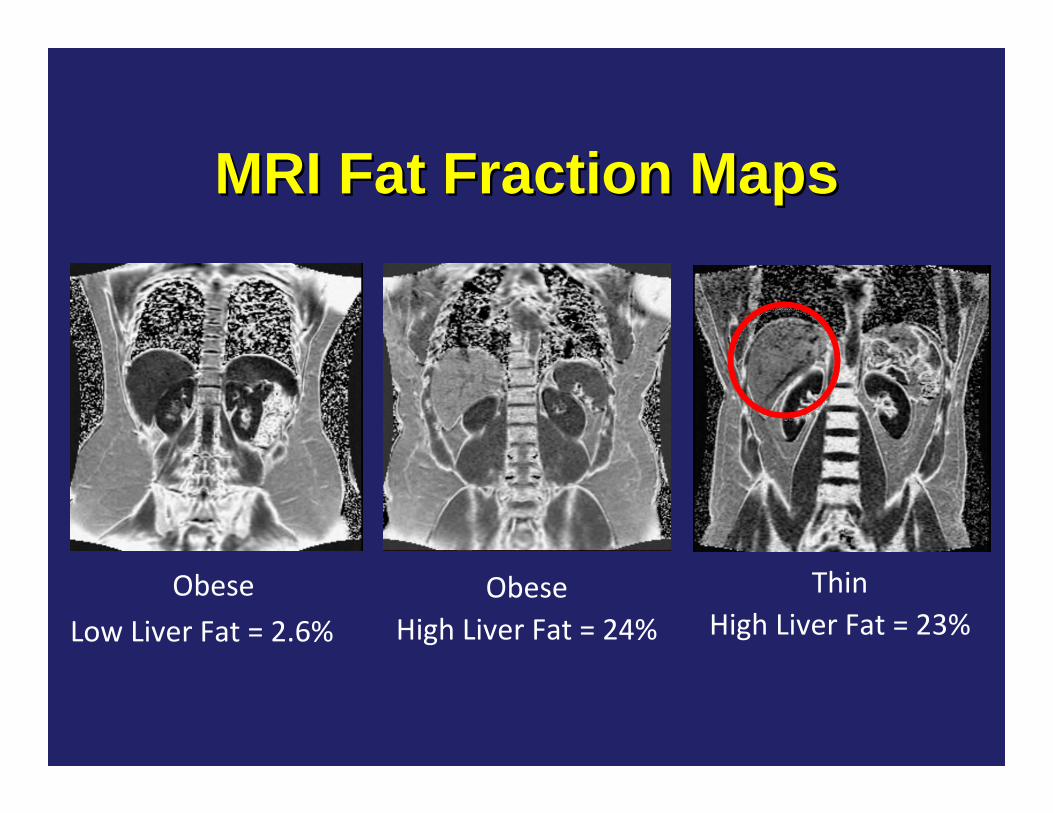
MRI Fat Fraction MapsMRI Fat Fraction Maps
ObeseLow Liver Fat = 2.6%
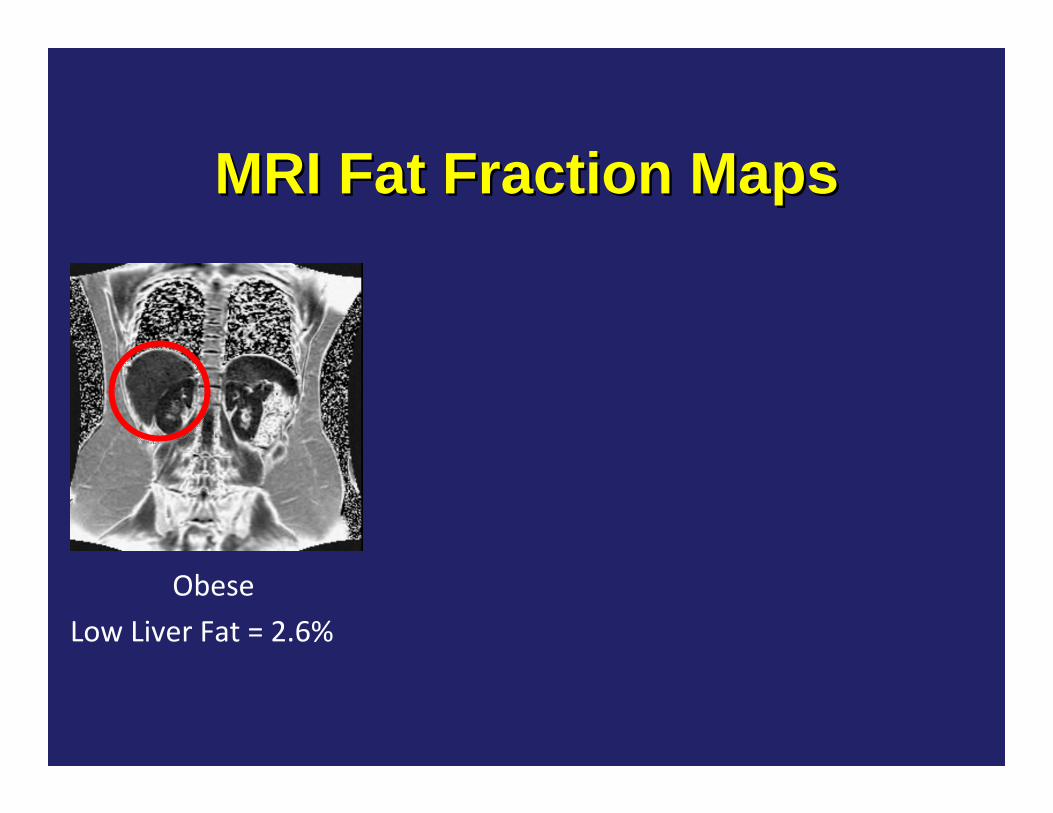
MRI Fat Fraction MapsMRI Fat Fraction Maps
ObeseLow Liver Fat = 2.6%
MRI Fat Fraction MapsMRI Fat Fraction Maps
ObeseLow Liver Fat = 2.6%
ObeseHigh Liver Fat = 24%
MRI Fat Fraction MapsMRI Fat Fraction Maps
ObeseLow Liver Fat = 2.6%
ObeseHigh Liver Fat = 24%
MRI Fat Fraction MapsMRI Fat Fraction Maps
ObeseLow Liver Fat = 2.6%
ObeseHigh Liver Fat = 24%
ThinHigh Liver Fat = 23%
MRI Fat Fraction MapsMRI Fat Fraction Maps
ObeseLow Liver Fat = 2.6%
ObeseHigh Liver Fat = 24%
ThinHigh Liver Fat = 23%
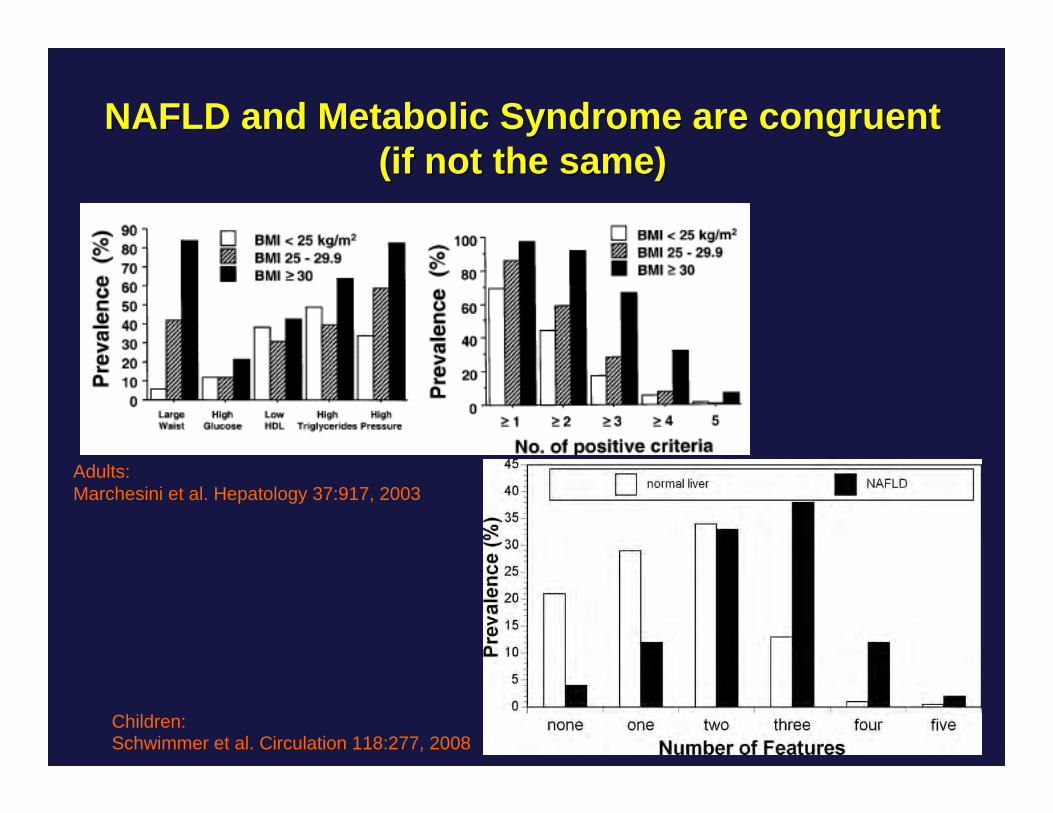
NAFLD and Metabolic Syndrome are congruentNAFLD and Metabolic Syndrome are congruent(if not the same)(if not the same)
Adults:Marchesini et al. Hepatology 37:917, 2003
Children:Schwimmer et al. Circulation 118:277, 2008
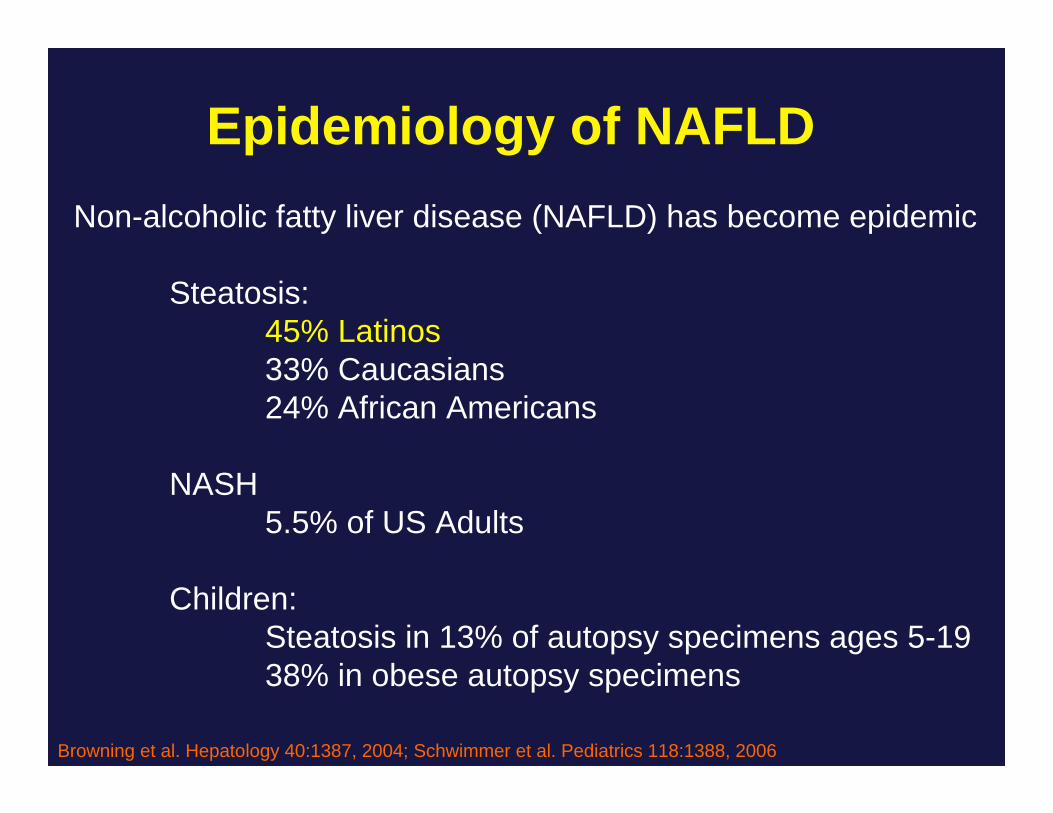
Epidemiology of NAFLDNon-alcoholic fatty liver disease (NAFLD) has become epidemic
Children:Steatosis in 13% of autopsy specimens ages 5-1938% in obese autopsy specimens
Browning et al. Hepatology 40:1387, 2004; Schwimmer et al. Pediatrics 118:1388, 2006
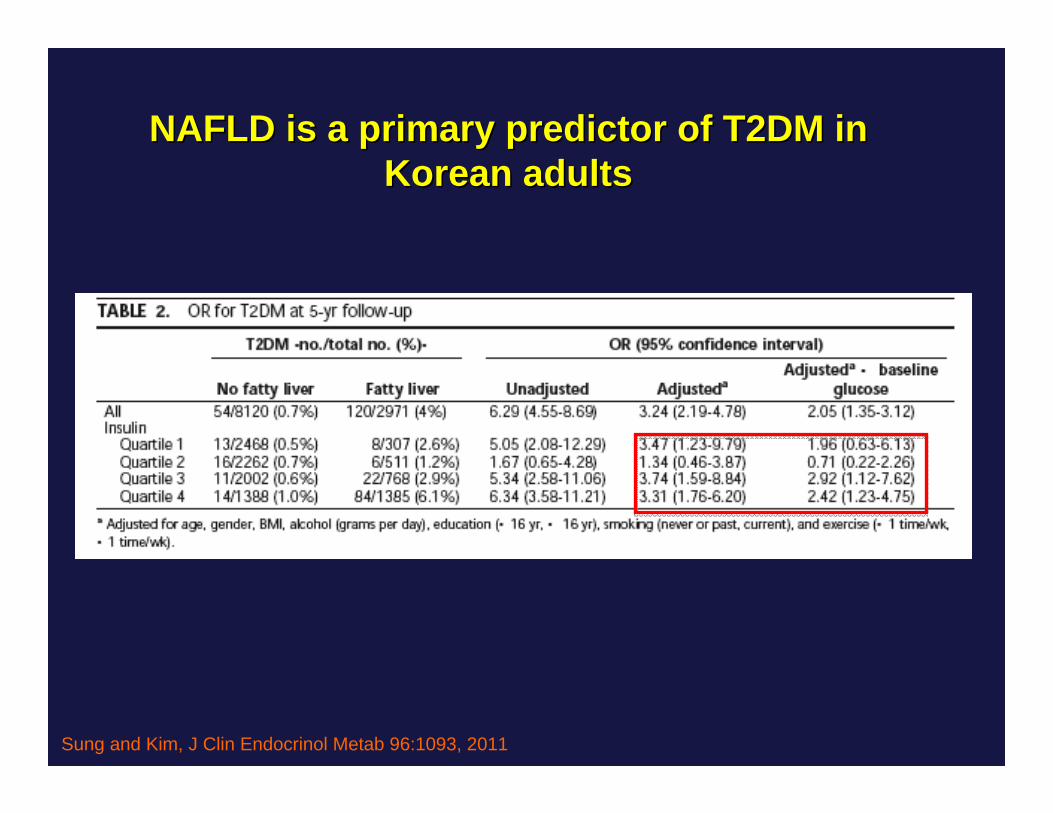
NAFLD is a primary predictor of T2DM in NAFLD is a primary predictor of T2DM in Korean adultsKorean adults
Sung and Kim, J Clin Endocrinol Metab 96:1093, 2011
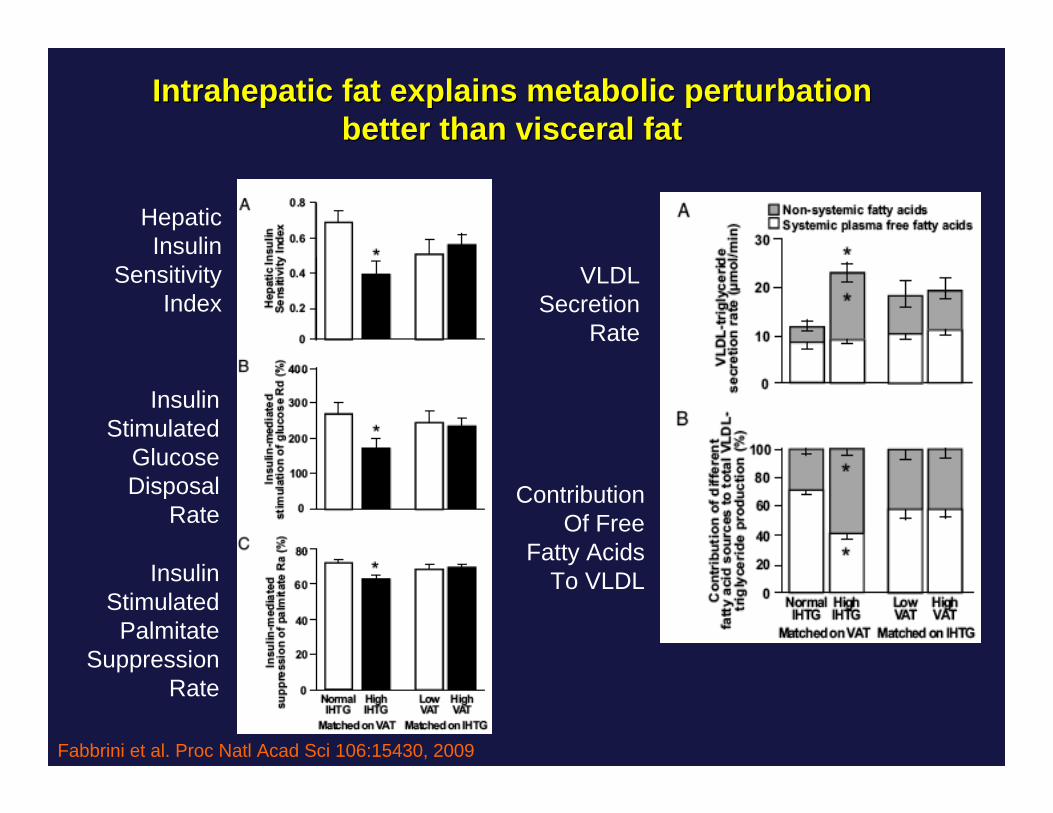
Intrahepatic fat explains metabolic perturbation Intrahepatic fat explains metabolic perturbation better than visceral fatbetter than visceral fat
Fabbrini et al. Proc Natl Acad Sci 106:15430, 2009
HepaticInsulin
SensitivityIndex
InsulinStimulated
GlucoseDisposal
Rate
InsulinStimulated
PalmitateSuppression
Rate
VLDLSecretion
Rate
ContributionOf Free
Fatty AcidsTo VLDL
Sugar and Diabetes: Sugar and Diabetes: MechanismsMechanisms
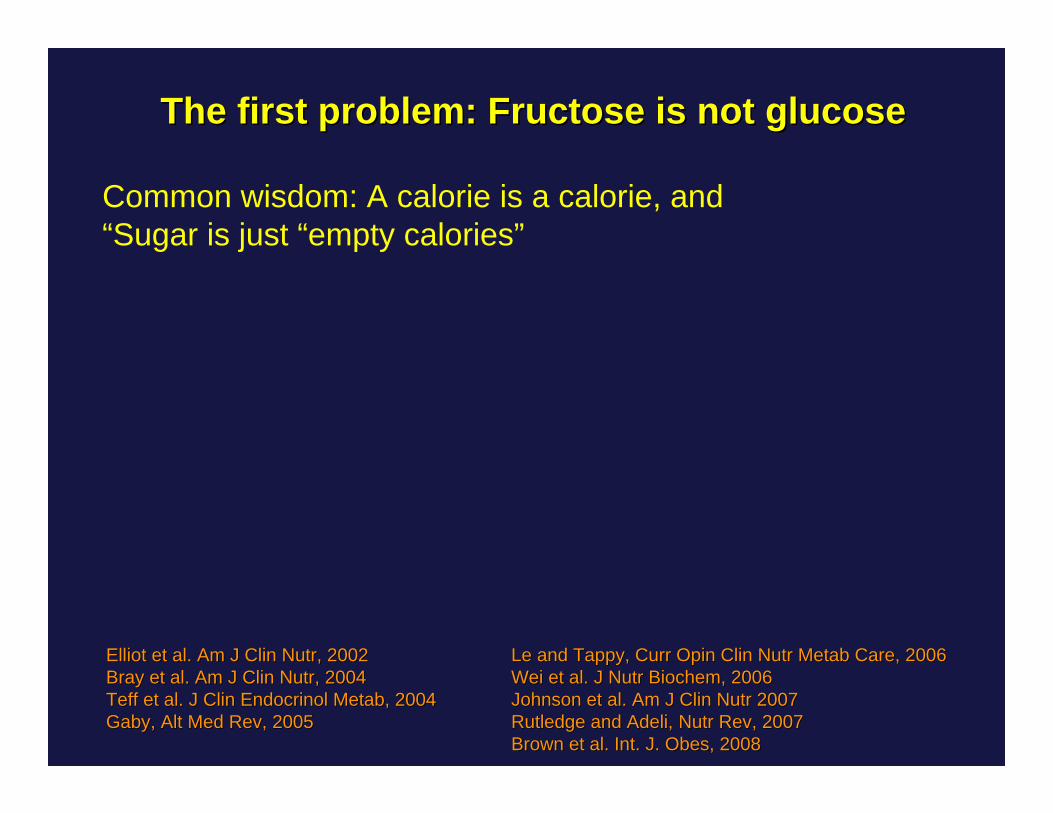
Common wisdom: A calorie is a calorie, and“Sugar is just “empty calories”
Elliot et al. Am J Clin Nutr, 2002Elliot et al. Am J Clin Nutr, 2002Bray et al. Am J Clin Nutr, 2004Bray et al. Am J Clin Nutr, 2004Teff et al. J Clin Endocrinol Metab, 2004Teff et al. J Clin Endocrinol Metab, 2004Gaby, Alt Med Rev, 2005Gaby, Alt Med Rev, 2005
Le and Tappy, Curr Opin Clin Nutr Metab Care, 2006Le and Tappy, Curr Opin Clin Nutr Metab Care, 2006Wei et al. J Nutr Biochem, 2006Wei et al. J Nutr Biochem, 2006Johnson et al. Am J Clin Nutr 2007Johnson et al. Am J Clin Nutr 2007Rutledge and Adeli, Nutr Rev, 2007Rutledge and Adeli, Nutr Rev, 2007Brown et al. Int. J. Obes, 2008Brown et al. Int. J. Obes, 2008
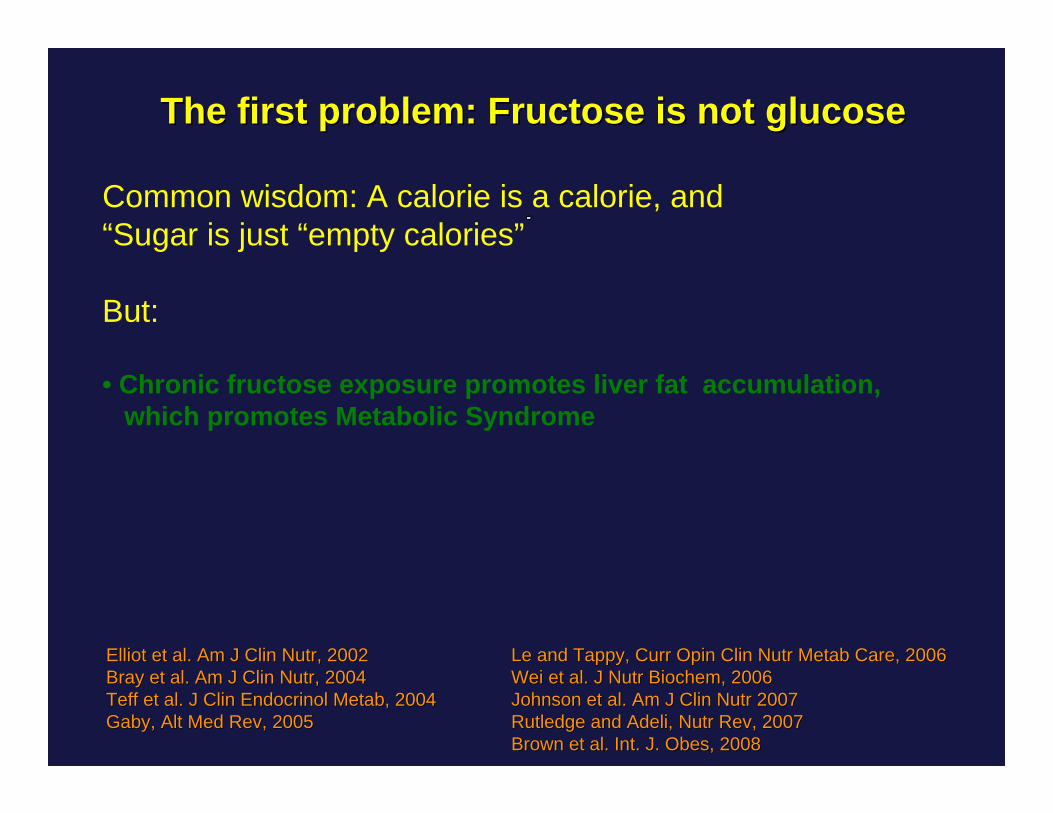
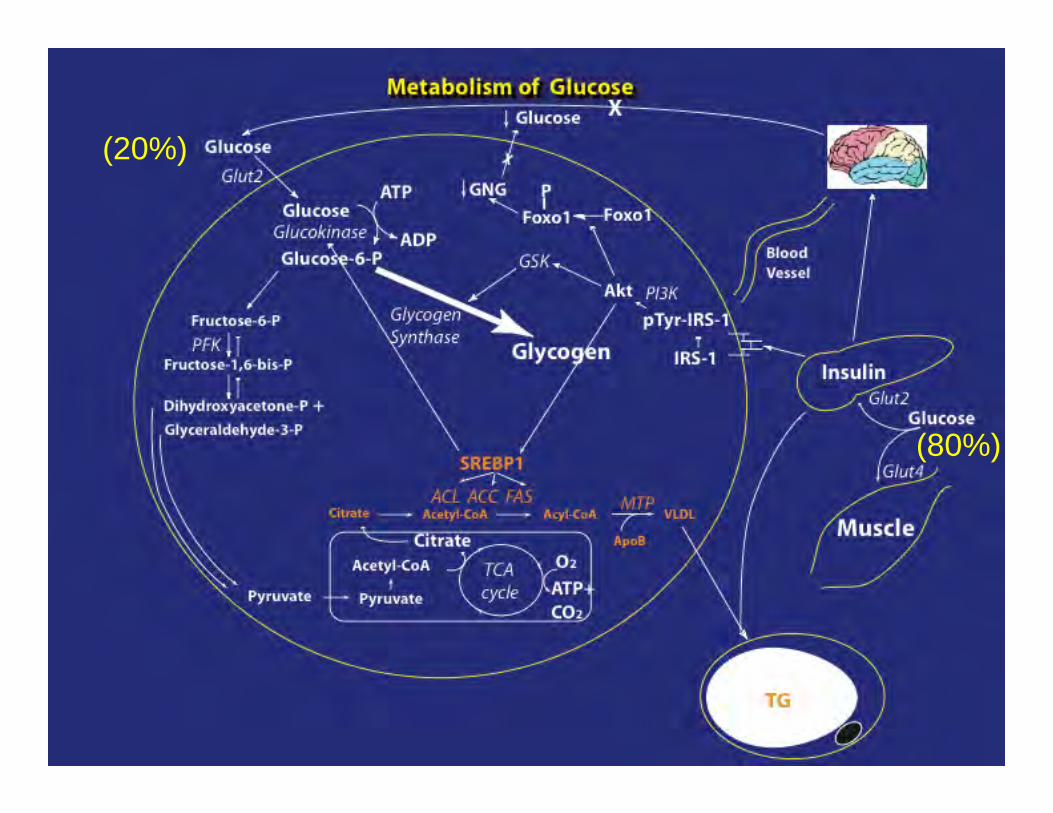
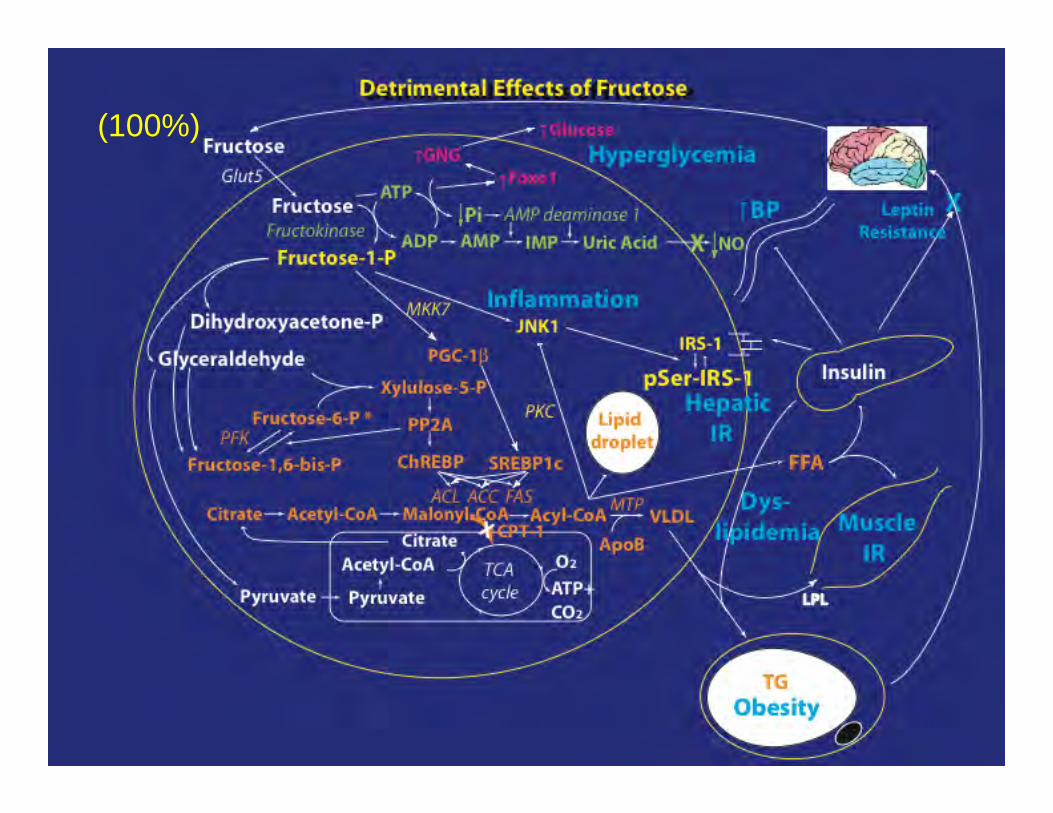
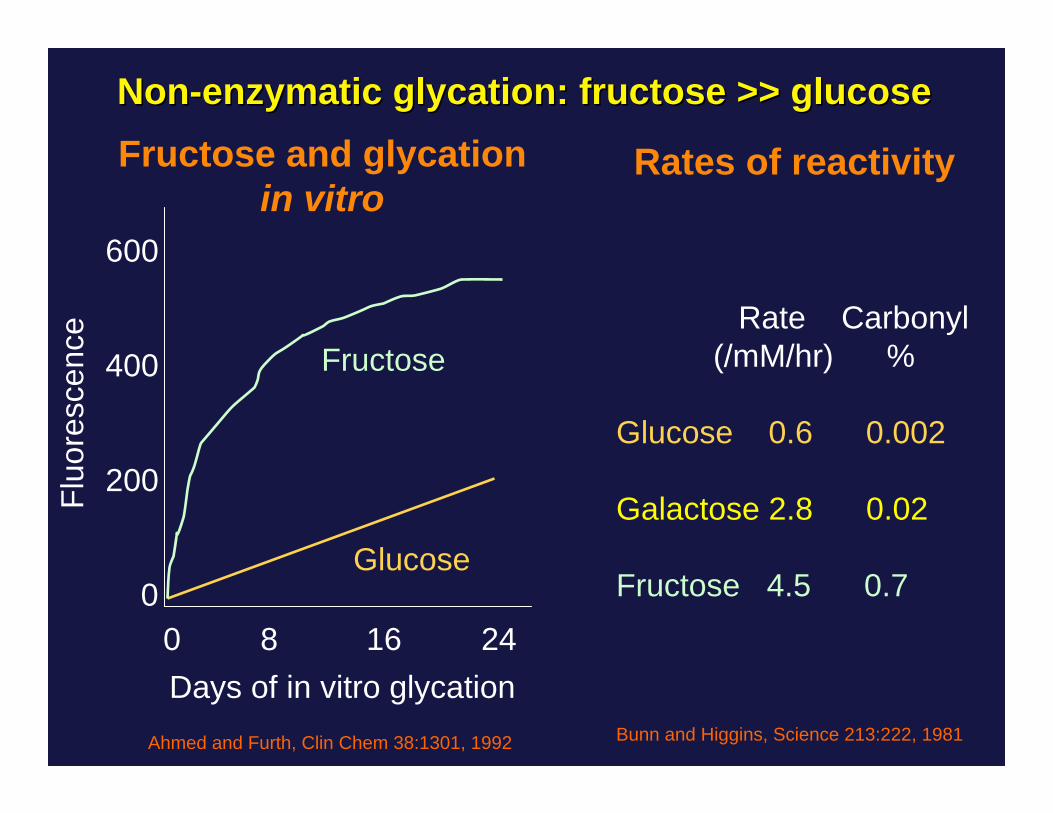
The first problem: Fructose is not glucoseThe first problem: Fructose is not glucose
Common wisdom: A calorie is a calorie, and“Sugar is just “empty calories”
Elliot et al. Am J Clin Nutr, 2002Elliot et al. Am J Clin Nutr, 2002Bray et al. Am J Clin Nutr, 2004Bray et al. Am J Clin Nutr, 2004Teff et al. J Clin Endocrinol Metab, 2004Teff et al. J Clin Endocrinol Metab, 2004Gaby, Alt Med Rev, 2005Gaby, Alt Med Rev, 2005
Le and Tappy, Curr Opin Clin Nutr Metab Care, 2006Le and Tappy, Curr Opin Clin Nutr Metab Care, 2006Wei et al. J Nutr Biochem, 2006Wei et al. J Nutr Biochem, 2006Johnson et al. Am J Clin Nutr 2007Johnson et al. Am J Clin Nutr 2007Rutledge and Adeli, Nutr Rev, 2007Rutledge and Adeli, Nutr Rev, 2007Brown et al. Int. J. Obes, 2008Brown et al. Int. J. Obes, 2008
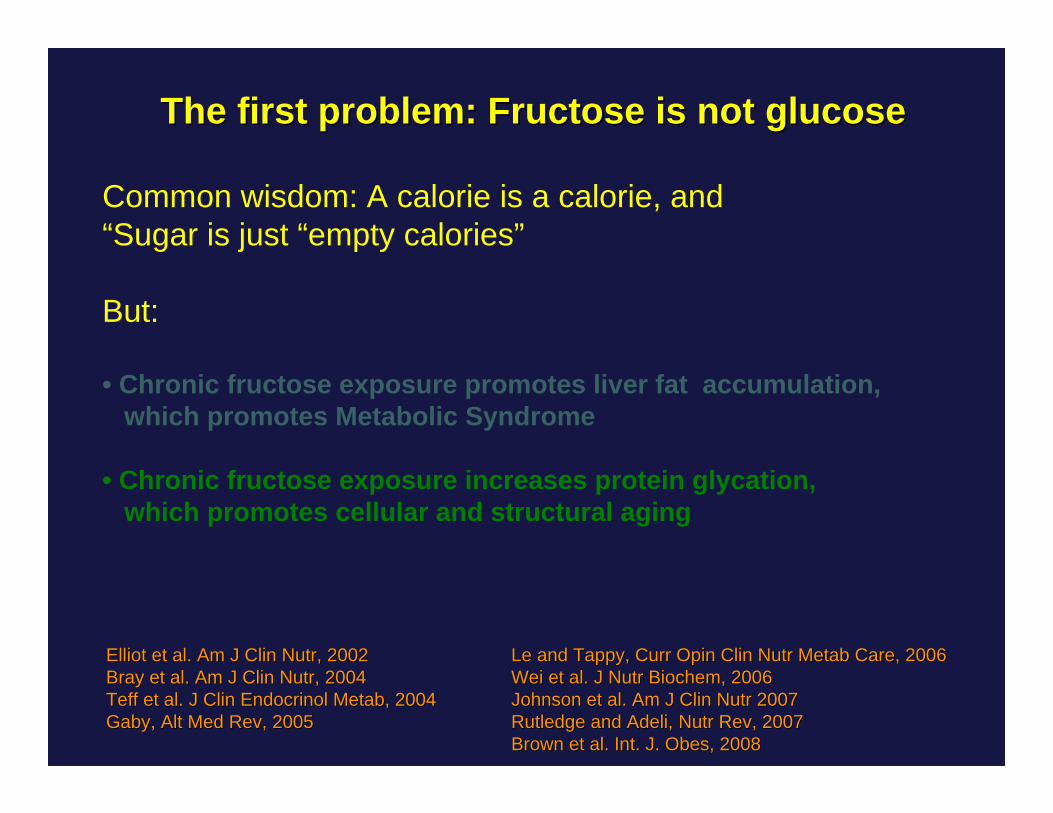
The first problem: Fructose is not glucoseThe first problem: Fructose is not glucose
Common wisdom: A calorie is a calorie, and“Sugar is just “empty calories”
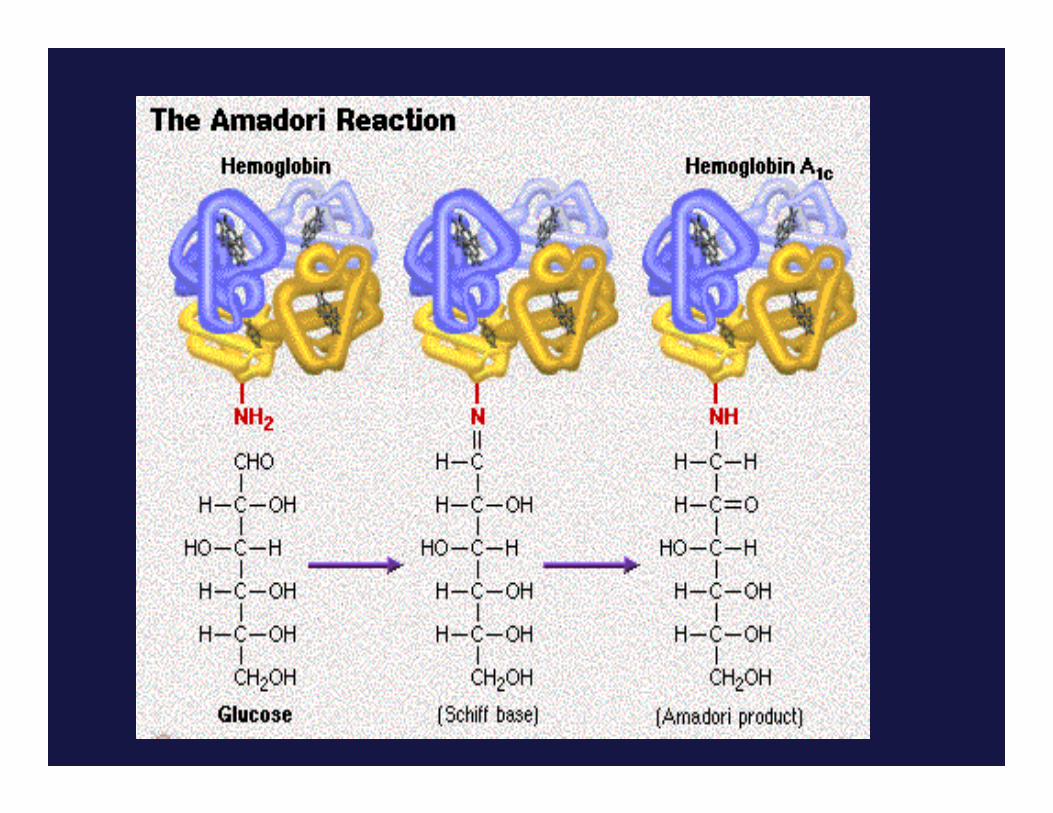
• Chronic fructose exposure increases protein glycation,which promotes cellular and structural aging
Elliot et al. Am J Clin Nutr, 2002Elliot et al. Am J Clin Nutr, 2002Bray et al. Am J Clin Nutr, 2004Bray et al. Am J Clin Nutr, 2004Teff et al. J Clin Endocrinol Metab, 2004Teff et al. J Clin Endocrinol Metab, 2004Gaby, Alt Med Rev, 2005Gaby, Alt Med Rev, 2005
Le and Tappy, Curr Opin Clin Nutr Metab Care, 2006Le and Tappy, Curr Opin Clin Nutr Metab Care, 2006Wei et al. J Nutr Biochem, 2006Wei et al. J Nutr Biochem, 2006Johnson et al. Am J Clin Nutr 2007Johnson et al. Am J Clin Nutr 2007Rutledge and Adeli, Nutr Rev, 2007Rutledge and Adeli, Nutr Rev, 2007Brown et al. Int. J. Obes, 2008Brown et al. Int. J. Obes, 2008
The first problem: Fructose is not glucoseThe first problem: Fructose is not glucose
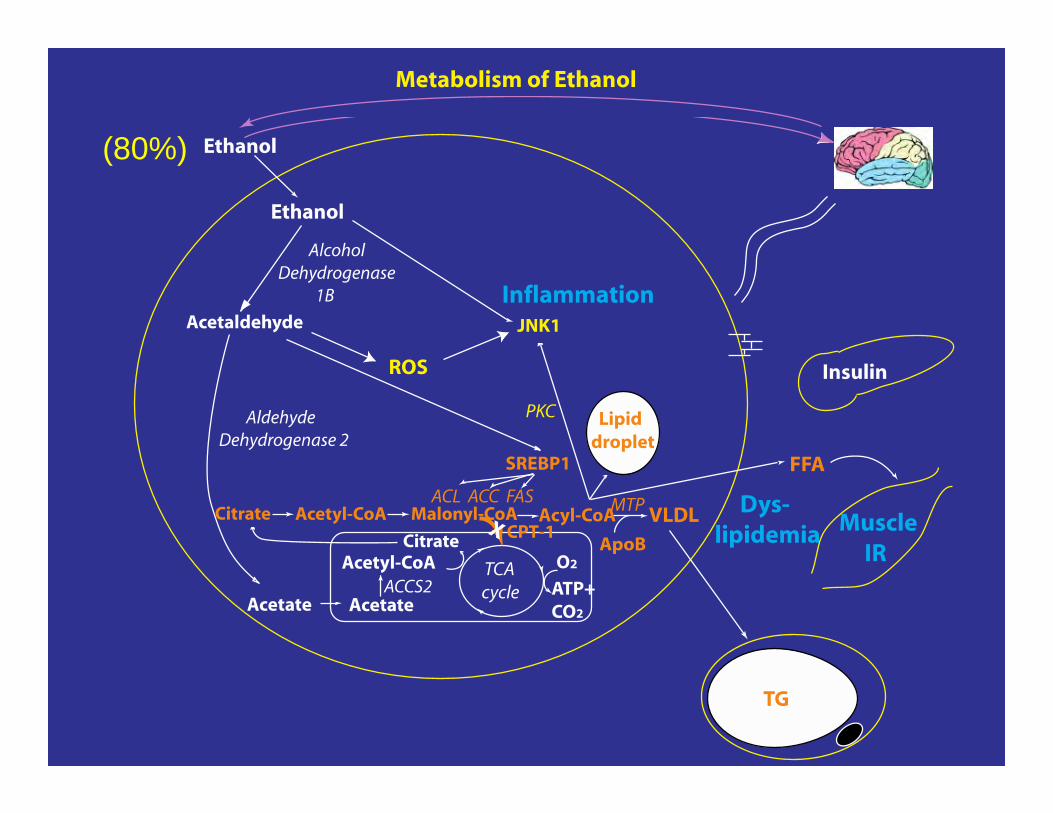
(20%)
(80%)
Can you name an energy source that is:
Can you name an energy source that is:
Not necessary for life
Can you name an energy source that is:
Not necessary for life
There is no biochemical reaction in the body that requires it
Can you name an energy source that is:
Not necessary for life
There is no biochemical reaction in the body that requires it
Is not nutrition
Can you name an energy source that is:
Not necessary for life
There is no biochemical reaction in the body that requires it
Is not nutrition
When consumed in excess it is toxic
Can you name an energy source that is:
Not necessary for life
There is no biochemical reaction in the body that requires it
Is not nutrition
When consumed in excess it is toxic
We love anyway
Can you name an energy source that is:
Not necessary for life
There is no biochemical reaction in the body that requires it
Is not nutrition
When consumed in excess it is toxic
We love anyway
Answer: Ethanol
(80%)
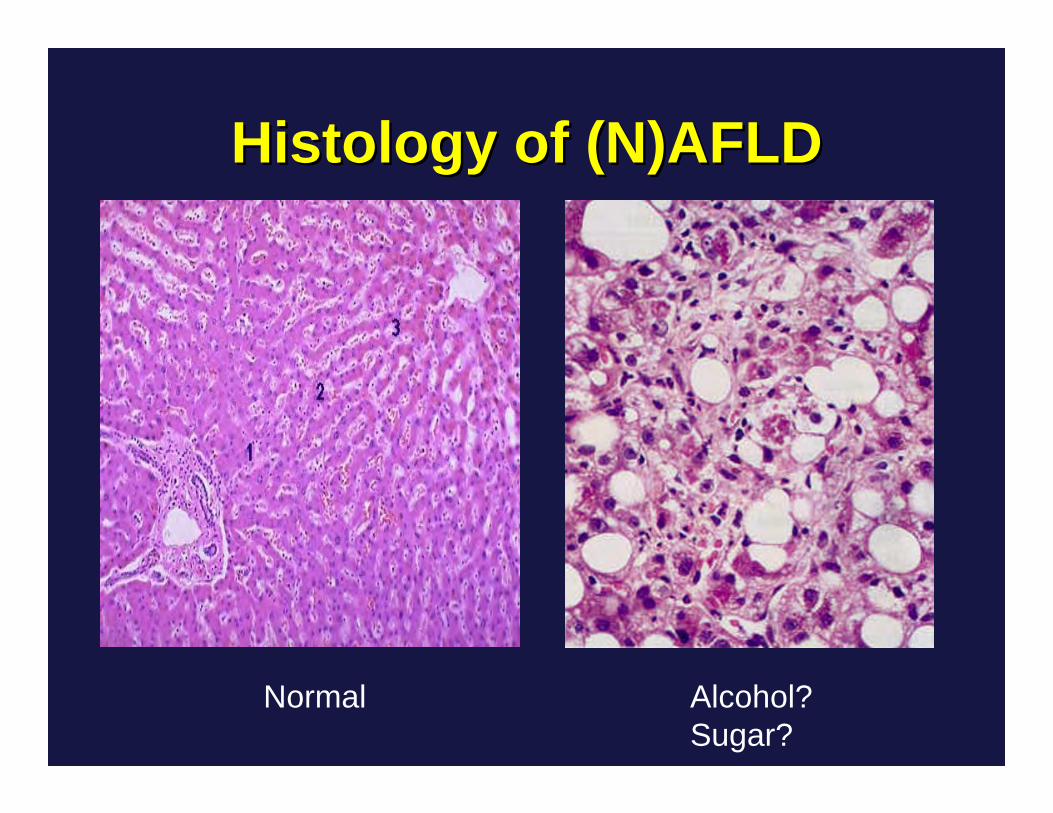
Histology of (N)AFLDHistology of (N)AFLD
Normal Alcohol?Sugar?
(100%)
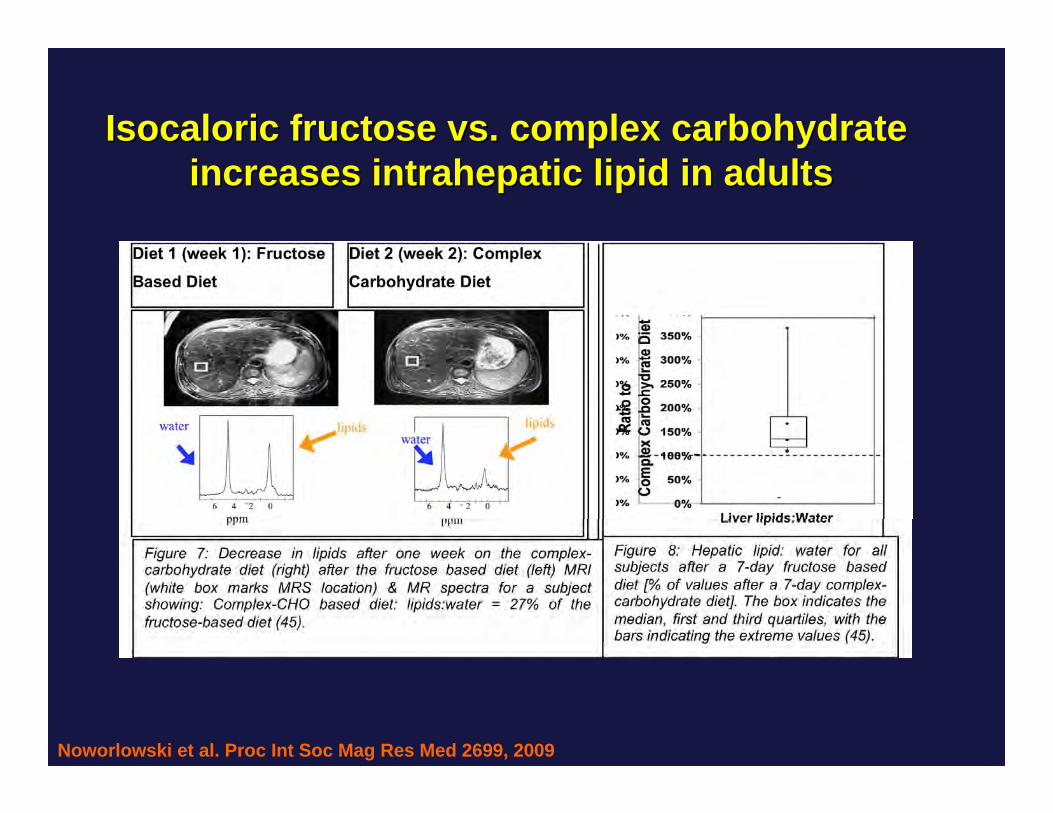
Noworlowski et al. Proc Int Soc Mag Res Med 2699, 2009
IsocaloricIsocaloric fructose vs. complex carbohydrate fructose vs. complex carbohydrate increases intrahepatic lipid in adultsincreases intrahepatic lipid in adults
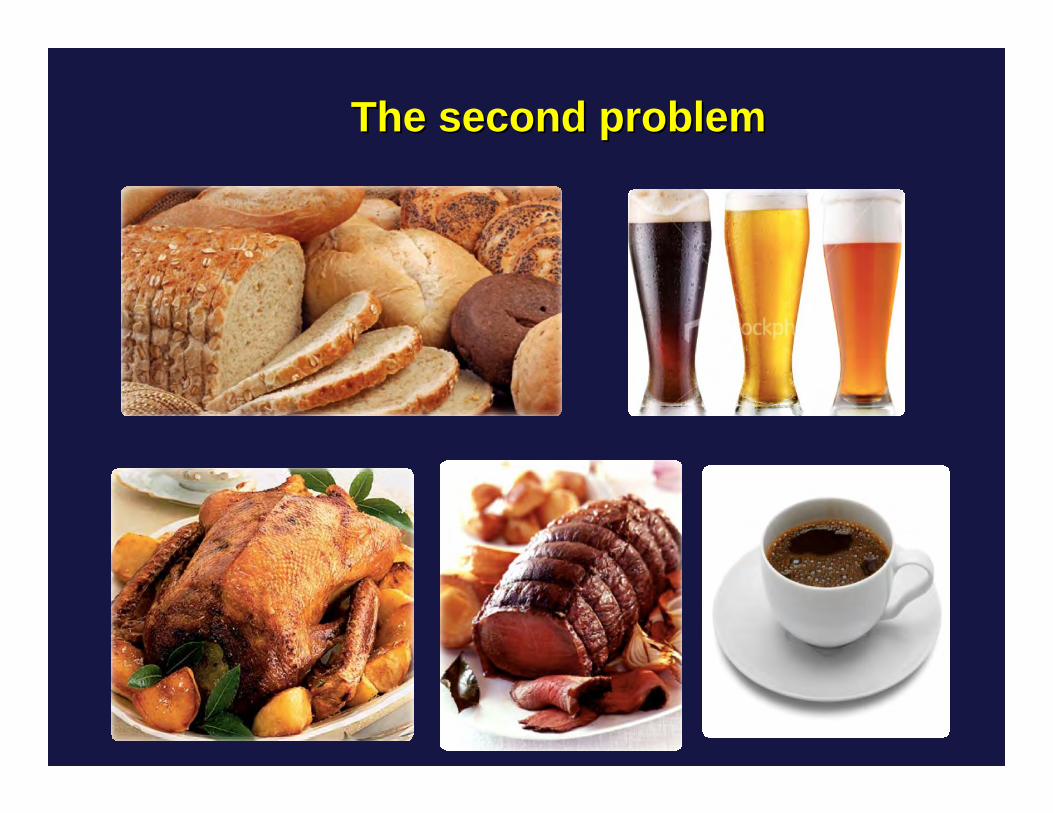
The second problem The second problem
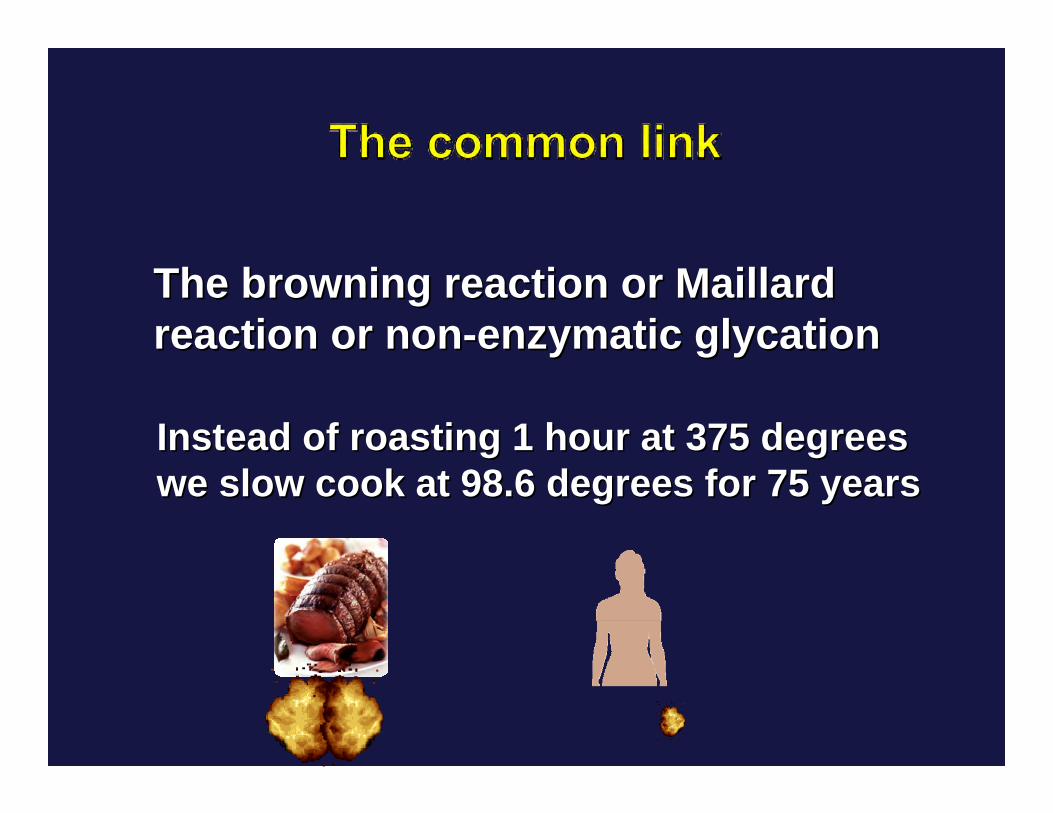
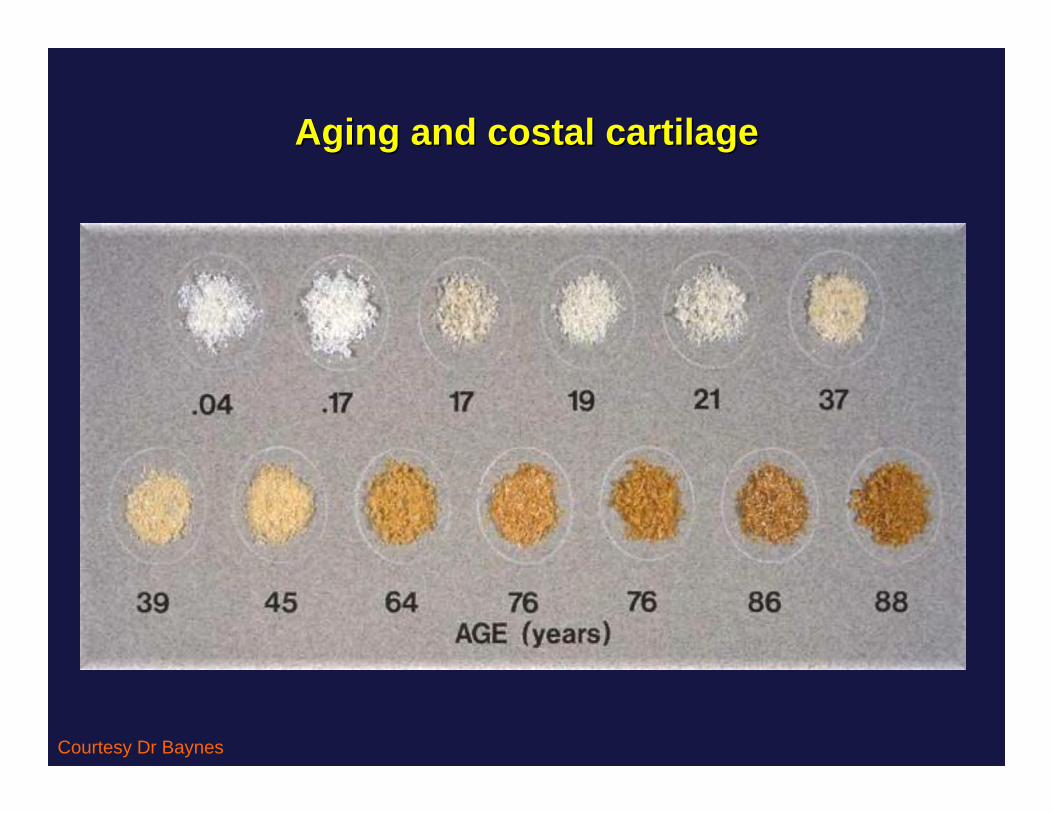
The browning reaction or The browning reaction or MaillardMaillardreaction or nonreaction or non--enzymatic enzymatic glycationglycation
Instead of roasting 1 hour at 375 degreesInstead of roasting 1 hour at 375 degreeswe slow cook at 98.6 degrees for 75 yearswe slow cook at 98.6 degrees for 75 years
Aging and costal cartilage Aging and costal cartilage
Courtesy Dr Baynes
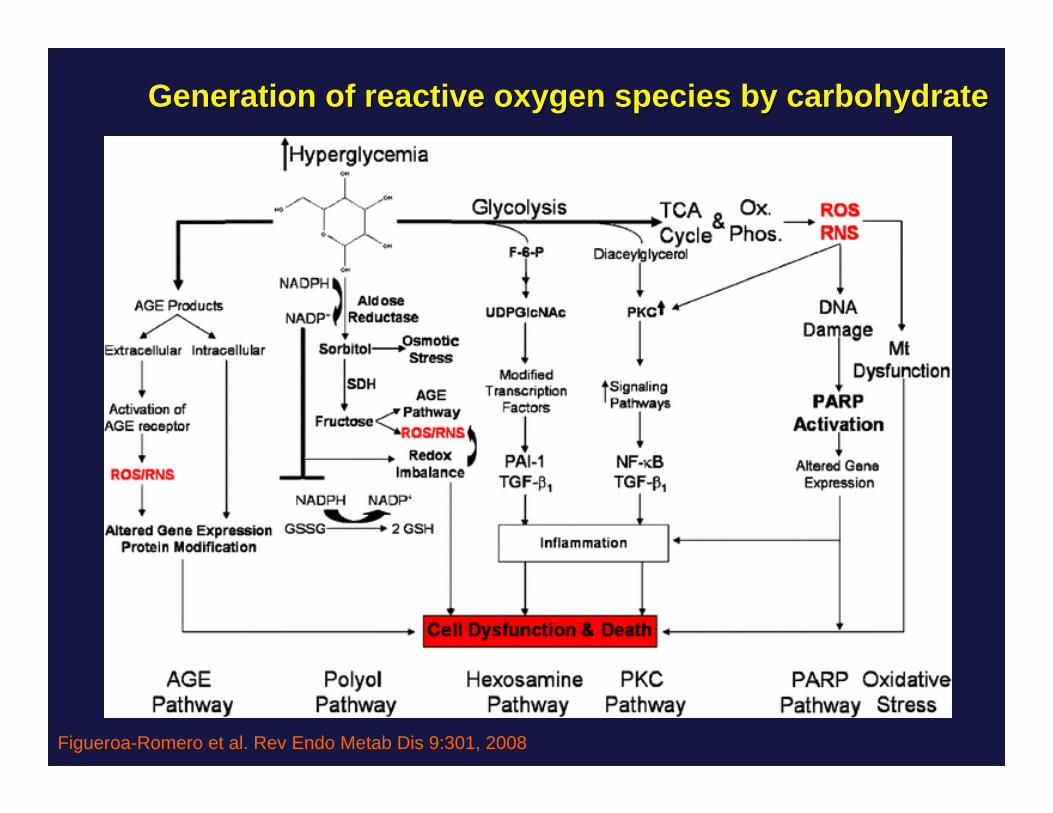
Figueroa-Romero et al. Rev Endo Metab Dis 9:301, 2008
Generation of reactive oxygen species by carbohydrate Generation of reactive oxygen species by carbohydrate
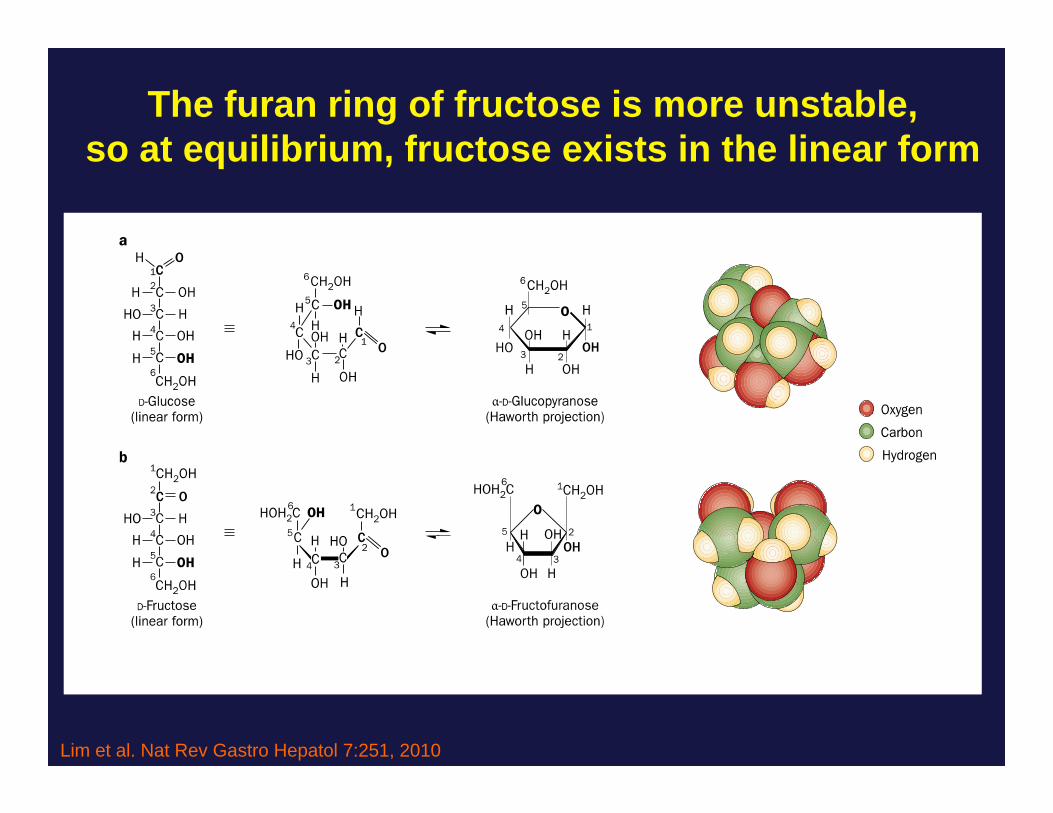
The furan ring of fructose is more unstable,so at equilibrium, fructose exists in the linear form
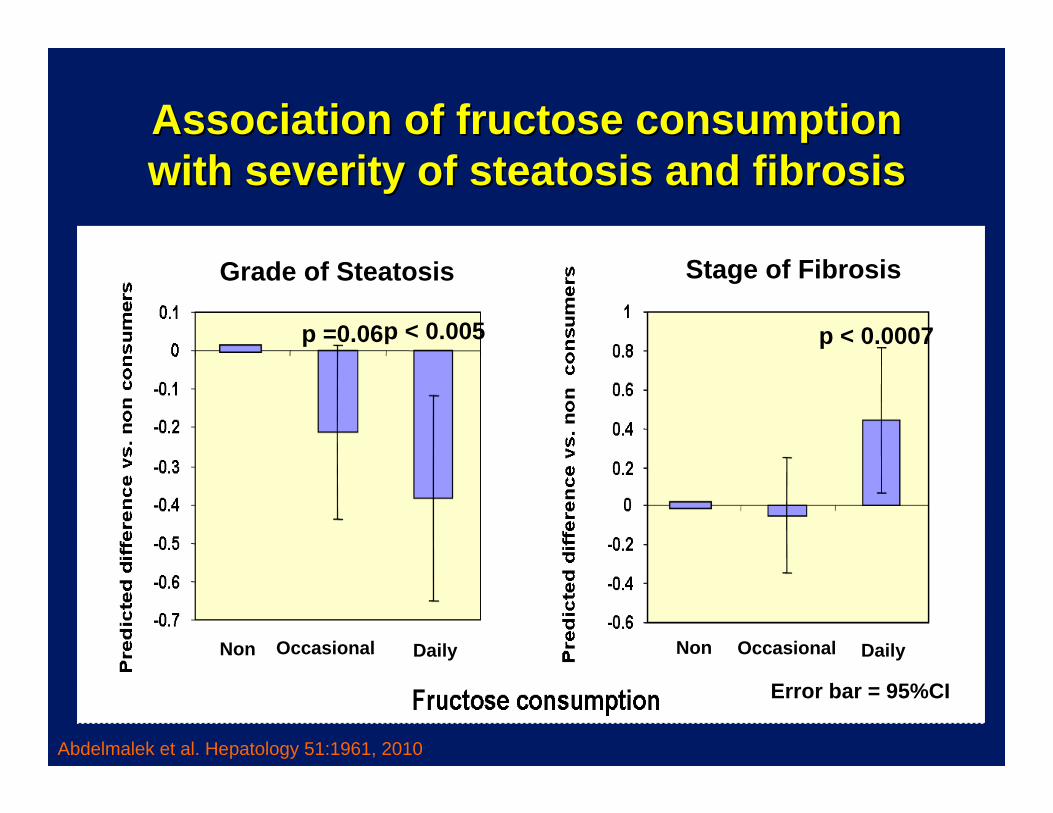
Association of fructose consumption Association of fructose consumption with severity of steatosis and fibrosiswith severity of steatosis and fibrosis
Grade of Steatosis
p =0.06p < 0.005
Stage of Fibrosis
p < 0.0007
Non NonOccasional OccasionalDaily Daily
Error bar = 95%CI
Abdelmalek et al. Hepatology 51:1961, 2010
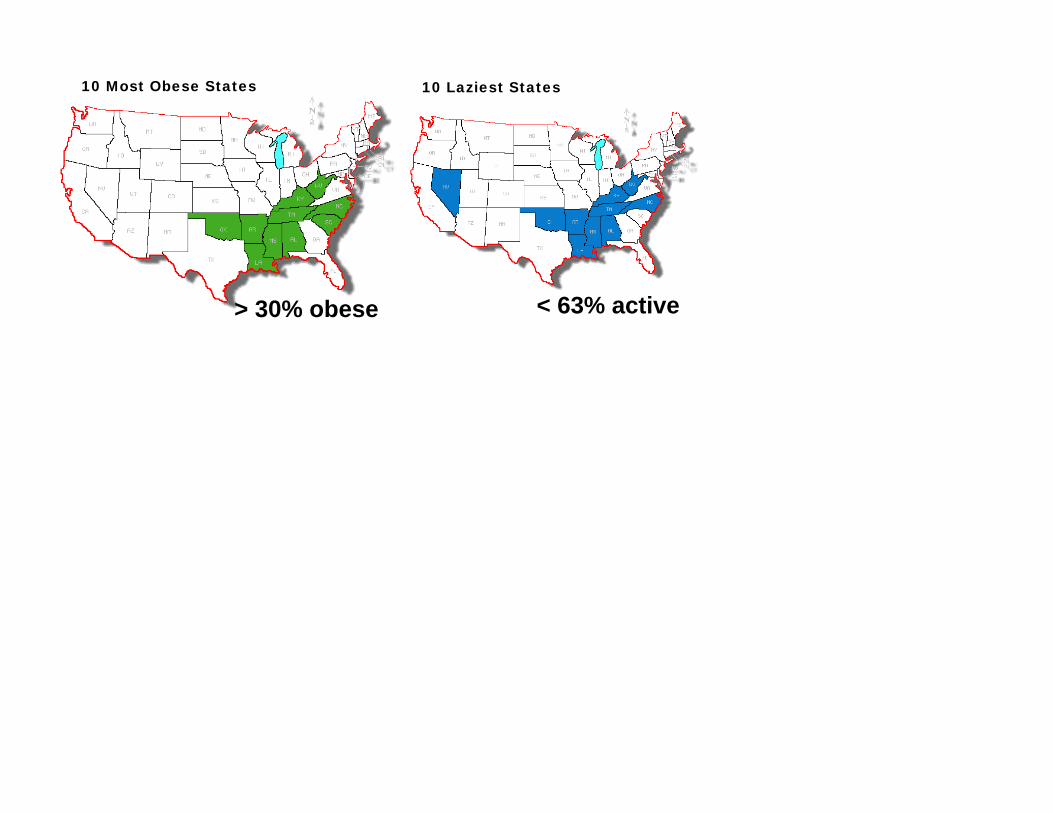
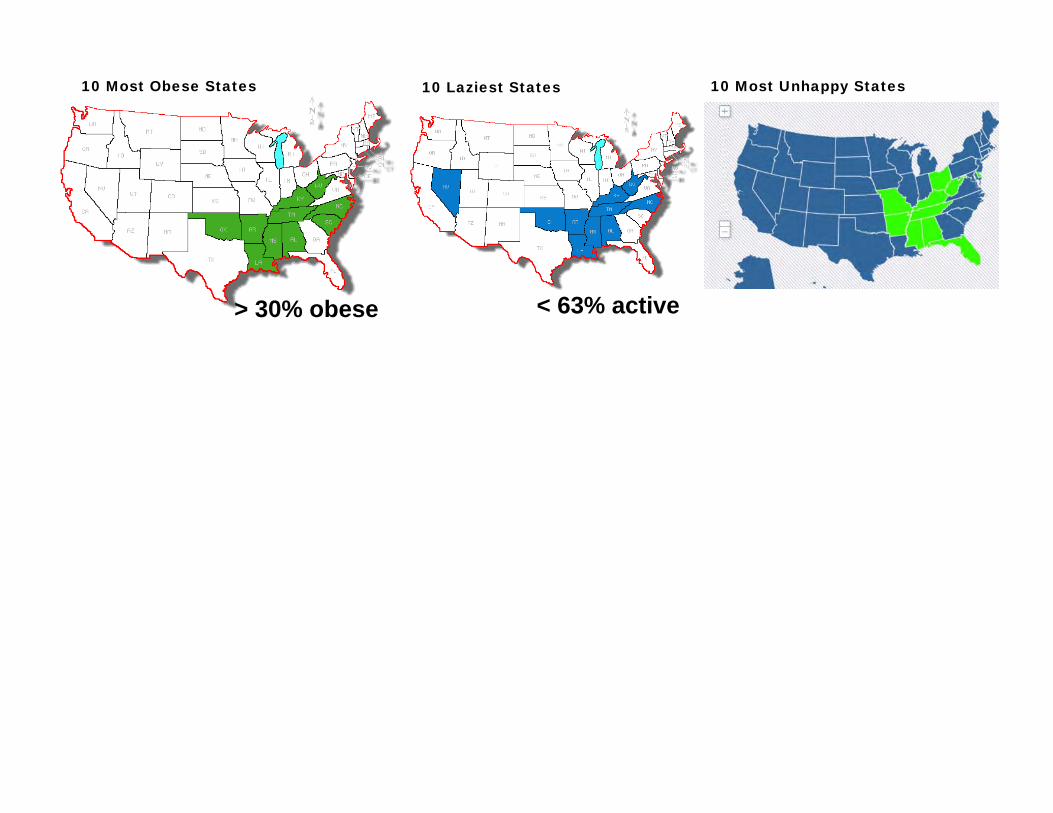
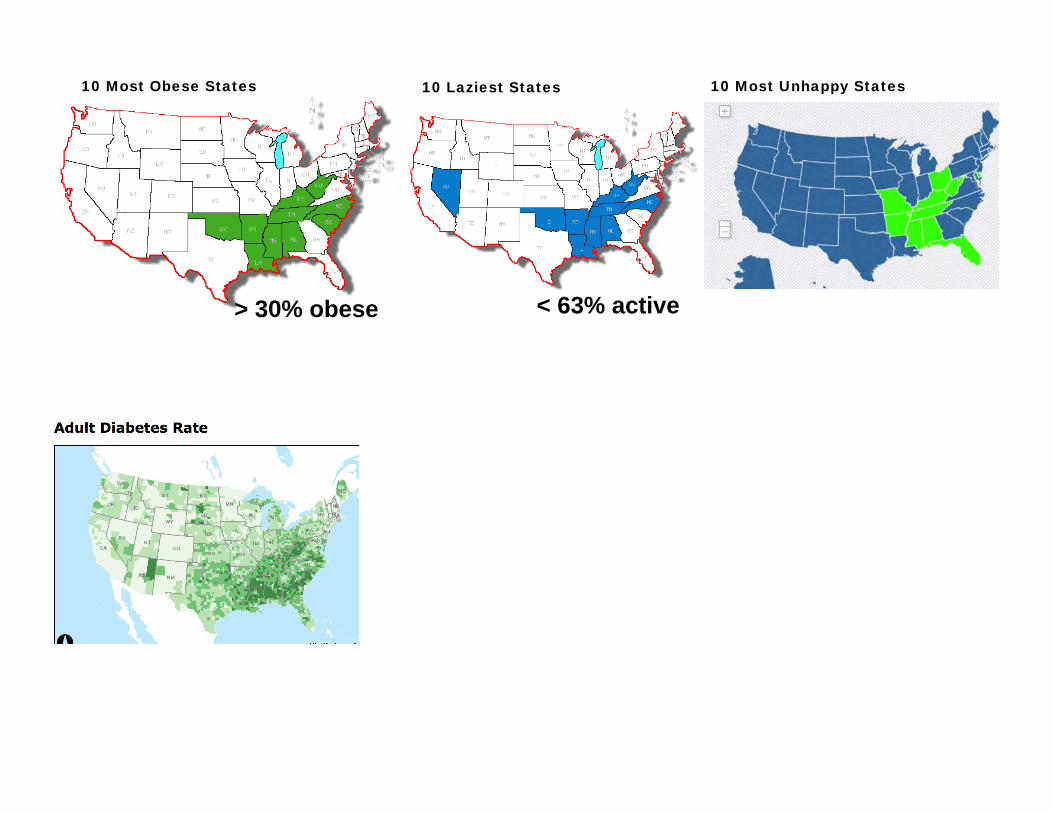
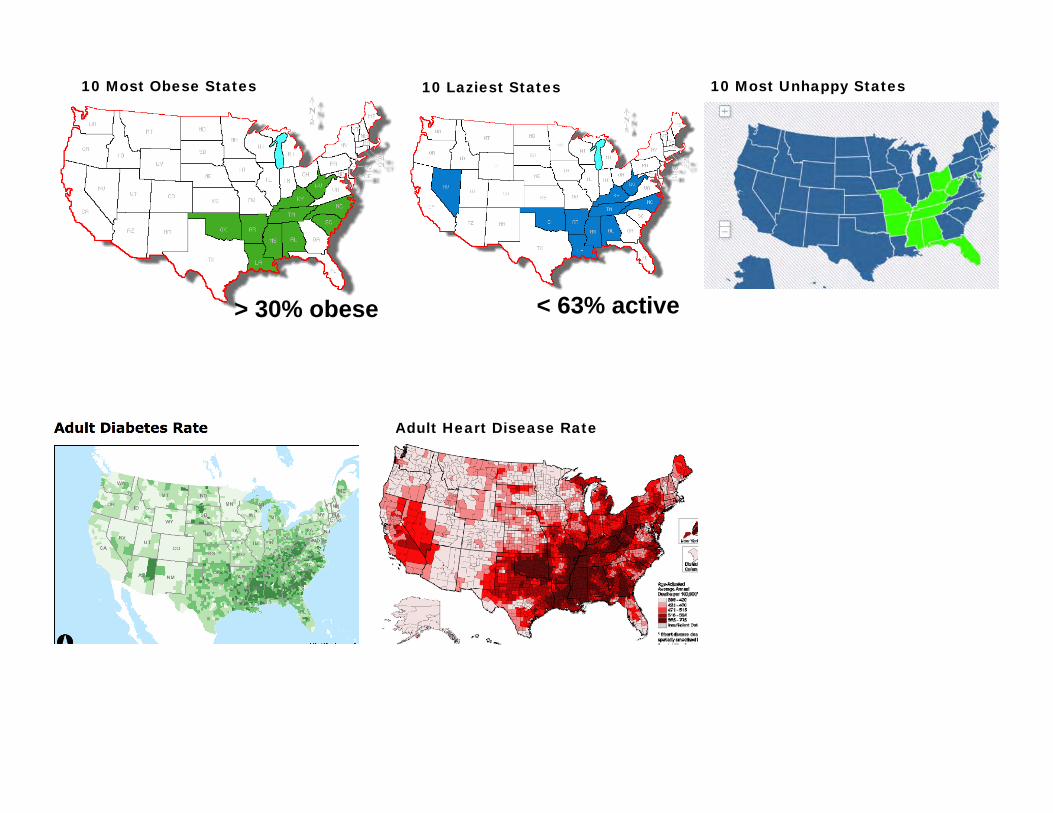
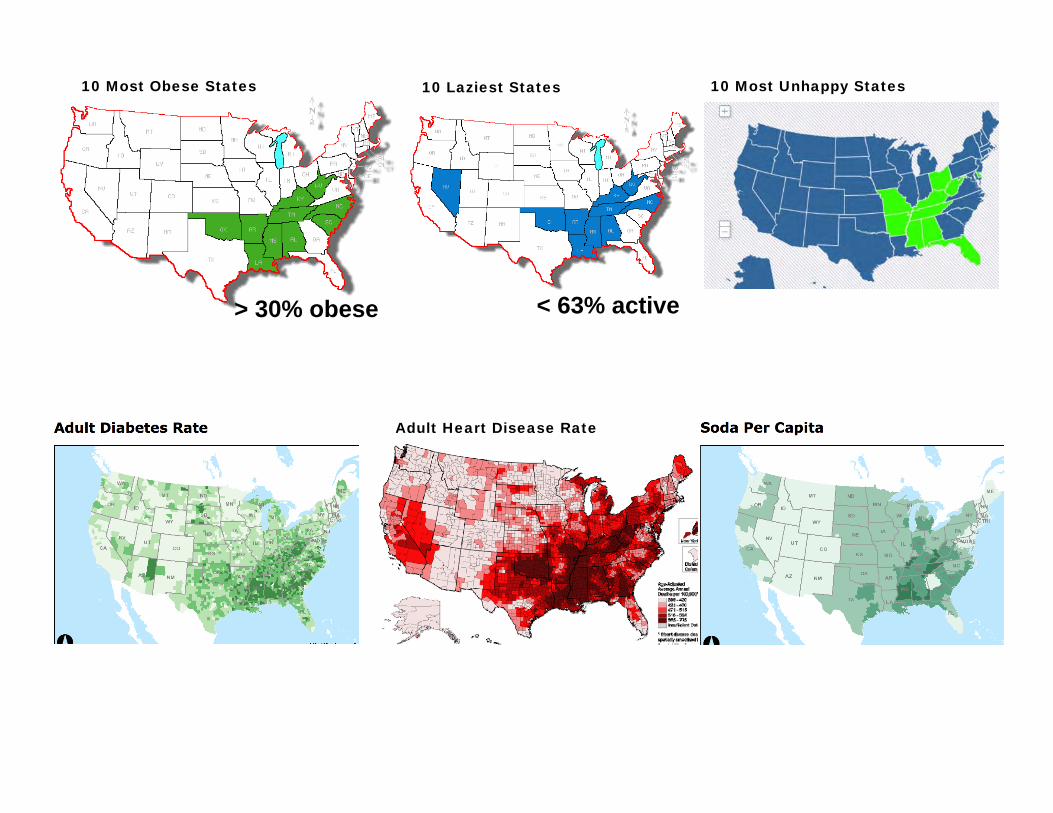
Sugar and Diabetes: Sugar and Diabetes: Human CorrelationHuman Correlation
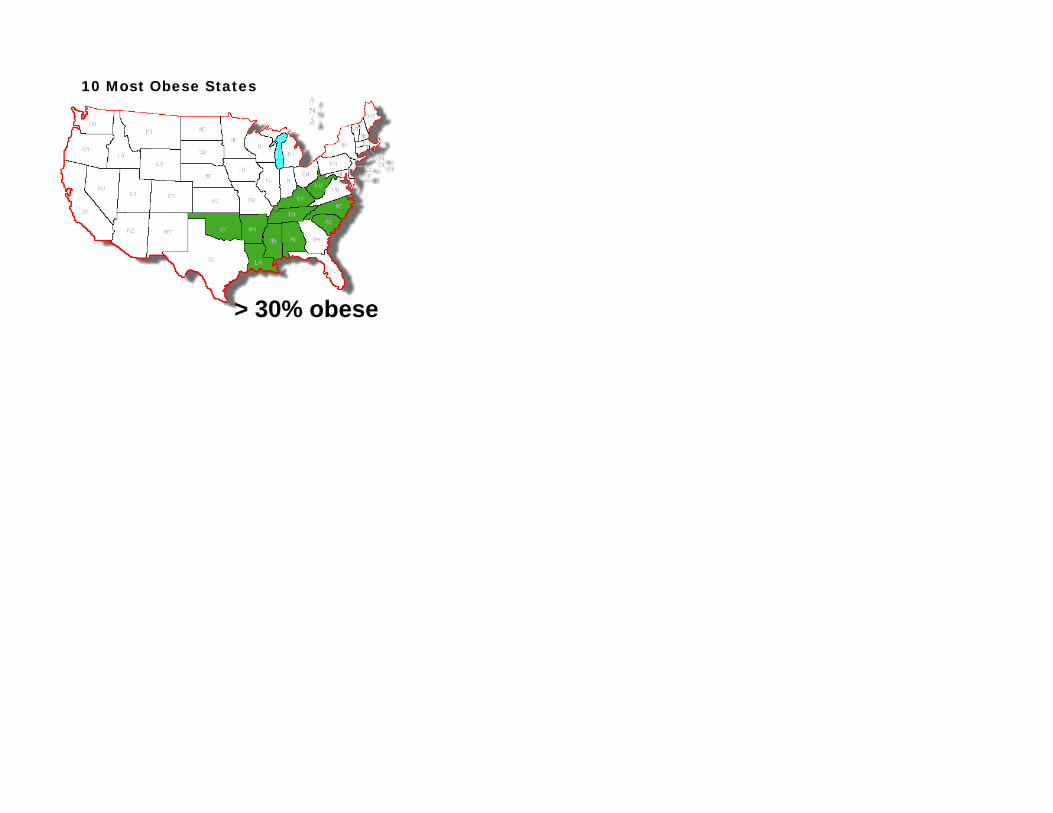
10 Most Obese States
> 30% obese
10 Most Obese States 10 Laziest States
> 30% obese < 63% active
10 Most Obese States 10 Laziest States
> 30% obese < 63% active
10 Most Unhappy States
10 Most Obese States 10 Laziest States
> 30% obese < 63% active
10 Most Unhappy States
10 Most Obese States 10 Laziest States
> 30% obese < 63% active
10 Most Unhappy States
Adult Heart Disease Rate
10 Most Obese States 10 Laziest States
> 30% obese < 63% active
10 Most Unhappy States
Adult Heart Disease Rate
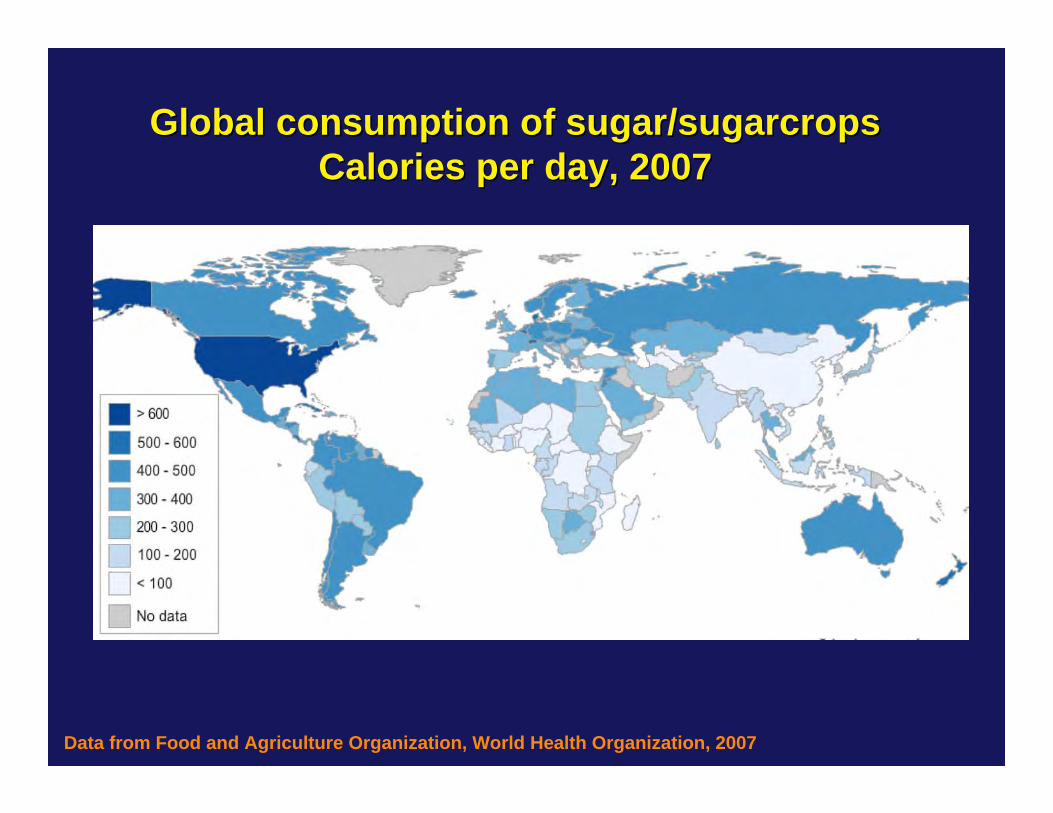
Global consumption of sugar/Global consumption of sugar/sugarcropssugarcropsCalories per day, 2007Calories per day, 2007
Data from Food and Agriculture Organization, World Health Organization, 2007
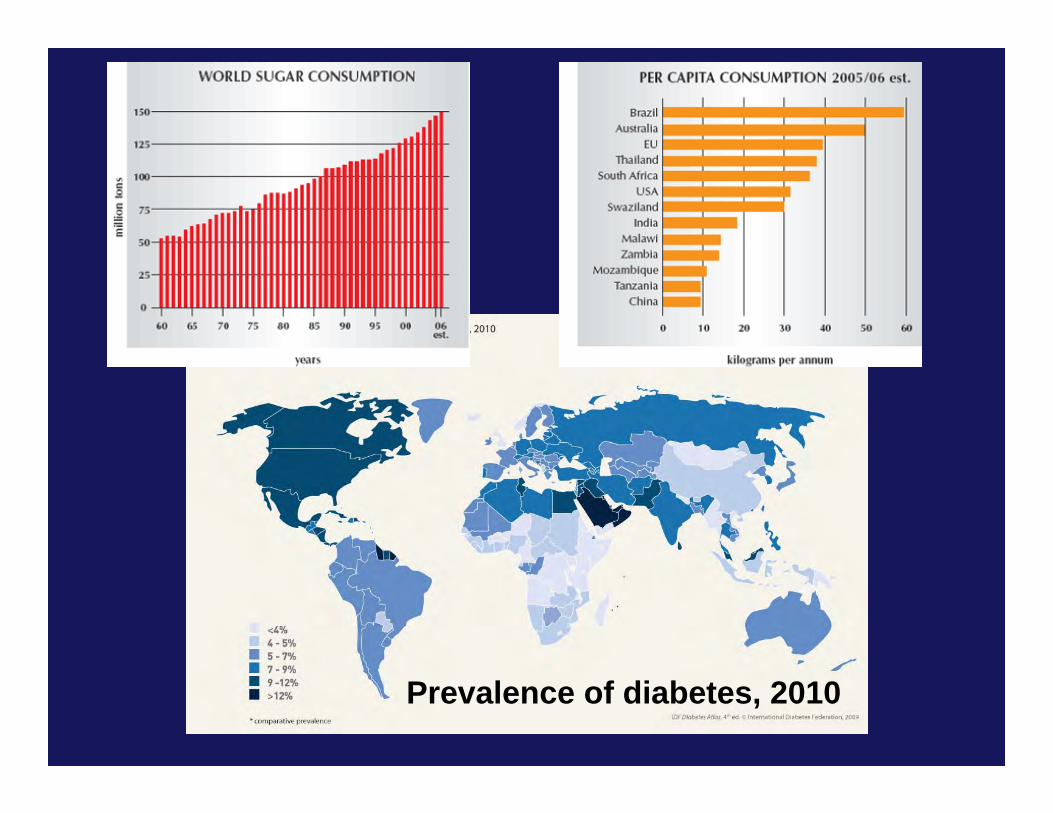
Prevalence of diabetes, 2010
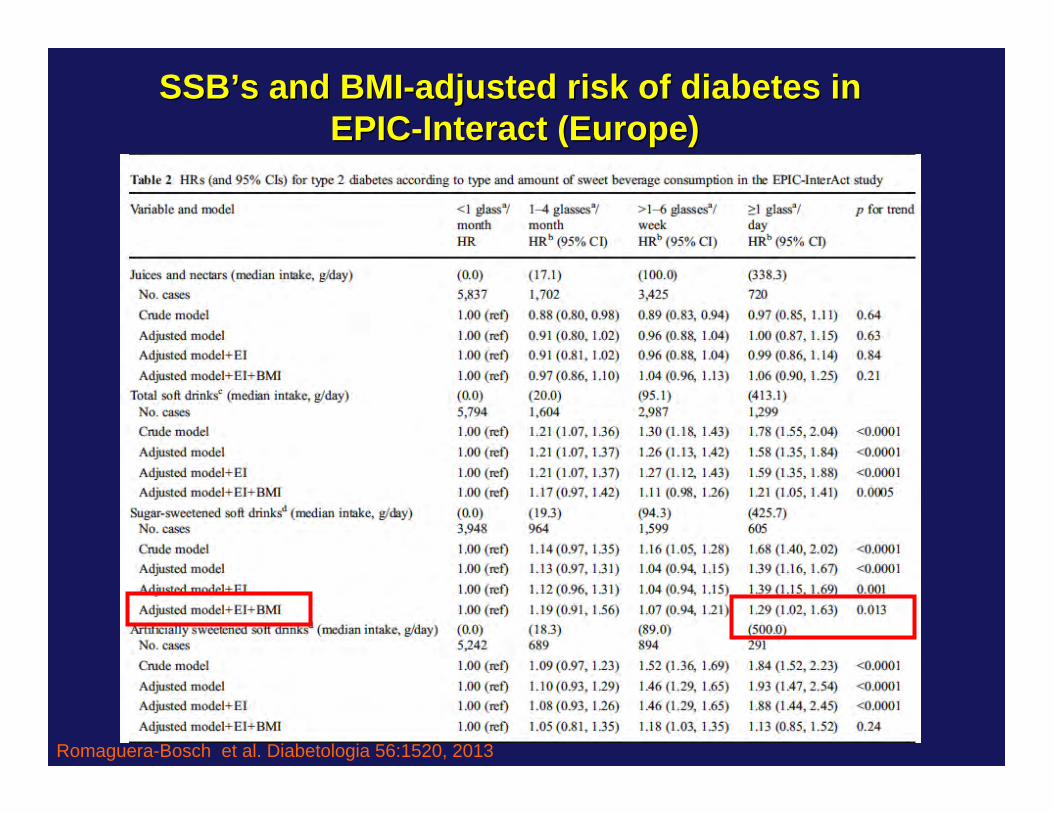
Romaguera-Bosch et al. Diabetologia 56:1520, 2013
SSBSSB’’s and BMIs and BMI--adjusted risk of diabetes in adjusted risk of diabetes in EPICEPIC--Interact (Europe)Interact (Europe)
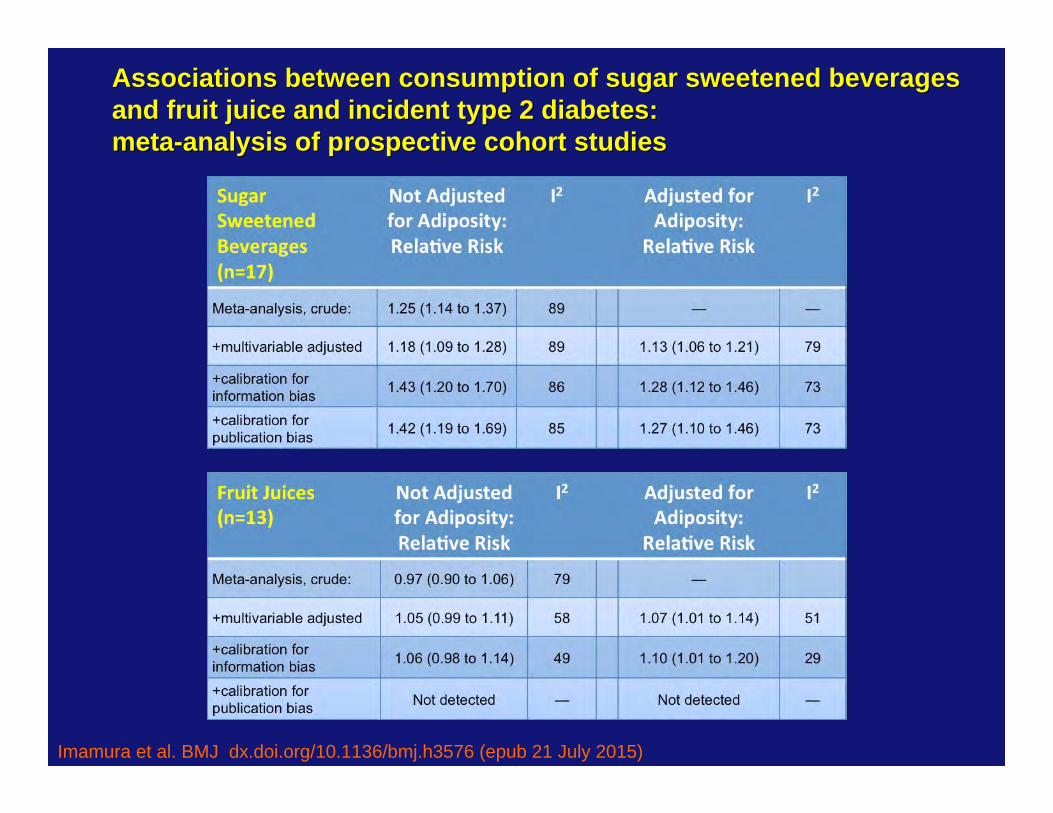
Associations between consumption of sugar sweetened beveragesAssociations between consumption of sugar sweetened beveragesand fruit juice and incident type 2 diabetes: and fruit juice and incident type 2 diabetes: metameta--analysis of prospective cohort studiesanalysis of prospective cohort studies
Imamura et al. BMJ dx.doi.org/10.1136/bmj.h3576 (epub 21 July 2015)
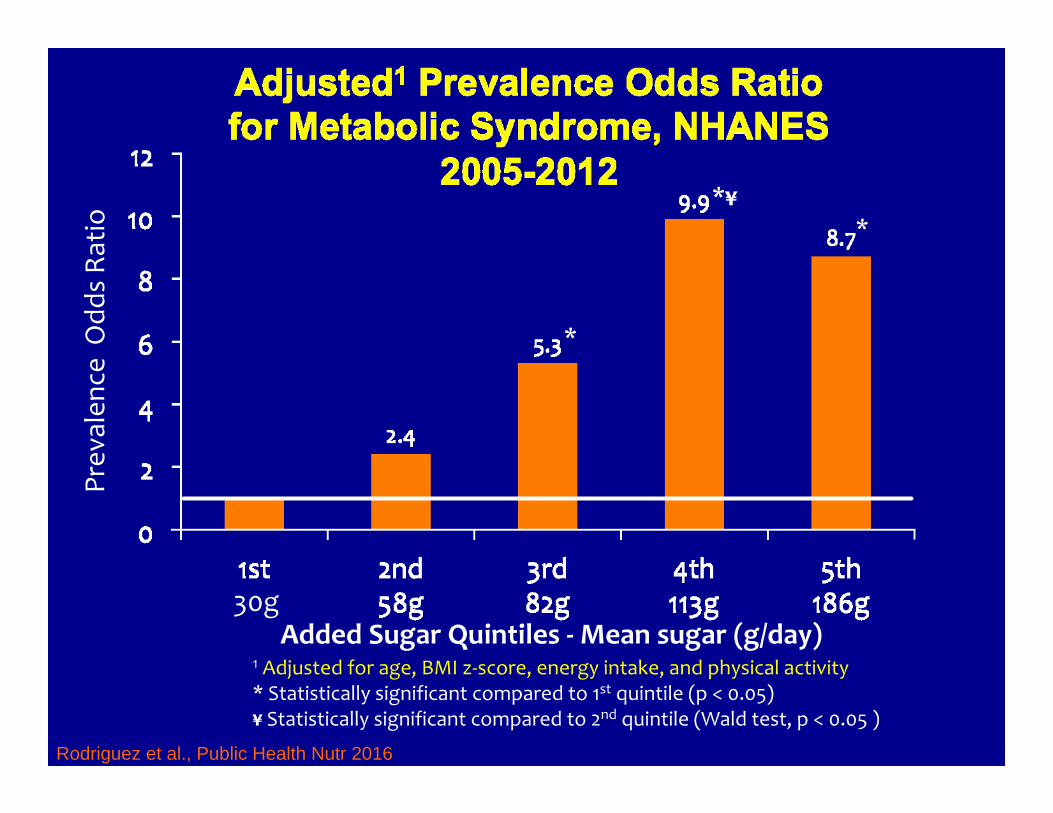
Added Sugar Quintiles ‐Mean sugar (g/day)
Prev
alen
ce O
dds Ra
tio
1 Adjusted for age, BMI z‐score, energy intake, and physical activity* Statistically significant compared to 1st quintile (p < 0.05)¥ Statistically significant compared to 2nd quintile (Wald test, p < 0.05 )
*
*¥*
Rodriguez et al., Public Health Nutr 2016
30g
Sugar and Diabetes: Sugar and Diabetes: Human CausationHuman Causation
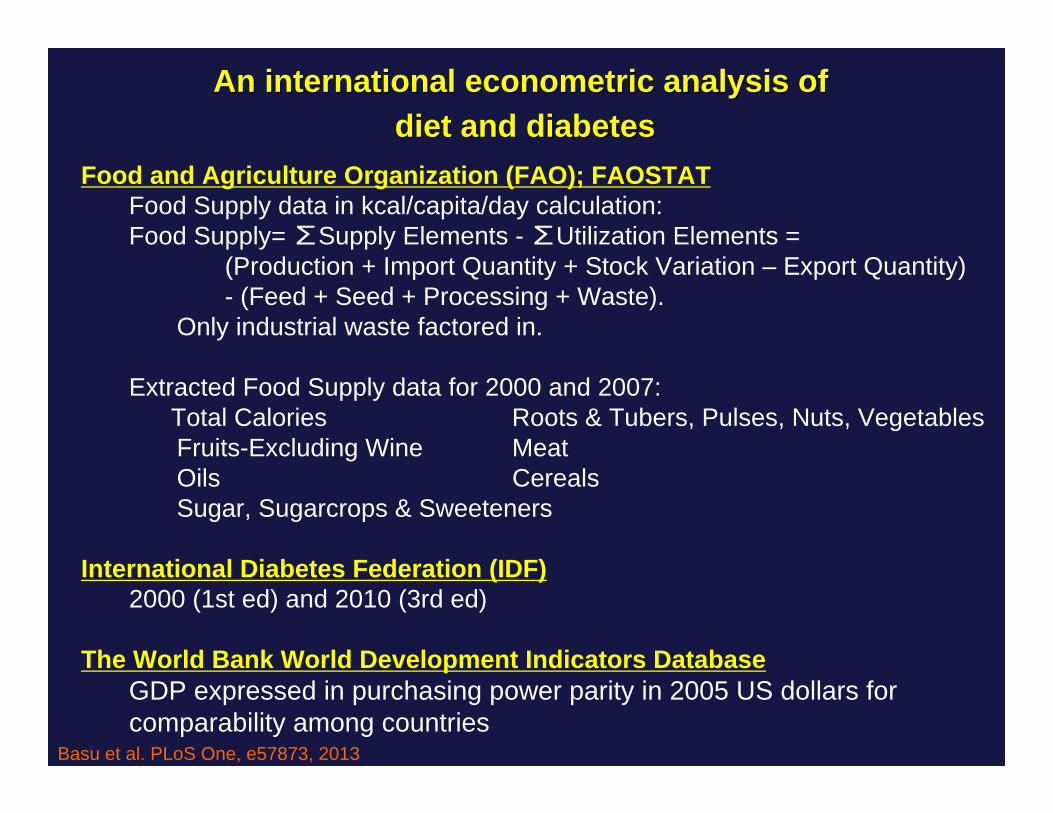
An international econometric analysis of An international econometric analysis of diet and diabetesdiet and diabetes
Food and Agriculture Organization (FAO); FAOSTATFood Supply data in kcal/capita/day calculation: Food Supply= ∑Supply Elements - ∑Utilization Elements =
Extracted Food Supply data for 2000 and 2007:Total Calories Roots & Tubers, Pulses, Nuts, Vegetables Fruits-Excluding Wine MeatOils CerealsSugar, Sugarcrops & Sweeteners
International Diabetes Federation (IDF)2000 (1st ed) and 2010 (3rd ed)
The World Bank World Development Indicators DatabaseGDP expressed in purchasing power parity in 2005 US dollars for comparability among countries
Basu et al. PLoS One, e57873, 2013
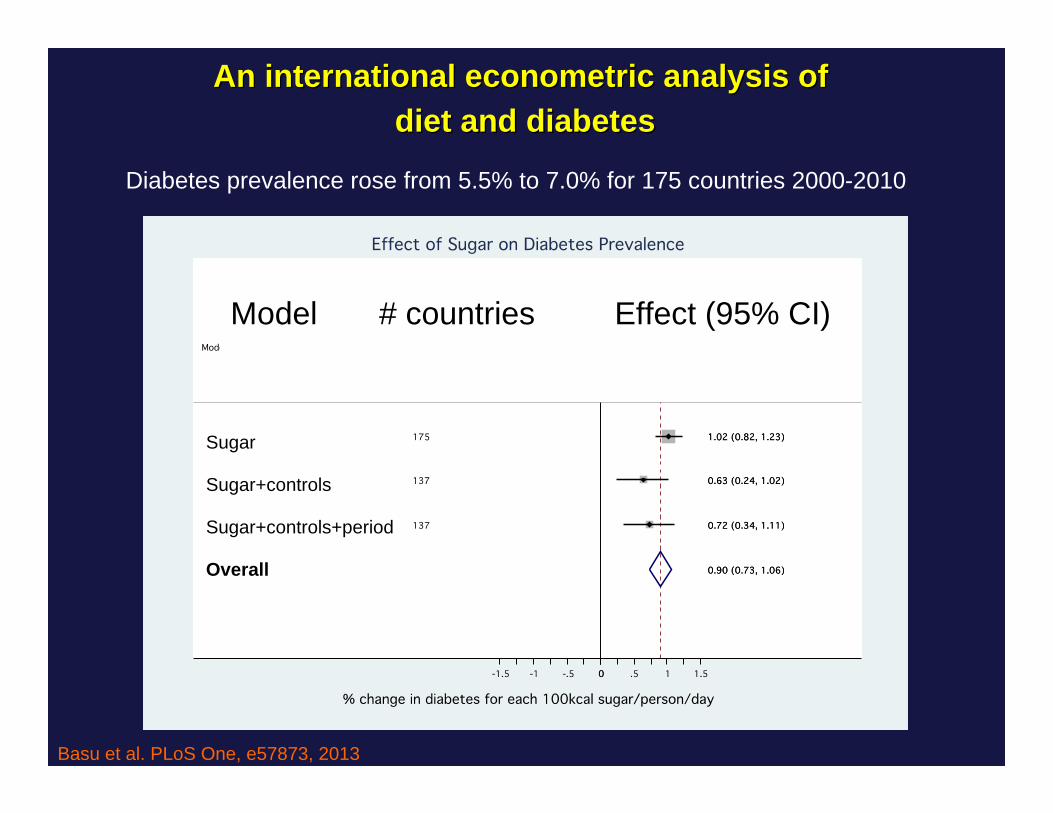
An international econometric analysis of An international econometric analysis of diet and diabetesdiet and diabetes
Diabetes prevalence rose from 5.5% to 7.0% for 175 countries 2000-2010
Sugar
Sugar+controls
Sugar+controls+period
Overall
Model # countries Effect (95% CI)
Basu et al. PLoS One, e57873, 2013
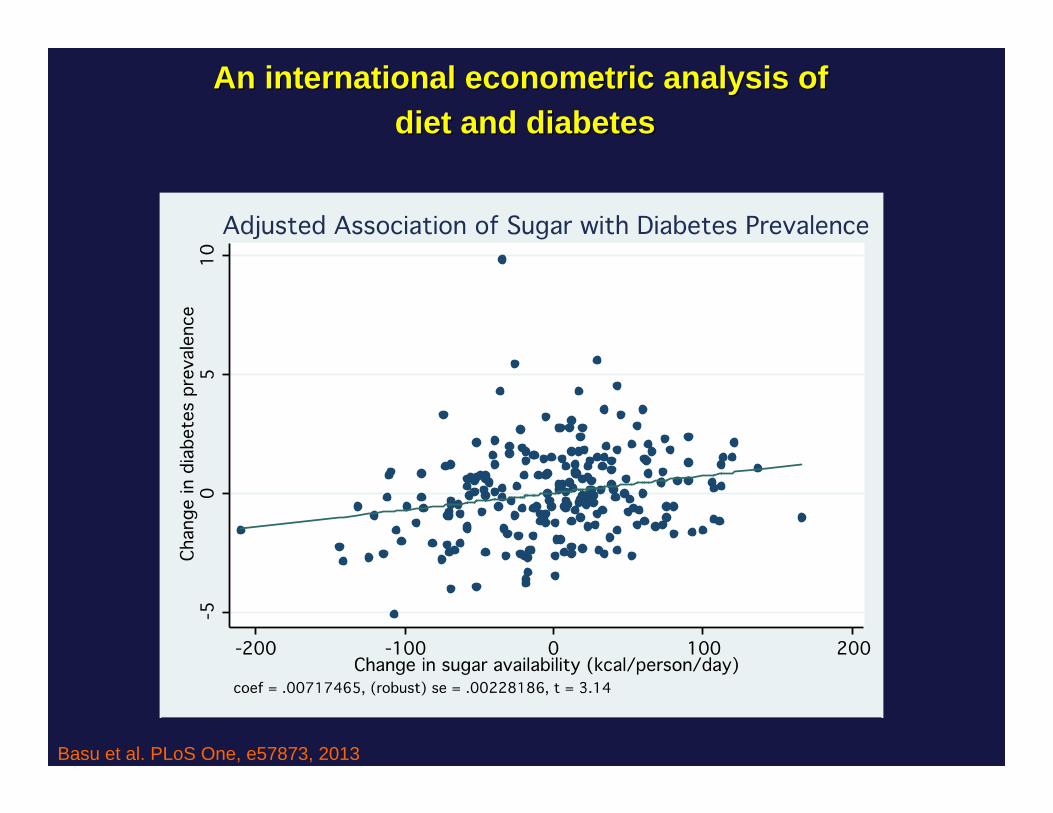
An international econometric analysis of An international econometric analysis of diet and diabetesdiet and diabetes
Basu et al. PLoS One, e57873, 2013
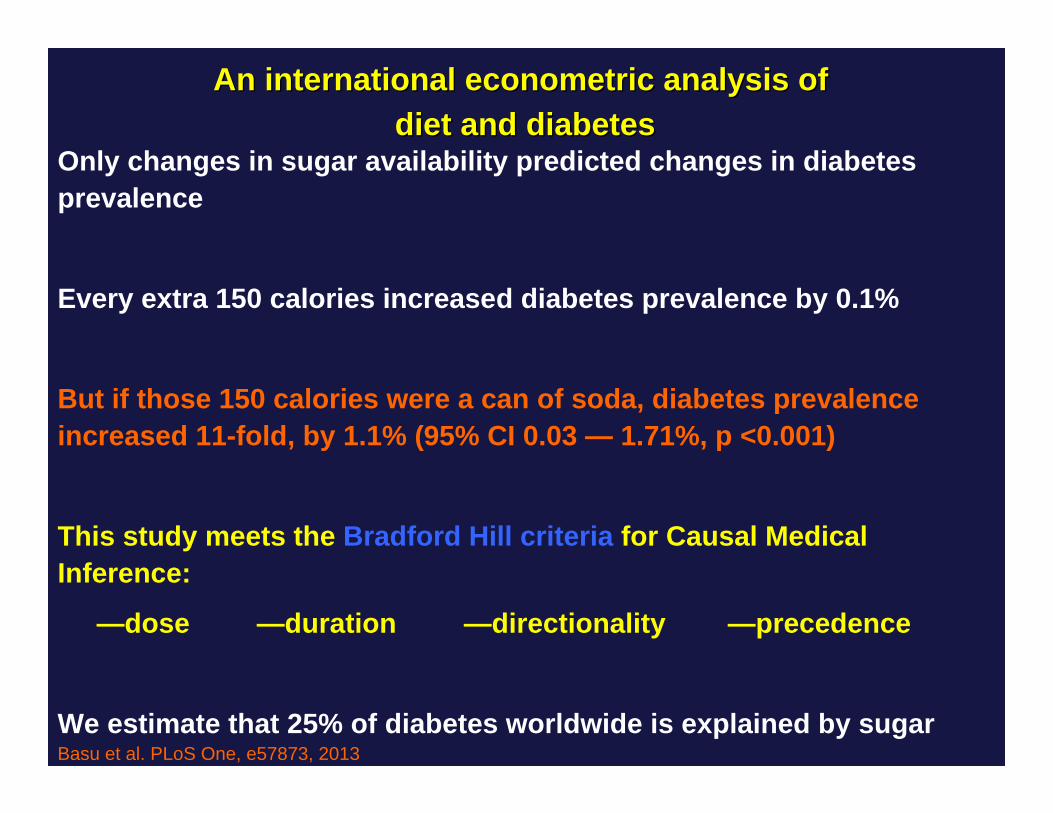
An international econometric analysis of An international econometric analysis of diet and diabetesdiet and diabetes
Only changes in sugar availability predicted changes in diabetesprevalence
Every extra 150 calories increased diabetes prevalence by 0.1%
But if those 150 calories were a can of soda, diabetes prevalence increased 11-fold, by 1.1% (95% CI 0.03 — 1.71%, p <0.001)
This study meets the Bradford Hill criteria for Causal Medical Inference:
—dose —duration —directionality —precedence
We estimate that 25% of diabetes worldwide is explained by sugarBasu et al. PLoS One, e57873, 2013
Lustig et al. Obesity 24:453, 2016
Interventional ProofInterventional Proof
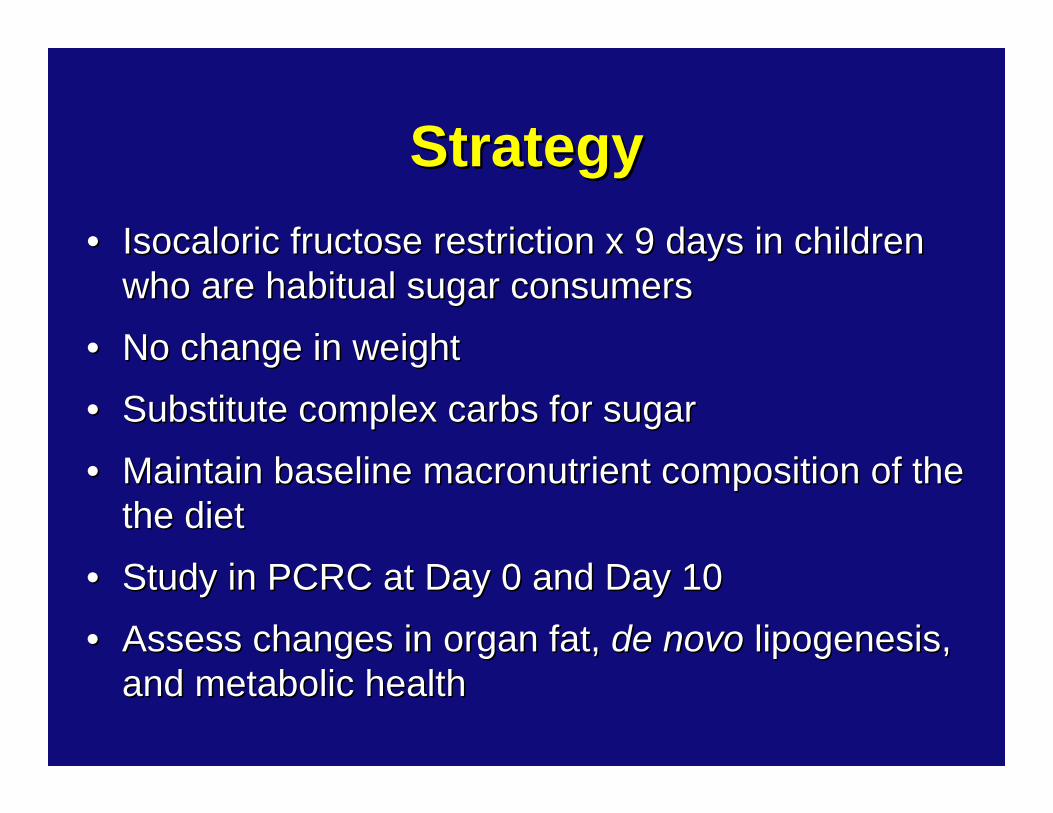
StrategyStrategy•• IsocaloricIsocaloric fructose restriction x 9 days in children fructose restriction x 9 days in children
who who are habitual sugar consumersare habitual sugar consumers
•• No change in weightNo change in weight
•• Substitute complex carbs for sugarSubstitute complex carbs for sugar
•• Maintain baseline macronutrient composition of the Maintain baseline macronutrient composition of the the dietthe diet
•• Study in PCRC at Day 0 and Day 10Study in PCRC at Day 0 and Day 10
•• Assess changes in organ fat, Assess changes in organ fat, de novo de novo lipogenesislipogenesis, , and metabolic healthand metabolic health
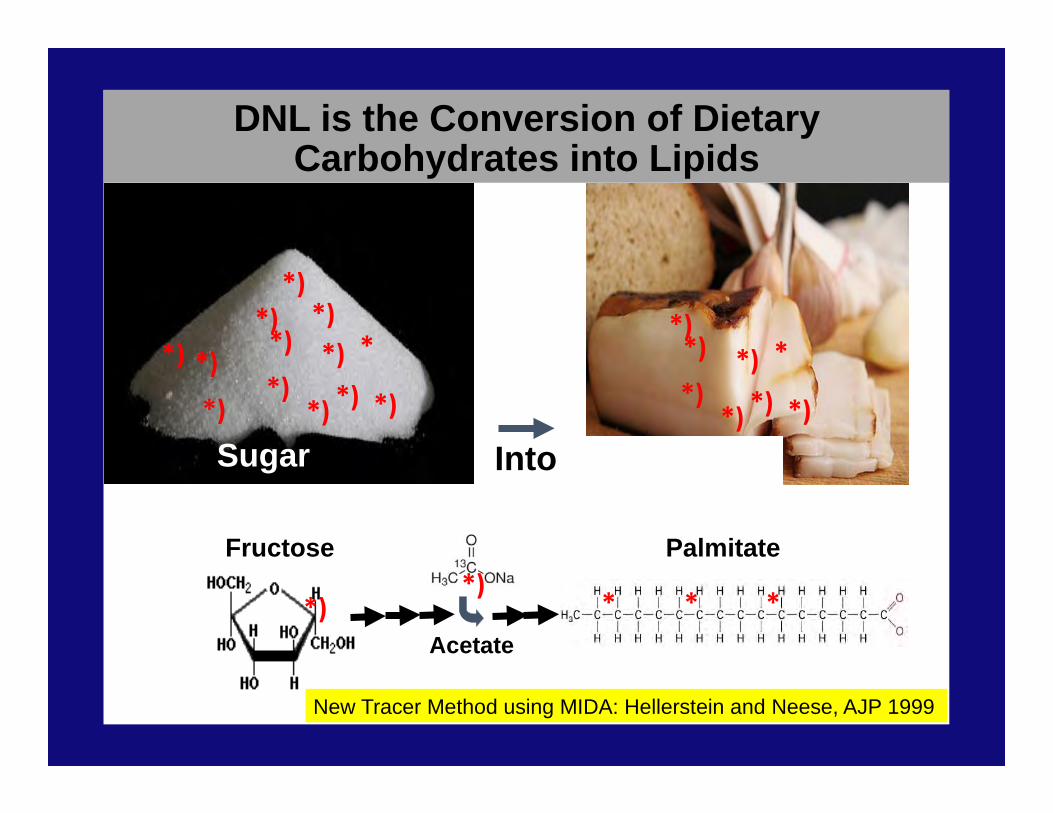
DNL is the Conversion of Dietary Carbohydrates into Lipids
Into Fat (lipids)
*)*)
*) *)
*)*) *)*)
*)
*)
*)*)
**)
*)*) *)*)
*)
*)
*
Sugar
Fructose
*)
Palmitate
* * *Acetate
*)
New Tracer Method using MIDA: Hellerstein and Neese, AJP 1999
0
20
40
60
80
100
120
140
160
Day 0 Day 10
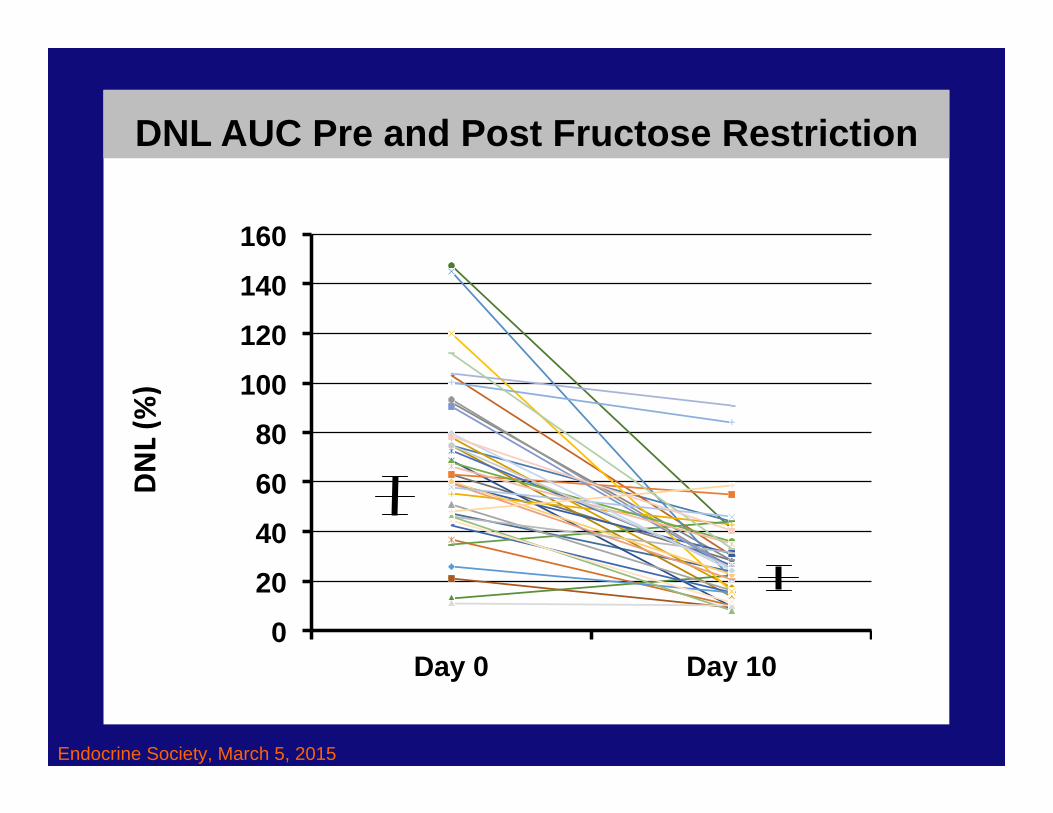
DNL AUC Pre and Post Fructose Restriction
Endocrine Society, March 5, 2015
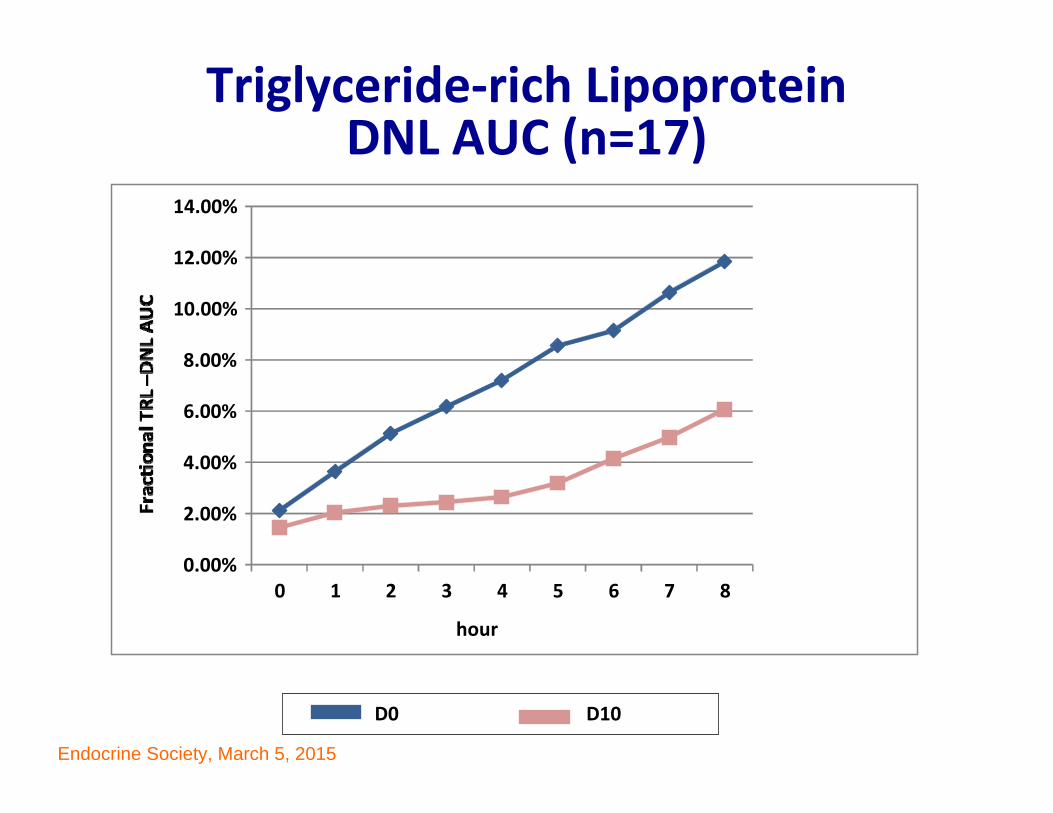
Triglyceride‐rich LipoproteinDNL AUC (n=17)
0.00%
2.00%
4.00%
6.00%
8.00%
10.00%
12.00%
14.00%
0 1 2 3 4 5 6 7 8
D0 D10
hour
Endocrine Society, March 5, 2015
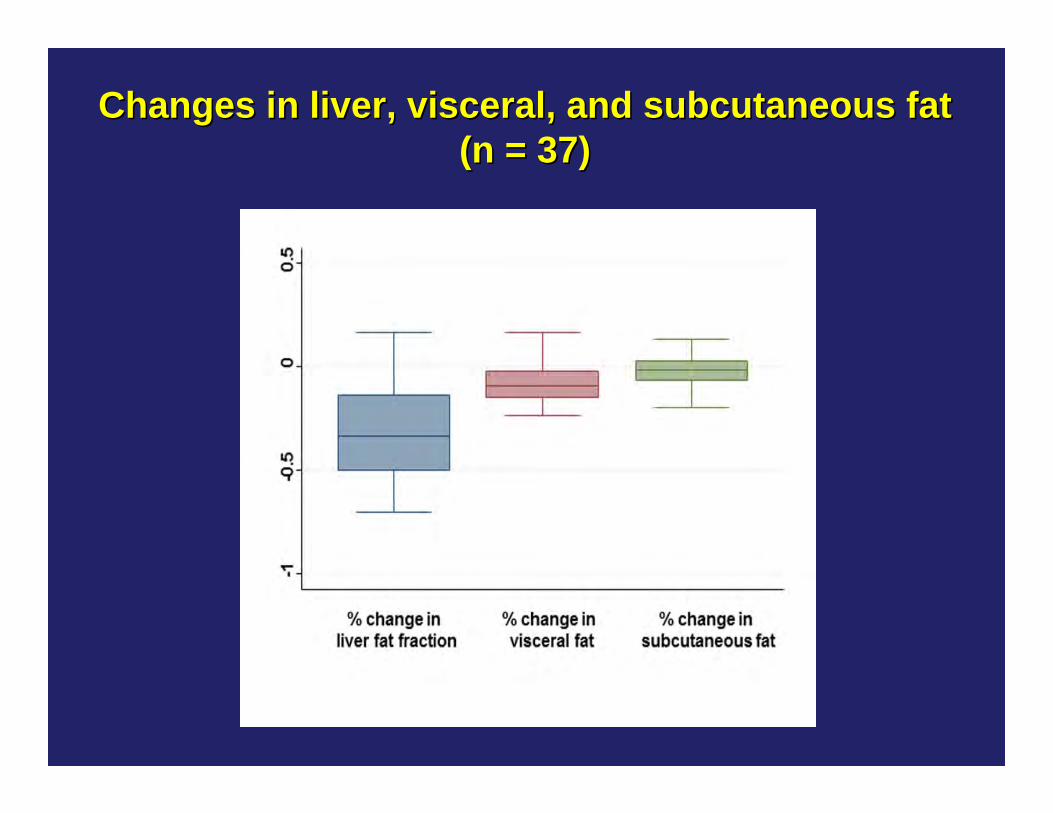
Changes in liver, visceral, and subcutaneous fatChanges in liver, visceral, and subcutaneous fat(n = 37)(n = 37)
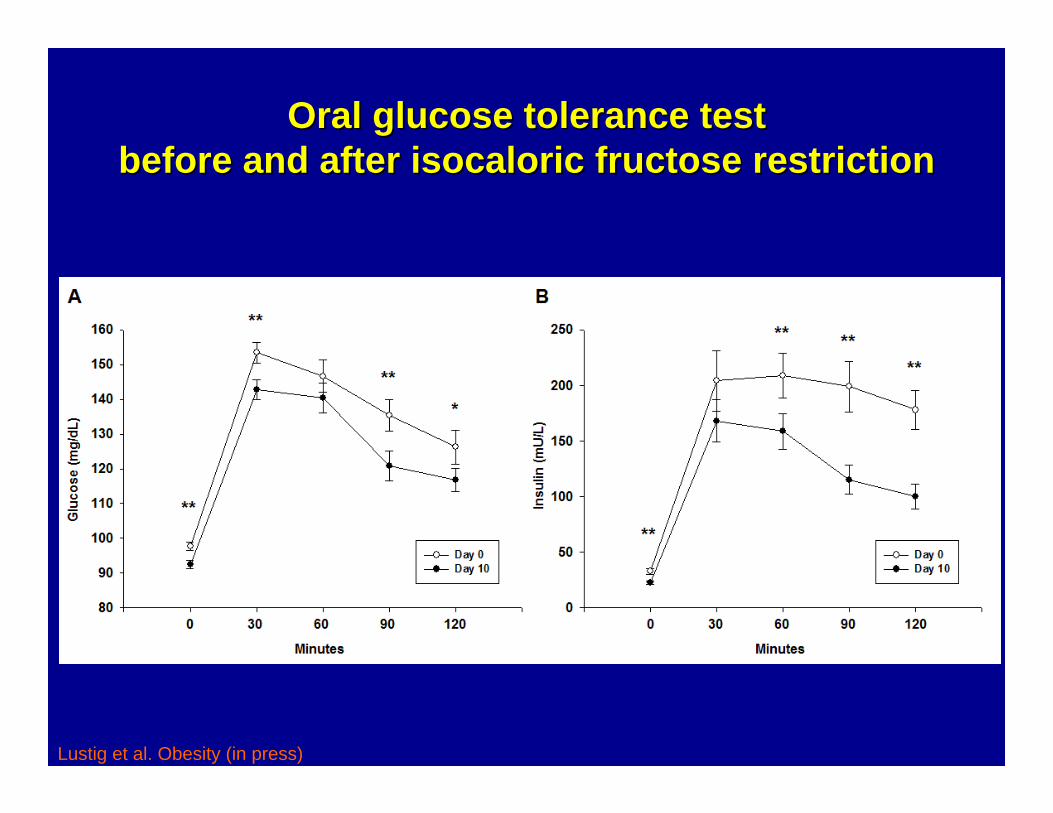
Oral glucose tolerance testOral glucose tolerance testbefore and after before and after isocaloricisocaloric fructose restrictionfructose restriction
Lustig et al. Obesity (in press)
For pediatric subjects with For pediatric subjects with hepatic hepatic steatosissteatosis (n = 25)(n = 25)
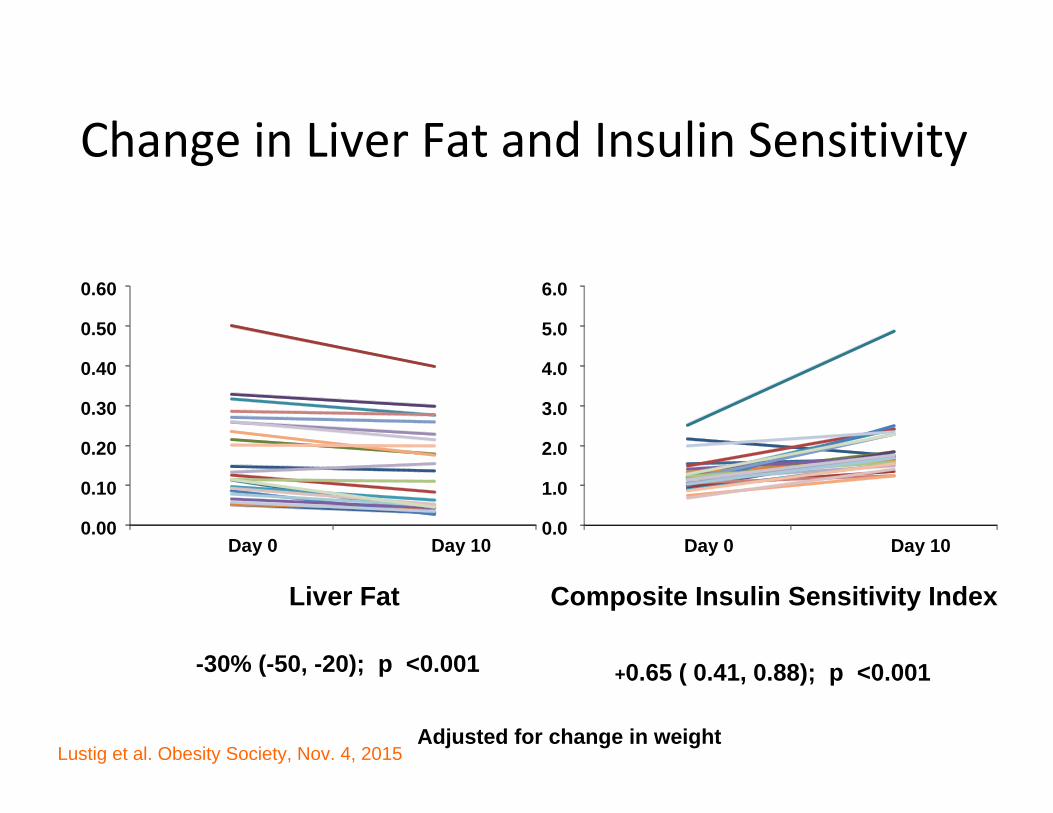
Change in Liver Fat and Insulin Sensitivity
0.00
0.10
0.20
0.30
0.40
0.50
0.60
Day 0 Day 10
Liver Fat
-30% (-50, -20); p <0.001
0.0
1.0
2.0
3.0
4.0
5.0
6.0
Day 0 Day 10
Composite Insulin Sensitivity Index
+0.65 ( 0.41, 0.88); p <0.001
Adjusted for change in weightLustig et al. Obesity Society, Nov. 4, 2015
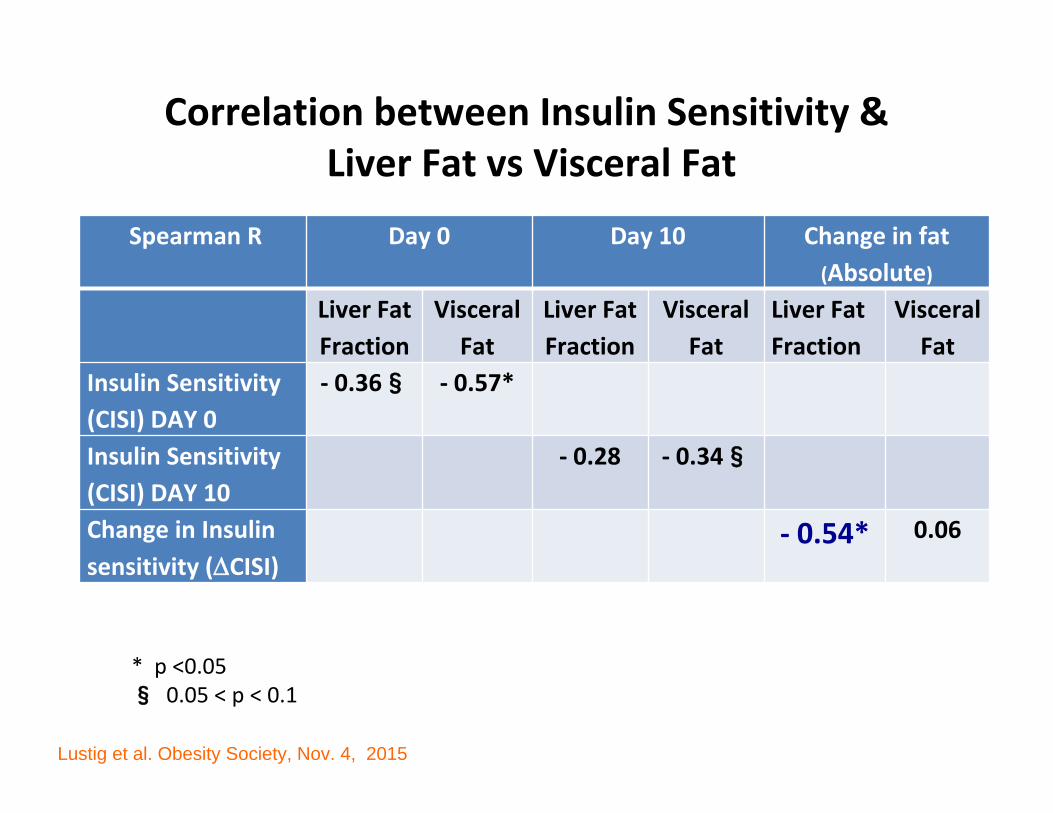
Correlation between Insulin Sensitivity &Liver Fat vs Visceral Fat
Spearman R Day 0 Day 10 Change in fat (Absolute)
Liver Fat Fraction
Visceral Fat
Liver Fat Fraction
Visceral Fat
Liver Fat Fraction
Visceral Fat
Insulin Sensitivity (CISI) DAY 0
‐ 0.36§ ‐ 0.57*
Insulin Sensitivity (CISI) DAY 10
‐ 0.28 ‐ 0.34§
Change in Insulin sensitivity (CISI)
‐ 0.54* 0.06
* p <0.05§ 0.05 < p < 0.1
Lustig et al. Obesity Society, Nov. 4, 2015
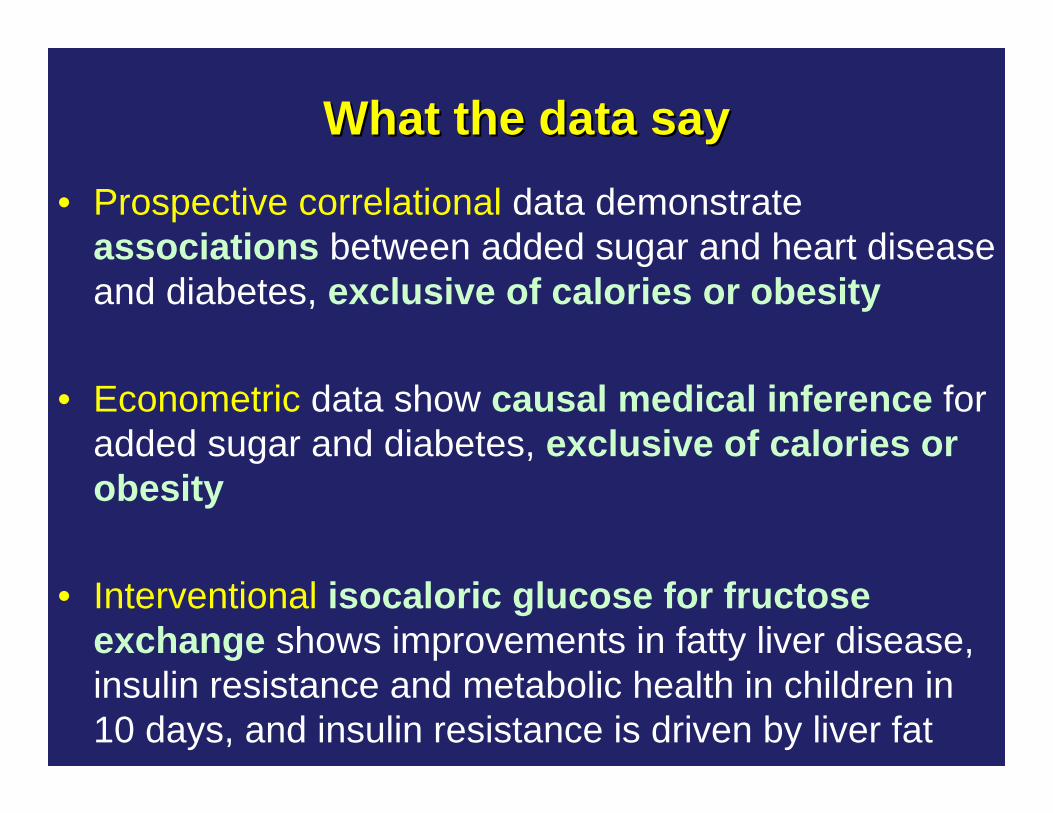
What the data sayWhat the data say• Prospective correlational data demonstrate
associations between added sugar and heart disease and diabetes, exclusive of calories or obesity
• Econometric data show causal medical inference for added sugar and diabetes, exclusive of calories or obesity
• Interventional isocaloric glucose for fructose exchange shows improvements in fatty liver disease, insulin resistance and metabolic health in children in 10 days, and insulin resistance is driven by liver fat
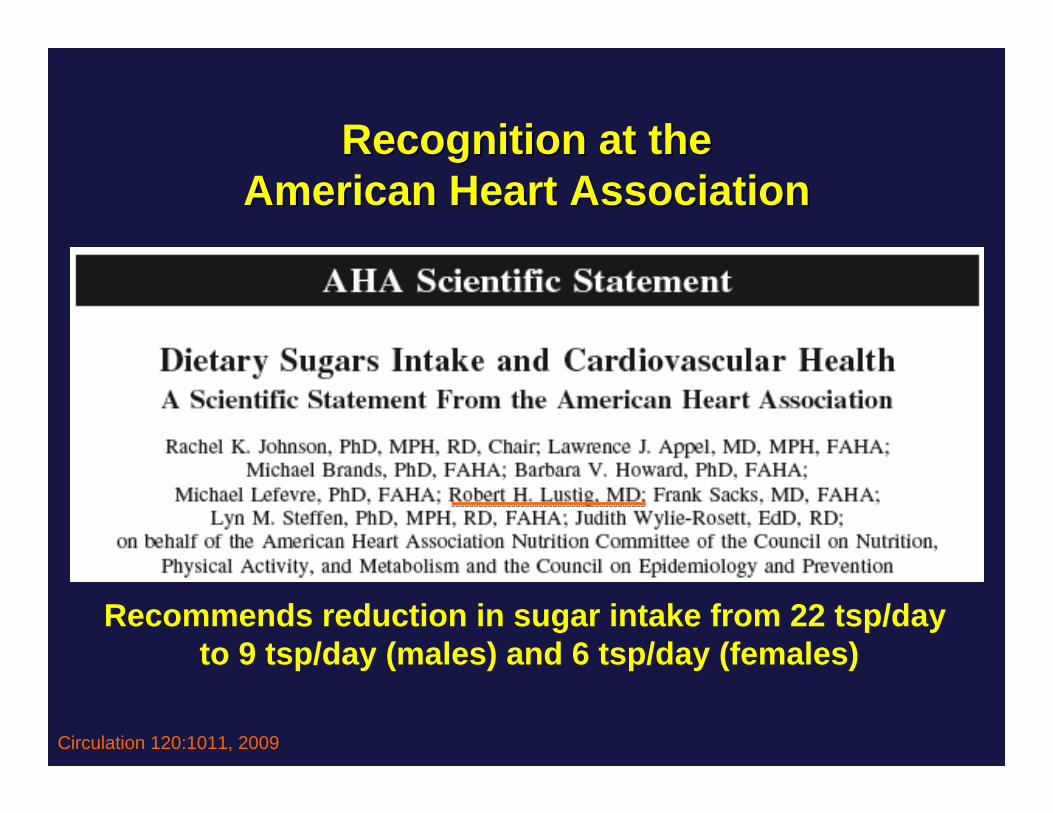
Recognition at the Recognition at the American Heart AssociationAmerican Heart Association
Circulation 120:1011, 2009
Recommends reduction in sugar intake from 22 tsp/day to 9 tsp/day (males) and 6 tsp/day (females)
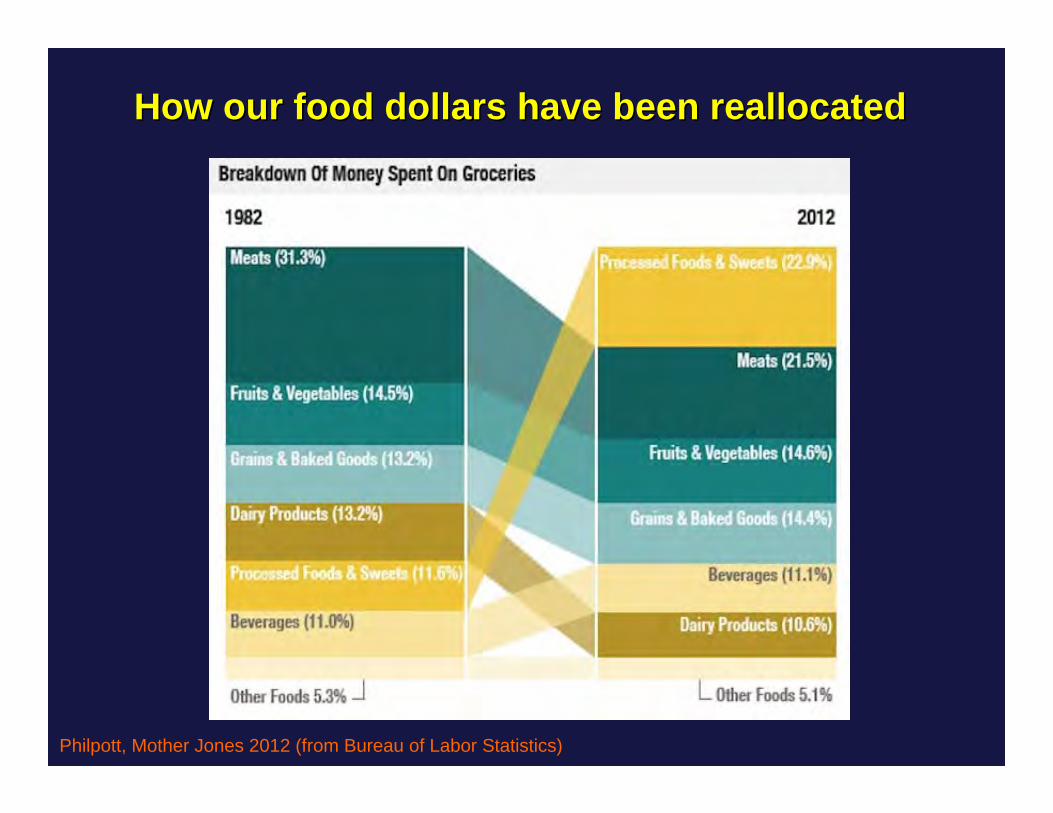
Philpott, Mother Jones 2012 (from Bureau of Labor Statistics)
How our food dollars have been reallocatedHow our food dollars have been reallocated
An inconvenient truthAn inconvenient truth
The “medical” model isn’t the medical model;
It’s the “sugar” model
150
125
100
75
50
25
0
150
125
100
75
50
25
0
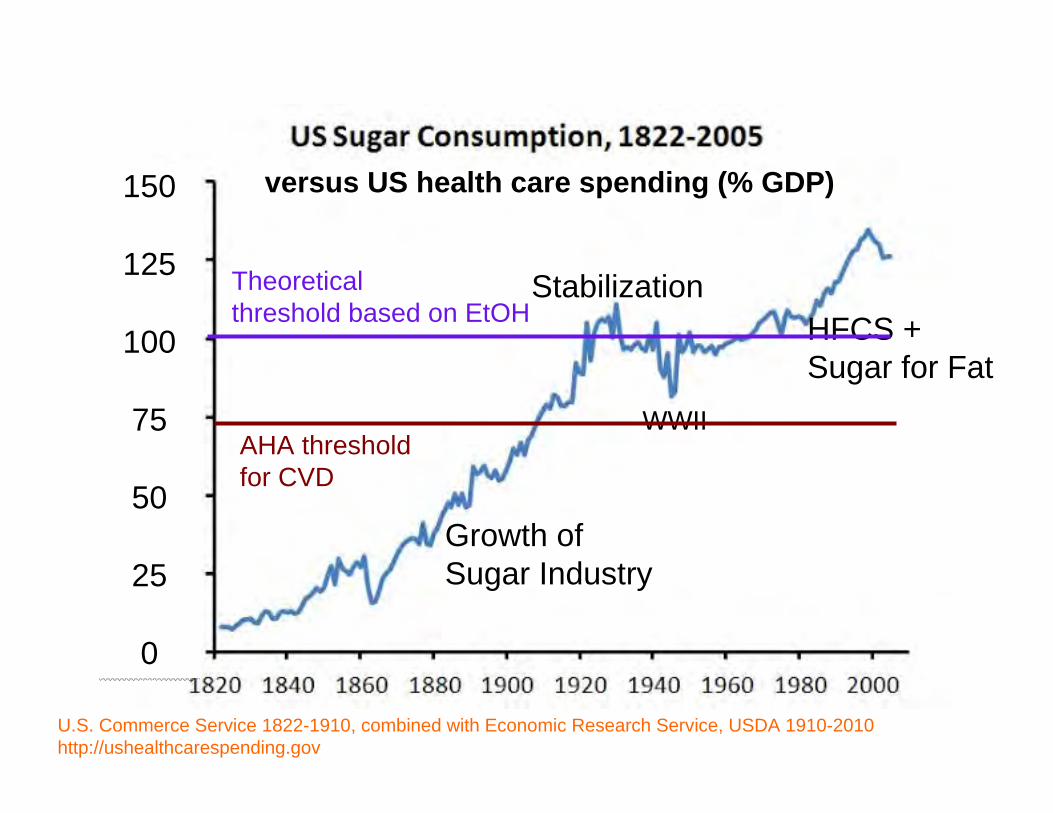
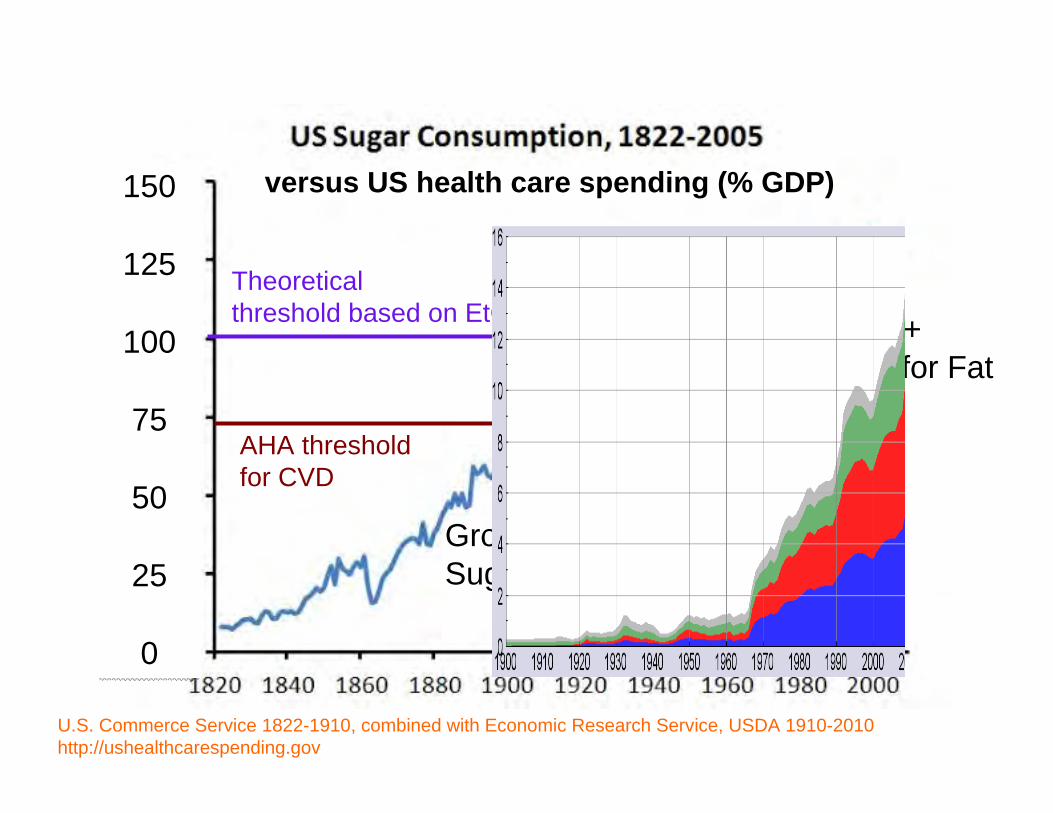
U.S. Commerce Service 1822-1910, combined with Economic Research Service, USDA 1910-2010http://ushealthcarespending.gov
Growth ofSugar Industry
StabilizationHFCS +Sugar for Fat
WWII
Theoreticalthreshold based on EtOH
AHA threshold for CVD
versus US health care spending (% GDP)
150
125
100
75
50
25
0
150
125
100
75
50
25
0
Growth ofSugar Industry
StabilizationHFCS +Sugar for Fat
WWII
Theoreticalthreshold based on EtOH
AHA threshold for CVD
versus US health care spending (% GDP)
U.S. Commerce Service 1822-1910, combined with Economic Research Service, USDA 1910-2010http://ushealthcarespending.gov
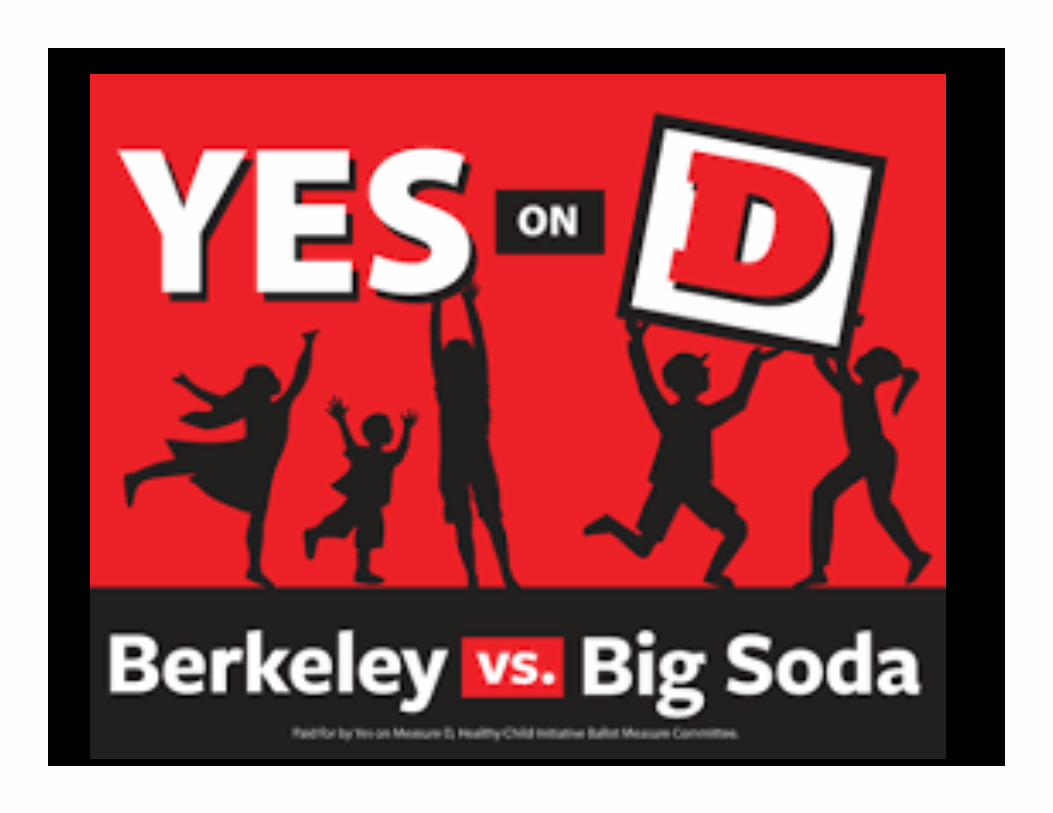
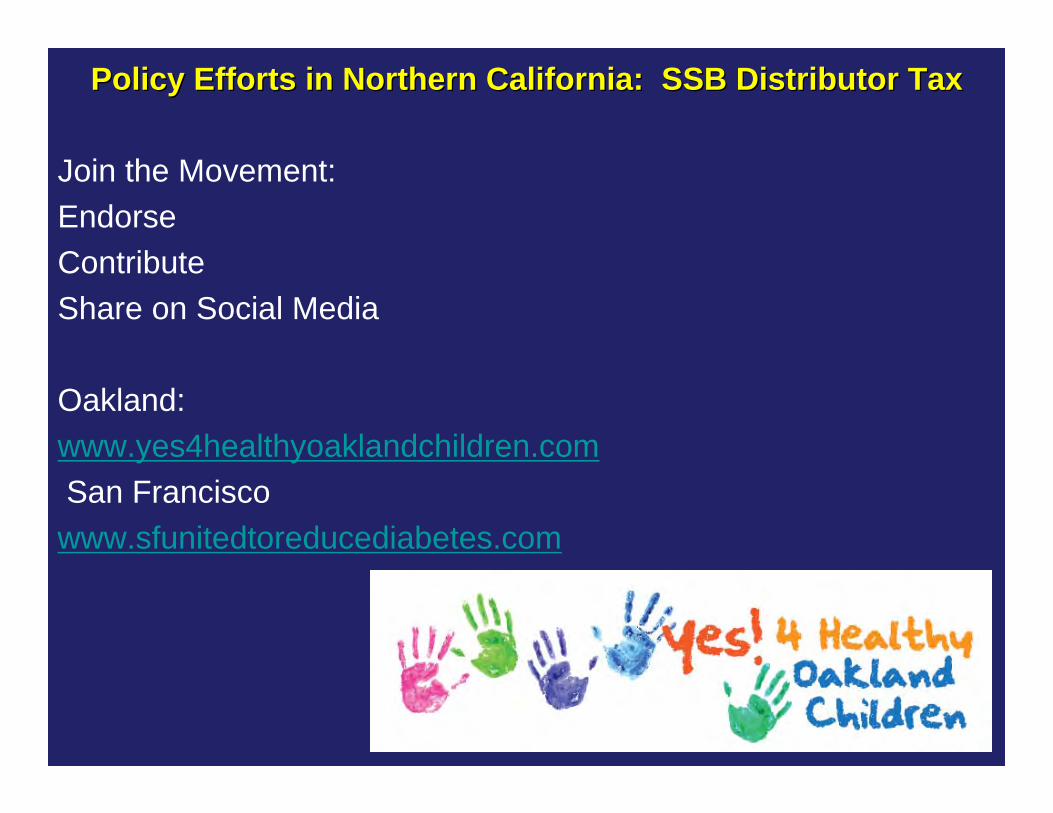
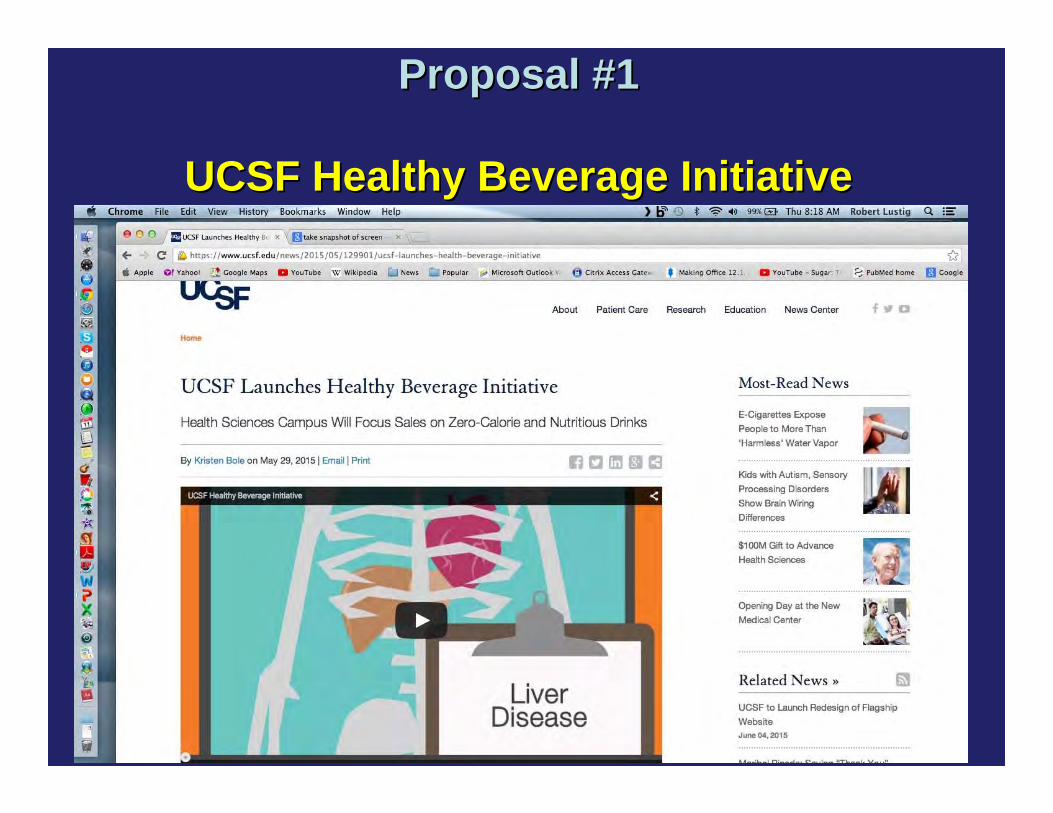
Policy Efforts in Northern California: SSB Distributor TaxPolicy Efforts in Northern California: SSB Distributor Tax
Join the Movement:EndorseContributeShare on Social Media
Type 2 Diabetes should be renamed:Type 2 Diabetes should be renamed:
PROCESSED FOOD DISEASEPROCESSED FOOD DISEASE
Proposal #3 Proposal #3
Rollback the subsidies for processed food:Rollback the subsidies for processed food:
CORNCORNWHEATWHEAT
SOYSOYSUGARSUGAR
Proposal #4Proposal #4
REAL FOOD APPROVEDREAL FOOD APPROVED
Proposal #5Proposal #5
Remove Sugar from the FDARemove Sugar from the FDA““Generally Recognized as SafeGenerally Recognized as Safe”” (GRAS) List(GRAS) List
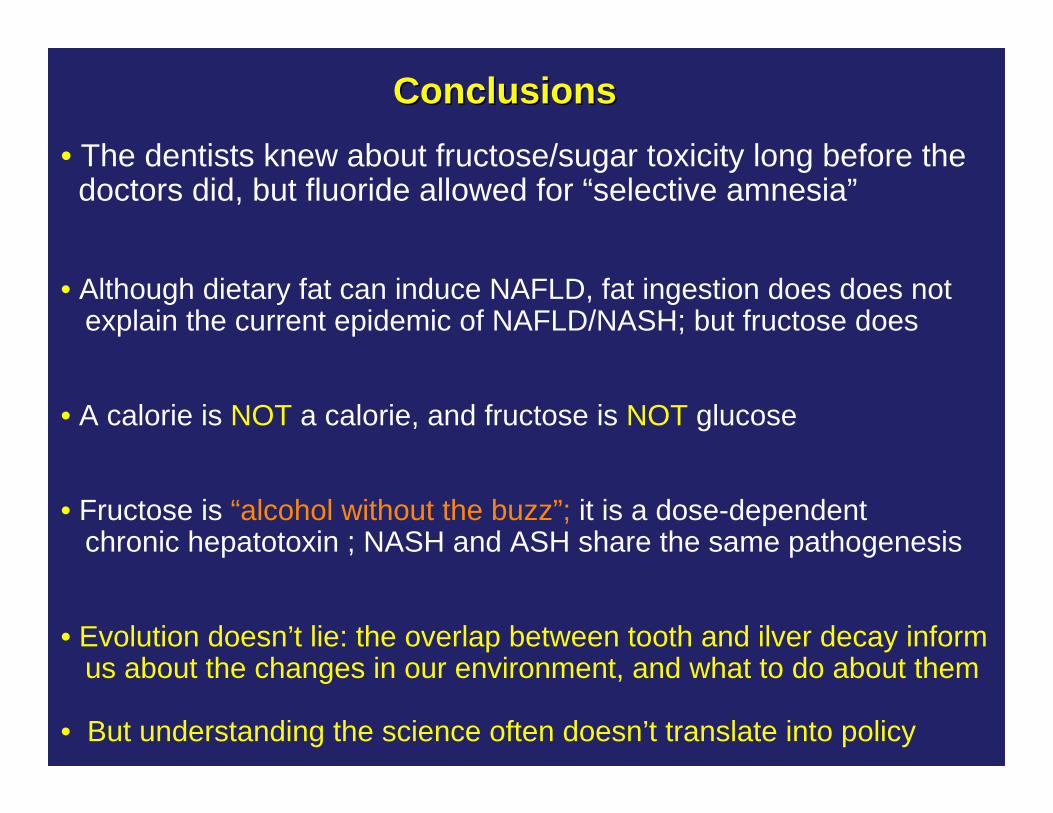
ConclusionsConclusions• The dentists knew about fructose/sugar toxicity long before thedoctors did, but fluoride allowed for “selective amnesia”
• Although dietary fat can induce NAFLD, fat ingestion does does notexplain the current epidemic of NAFLD/NASH; but fructose does
• A calorie is NOT a calorie, and fructose is NOT glucose
• Fructose is “alcohol without the buzz”; it is a dose-dependent chronic hepatotoxin ; NASH and ASH share the same pathogenesis
• Evolution doesn’t lie: the overlap between tooth and ilver decay informus about the changes in our environment, and what to do about them
• But understanding the science often doesn’t translate into policy
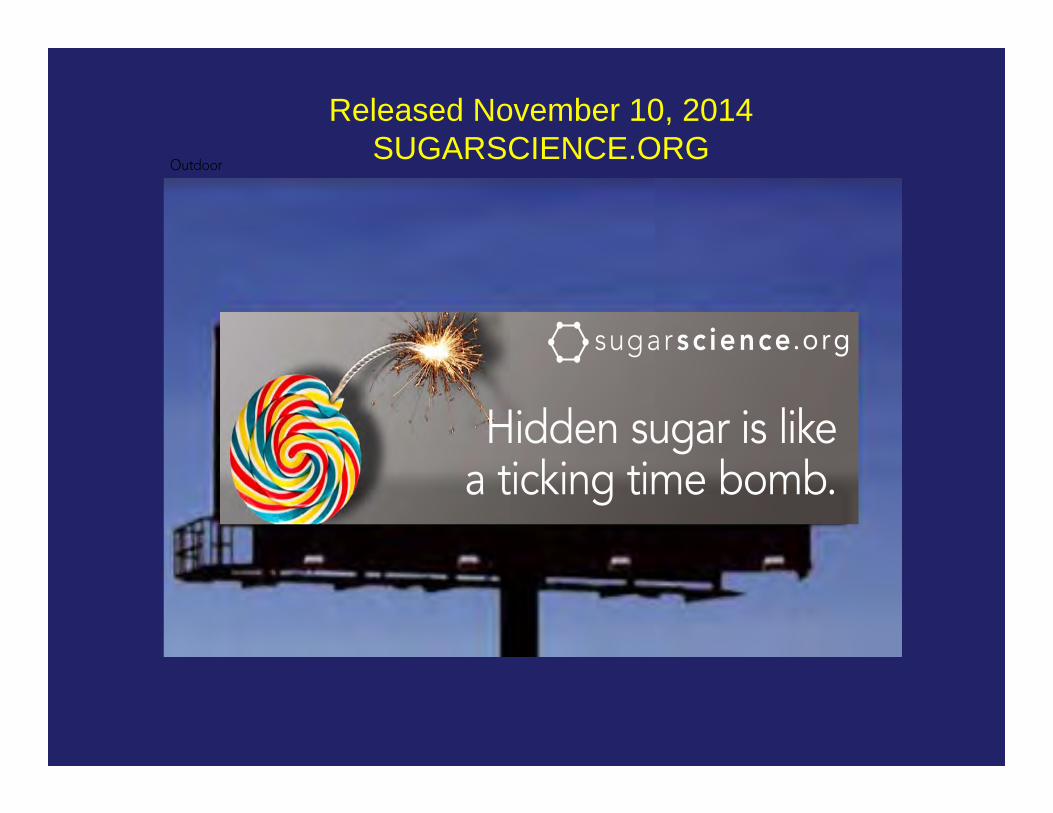
Released November 10, 2014SUGARSCIENCE.ORG
On NETFLIX
Canadian DocumentaryCanadian Documentary On NETFLIX
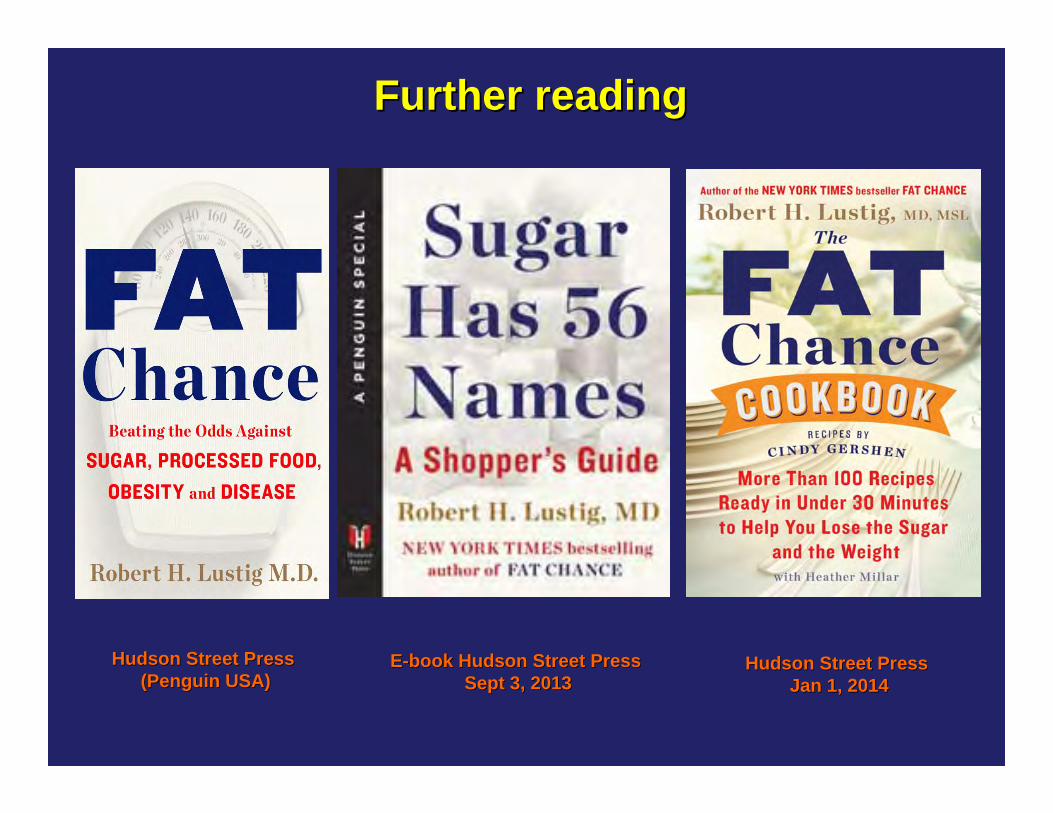
Hudson Street PressHudson Street Press(Penguin USA)(Penguin USA)
EE--book Hudson Street Pressbook Hudson Street PressSept 3, 2013Sept 3, 2013
Hudson Street PressHudson Street PressJan 1, 2014Jan 1, 2014
Further readingFurther reading
Public Television Special, USANow also in Spanish“Dulce Venganza”
We have started a nonWe have started a non--profit to provide profit to provide
medical, nutritional and legal analysis and consultationmedical, nutritional and legal analysis and consultation
to promote personal and public health vs. Big Foodto promote personal and public health vs. Big Food
responsiblefoods.orgresponsiblefoods.org
UCSF Weight Assessment for Teen and Child Health (WATCH)Andrea Garber, Ph.D., R.D.Patrika Tsai, M.D., M.P.H.Stephanie Nguyen, M.D. M.A.S.Emily Perito, M.D.Jung Sub Lim, M.D., Ph.D.