“Roberto Franceschi” Research Grants
for MSc and PhD students
Attachment 1 – Summary of research project – To be attached to candidate's application (facsimile)
Title of proposed research: Empirical Measures on Social Exclusion:
1. A Single censoring Multidimensional Poverty measure for Ethiopia
2. Multidimensional Poverty measure with individual preferences for Ethiopia
3. Happiness Index measure for Ethiopia
Author’s name, surname and (possible) affiliation:
Mekonnen Andualem Goshu
Supervisor: Prof. Raffaele Miniaci and Prof. Decancq Koen
Keywords (up to four): Single Censored MPI, Happiness index, Preference based MPI
Research Abstract (maximum length 5,000 characters) detailing: (a) research objectives; (b) methodology to be adopted; (c) timing of data collection; (d) summary description of the dataset that will be made available.
The Research Objectives
The study will work three papers using an empirical collected data in order to smash the following
objectives:
1. To test the applicability of the above three new social exclusion models with a real data that has
not been tested before
2. Very relevant to understand some theoretical framework and contribute for the existing
literatures.
3. The Stiglitz-Sen-Fitoussi report remarks that “what we measure affects what we do and if our
measurements are flawed, decisions may be distorted” (Stiglitz et al. 2009, p.7). It is helpful to
have a good measure of poverty in order to understand the real problems and to choose a set of
policies to affect different social exclusion variables such as health, gender inequality, child
labour, political abandon, education, access to some services including clean water and others.
Methodology
Theoretical Models
The study will use three methodologies to analyze social exclusion: Multidimensional poverty
(specifically focus on deprivation in health, education, standard of living, empowerment, asset
endowment and income, political freedom, and other capability indicators) and happiness index (to
measure the level of happiness).
a. A new Multidimensional Poverty Estimation Model: Developed By Mekonnen Andualem Goshu, 2014
The study used censoring for the aggregated deprivation score in order to determine who is poor
or not. Unlike Bourguignon and Chakravarty family of poverty indices and the Alkire-Foster
measure, censoring is used only for the second cutoff. It contributes for the existing literatures by
adding richer information setting in the welfare measurement of an individual.
b. A Stated Preference based MPI estimation: Developed by: Decancq et.al. 2014
The study used aggregation of the different dimensions that are relies on individual preferences. The Pareto
principle is, therefore, satisfied among the poor. The indices add up individual measures of poverty that are
computed as a convex transform of the fraction of the poverty line vector to which the agent is indifferent.
c. Happiness index for Ethiopia : Under development by: Mekonnen Andualem Goshu
Data
The study will use a primary data collected from a structured questionnaire from seven regions in
Ethiopia: Addis Ababa, Oromia, Amhara, Harari, Dire Dawa, Tigray and SNNP, which accounts 95.5
percent of the total population of the country.
The need of Primary Data
To undertake the above three methodologies, to the knowledge of the researcher there are no data sets that
are compatible to the need of the models, specifically for the first two methodologies. The data sets that
are available in different institutions are binary data or count data for the measurement of MPI or social
exclusion. The models that are going to be implemented here needs a different data set formats:
a. Single censoring Multidimensional Poverty measure : this requires that all dimensions to have
ordered information or count data set in order to show both the depth and severity of poverty
b. Multidimensional Poverty Measure with individual preference: it needs stated preference where
households are directly asked about their preferences to different MPI dimensions, where it is
impossible to find the relevant information from the existing data sets that are needed for this
methodology
Why Ethiopia is selected
1. The researcher origin of country is from Ethiopia, hence, I can contribute a lot for the design of
the questioner and on the collection of the data set
2. Poverty and social exclusion is much exploded in developing countries. According to the OPHI
estimation of global poverty Ethiopia located 103 positions out of 104 countries. So, it is
convenient country that shows a variety degree of poverty and social exclusion.
3. For the quality of the study: it is possible to get a variety of social exclusion degree in Ethiopia
than elsewhere so as to implement those developed poverty and social welfare methodologies
4. There exists data quality problem in Ethiopia and the area coverages of those data sets are also
very narrow.
Therefore, the data will be collected by well-trained enumerator in the seven regions. The study will use a
random selection method to select a total of 3600 sample households.
The data that is going to be collected will include questions related to various fields related to social
exclusion so as to broaden the area of coverage and to increase its accessibility for other researchers in the
area of: Economics, sociology, psychological, demographic and population
Specific to my study, information related to the following will be collected:
Demographic characteristics
Poverty related questions
Inequality related questions
Life satisfaction rate
Questions related with health, education, standard of living,
Empowerment
Access to services such as: road, water, electricity, toilet, transportation and others
Child labour and gender abuse
Political freedom and attitude
Human right and democratic right
A Study on Social Exclusion or Multidimensional Poverty Measure
Research Project
By: Mekonnen Andualem Goshu
(PhD candidate at Milan University (LASER): Email:
Supervisors: Prof. Raffaele Miniaci and Prof. Decancq Koen
A traditional approach to a measure of poverty is typically based on the net monetary income of
a household unit, or on their consumption. A traditional approach defines a person as poor if
his/her income is below a poverty line. The poverty line may be subjective, objective, or hybrid.
It is often established at a nationally determined level based on a food or consumption basket or
as a percentage of the mean or median overall income distribution (Bigsten, 2007).
The thought that income or consumption couldn't be a decent pointer of an individual wellbeing
because of the externality and business sector disillusionment constrained researchers to discover
an option method for measuring the wellbeing of an individual (Ravallion, 2011). In the last
decade, the predominant role of income-based metric of social welfare and development has
progressively been more questioned, generating an extensive debate about the need to consider
the multifaceted nature of individual and collective wellbeing (Ferreira, 2011). The spearheading
original papers of Sen (1976) and Foster-Greer-Thorbecke (1984), has moved the standardizing
methodology of poverty estimation to the multidimensional case. Right on time in the 1980's the
work of Townsend (1979), Streeten (1981) and Sen (1976) demonstrated that the wellbeing of an
individual is relying on different measurements such as exclusion from health, education,
standard of living, empowerment, human right, political right, information technology, , political,
transportation and other services; and considering psychology, inequality, insecurity and fear,
justice, immigration and other exclusion dimensions.
The instinct behind their defense is that the deprivation in income has a multiplicative impact on
others measurements of an individual wellbeing. Hence, understanding the deprivation extent in
different dimensions could help policy maker in order to understand the most deprived
dimension and make target oriented policy. The multiple deprivation or social exclusion involves
the lack or denial of resources, rights, goods and services, and the inability to participate in the
normal relationships and activities, available to the majority of people in a society, whether in
economic, social, cultural or political arenas. It affects both the quality of life of individuals and
the equity and cohesion of society as a whole. The definition of ‘multidimensional poverty’,
adopted by the United Nations talks of ‘social discrimination and exclusion’ and of ‘lack of
participation in decision-making civil, social and cultural life’.
Henceforth, many scholars have started developing a multidimensional poverty measure that
takes into considers deprivations in many welfare indicators, though there have been difficulties
of measuring it (Tsui, 2002; Chakravarty and Bourguignon, 1999, 2003; Alkire and Foster, 2009;
Ravallion, 1996, 2011; Data, 2013; Sen 1987, 1992; Atkinson 2003). However, the problem of
destitute information set is one of the great challenges for the measurement of social exclusion
indexes. Moreover, most of the methodologies are lacking showing the extent of deprivation of
dimensions, and which could have implicit impact on the aggregate measure of MPI. The
Stiglitz-Sen-Fitoussi report remarks that “what we measure affects what we do and if our
measurements are flawed, decisions may be distorted” (Stiglitz et al. 2009, p.7).
Hence, developing a model that consider both the extent and depth of poverty, and a model that
have richer information set is relevant. Therefore, the paper has developed a new social
exclusion or multidimensional poverty measure that is based on richer information set and shows
both the depth and the extent of deprivations in different social exclusion dimensions. This
methodology is called a single censoring MPI measure. Analogous to the single censoring MPI
measure, Decancq et.al, 2014 have developed a new MPI measure with individual preference
that gives richer information set. However, these two models have not yet tested with empirical
data set.
Objective of the study
The study will work three papers using an empirical collected data in order to smash the
following objectives:
1. To demonstrate the applicability the new theoretical models with empirical data
2. To measure the social exclusion index for Ethiopia
Methodology
The study will try to estimate empirically the following three models.
1. A single censoring multidimensional Poverty Index measure
A single censoring multidimensional Poverty Index measure by Mekonnen (2014) has two parts:
a double cutoff -single censoring multidimensional model and a single cutoff- single censoring
multidimensional model. The study used censoring for the aggregated deprivation score in order
to determine who is poor or not. Unlike Bourguignon and Chakravarty family of poverty indices
and the Alkire-Foster measure, censoring is used only for the second cutoff. It contributes for the
existing literatures by adding richer information setting in the welfare measurement of an
individual. The model fulfilled all multidimensional poverty axioms, including transferability
and monotonicity axioms. Moreover, the study suggested a weighting scheme across individuals.
The study recommends the use of count and categorical data formats rather than dichotomous
data set for the measurement of multidimensional poverty become more appropriate in order to
show the depth and severity of poverty. 1The measure can be given as follows:
mijs = Ɯij(Vij)
αj
Where, Ɯij =
{
[1 −
Yij
∑ Yijni=1
]
is for endowments yij
∑ yijni=1
is for deprivation
And;
1 Detail description of the methodological paper can be provided up on request. The paper is under review
Vij =
{
Tj−Yij
Tj
is for endowments; and yij−Ṯj
yij
Is for deprivation
Where,
Yij is the endowment of i individual for j dimension;
yij is the dispossession of i individual for J dimension;
Tj is the maximum endowment achieved in j dimension for a given society;
Ṯj is the minimum dispossession value of j dimension.
Sij is the share of individual i endowment/ dispossession from the total J dimension
Vij is the deprivation gap of i individual for j dimension
There are two means to choose the value of T. The first one is to use the maximum value
achieved in the society. The second way to choose the value of T is to choose the maximum
possible value for a particular dimension. The maximum possible schooling in one developing
country may be 15 whereas in a developed country may be 24. Similarly, it is also possible to
choose the minimum possible dispossession value. The minimum possible dispossession value
for a household mortality can be zero.
The contribution to the individual score is:
For the endowments,
1 1ij ijs
ij
j j
Y Ym
nY T
The higher is Yij (the endowment or attainment), the lower the index:
11 1 0 0
s
ij ij ij
ij j j j j
m Y Y
Y nY T T nY
Similarly, for deprivations mijs =
yij
∑ yijni=1
(yij−Ṯj
yij)α
The higher is yij (deprivation or dispossession), the higher the deprivation index
∂mij
∂yij =
1
ny (yij−Ṯj
yij)α
+ αṮj (1
yij2)
yij
∑ yijni=1
> 0
2. Multidimensional Poverty with individual preferences
The multidimensional poverty model with individual preferences has been developed by
Decancq et.al, 2014. There are two motives to use individual preference based MPI estimation.
First, individuals attitude to different dimensions are not the same. What is important for one
individual may not be the same for others. Second, it enriches the model since individuals have
possibly different preferences over the different poverty dimensions.
Considering preference can give answer for weighting scheme and complementarity or
substitutability issues. It does not make sense anymore to think of poverty as deprivation in a
number of distinctive dimensions, each with a threshold. Now, the relevant threshold becomes a
wellbeing threshold.
An agent is identified as poor if she consumes a bundle of goods that lies in the lower contour set
of a preference-specific poverty line vector. Furthermore, the idea of respecting preferences is
captured by the requirement that the poverty measure should satisfy a Pareto property among the
poor: an increase in the preference satisfaction of a poor agent decreases overall poverty. For the
purpose of estimation the model will use stated preference whereby respondents will be asked
their preference to different dimensions. 2
3. Happiness Index
The poverty measures are always take into account the lower contour of the social exclusion and
ignore those individuals who have located in the upper contour sets. However, even if an
individual is below the poverty threshold the person might be deprived in some dimensions.
2 The full paper can be found http://www.gla.ac.uk/media/media_307628_en.pdf
Hence, the motive of the happiness index is to consider all the social exclusion dimensions
including economic, social and psychological and determining an aggregated index for a country.
Background of the study area
Ethiopia has diverse demographic, socio-cultural and natural features, with more than 70 ethnic
groups, and over 84 million populations and an average annual population growth rate of 2.6%
over the period 1994-2009 (CSA, 2010). Ethiopia is the second most populous country in Africa
after Nigeria. The population structure is dominated by young people, with those under 15 years
of age, representing 45% of the population, which results in a high dependency ratio (CSA,
2010). The country possesses enormous cultural and genetic diversity. Ethiopia is a country with
enormous geographic diversity, as it has a wide range of agroecological zones reflecting the wide
variation in rainfall, temperature, altitude, topography, and soils. Ethiopia's socioeconomic
feature is predominantly rural and agricultural. About 85% of the population are rural;
agriculture employs more than 80% of the labor force (Ethiopian Economic Association, 2011).
By all available indicators, Ethiopia is one of the poorest countries in the world. The income
poverty, measured by the percentage of the population living below PPP US$1. 25 per day
is 39% (Dercon et al. 2009).
Ethiopia’s HDI value of 2012 is also the lowest in the world that is 0.396, positioning the
country at 173 out of 187 countries and territories. Between 2000 and 2012, Ethiopia’s HDI
value increased from 0.275 to 0.396, an increase of 44 percent or average annual increase of
about 3.1 percent. Ethiopia’s 2012 HDI of 0.396 is below the average of 0.466 for countries in
the low human development group and below the average of 0.475 for countries in Sub-
Saharan Africa (Ibid).
Hence, poverty in Ethiopia has multi-dimensional character. Poverty is a multi-dimensional
concept refers to the households’ inability to provide sufficient means of subsistence and to lead
a decent economic and social life. There has been little effort made by previous studies to
estimate the multidimensional poverty except the international comparable Multidimensional
Poverty Indices (MPI) estimation made for 104 countries using a set of ten indicators
encompassing different dimensions of welfare and deprivation, whereby Ethiopia also included
(UNDP, 2010). However, MPI estimation should have to be need based; a country specific
estimation of MPI that consider the country’s cultural, and demographic distribution is very
necessary. It is because; MPI indicators have not similar relevance or are not robust, equally for
developed and developing countries.
Data
The study will use a primary data collected from a structured questionnaire from seven regions in
Ethiopia: Addis Ababa, Oromia, Amhara, Harari, Dire Dawa, Tigray and SNNP, which accounts
95.5 percent of the total population of the country.
The need of Primary Data
To undertake the above three methodologies, to the knowledge of the researcher there are no data
sets that are compatible to the need of the models, specifically for the first two methodologies.
The data sets that are available in different institutions are binary data or count data for the
measurement of MPI or social exclusion. The models that are going to be implemented here
needs a different data set formats:
a. Single censoring Multidimensional Poverty measure : this requires that all dimensions to
have ordered information or count data set in order to show both the depth and severity of
poverty
b. Multidimensional Poverty Measure with individual preference: it needs stated preference
where households are directly asked about their preferences to different MPI dimensions,
where it is impossible to find the relevant information from the existing data sets that are
needed for this methodology
Why Ethiopia is selected
1. The researcher origin of country is from Ethiopia, hence, I can contribute a lot for the
design of the questioner and on the collection of the data set
2. Poverty and social exclusion is much exploded in developing countries. According to the
OPHI estimation of global poverty Ethiopia located 103 positions out of 104 countries.
So, it is convenient country that shows a variety degree of poverty and social exclusion.
3. For the quality of the study: it is possible to get a variety of social exclusion degree in
Ethiopia than elsewhere so as to implement those developed poverty and social welfare
methodologies
4. There exists data quality problem in Ethiopia and the area coverages of those data sets are
also very narrow.
Therefore, the data will be collected by well-trained enumerator in the seven regions. The study
will use a random selection method to select a total of 3600 sample households.
The data that is going to be collected will include questions related to various fields related to
social exclusion so as to broaden the area of coverage and to increase its accessibility for other
researchers in the area of: Economics, sociology, psychological, demographic and population
Specific to my study, information related to the following will be collected:
Demographic characteristics
Poverty related questions
Inequality related questions
Life satisfaction rate
Questions related with health, education, standard of living,
Empowerment
Access to services such as: road, water, electricity, toilet, transportation and others
Child labour and gender abuse
Political freedom and attitude
Human right and democratic right
Housing
civic engagement
democratic participation, and due process (rating level of participation and freedom with
a set of indicators)
exclusion due to disability
exclusion due to religion (exceptionally dummy variable)
exclusion due to professions, thinking (exceptionally dummy variable)
exclusion due to belonging to some communities (exceptionally dummy variable)
exclusion due to economy, social, religion, psychology stand
information technology
Globalization
insecurity and fear
immigration,
Significance of the paper
Generally the papers have both theoretical and empirical contributions:
1. The first two models: “ single censoring Multidimensional Poverty measure” and “
Happiness Index” are the new models developed by the researcher
2. The third model, “ Multidimensional Poverty Measure with individual preference” is the
model developed by Decancq et.al, 2014 and the model has not been yet empirically
tested with a preference based on stated preferences
3. It will contribute by giving important policy implications about social exclusion and
poverty
References
Alkire Sabina; Sarwar Moizza Binat. 2009. Multidimensional Measures of Poverty & Well-
being. Oxford Poverty & Human Development Initiative (OPHI). Oxford Dept of International
Development, Queen Elizabeth House, university of Oxford
Atkinson A. 2003. Multidimensional deprivation: contrasting social welfare and counting
approaches. Journal of Economic Inequality 1: 51–65, 2003. Kluwer Academic Publishers.
Printed in the Netherlands
Bigsten Arne and Shimeles Abebe.2007. Poverty Transition and Persistence in Ethiopia: 1994
2004. SE 405 30 Göteborg.
Bourguignon, F., Chakravarty, S.R.2003. The measurement of multidimensional poverty. J.
Econ. Inequal. 1, 25-49
CSA [Central Statistical Agency] (2010). The 2007 Population and Housing Census of Ethiopia:
National Statistical Summary Report. Addis Ababa, Ethiopia
Datt Gaurav .2013.Making every dimension count: multidimensional poverty without the “dual
cut off” Monash university department of economics.ISSN 1441-5429., discussion paper 32/13
Decancq k, Fleurbaey M., Maniquet F. 2014; Multidimensional poverty measurement with
individual preferences. Princeton University – William S. Dietrich II Economic Theory Center
Research Paper No. 058-2014
Dercon, S., D.Gilligan, J.Hoddinott and T. Woldehanna. 2009, “The impact of roads and
agricultural extension on consumption growth and poverty in fifteen Ethiopian villages,”
American Journal of Agricultural Economics 91(4): 1007-1021
EEA [Ethiopian Economics Association] (2011). Report on the Ethiopian Economy:
Development prospects and Challenges of the Energy Sector in Ethiopia. Volume VII 2007/08.
Ethiopian Economic Association. Addis Ababa.
Ferreira Francisco; Paolo Brunori ; Maria Ana Lugo.2011. Opportunity-sensitive poverty
measurement. JEL Classification: D31, D63, J62
Foster J., Greer J., Thorbecke E. 1984. A class of decomposable poverty measures.
Econometrica, Vol. 52, No. 3
Mekonnen Andualem Goshu. 2014. A single censoring Multidimensional poverty.
Ravallion Martin. 2011. On Multidimensional Indices of Poverty. The World Bank Development
Research Group. Policy Research Working Paper 5580.
Sen Amartya . 1976. Poverty: An Ordinal Approach to Measurement. Econometrica, Vol. 44,
No. 2. (Mar., 1976), pp. 219-231.
Sen Amartya . 1976. Poverty: An Ordinal Approach to Measurement. Econometrica, Vol. 44,
No. 2. (Mar., 1976), pp. 219-231.
Sen, Amartya K. (1987), The Standard of Living: The Tanner Lectures, Cambridge: Cambridge
University Press.
Sen, Amartya K. (1992), Inequality Re-examined, Oxford: Clarendon Press.
Stiglitz, J., Sen, A. K., & Fitoussi, J. P. (2009). Report of the Commission on the measurement of
economic performance and social progress . Avaiable at www.stiglitz-sen- fi toussi.fr .
Streeten P. 1981. First things: meeting basic human needs in developing countries.
Townsend. P. 1979 Poverty in the United Kingdom: A Survey of Household Resources and
Standards of Living.
Tsui, K.-Y. (2002), \Multidimensional Poverty Indices," Social Choice and Welfare, 19, 69-93
UNDP (2009). Human Development Report 2009. Overcoming barriers: Human mobility and
development. New York
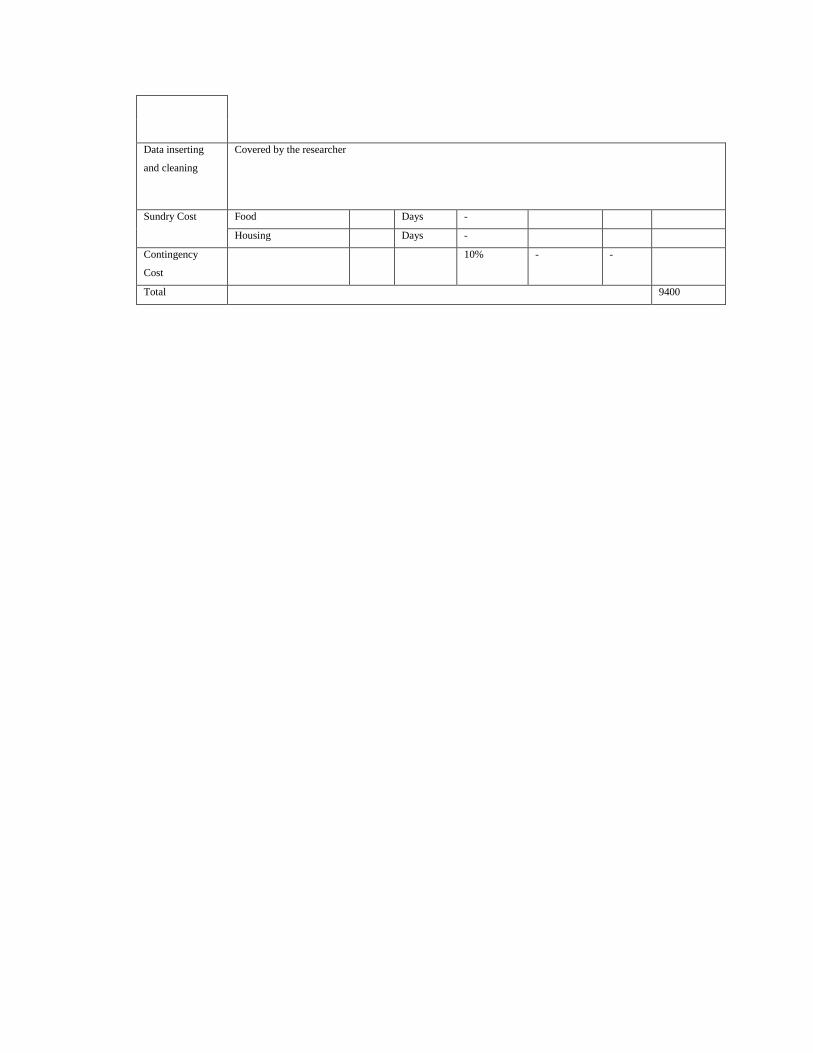
Cost Budget and Time schedule
The money to undertake this research is going to be financed by Roberto Franceschi” Research
Grants. The total sum of money will be allocated for the collection of the data. The following
table shows the amount of money and allocation of cost budget requirements.
Cost Budget
Items Unit Quantity Duration
(Per day)
Unit
cost
(In
Euro)
Total cost (In
Euro)
Data collection
costs
Travel cost from Italy to Ethiopia
for the researcher
Covered by the researcher
Travel cost within
Ethiopia
Costs for questioner
duplication in Ethiopia
240 Euro (200) will be covered by the researcher 40
Training on MPI and the
data for data collectors1
per diem
for
trainees
12 4 days 20 960
Professional Data collector 2
Area of the study Number of
Data
collectors
Addis Ababa
Trip + per
diem
3 35effective
days
20 2100
SNNP
Trip + per
diem
3 35effective
days
20 2100
Tigray Trip + per
diem
3 35effective
days
20 2100
Amhara
Trip + per
diem
3 35effective
days
20 2100
1 Cost for trainer will be financed by the researcher. The training will be given by the researcher and by Ethiopian development
research institute researchers. 2 Data collector institutions are too expensive, which are asking 50 – 70 USA Dollar per household, hence, the researcher will
employ professional data collector by traveling to Ethiopia.
The researcher has supposed to go to Ethiopia to organize the training for data collectors and to coordinate the data collection
process. Twelve data collectors will be employed to collect the data in four regions. Before the beginning of the data collection
training will be given to data collectors about social exclusion, Multidimensional poverty, data collection rules and techniques
and detail explanation about the questioners.
Data inserting
and cleaning
Covered by the researcher
Sundry Cost
Food Days -
Housing Days -
Contingency
Cost
10% - -
Total 9400
Time schedule: The study is planned to be completed by the end of Sept, 2015. The time will be allocated for different phases of
the research project.
No Activity Time allocation
Jan Feb Mar. Apr. May June July Sep Oct Nov Dec
1 2 3 4 1 2 3 4 1 2 3 4 1 2 3 4 1 2 3 4
1 Literatures
Search Completed
2 Research
Methodology Completed
3 Questionnaire
design √ √ √ √ √
Preparation for
Data Collection and
training about
MPI
√ √ √ √ √
4 Data
Collection
√ √ √ √ √ √ √ √ √
Data inserting and
cleaning √ √ √ √ √ √ √ √
4 Data
Analysis
√ √ √
6 Presentation and
submission
√