\\ ROBUST DEFECT SEGMENTATION IN WOVEN FABRICS* Hamed Sari-Sarraf and James S. Goddard, JE Oak Ridge National Laboratory c \ Technical Categories: Applications Low-Level Vision, Color & Texture Segmentation Corresponding Author : Hamed Sari-Sarraf, Ph.D. Oak Ridge National Laboratory P.O. Box 2008 Oak Ridge, Tennessee, 37831-6011 Phone: 423-574-5542 Fax: 423-574-6663 E-mail: [email protected]DISTRIBUTION OF THIS DOCUMENT IS UNLL)dmD k * Supported under the AMTEX Cooperative Research and Development Agreement at the Oak Ridge National Laboratory, managed by Lockheed Martin Energy Research Corporation for the U.S. Department of Energy under contract DE-ACOS-960R22464. ?
Transcript
\ \
ROBUST DEFECT SEGMENTATION IN WOVEN FABRICS*
Hamed Sari-Sarraf and James S. Goddard, JE Oak Ridge National Laboratory
c \
Technical Categories:
Applications Low-Level Vision, Color & Texture
Segmentation
Corresponding Author :
Hamed Sari-Sarraf, Ph.D. Oak Ridge National Laboratory
Supported under the AMTEX Cooperative Research and Development Agreement at the Oak Ridge National Laboratory, managed by Lockheed Martin Energy Research Corporation for the U.S. Department of Energy under contract DE-ACOS-960R22464.
This report was prepared as an account of work sponsored by an agency of the United States Government Neither the United States Government nor any agency thereof, nor any of their employee, makes any warranty, express or implied, or assumes any lcgal liability or responsibility for the accuracy, completeness, or use- fulness of any infomation, apparatus, pmduct. or process disclosed, or represents that its w would not infringe privately owned rights. Reference herein to any spe- S i c commercial product, process, or service by trade name, trademark, manufac- turn, or othemise docs not necessarily constitute or imply its endorsement, recorn- mcnd;rtion, or favoring by the United States Government or any agency thereof. The views and opinions of authors c x p d herein do not necessarily state or reflect those of the United States Government or.any agency thereof.
ROBUST DEFECT SEGMENTATION IN WOVEN FABRICS
Abstract
This paper describes a robust segmentation algorithm for the detection and localization of woven fabric defects. The essence of the presented segmentation algorithm is the localization of those events (i.e., defects) in the input images that disrupt the global homogeneity of the back- ground texture. To this end, preprocessing modules, based on the wavelet transform and edge fusion, are employed with the objective of attenuating the background texture and accentuating the defects. Then, texture fea- tures are utilized to measure the global homogeneity of the output images. If these images are deemed to be globally nonhomogenous (i. e,, defects are present), a local rough- ness measure is used to localize the defects. The utility of this algorithm can be extended beyond the spec@ appli- cation in our work, that is, defect segmentation in woven fabrics. Indeed, in a general sense, this algorithm can be used to detect and to localize anomalies that reside in images characterized by ordered texture. The eflcacy of this algorithm has been tested thoroughly under realistic conditions and as a part of an on-line fabric inspection system. Using over 3700 images of fabrics, containing 26 different ppes of defects, the overall detection rate of our approach was 89% with a localization accuracy of less than 0.2 inches and a false alarm rate of 2.5%.
1. Introduction
Measurement of quality during the production of woven fabrics is highly important to the textile industry in lowering costs and improving the finished product. Pres- ently, much of the fabric inspection is performed manually by human inspectors, using off-line stations. Many defects are missed, and the inspection can be inconsistent depend- ing on the training and the skill level of the personnel. As a result, the textile industry has been moving towards auto- mated fabric inspection. Up to this point, most, if not all such automated technologies have been off-line, inspect- ing large rolls of fabric after it has been produced. To pro- vide the most precise control of quality, however, the fabric is required to be monitored as it is constructed, so that corrections can be made immediately, minimizing the quantity of poor-quality fabric. Higher production speeds make the timely detection of defects more important than ever. With inspection on the machine, the need for 100% manual inspection is eliminated. In addition, a computer vision-based system provides consistent inspection results
that correlate with today’s quality control standards. A wide variety of fabric defects can occur during the
weaving process. Many are due to machine malfunctions while others are because of faulty yarns. For air-jet looms, which are most widely used, the predominant defects are broken picks (mispicks) and slubs. These, and other less widely used looms, can have machine faults that produce additional defects, such as holes, oil spots, or dirt. These assorted defects can produce a wide range of visible effects on the finished fabric. Warp or fill defects tend to be long and narrow, dubs or lint can produce point defects, and barre defects change the texture of the weav- ing pattern. It is interesting to note that the majority of commonly-occurring defects have a preferred orientation, either in the direction of motion (Le., warp direction) or perpendicular to it (i.e., pick direction).
Automation of fabric inspection has been a topic of considerable research. The inspection systems are pre- dominantly optically based and primarily use either line- scan [l-31 or area [4] CCD sensors for image acquisition. Complete real-time systems have been developed that emphasize the high-performance image acquisition and computing hardware requirements for discrete defect detection and classification [5,6]. Also widely reported, are the image analysis methodologies, including those based on textural models for defect detection [7,8], as well as neural or knowledge-based techniques for defect classi- fication [9-111. A real-time defect detection system using the wavelet transform and fuzzy inferencing has also been described in [4,12].
The fabric inspection system, developed by the authors in early 1995 (patent pending), differs from existing sys- tems in two crucial ways. First, it is on-line or on-loom, and secondly, it is equipped with a robust defect segmenta- tion technique, which is thoroughly tested under realistic conditions and is found to have a high detection rate, high accuracy, and a low rate of false alarms. The results of comparable tests have yet to be reported for the competing systems or segmentation algorithms. Conceptually, how- ever, one reported segmentation technique [ 121 takes our idea of preprocessing the fabric images using the wavelet transform to an interesting level by suggesting an optimal derivation of the wavelet bases.
In what follows, we describe the proposed segmenta- tion technique in detail and illustrate its efficacy with real images of fabric.
In this section, a detailed description of the defect seg- mentation algorithm is presented; see Fig. 1. It should be noted that the utility of this algorithm can be extended beyond the specific application in our work (Le., defect segmentation in woven fabrics). Indeed, in a general sense, this algorithm can be used to detect and to localize anomalies that reside in images characterized by ordered texture, given that two conditions are satisfied:
1. anomalies exhibit low intensity variation within their
2. relative to the textured background, they constitute a
The essence of the presented segmentation algorithm is to localize those events (i.e., defects) in the image that dis- rupt the global homogeneity of the background texture.
In what follows, the modules of the segmentation algo- rithm in Fig. 1 are described and their efficacy are demon- strated using real images of fabric.
2.1. Wavelet Transform Module
boundary, and
small portion of the field of view.
The wavelet transform module in the proposed segmen- tation algorithm constitutes a preprocissing step with the objectives of attenuating the background texture and
Figure 1. Flowchart for the proposed defect segmentation algorithm.
accentuating the defects. By wavelet transform, we are in fact referring to a spe-
cific class of the 2-D discrete wavelet transform called the multiscale wavelet representation (MSWAR) [ 131. The notable advantages of MSWAR over the standard discrete wavelet transform, popularized by Mallet [ 141, are its shift invariance, as well as the fact that in MSWAR, the trans- formed signals (or images) remain at full resolution with every iteration. These properties are important when the ultimate goal is the classification of segmented events, because loss of resolution compromises the accuracy with which feature extraction is conducted.
The MSWAR of a 2-D discrete image f(x, y) , (x, y) = 1, 2 , ..., N , with M levels of scale reduction is a set of ( 3 M + I ) images. These are the detail images at all levels of scale reduction, that is, for j = 1 , 2 ,..., M ,
fil(x, y) (contains no vertical edges), f:,(x, y) (contains no horizontal edges), &(x, y) (contains no horizontal or vertical edges),
plus the blurred version of f ( x , y ) at the lowest scale level, f M ( x , y ) . An efficient algorithm for the generation of these images has been devised [ 131, and is given below for easy reference.
1. Given a low-pass and a high-pass filter, and assuming that these filters are represented as column vectors LP and H P , respectively, generate four 2-D kernels as follows:
LP(LP)' , HP(LP)' , LP(HP)' , H P ( H P ) ' , where (.)' represents vector transposition.
2.For j = 1 , 2 ,..., M , 3.Forx = 0 , I ,..., N - I , 4.Fory = 0,1, ..., N - I , 5 . Allocate u row pointers, p o , p i , . . ., p u - I , and u col-
umn pointers qo, ql, ..., q U - / , where i~ indicates the support of the selected filters.
6. Initialize the above pointers as follows:
pi) = x, PI = p 0 + 2 J - ' , ..., p a - / = p U W 2 + 2'-', and
qo = y, q1 = q , , + 2 ' - 1 , ..., + 2j-1
411-1 = q u - 2
7. Convolve the generated kernels with the elements of the signal f'-', where f" = f ( x , y) , as addressed by the above pointers. The results are the (x, y) 'h ele- ments of the four output signals f', f i I , fiz, and fi,< , respectively.
8. Next y .
9. Next x . 10. Next j .
the following fusion formula:
(1) 4x9 Y ) = {ff + f 2 + f 3 1 - The choice of the above-mentioned low-pass and high- { [fl x f 2 l + C f f x f 3 l + If2 x f311 ,
pass filters is application-dependent. Thus far in this work, we have utilized Daubechies' filters [ 151 for their compact where support and orthogonality. As reported in [ 121, other filters can also be derived in an optimal fashion to match the background texture of a given fabric image. An example of the application of the above algorithm for the genera- tion of MSWAR of a fabric image is shown in Fig. 2.
Recall that the objectives in employing the MSWAR are to attenuate (in a scale-dependent fashion) the back- ground texture and to accentuate the defects. The question is: at what scale level and for which detail image are these objectives met. In other words, for the example in Fig. 2, how can the image representing f if be selected automati- cally for further processing. The appropriate choice of j is strongly dependent on the choice of filters for MSWAR, as well as the resolution (i.e., number of pixels per unit area) of the captured images. Fortunately, such information is almost always available. The choice of the appropriate detail image, on the other hand, depends on information that is seldom, if ever, available a priori (e.g., defect orien- tation). This is the reason for the utilization of the edge (detail image) fusion module, which will be described next.
2.2. Edge Fusion & Signal Conditioning Modules
As mentioned above, the edge fusion module is to pro- duce an output, o(x, y) , in which for a preselected j , the pixels in the detail images that correspond to the defects are fully preserved. Although there are numerous ways in which this can be accomplished, we have chosen to utilize
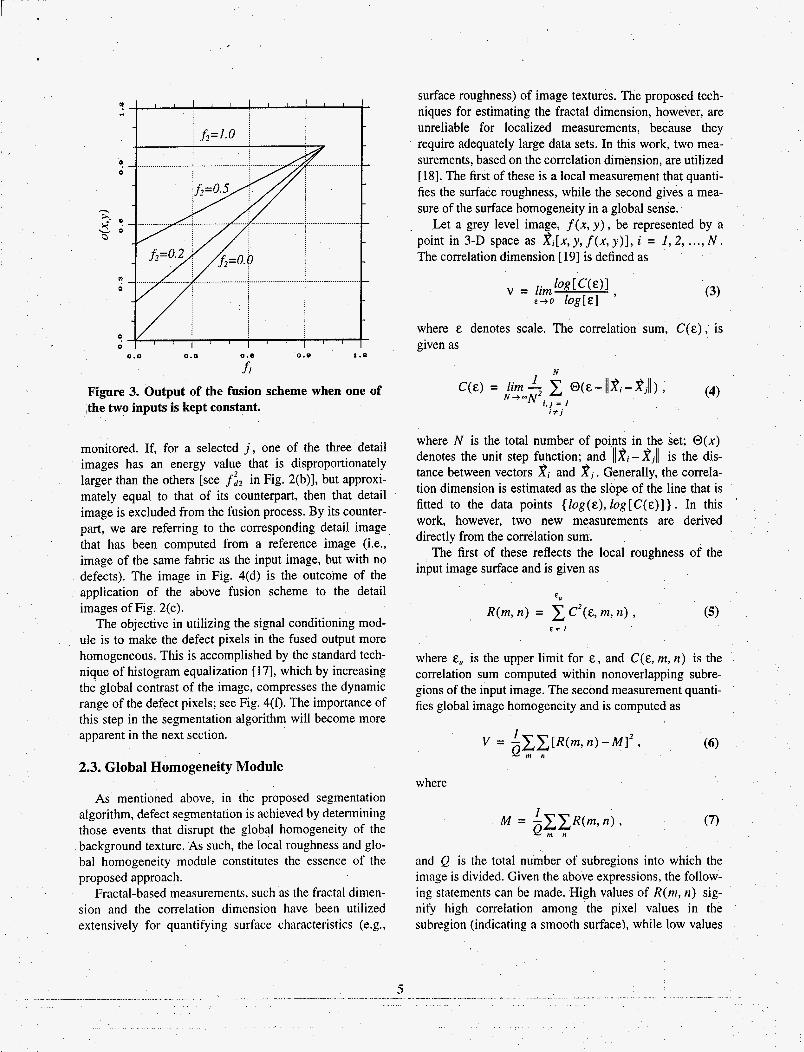
for i = I , 2 , 3 . Note that fl E [0, I ] and that it is com- puted for a selected value of j . To better understand the behavior of this fusion scheme, it is useful to examine it in a simpler form. This form, which is obtained by setting f3 = 0 in Equ. 1 , is known as Bernoulli's rule of combi- nation, and is often used to fuse two inputs [16]. It is observed that in this form, for f2 = constant, the map- ping from fl to o(x, y) is linear with slope= 1 -constant and y-intercept = constant ; see Fig. 3. Note that the fused output tends to follow one of the inputs closely, if the other input possesses low val- ues. On the other hand, the input with very high values tends to dominate the output, regardless of the value of the other input. This is precisely what is needed in our appli- cation, because defects in the detail images are repre- sented by high values.
An important issue that must be taken into account is that high values in the detail images represent not only the defects, but also the background texture. Therefore, unconstrained inclusion of all pixels (from all three detail images) in the fusion process, will not result in back- ground attenuation. To address this issue, we have con- strained the fusion process as follows. Because the input image is assumed to be dominated by the background tex- ture (rather than defect), the energy (sum of squared val- ues) for each of the detail images is computed and
Figure 2. (a) An image of a fabric with a pick defect &e., the dark streak). (b), (c), (d) MSWAR of the image in (a) for j = 1 , 2 , 3 , respectively. Starting with the top, left-hand corner and moving clockwise, the output images in (b), (c), and (d) correspond to f', f://, fig, and fiIz .
monitored. If, for a selected j , one of the three detail images has an energy value that is disproportionately larger than the others [see f:, in Fig. 2(b)], but approxi- mately equal to that of its counterpart, then that detail image is excluded from the fusion process. By its counter- part, we are referring to the corresponding detail image that has been computed from a reference image (Le., image of the same fabric as the input image, but with no defects). The image in Fig. 4(d) is the outcome of the application of the above fusion scheme to the detail images of Fig. 2(c).
The objective in utilizing the signal conditioning mod- ule is to make the defect pixels in the fused output more homogeneous. This is accomplished by the standard tech- nique of histogram equalization [ 171, which by increasing the global contrast of the image, compresses the dynamic range of the defect pixels; see Fig. 4(f). The importance of this step in the segmentation algorithm will become more apparent in the next section.
niques for estimating the fractal dimension, however, are unreliable for localized measurements, because they
2.3. Global Homogeneity Module
As mentioned above, in the proposed segmentation algorithm, defect segmentation is achieved by determining those events that disrupt the global homogeneity of the background texture. As such, the local roughness and glo- bal homogeneity module constitutes the essence of the proposed approach.
Fractal-based measurements, such as the fractal dimen- sion and the correlation dimension have been utilized extensively for quantifying surface characteristics (e.g.,
where N is the total number of points in the set; @(x) denotes the unit step function; and 11% - 2,ll is the dis- tance between vectors fti and 2j. Generally, the correla- tion dimension is estimated as the slope of the line that is fitted to the data points (log(&), log[C(&)]). In this work, however, two new measurements are derived directly from the correlation sum.
The first of these reflects the local roughness of the input image surface and is given as
where E,, is the upper limit for E , and C(E, m, n ) is the correlation sum computed within nonoverlapping subre- gions of the input image. The second measurement quanti- fies global image homogeneity and is computed as
where
(7)
and Q is the total number of subregions into which the image is divided. Given the above expressions, the follow- ing statements can be made. High values of R(m, n ) sig- nify high correlation among the pixel values in the subregion (indicating a smooth surface), while low values
(b) ( 4 (0 (h)
Figure 4. (a), (b) Images of fabric without and with a defect, respectively. (c)-(h) Outputs of the various modules in the segmentation algorithm. See text for details.
of R(m, n ) indicate a rough surface. Furthermore, small values of V (i.e., surface is either mainly rough or mainly smooth) denote a globally homogeneous image.
By applying the local roughness and global homogene- ity measures to the output of MSWAR (specifically, the fused detail images), one can robustly detect and localize anomalies in the presence of texture. To illustrate this point, consider the images in Fig. 4. The input images in Figs. 4(a) and 4(b) are of the same fabric, but the latter image contains a pick defect (Le., the dark streak'. The fused detail images are shown in Figs. 4(c) and J(d), respectively. Comparing this pair of images with the input pair demonstrates the utility of the previously described preprocessing modules, that is, scale-dependent attenua- tion of the background texture and accentuation of the defect. Figures 4(e) and 4(f) depict the conditioned out- puts, while the images in Figs. 4(g) and 4(h) represent R(m, n ) for each of the inputs. Note that on the one hand, the local roughness measure for the fabric with no defects exhibits a random pattern [Fig. 4(g)], while on the other hand. the same measure localizes the defect as an event with highly correlated pixels [Fig. 4(h)]. Furthermore, a comparison of the global homogeneity measures for the two fabrics (i.e., 58.1 for the fabric with the defect versus 1 .1 for the one without) gives a clear indication of the presence of the defect. Significant, often an order of mag-
nitude, difference between the values of indicates the a threshold, T , can be established to robustly detect the presence or absence of defects. This threshold value is selected empirically by observing typical values of V for defect-free fabrics.
2.4. Thresholding & Blob Analysis Modules
If the computed global homogeneity measure happens to fall below T , the input image is deemed to be defect- free, and the segmentation is initialized .with the next image frame. If, however, one or more defects are detected (i.e., V > T ), the corresponding R(m, n ) is binarized by employing an automatic thresholding technique. The choice of a thresholding technique is not at all crucial, because large V ' s indicate not only the presence of defects, but also the fact that the values corresponding to defects are vastly different from those corresponding to background. So far in this work, we have employed Otsu's approach [20], which aims to minimize the weighted sum of group variances. Although this approach has produced favorable results, the reader is recommended to explore other techniques in which the discrepancy between the number of defect pixels and that of the background pixels is taken into account, e.g., [21].
Following the binarization of R(m, n ) , the output
6 ... --. _. ~ ... ... ... . . .. . . .~
. image undergoes connected component analysis. For this, we have utilized one of the many widely available blob analysis techniques, specifically, the two-pass technique presented in [17]. T h ~ s module is the gateway to feature extraction and classification.
3. Results
The efficacy of the described segmentation algorithm has been tested thoroughly under realistic conditions and as a part of an on-line fabric inspection system (patent pending). Over 3700 images of fabrics constructed with filament as well as spun yarn, containing 26 different types of defects were subjected to the proposed algorithm.
The overall detection rate of our approach was 89% with a localization accuracy of less than 0.2 inches and a false alarm rate of 2.5%. The false alarm rate is computed as the total number of false detections divided by the total num- ber of processed images.
It should be noted that the detection rate of the segmen- tation algorithm for the most commonly occurring and the most serious defects, such as mispicks, end-outs, and slubs, was 100%; see Fig. 5 for examples.
4. Conclusions
We have presented a robust segmentation algorithm for the detection and localization of woven fabric defects.
Figure 5. (a), (b), (c) Fabric images with mispick, end-out, and slub defects, respectively; with the corresponding fused outputs in (d), (e), and (f); R(nr, 1 1 ) ‘s in (g), (h), and (i); and the thresholded results in (j), (k), and (I).
. . ... . -. .. .. - ,.. . . . . 7
I .
This algorithm is a part of an overall vision system, which was developed by the authors in early 1995 as the very first on-loom fabric inspection system. The essence of the presented segmentation algorithm is the localization of those defects in the input images that disrupt the global homogeneity of the background texture. To accomplish this, a wavelet-based preprocessing module is employed that attenuates the background texture and accentuates the defects. Novel texture features are utilized to measure the global homogeneity of the output images. The efficacy of this algorithm was tested thoroughly under realistic condi- tions with over 3700 images of fabrics, containing 26 dif- ferent types of defects. The overall detection rate of our approach was 89% with a localization accuracy of less than 0.2 inches and a false alarm rate of 2.5%.
5. References
[ l ] J. Huart and J. G. Postaire, “Integration of computer vision onto weavers for quality control in the textile industry,” Proc. of SPIE Machine Vision Applications in Industrial Inspection 11, pp. 155-163, 1994.
[2] B. W. Crowley, “Application of one-dimensional machine vision in the textile industry,” IEEE Trans. on Industry Applications 26(2), 324-329, March- April 1990.
[3] J. Laitinen and I. Moring, “Method for evaluation of imaging in automated visual web inspection,” Optical Engineering 36(8), 2184-2196, August 1997.
[4] J. L. Dorrity, G. Vachtsevanos, and W. Jasper, “Real- time fabric defect detection and control in weaving processes,” National Textile Center Annual Report, pp. 113-122, November 1996.
[5] S. Karkanis, C. Metaxaki-Kossionides, and B. Dimi- triadis, “Machine-vision quality inspection system for textile industries supported by parallel multitransputer architecture,” Microprocessing and Microprogram- ming 28( 1), 247-252, March 1990.
[6] I. Erenyi and J. Pongracz, “Quality control in textile industry via machine vision,” Microprocessing and Microprogramming 32(1), 807-813, August 1991.
[7] T. Thieny and M. Cattoen, “Automatic inspection of simply patterned material in the textile industry,” Proc. of SPIE Macliine Vision Applications in Indus- trial Inspection II, pp. 2- 12, 1994.
[8] E S. Cohen, Z. Fan. and S. Attali, “Automated inspec- tion of textile fabrics using textural models,” IEEE Trans. on Pattern Analysis and Machine Intelligence
[9] K. Srinivasan, P. H. Dastoor, P. Radhakrishnaiah, and 13(8), 803-808, August 1991.
S. Jayaraman, “FDAS. A knowledge-based frame- work for analysis of defects in woven textile struc- tures,” Journal of the Textile Institute 83(3), 431-448, 1992.
[ 101 S. Sardy and L. Ibrahim, “Experimental medical and industrial applications of neural networks to image inspection using an inexpensive personal computer,” Optical Engineering 38(8), 2182-2187, August 1996.
[11]L. M. Hoffer, E Francini, B. Tiribilli, and G. Lon- gobardi, “Neural networks for the optical recognition of defects in cloth,” Optical Engineering 35( 1 1), 3183-3190, November 1996.
121 W. J. Jasper, S . J. Gamier, and H. Potlapalli, “Texture Characterization and Defect Detection Using Adap- tive Wavelets,” Optical Engineering 35(1 I), 3140- 3149, November 1996.
131H. Sari-Sarraf and D. Brzakovic, “A Shift Invariant Discrete Wavelet Transform,” IEEE Trans. on Signal Processing 45(10), 2621-2626, October 1997.
[14]S. G. Mallat, “A Theory for Multiresolution Signal Decomposition: The Wavelet Representation,” IEEE Trans. on Pattern Analysis and Machine Intelligence 11(7), 674-693, july 1989.
[ 151 I. Daubechies, “Orthogonal Bases of Compactly Sup- ported Wavelets,” Comm. Pure and Appl. Math 41,
[ 161 M. B. Abdulghafour, “Data Fusion Through Fuzzy Reasoning Applied to Feature Extraction from Multi- Sensory Images,” pp. 189- 190, Ph.D. Dissertation, The University of Tennessee, December 1992.
[ 171 R. C. Gonzalez and R. E. Woods, Digital Image Pro- cessing, Addison-Wesley Publishing Company, New York, 1993.
[ 181 D. Brzakovic and H. Sari-Sarraf, “Automated Inspec- tion of Nonwoven Web Materials: A Case Study,” Proc. of SPIE’s Symposium on Electronic Imaging, San Jose, CA, February 1994.
[ 191 P. Grassberger and I. Procaccia, “Characterization of Strange Attractors,” Phys. Rev. Letters 50(5), 346- 349, 1983.
[20] N. Otsu, “A Threshold Selection Method from Gray- Level Histograms,” IEEE Trans. on Systems, Man, and Cybernetics 9,62-66, 1979.
[21] J. Kittler and J. Illingworth, “On Thresholding Selec- tion Using Clustering Criteria,” IEEE Trans. on Sys- tems, Man, and Cybernetics 15,652-655, 1985.


![Robust Statistical Estimation and Segmentation of …cs294-6/fa06/papers/RANSAC25-Yang-A… · Robust Statistical Estimation and Segmentation of Multiple Subspaces ... [5,16,34].](https://static.documents.pub/doc/80x56/5ad8473b7f8b9a991b8d1c81/robust-statistical-estimation-and-segmentation-of-cs294-6fa06papersransac25-yang-arobust.jpg)


