30
Robust Regression and Outlier Detection

Robust Regression and Outlier Detection

This Page Intentionally Left Blank
WILEY SERIES IN PROBABILITY AND MATHEMATXCAL STATISTICS
ESTABLISHED BY WALTER A. SHEWHART AND SAMUEL S. WILKS Editors Vic Barnett, Ralph A . Bradley, J . Stuart Hunter, David G. KendaN, Rupert G . Miller, Jr., Adrian F. M . Smith, Stephen M. Stigler, Geofrey S. Watson
ADLER The Geometry of Random Fields ANDERSON The Statistical Analysis of Time Series ANDERSON An Introduction to Multivariate Statistical Analysis,
ARNOLD The Theory of Linear Models and Multivariate Analysis BARNETT Comparative Statistical Inference, Second Edition BHATTACHARYYA and JOHNSON Statistical Concepts and Methods BILLINGSLEY Probability and Measure, Second Edition BOROVKOV Asymptotic Methods in Queuing Theory BOSE and MANVEL Introduction to Combinatorial Theory CASSEL, SARNDAL, and WRETMAN Foundations of Inference in
CHEN Recursive Estimation and Control for Stochastic Systems COCHRAN Contributions to Statistics COCHRAN Planning and Analysis of Observational Studies CONSTANTINE Combinatorial Theory and Statistical Design DOOB Stochastic Processes DUDEWlCZ and MISHRA Modem Mathematical Statistics EATON Multivariate Statistics: A Vector Space Approach ETHIER and KURT2 Markov Processes: Characterization and
Convergence FABIAN and HANNAN Introduction to Probability and
Mathematical Statistics FELLER An Introduction to Probability Theory and Its Applications,
Volume I, Third Edition, Revised; Volume 11, Second Edition FULLER - Introduction to Statistical Time Series FULLER * Measurement Error Models GRENANDER Abstract Inference GUTTMAN Linear Models: An Introduction HAMPEL, RONCHETTI, ROUSSEEUW, and STAHEL Robust
HANNAN - Multiple Time Series HARRISON Brownian Motion and Stochastic Flow Systems HETTMANSPERGER Statistical Inference Based on Ranks HOEL Introduction to Mathematical Statistics, Fifth Edition HUBER Robust Statistics IMAN and CONOVER A Modem Approach to Statistics IOSIFESCU Finite Markov Processes and Applications JOHNSON and BHATTACHARYYA 0 . Statistics: Principles and Methods,
LAHA and ROHATGI Probability Theory LARSON Introduction to Probabilitv Theory and Statistical Inference,
Probability and Mathematical Statistics
Second Edition
Survey Sampling
Statistics: The Approach Based on Influence Functions
Revised Printing
Third Edition LEHMANN Testing Statistical Hypotheses, Second Edition LEHMANN Theory of Point Estimation MATTHES, KERSTAN, and MECKE Infinitely Divisible Point Processes MUIRHEAD Aspects of Multivariate Statistical Theory PURI and SEN Nonparametric Methods in General Linear Models PURI and SEN Nonparametric Methods in Multivariate Analysis
Probability and Mathematical Statistics (Continued) PURI, VILAPLANA, and WERTZ New Perspectives in Theoretical and
RANDLES and WOLFE - Introduction to the Theory of Nonparametric
RAO Linear Statistical Inference and Its Applications, Second Edition RAO Real and Stochastic Analysis RAO and SEDRANSK W.G. Cochran’s Impact on Statistics RAO Asymptotic Theory of Statistical Inference ROHATGI - An Introduction to Probability Theory and Mathematical
ROHATGI - Statistical Inference ROSS Stochastic Processes RUBINSTEIN Simulation and The Monte Carlo Method SCHEFFE - The Analysis of Variance SEBER Linear Regression Analysis SEBER * Multivariate Observations SEN Sequential Nonparametrics: Invariance Principles and Statistical
SERFLING Approximation Theorems of Mathematical Statistics SHORACK and WELLNER Empirical Processes with Applications to
TJUR - Probability Based on Radon Measures ROGERS and WILLIAMS Diffusions, Markov Processes, and Martingales,
Applied Statistics
Statistics
Statistics
Inference
Statistics
Volume 11: It6 Calculus
Applied Probabiliry and Stutistics ABRAHAM and LEDOLTER Statistical Methods for Forecasting AGRESTI Analysis of Ordinal Categorical Data AICKIN Linear Statistical Analysis of Discrete Data ANDERSON and LOYNES The Teaching of Practical Statistics ANDERSON, AUQUIER, HAUCK, OAKES, VANDAELE, and
ARTHANARI and DODGE Mathematical Programming in Statistics ASMUSSEN Applied Probability and Queues BAILEY The Elements of Stochastic Processes with Applications to the
BAILEY Mathematics, Statistics and Systems for Health BARNETT Interpreting Multivariate Data BARNETT and LEWIS Outliers in Statistical Data, Second Edition BARTHOLOMEW Stochastic Models for Social Processes, Third Edition BARTHOLOMEW and FORBES Statistical Techniques for Manpower
BECK and ARNOLD Parameter Estimation in Engineering and Science BELSLEY, KUH, and WELSCH Regression Diagnostics: Identifying
BHAT Elements of Applied Stochastic Processes, Second Edition BLOOMFIELD Fourier Analysis of Time Series: An Introduction BOX R. A. Fisher, The Life of a Scientist BOX and DRAPER Empirical Model-Building and Response Surfaces BOX and DRAPER Evolutionary Operation: A statistical Method for
BOX, HUNTER, and HUNTER Statistics for Experimenters: An
BROWN and HOLLANDER Statistics: A Biomedical Introduction BWNKE and BUNKE Statistical Inference in Linear Models, Volume I CHAMBERS Computational Methods for Data Analysis CHATTERJEE and PRICE Regression Analysis by Example CHOW - Econometric Analysis by Control Methods CLARKE and DISNEY Probability and Random Processes: A First
COCHRAN Sampling Techniques, Third Edition COCHRAN and COX Experimental Designs, Second Edition CONOVER Practical Nonparametric Statistics, Second Edition
-
WEISBERG Statistical Methods for Comparative Studies
Natural Sciences
Planning
Influential Data and Sources of Collinearity
Process Improvement
Introduction to Design, Data Analysis, and Model Building
Course with Applications, Second Edition
Applied Probability and Statistics (Continued) CONOVER and IMAN Introduction to Modem Business Statistics CORNELL Experiments with Mixtures: Designs, Models and The Analysis
COX Planning of Experiments COX A Handbook of Introductory Statistical Methods DANIEL - Biostatistics: A Foundation for Analysis in the Health Sciences,
DANIEL 0 Applications of Statistics to Industrial Experimentation DANIEL and WOOD Fitting Equations to Data: Computer Analysis of
DAVID Order Statistics, Second Edition DAVISON Multidimensional Scaling DEGROOT, FIENBERG and KADANE Statistics and the Law DEMING Sample Design in Business Research DILLON and GOLDSTEIN Multivariate Analysis: Methods and
DODGE - Analysis of Experiments with Missing Data DODGE and ROMIG Sampling Inspection Tables, Second Edition DOWDY and WEARDEN Statistics for Research DRAPER and SMITH Applied Regression Analysis, Second Edition DUNN 0 Basic Statistics: A Primer for the Biomedical Sciences, Second
DUNN and CLARK Applied Statistics: Analysis of Variance and
ELANDT-JOHNSON and JOHNSON Survival Models and Data Analysis FLEISS Statistical Methods for Rates and Proportions, Second Edition FLEISS The Design and Analysis of Clinical Experiments FOX Linear Statistical Models and Related Methods FRANKEN, KONIG, ARNDT. and SCHMIDT Queues and Point
GALLANT Nonlinear Statistical Models GIBBONS, OLKIN, and SOBEL Selecting and Ordering Populations: A
GNANADESIKAN Methods for Statistical Data Analysis of Multivariate
GREENBERG and WEBSTER Advanced Econometrics: A Bridge to the
GROSS and HARRIS Fundamentals of Queueing Theory, Second Edition GUPTA and PANCHAPAKESAN Multiple Decision Procedures: Theory
and Methodology of Selecting and Ranking Populations GUTTMAN, WILKS, and HUNTER - Introductory Engineering Statistics,
Third Edition HAHN and SHAPIRO Statistical Models in Engineering HALD Statistical Tables and Formulas HALD - Statistical Theory with Engineering Applications HAND Discrimination and Classifidion HOAGLIN, MOSTELLER and TUKEY Exploring Data Tables, Trends
HOAGLIN, MOSTELLER, and TUKEY Understanding Robust and
HOCHBERG and TAMHANE Multiple Comparison Procedures HOEL Elementary Statistics, Fourth Edition HOEL and JESSEN Basic Statistics for Business and Economics, Third
HOGG and KLUGMAN - Loss Distributions HOLLANDER and WOLFE Nonparametric Statistical Methods IMAN and CONOVER Modem Business Statistics JESSEN 0 Statistical Survey Techniques JOHNSON 0 Multivariate Statistical Simulation JOHNSON and KOTZ Distributions in Statistics
Discrete Distributions
of Mixture Data
Fourth Edition
Multifactor Data, Second Edition
Applications
Edition
Regression, Second Edition
Processes
New Statistical Methodology
Observations
Literature
and Shapes
Exploratory Data Analysis
Edition
(continued on back)

This Page Intentionally Left Blank

Robust Regression and Outlier Detection

This Page Intentionally Left Blank
Robust Regression and Outlier Detection
PETER J. ROUSSEEUW
Dept. of Mathematics and Computing Universitaire Instelling Antwerpen Universiteitsplein 1 B-2610 Antwerp, Belgium [email protected]
ANNICK M. LEROY
Bristol-Myers-Squibb B-1170 Brussels, Belgium
JOHN WILEY & SONS
New York 0 Chichester 0 Brisbane 0 Toronto 0 Singapore
A NOTE TO THE READER: Tlus book has been electronically reproduced from digital information stored at John Wdey & Sons, Inc. We are pleased that the use of this new technology will enable us to keep works of enduring scholarly value in print as long as there is a reasonable demand for them. The content of t h i s book is identical to previous printings.
Copyright @ 1987 by John Wiley & Sons, Inc.
All rights reserved. Published simultaneously in Canada.
Reproduction or translation of any part of this work beyond that permitted by Section 107 or 108 of the 1976 United States Copyright Act without the permission of the copyright owner is unlawful. Requests for permission or further information should be addressed to the Permissions Department, John Wiley & Sons, Inc.
Librmp of Congress Ccr*Joging in Pub&&n Du&:
Rousseeuw, Peter J. Robust regression and outlier detection.
(Wiley series in probability and mathematical statistics. Applied probability and statistics, ISSN 0271-6356)
Bibliography: p. Includes index. 1. Regression analysis. 2. Outliers (Statistics)
3. Least squares. I. Leroy, Annick M. 11. Title. 111. Series. QA278.2.R68 1987 519.5'36 87-8234 ISBN 0471-85233-3
Printed in the United States of America
10 9

If among these errors are some which appear too large to be admissible, t h n those observations which produced these errors will be rejected, as coming from too faulty experiments, and the unknowns will be determined by means of the other observations, which will then give much smaller errors.
Legendre in 1805, in the first publication on least squares
This idea, however, from its nature, involves something vague. . . and clearly innumerable different principles can be proposed. . . . But of all these principles ours is the most simple; by the others we shall be led into the most complicated calculations.
Gauss in 1809, on the least squares criterion
The method of Least Squares is seen to be our best course when we have thrown overboard a certain portion of our data- sort of sacrifice which has often to be made by those who sail upon the stormy sea of Prob- ability.
Edgeworth in 1887
(Citations collected by Plackett 1972 and Stigler 1973, 1977.)

This Page Intentionally Left Blank

Preface
Regression analysis is an important statistical tool that is routinely applied in most sciences. Out of many possible regression techniques, the least squares (LS) method has been generally adopted because of tradition and ease of computation. However, there is presently a widespread awareness of the dangers posed by the occurrence of outliers, which may be a result of keypunch errors, misplaced decimal points, recording or transmission errors, exceptional phenomena such as earthquakes or strikes, or mem- bers of a different population slipping into the sample. Outliers occur very frequently in real data, and they often go unnoticed because now- days much data is processed by computers, without careful inspection or screening. Not only the response variable can be outlying, but also the explanatory part, leading to so-called leverage points. Both types of outliers may totally spoil an ordinary LS analysis. Often, such influential points remain hidden to the user, because they do not always show up in the usual LS residual plots. To remedy this problem, new statistical techniques have been de-
veloped that are not so easily affected by outliers. These are the robust (or resistant) methods, the results of which remain trustworthy even if a certain amount of data is contaminated. Some people think that robust regression techniques hide the outliers, but the opposite is true because the outliers are far away from the robust fit and hence can be detected by their large residuals from it, whereas the standardized residuals from ordinary LS may not expose outliers at all. The main message of this book is that robust regression is extremely useful in identifying outliers, and many examples are given where all the outliers are detected in a single blow by simply running a robust estimator.
An alternative approach to dealing with outliers in regression analysis is to construct outlier diagnostics. These are quantities computed from
vii
viii PREFACE
the data with the purpose of pinpointing influential observations, which can then be studied and corrected or deleted, followed by an LS analysis on the remaining cases. Diagnostics and robust regression have the same goal, but they proceed in the opposite order: In a diagnostic setting, one first wants to identify the outliers and then fit the good data in the classical way, whereas the robust approach first fits a regression that does justice to the majority of the data and then discovers the outliers as those points having large residuals from the robust equation. In some applica- tions, both approaches yield exactly the same result, and then the dif- ference is mostly subjective. Indeed, some people feel happy when switching to a more robust criterion, but they cannot accept the deletion of “true” observations (although many robust methods will, in effect, give the outliers zero influence), whereas others feel that it is all right to delete outliers, but they maintain that robust regression is “arbitrary” (although the combination of deleting outliers and then applying LS is itself a robust method). We are not sure whether this philosophical debate serves a useful purpose. Fortunately, some positive interaction between followers of both schools is emerging, and we hope that the gap will close. Personally we do not take an “ideological” stand, but we propose to judge each particular technique on the basis of its reliability by counting how many outliers it can deal with. For instance, we note that certain robust methods can withstand leverage points, whereas others cannot, and that some diagnostics allow us to detect multiple outliers, whereas others are easily masked.
In this book we consider methods with high breakdown point, which are able to cope with a large fraction of outliers. The “high breakdown” objective could be considered a kind of third generation in robustness theory, coming after minimax variance (Huber 1964) and the influence function (Hampel 1974). Naturally, the emphasis is on the methods we have worked on ourselves, although many other estimators are also discussed. We advocate the least median of squares method (Rousseeuw 1984) because it appeals to the intuition and is easy to use. No back- ground knowledge or choice of tuning constants are needed: You just enter the data and interpret the results. It is hoped that robust methods of this type will be incorporated into major statistical packages, which would make them easily accessible. As long as this is not yet the case, you may contact the first author (PJR) to obtain an updated version of the program PROGRESS (Program for Robust reGRESSion) used in this book. PROGRESS runs on IBM-PC and compatible machines, but the structured source code is also available to enable you to include it in your own software. (Recently, it was integrated in the ROBETH library in Lausanne and in the workstation package S-PLUS of Statistical Sciences,

PREFACE ix
Inc., P.O. Box 85625, Seattle WA 98145-1625.) The computation time is substantially higher than that of ordinary LS, but this is compensated by a much more important gain of the statistician’s time, because he or she receives the outliers on a “silver platter.” And anyway, the computation time is no greater than that of other multivariate techniques that are commonly used, such as cluster analysis or multidimensional scaling.
The primary aim of our work is to make robust regression available for everyday statistical practice. The book has been written from an applied perspective, and the technical material is concentrated in a few sections (marked with *), which may be skipped without loss of understanding. No specific prerequisites are assumed. The material has been organized for use as a textbook and has been tried out as such. Chapter 1 introduces outliers and robustness in regression. Chapter 2 is confined to simple regression for didactic reasons and to make it possible to include robust- ness considerations in an introductory statistics course not going beyond the simple regression model. Chapter 3 deals with robust multiple regression, Chapter 4 covers the special case of one-dimensional location, and Chapter 5 discusses the algorithms used. Outlier diagnostics are described in Chapter 6, and Chapter 7 is about robustness in related fields such as time series analysis and the estimation of multivariate location and covariance matrices. Chapters 1-3 and 6 could be easily incorporated in a modem course on applied regression, together with any other sections one would like to cover. It is also quite feasible to use parts of the book in courses on multivariate data analysis or time series. Every chapter contains exercises, ranging from simple questions to small data sets with clues to their analysis,
PETER J. ROUSSEEUW ANNICK M. LEROY
October 1986

This Page Intentionally Left Blank

Acknowledgments
We are grateful to David Donoho, Frank Hampel, Werner Stahel, and many other colleagues for helpful suggestions and stimulating discussions on topics covered in this book. Parts of the manuscript were read by Leon Kaufman, Doug Martin, Elvezio Ronchetti, Jos van Soest, and Bert van Zomeren. We would also like to thank Beatrice Shube and the editorial staff at John Wiley & Sons for their assistance.
We thank the authors and publishers of figures, tables, and data for permission to use the following material:
Table 1, Chapter 1; Tables 6 and 13, Chapter 2: Rousseeuw et al. (1984a), @ by North-Holland Publishing Company, Amsterdam.
Tables 1, 7, 9, and 11, Chapter 2; Tables 1, 10, 13, 16, 23, Chapter 3; Table 8, Chapter 6: @ Reprinted by permission of John Wiley & Sons, New York.
Tables 2 and 3, Chapter 2; Tables 19 and 20, Chapter 3: Rousseeuw and Yohai (1984), by permission of Springer-Verlag, New York.
Tables 4 and 10, Chapter 2: @ 1967, 1979, by permission of Academic Press, Orlando, Florida.
Table 6, Chapter 2; data of (3.1), Chapter 4: 0 Reprinted by permission of John Wiley & Sons, Chichester.
Figure 11, Chapter 2; Tables 5, 9, 22, 24, Chapter 3; data of (2.2) and Exercise 11, Chapter 4; Table 8, Chapter 6; first citation in Epigraph: By permission of the American Statistical Association, Washington, DC.
Figure 12 and Tables 5 and 12, Chapter 2: Rousseeuw et al. (1984b), 0 by D. Reidel Publishing Company, Dordrecht, Holland.
Table 2, Chapter 3: 0 1977, Addison-Wesley Publishing Company, Inc., Reading, MA.
xi

xii ACKNOWLEDGMENTS
Table 6, Chapter 3: 0 1983, Wadsworth Publishing Co., Belmont, CA Table 22, Chapter 3: Office of Naval Research, Arlington, VA. Data of Exercise 10, Chapter 4; second citation in Epigraph: 0 1908,
Third citation in Epigraph: Stigler (1977), by permission of the Institute
Figure 3, Chapter 5: By permission of B. van Zomeren (1986). Table 1, Chapter 7: By permission of Prof. Arnold Zellner, Bureau of the
Data in Exercise 15, Chapter 7: Collett (1980), by permission of the
1972, by permission of the Biometrika Trustees.
of Mathematical Statistics.
Census.
Royal Statistical Society.

Contents
1. Introduction
1. Outliers in Regression Analysis 2. The Breakdown Point and Robust Estimators Exercises and Problems
2. Simple Regression
1. Motivation 2. Computation of the Least Median of Squares Line 3. Interpretation of the Results 4. Examples 5. An Illustration of the Exact Fit Property 6. Simple Regression Through the Origin *7. Other Robust Techniques for Simple Regression Exercises and Problems
3. Multiple Regression
1. Introduction 2. Computation of Least Median of Squares Multiple
Regression 3. Examples
*4. Properties of the LMS, the LTS, and S-Estimators 5 . Relation with Projection Pursuit
*6. Other Approaches to Robust Multiple Regression Exercises and Problems
1
1 9
18
21
21 29 39 46 60 62 65 71
75
75
84 92
112 143 145 154
xiii
XiV CONTENTS
4. The Special Case of One-Dimensional Location
1. Location as a Special Case of Regression 2. The LMS and the LTS in One Dimension 3. Use of the Program PROGRESS
*4. Asymptotic Properties *5. Breakdown Points and Averaged Sensitivity Curves Exercises and Problems
5. Algorithms
1. Structure of the Algorithm Used in PROGRESS *2. Special Algorithms for Simple Regression *3. Other High-Breakdown Estimators *4. Some Simulation Results Exercises and Problems
6. Outlier Diagnostics
1. Introduction 2. The Hat Matrix and LS Residuals 3. Single-Case Diagnostics 4. Multiple-Case Diagnostics 5. Recent Developments 6. High-Breakdown Diagnostics Exercises and Problems
7. Related Statistical Techniques
1. Robust Estimation of Multivariate Location and Covariance Matrices, Including the Detection of Leverage Points
2. Robust Time Series Analysis 3. Other Techniques Exercises and Problems
References
Table of Data Sets
Index
158
158 164 174 178 183 194
197
197 204 206 208 214
216
216 217 227 234 235 237 245
248
248 273 284 288
292
311
313

Robust Regression and Outlier Detection

This Page Intentionally Left Blank
C H A P T E R 1
Introduction
1. OUTLIERS IN REGRESSION ANALYSIS
The purpose of regression analysis is to fit equations to observed vari- ables. The classical linear model assumes a relation of the type
y i = xilel + - - + xipep + ei for i = 1,. . . , n , (1.1)
where n is the sample size (number of cases). The variables xi], . . . , xip are called the explanatory variables or carriers, whereas the variable yi is called the response variable. In classical theory, the error term ei is assumed to be normally distributed with mean zero and unknown stan- dard deviation o. One then tries to estimate the vector of unknown parameters
from the data:
Variables

2 INTRODUCTION
Applying a regression estimator to such a data set yields A
r = [ ;1, where the estimates 4 are called the regression coeficients. (Vectors and matrices will be denoted by boldface throughout.) Although the actual $ are unknown, one can multiply the explanatory variables with these 4 and obtain
where f i is called the predicted or estimated value of y i . The residual ri of the ith case is the difference between what is actually observed and what is estimated:
ri = yi - yi . (1.6)
The most popular regression estimator dates back to Gauss and Legendre (see Plackett 1972 and Stigler 1981 for some historical discus- sions) and corresponds to
Minimize 2 r: . 6 i -1
The basic idea was to optimize the fit by making the residuals very small, which is accomplished by (1.7). This is the well-known least squares (LS) method, which has become the cornerstone of classical statistics. The reasons for its popularity are easy to understand: At the time of its invention (around 1800) there were no computers, and the fact that the LS estimator could be computed explicitly from the data (by means of some matrix algebra) made it the only feasible approach. Even now, most statistical packages still use the same technique because of tradition and computation speed, Also, in the one-dimensional situation the LS cnter- ion (1.7) yields the arithmetic mean of the observations, which at that time seemed to be the most reasonable location estimator. Afterwards, Gauss introduced the normal (or Gaussian) distribution as the error distribution for which LS is optimal (see the citations in Huber 1972, p. 1042, and LA Cam 1986, p. 79), yielding a beautiful mathematical theory. Since then, the combination of Gaussian assumptions and LS has become a standard mechanism for the generation of statistical techniques

OUTLIERS IN REGRESSION ANALYSIS 3
(e.g., multivariate location, analysis of variance, and minimum variance clustering).
More recently, some people began to realize that real data usually do not completely satisfy the classical assumptions, often with dramatic effects on the quality of the statistical analysis (see, e.g., Student 1927, Pearson 1931, Box 1953, and Tukey 1960).
As an illustration, let us look at the effect of outliers in the simple regression model
yi = @,xi + e, + e, (1.8)
in which the slope 0, and the intercept & are to be estimated. This is indeed a special case of (1.1) with p = 2 because one can put xil := xi and xi2 := 1 for all i = 1, . . . , n. (In general, taking a carrier identical to 1 is a standard trick used to obtain regression with a constant term.) In the simple regression model, one can make a plot of the (x i , yi), which is sometimes called a scatterplot, in order to visualize the data structure. In the general multiple regression model (1.1) with large p, this would no longer be possible, so it is better to use simple regression for illustrative purposes.
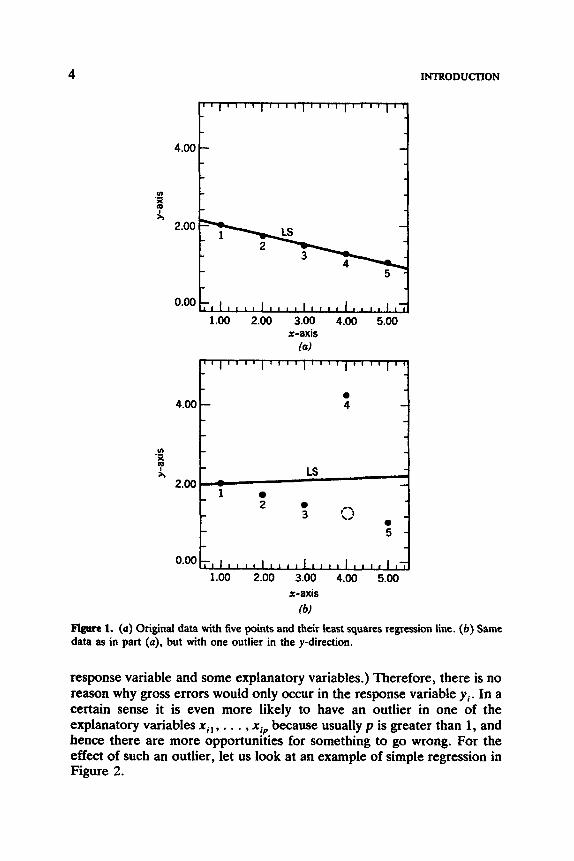
Figure 14 is the scatterplot of five points, (xl, y l ) , . . . , ( x 5 , y 5 ) , which almost lie on a straight line. Therefore, the LS solution fits the data very well, as can be seen from the LS line 9 = ilx + & in the plot. However, suppose that someone gets a wrong value of y4 because of a copying or transmission error, thus affecting, for instance, the place of the decimal point. Then (x4, y4) may be rather far away from the “ideal” line. Figure lb displays such a situation, where the fourth point has moved up and away from its original position (indicated by the dashed circle). This point is called an outlier in the y-direction, and it has a rather large influence on the LS line, which is quite different from the LS line in Figure la. This phenomenon has received some attention in the literature because one usually considers the y i as observations and the x i l , . . . , x j p as fixed numbers (which is only true when the design has been given in advance) and because such “vertical” outliers often possess large positive or large negative residuals. Indeed, in this example the fourth point lies farthest away from the straight line, so its ri given by (1.6) is suspiciously large. Even in general multiple regression (1.1) with large p , where one cannot visualize the data, such outliers can often be discovered from the list of residuals or from so-called residual plots (to be discussed in Section 4 of Chapter 2 and Section 1 of Chapter 3).
However, usually also the explanatory variables x i l , . . . , xi,, are ob- served quantities subject to random variability. (Indeed, in many applica- tions, one receives a list of variables from which one then has to choose a
4
4.00
u) .-
f
INTRODUCTION
l l , l , l l 1 1 1 1 1 1 1 , I l l 1 1 1 '
- -
-
4.00
u) x .- f
response variable and some explanatory variables.) Therefore, there is no reason why gross errors would only occur in the response variable yi. In a certain sense it is even more likely to have an outlier in one of the explanatory variables xil , . . . , xip because usually p is greater than 1, and hence there are more opportunities for something to go wrong. For the effect of such an outlier, let us look at an example of simple regression in Figure 2.
- l l , l , l l ~ r l l l ~ l , l l ~ l I l l ~ l l
0 - 4 - - - - - - LS I
2.00 - 1
2 0 3 - f> -
0 - 5 - - - O . O O ~ , ~ I I I I ~ , , , , ~ , , , , ~ I -
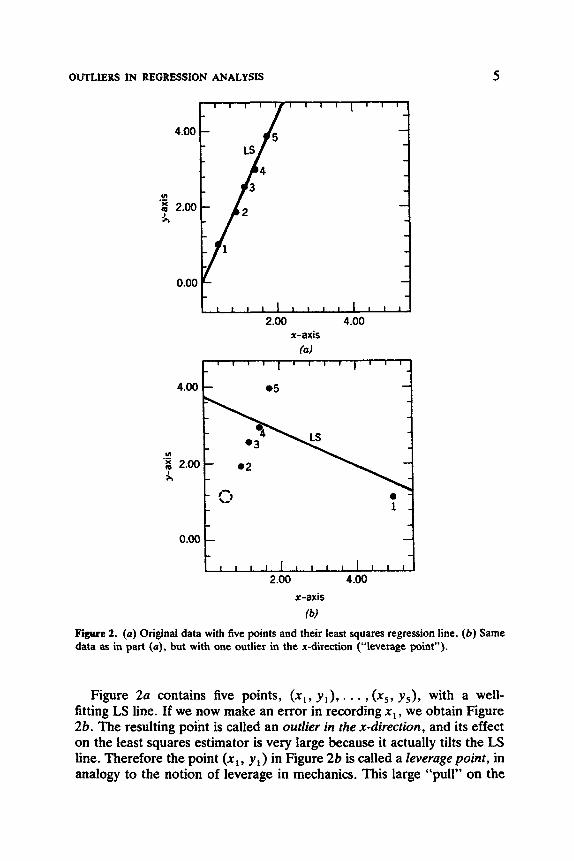
OUTLJERS IN REGRESSION ANALYSIS 5
x-axis
(bl Figure 2. (a) Original data with five points and their least squares regression line. (6) Same data as in part (a), but with one outlier in the x-direction (“leverage point”).
Figure 2a contains five points, (xl, y,), . . . , ( x 5 , y 5 ) , with a well- fitting LS line. If we now make an error in recording x, , we obtain Figure 2b. The resulting point is called an outlier in the x-direction, and its effect on the least squares estimator is very large because it actually tilts the LS line. Therefore the point ( x , , y,) in Figure 2b is called a leverage point, in analogy to the notion of leverage in mechanics. This large “pull” on the

6 INTRODUCTION
LS estimator can be explained as follows. Because x1 lies far away, the residual r , from the original line (as shown in Figure 2a) becomes a very large (negative) value, contributing an enormous amount to EfZl r; for that line. Therefore the original line cannot be selected from a least squares perspective, and indeed the line of Figure 2b ssesses the smallest Zfml r: because it has tilted to reduce that large r r even if the other four terms, r2, . . . , r:, have increased somewhat.
In general, we call an observation ( x k , yk) a leverage point whenever x k lies far away from the bulk of the observed xi in the sample. Note that this does not take Y k into account, so the point ( x k , y k ) does not necessarily have to be a regression outlier. When ( x k , y k ) lies close to the regression line determined by the majority of the data, then it can be considered a “good” leverage point, as in Figure 3. Therefore, to say that ( x k , yk) is a leverage point refers only to its potential for strongly affecting the regression coefficients 4, and 6j (due to its outlying compo- nent x k ) , but it does not necessarily mean that ( x k , yk) will actually have a large influence on 8l and 4, because it may be perfectly in line with the trend set by the other data. (In such a situation, a leverage point is even quite beneficial because it will shrink certain confidence regions.)
In multiple regression, the (xi,, . . . , x ip ) lie in a space with p dimen- sions (which is sometimes called the factor space). A leverage point is then still defined as a point ( x k l , . . . , x k p , yk) for which ( x k l , . . . , x k p ) is outlying with respect to the (xil , . . . , x i p ) in the data set. As before, such
2
- - - - - - m - x - .-
- - - - - -
1 1 1 1 1 1 1 1 1 1 1 1 1 1 ,
x-axis
Figure 3. The point ( x k , y t ) is a leverage point because xt is outlying. However, ( x t , y k ) is not a regression outlier because it matches the linear pattern set by the other data points.

OUTLIERS IN REGRESSION ANALYSIS 7
leverage points have a potentially large influence on the LS regression coefficients, depending on the actual value of y,. However, in this situation it is much more difficult to identify leverage points, because of the higher dimensionality. Indeed, it may be very difficult to discover such a point when there are 10 explanatory variables, which we can.no longer visualize. A simple illustration of the problem is given in Figure 4, which plots x, versus xil for some data set. In this plot we easily see two leverage points, which are, however, invisible when the variables xil and xi* are considered separately. (Indeed, the one-dimensional sample {xI1, x 2 , , . . . , x n l } does not contain outliers, and neither does {x12, xZ2, . . . , xn2} . ) In general, it is not sufficient to look at each variable separately or even at all plots of pairs of variables. The identifi- cation of outlying (x i , , . . . , x i p ) is a difficult problem, which will be treated in Subsection Id of Chapter 7. However, in this book we are mostly concerned with regression outliers, that is, cases for which (xi], . . . , xip, y i ) deviates from the linear relation followed by the ma- jority of the data, taking into account both the explanatory variables and the response variable simultaneously.
Many people will argue that regression outliers can be discovered by looking at the least squares residuals. Unfortunately, this is not true when the outliers are leverage points. For example, consider again Figure 2b. Case 1, being a leverage point, has tilted the LS line so much that it is now quite close to that line. Consequently, the residual r , = y , - j1 is a
xi 1
Fire 4. Plot of the explanatory variables (x i , , x i * ) of a regression data set. There are two leverage points (indicated by the dashed circle), which are not outlying in either of the coordinates.

8 INTRODUCTION
small (negative) number. On the other hand, the residuals rz and rs have much larger absolute values, although they correspond to “good” points. If one would apply a rule like “delete the points with largest LS residuals,” then the “good” points would have to be deleted first! Of course, in such a bivariate data set there is really no problem at all because one can actually look at the data, but there are many multi- variate data sets (like those of Chapter 3) where the outliers remain invisible even through a careful analysis of the LS residuals.
To conclude, regression outliers (either in x or in y) pose a serious threat to standard least squares analysis. Basically, there are two ways out of this problem. The first, and probably most well-known, approach is to construct so-called regression diugnostics. A survey of these techniques is provided in Chapter 6. Diagnostics are certain quantities computed from the data with the purpose of pinpointing influential points, after which these outliers can be removed or corrected, followed by an LS analysis on the remaining cases. When there is only a single outlier, some of these methods work quite well by looking at the effect of deleting one point at a time. Unfortunately, it is much more difficult to diagnose outliers when there are several of them, and diagnostics for such multiple outliers are quite involved and often give rise to extensive computations (e.g., the number of all possible subsets is gigantic). Section 5 of Chapter 6 reports on recent developments in this direction, and in Section 6 of Chapter 6 a new diagnostic is proposed which can even cope with large fractions of outliers.
The other approach is robust regression, which tries to devise es- timators that are not so strongly affected by outliers. Many statisticians who have vaguely heard of robustness believe that its purpose is to simply ignore the outliers, but this is not true. On the contrary, it is by looking at the residuals from a robust (or “resistant”) regression that outliers may be identified, which usually cannot be done by means of the LS residuals. Therefore, diagnostics and robust regression really have the same goals, only in the opposite order: When using diagnostic tools, one first tries to delete the outliers and then to fit the “good” data by least squares, whereas a robust analysis first wants to fit a regression to the majority of the data and then to discover the outliers as those points which possess large residuals from that robust solution.
The following step is to think about the structure that has been uncovered. For instance, one may go back to the original data set and use subject-matter knowledge to study the outliers and explain their origin. Also, one should investigate if the deviations are not a symptom for model failure, which could, for instance, be repaired by adding a quadratic term or performing some transformation.


