21
Robustness of SRAM Memories Universitat Politecnica de Catalunya (UPC) Barcelona Spain Ioana Vatajelu CASTNESS’11 WORKSHOP ON TERACOMP FET Projects, Rome , January 17 th -18 th 2011
| Date post: | 02-Jan-2016 |
| Category: |
Documents |
| Upload: | valentine-stewart |
| View: | 216 times |
| Download: | 0 times |

Robustness of SRAM Memories
Universitat Politecnica de Catalunya(UPC)
Barcelona Spain
Ioana Vatajelu
CASTNESS’11 WORKSHOP ON TERACOMP FET Projects, Rome , January 17 th-18th 2011

Overview
Problem StatementSB-SI Method of Statistical Failure AnalysisFailure Analysis of the 6T SRAM cellParametric Yield of the 6T SRAM memory arrayConclusions
CASTNESS’11 WORKSHOP ON TERACOMP FET Projects, Rome , January 17 th-18th 2011

Overview
Problem StatementSB-SI Method of Statistical Failure AnalysisFailure Analysis of the 6T SRAM cellParametric Yield of the 6T SRAM memory arrayConclusions
CASTNESS’11 WORKSHOP ON TERACOMP FET Projects, Rome , January 17 th-18th 2011

SRAM bit cell:• Minimum size transistors
–> high sensitivity to process variability– Inter-die – Intra-die
• Systematic • Random (RDF & LER)
asymmetric transistors strengths Parametric Failures
Wafer to wafer
Die to die
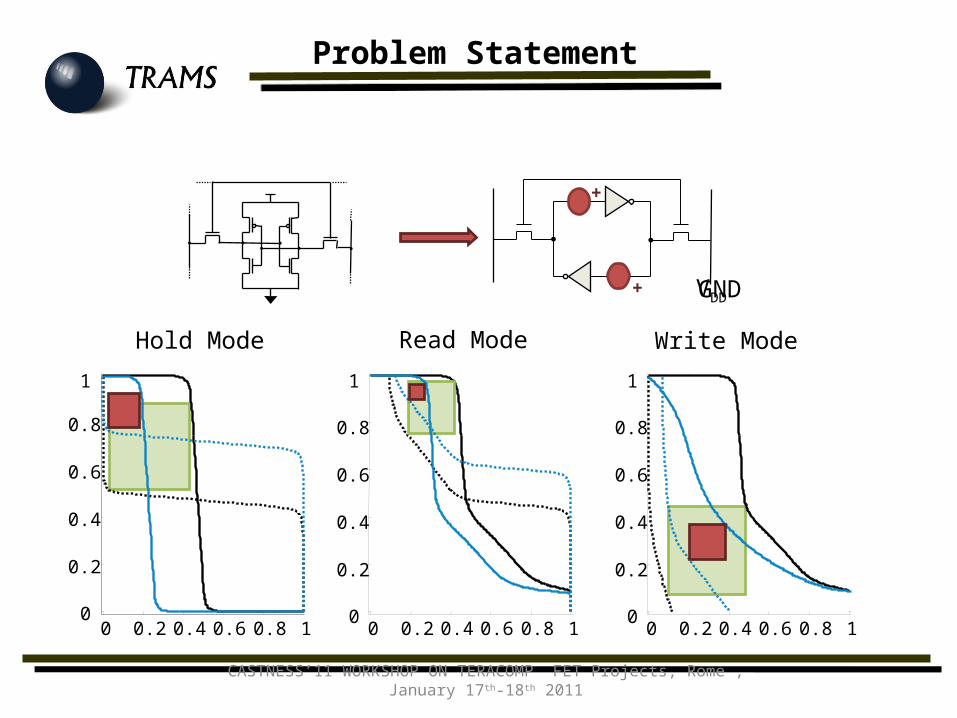
Problem Statement
CASTNESS’11 WORKSHOP ON TERACOMP FET Projects, Rome , January 17 th-18th 2011

CASTNESS’11 WORKSHOP ON TERACOMP FET Projects, Rome , January 17 th-18th 2011
Problem Statement
Pull - up MOS Pull - down MOS access MOS
σ [%] Vdd W[nm] σ [V] 6σ [V] W[nm] σ [V] 6σ [V] W[nm] σ [V] 6σ [V]
45nm 4 1.1 94 0.023 0.141 196 0.017 0.104 113 0.023 0.136
32nm6
1 670.035 0.209
1400.026 0.157
800.035 0.208
15 0.087 0.523 0.065 0.392 0.086 0.519
22nm8
0.95 460.051 0.306
960.038 0.229
550.050 0.302
15 0.096 0.573 0.071 0.429 0.094 0.566
30 0.191 1.147 0.143 0.857 0.189 1.133
16nm10
0.9 330.069 0.412
700.047 0.281
400.062 0.372
20 0.137 0.823 0.094 0.562 0.124 0.743
40 0.274 1.646 0.187 1.124 0.248 1.487
18nm33
0.7 400.067 0.400
840.046 0.276
480.061 0.365
58 0.117 0.703 0.081 0.485 0.107 0.642
13nm39
0.7 290.079 0.473
600.055 0.329
350.072 0.430
58 0.117 0.703 0.081 0.489 0.107 0.640
CASTNESS’11 WORKSHOP ON TERACOMP FET Projects, Rome , January 17 th-18th 2011
0 0.2 0.4 0.6 0.8 10
0.2
0.4
0.6
0.8
1
0 0.2 0.4 0.6 0.8 10
0.2
0.4
0.6
0.8
1
0 0.2 0.4 0.6 0.8 10
0.2
0.4
0.6
0.8
1
Hold Mode Read Mode Write Mode
+
+
VDDGND
Problem Statement

CASTNESS’11 WORKSHOP ON TERACOMP FET Projects, Rome , January 17 th-18th 2011
Hold Mode Read Mode Write Mode
0 0.5 1 1.5x 10
-10
-0.2
0
0.2
0.4
0.6
0.8
1
1.2
0 0.5 1 1.5x 10
-10
-0.2
0
0.2
0.4
0.6
0.8
1
1.2
0 2 4 6 8x 10
-10
-0.2
0
0.2
0.4
0.6
0.8
1
1.2
FAILFAIL FAILFAIL FAILFAILAccess
FAILFAIL
0 0.5 1 1.5x 10
-10
-0.2
0
0.2
0.4
0.6
0.8
1
1.2
Problem Statement

Overview
Problem StatementSB-SI Method of Statistical Failure AnalysisFailure Analysis of the 6T SRAM cellParametric Yield of the 6T SRAM memory arrayConclusions
CASTNESS’11 WORKSHOP ON TERACOMP FET Projects, Rome , January 17 th-18th 2011

CASTNESS’11 WORKSHOP ON TERACOMP FET Projects, Rome , January 17 th-18th 2011
The SB-SI Method E.I. Vatajelu, J. Figueras, IEEE DATE 2011
min mean
Acceptance Region
Failure Region
Acceptance Region
Failure Region
Statistical Distribution
p1

CASTNESS’11 WORKSHOP ON TERACOMP FET Projects, Rome , January 17 th-18th 2011
The SB-SI Method E.I. Vatajelu, J. Figueras, IEEE DATE 2011
Statistical Distribution
p1
p2
p1p2

Overview
Problem StatementSB-SI Method of Statistical Failure AnalysisFailure Analysis of the 6T SRAM cellParametric Yield of the 6T SRAM memory arrayConclusions
CASTNESS’11 WORKSHOP ON TERACOMP FET Projects, Rome , January 17 th-18th 2011

CASTNESS’11 WORKSHOP ON TERACOMP FET Projects, Rome , January 17 th-18th 2011
Failure analysis of the 6T SRAM
Static analysis - SNM
Failu
re P
roba
bilit
y
Supply Voltage [V]1 0.9 0.8 0.7 0.6 0.5 0.4 0.3 0.2 0.1 0.08 0.07 0.06 0.05
45nm - sigma 4% 0.00E+00 0.00E+00 0.00E+00 0.00E+00 0.00E+00 0.00E+00 1.10E-06 1.00E-03 5.78E-02 7.16E-01 8.95E-01 9.57E-01 9.94E-01 1.00E+00
32nm - sigma 6% 0.00E+00 0.00E+00 0.00E+00 0.00E+00 0.00E+00 1.00E-07 3.20E-05 6.70E-03 1.55E-01 8.35E-01 9.53E-01 9.86E-01 9.99E-01 1.00E+00
22nm - sigma 15% 0.00E+00 0.00E+00 0.00E+00 0.00E+00 1.00E-09 1.70E-06 1.30E-03 3.57E-02 3.81E-01 9.70E-01 9.97E-01 1.00E+00 1.00E+00 1.00E+00
16nm - sigma 20% 0.00E+00 0.00E+00 0.00E+00 3.21E-07 6.67E-06 2.10E-05 3.41E-02 2.74E-01 8.24E-01 9.99E-01 1.00E+00 1.00E+00 1.00E+00 1.00E+00
-2.00E-01
0.00E+00
2.00E-01
4.00E-01
6.00E-01
8.00E-01
1.00E+00
1.20E+00

CASTNESS’11 WORKSHOP ON TERACOMP FET Projects, Rome , January 17 th-18th 2011
Failure analysis of the 6T SRAM
Static analysis - SNM
0 0.2 0.4 0.6 0.8 10
0.2
0.4
0.6
0.8
1
Pno
-acc, P
fail
VDD [V]
SNMmin = 10%VDD
SNMmin = 0

Overview
Problem StatementSB-SI Method of Statistical Failure AnalysisFailure Analysis of the 6T SRAM cellParametric Yield of the 6T SRAM memory arrayConclusions
CASTNESS’11 WORKSHOP ON TERACOMP FET Projects, Rome , January 17 th-18th 2011

CASTNESS’11 WORKSHOP ON TERACOMP FET Projects, Rome , January 17 th-18th 2011
Parametric Yield
BL BLB
NaRNaL PL PR
NRNLLL
RR
WL
‘‘1’1’‘‘0’0’
ΔVTHPL
ΔVTHNR
ΔVTHNL
ΔVTHNR

CASTNESS’11 WORKSHOP ON TERACOMP FET Projects, Rome , January 17 th-18th 2011
∆VTHPL
∆VTHNR
Taccess = 1000ps
VDDlow = 0.3V
VDDlow = 0.5V
Taccess = 500ps
HOLD
ACCESS
WRITE
Parametric Yield

CASTNESS’11 WORKSHOP ON TERACOMP FET Projects, Rome , January 17 th-18th 2011
Parametric Yield
Hold (PFH)
VDDlow = 0.5V
Write (PFW)
Tacceess = 1ns
Read (PR)
Tacceess =
1ns
Access (PFA)
Tacceess = 1nsCell
(PCELL)
Array (PARRAY)
512k
Yield (%)512k
PTM
45nm 4% 0 1.03e-9 0 2.41e-9 2.87e-9 1.5e-3 99.85
32nm6% 9.73e-8 2.91e-8 3.34e-8 7e-8 1.02e-7 5.21e-2 94.7915% 1.01e-7 4.76e-7 4.2e-8 9.32e-7 7.92e-7 0.34 66.02
22nm8% 1.06e-7 1.32e-7 9.47e-8 1.31e-7 2.16e-7 0.107 89.2915% 1.56e-6 3.03e-6 9.82e-7 2.66e-6 5.09e-6 0.937 6.9330% 2.15e-4 1.49e-4 7.15e-4 2.17e-4 8.23e-4 1 0
16nm10% 5.14e-7 6e-7 2.91e-7 3.33e-7 1.11e-6 0.441 55.8820% 1.93e-5 2.06e-5 1.57e-5 1.8e-5 3.91e-5 1 1.25e-740% 1.15e-3 3.33e-3 9.23e-4 1.39e-3 4.76e-3 1 0
UoG18nm
33% 9.81e-6 2.43e-5 1.06e-5 1.53e-5 4.81e-5 1 1.11e-958% 6.3e-3 1e-2 4.34e-3 6.25e-3 1.42e-2 1 0
13nm39% 2.62e-5 4.19e-5 2.83e-5 3.33e-5 8.32e-5 1 1.13e-1758% 4.66e-2 7.1e-2 2.04e-2 5e-2 1.21e-1 1 0
σ [%] Yield (%) 512k
PTM
45nm 4% 99.85
32nm6% 94.79
15% 66.02
22nm
8% 89.2915% 6.9330% 0
16nm
10% 55.8820% 1.25E-0740% 0
UoG18nm
33% 1.11E-0958% 0
13nm39% 1.13E-1758% 0

CASTNESS’11 WORKSHOP ON TERACOMP FET Projects, Rome , January 17 th-18th 2011
Parametric Yield
99.85 94.7989.29
55.88
0
20
40
60
80
100
120
45 nm (4%) 32nm (6%) 22nm (8%) 16nm (10%)
Para
met
ric Y
ield
[%]

Overview
Problem StatementSB-SI Method of Statistical Failure AnalysisFailure Analysis of the 6T SRAM cellParametric Yield of the 6T SRAM memory arrayConclusions
CASTNESS’11 WORKSHOP ON TERACOMP FET Projects, Rome , January 17 th-18th 2011
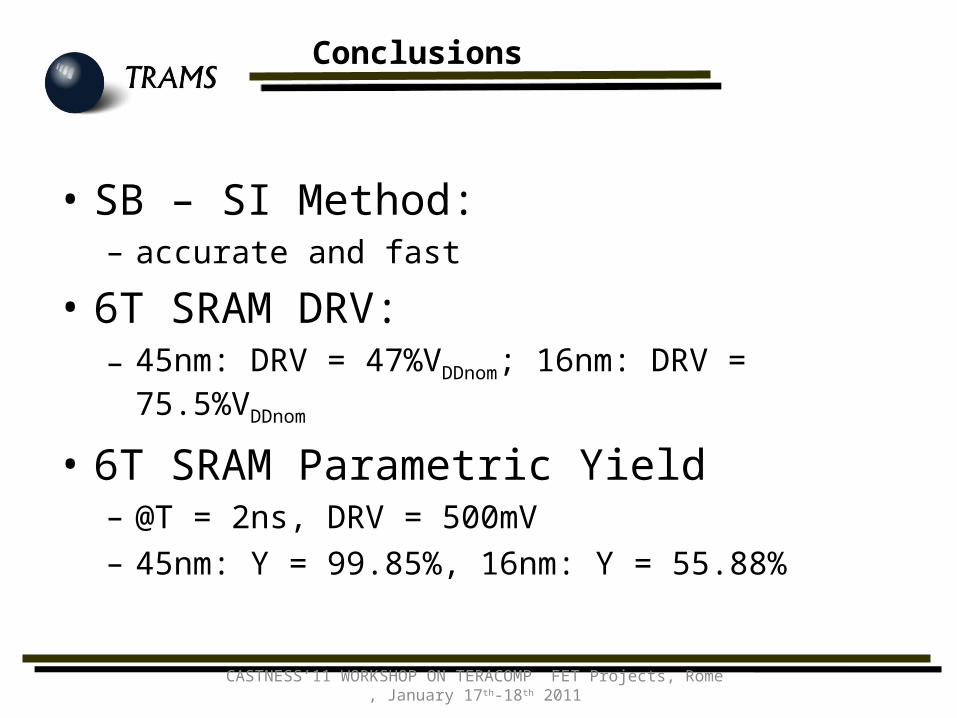
• SB – SI Method: – accurate and fast
• 6T SRAM DRV: – 45nm: DRV = 47%VDDnom; 16nm: DRV = 75.5%VDDnom
• 6T SRAM Parametric Yield– @T = 2ns, DRV = 500mV– 45nm: Y = 99.85%, 16nm: Y = 55.88%
CASTNESS’11 WORKSHOP ON TERACOMP FET Projects, Rome , January 17 th-18th 2011
Conclusions

Thanks for your attention!
CASTNESS’11 WORKSHOP ON TERACOMP FET Projects, Rome , January 17 th-18th 2011


