166
Roche Finance Report 2010

E
Roch
e|
Finance Report 2010
F. Hoffmann-La Roche Ltd4070 Basel, Switzerland
© 2011
All trademarks are legally protected.
www.roche.com
7 000 899
Roche Finance Report2010

Table of contents
26. Other non-current liabilities 10827. Debt 10828. Equity attributable to Roche
shareholders 11429. Earnings per share and
non-voting equity security 11730. Non-controlling interests 11931. Statement of cash flows 12032. Risk management 12133. Related parties 12934. Subsidiaries and associates 131
Report of Roche Management on Internal Control over Financial Reporting 135Report of the Statutory Auditor on the Consolidated Financial Statements 136Report of the Independent Auditor on Internal Control over Financial Reporting 138Multi-Year Overview and Supplementary Information 140Roche Securities 149
Roche Holding Ltd, Basel 151Financial Statements 151Notes to the Financial Statements 153
1. Summary of significant accounting policies 153
2. Equity 153 3. Contingent liabilities 154 4. Significant shareholders 154 5. Risk management 155 6. Board and Executive remuneration 155 7. Board and Executive shareholdings 157
Appropriation of Available Earnings 161Report of the Statutory Auditor on the Financial Statements 162
Roche Group 2Finance in brief 2Finance – 2010 in brief 3Financial Review 4Roche Group Consolidated Financial Statements 34Notes to the Roche Group Consolidated Financial Statements 40
1. Summary of significant accounting policies 40
2. Operating segment information 54 3. Genentech 57 4. Chugai 58 5. Financial income and financing costs 59 6. Income taxes 61 7. Business combinations 63 8. Global restructuring plans 69 9. Employee benefits 7210. Pensions and other post-employment
benefits 7311. Employee stock options and
other equity compensation plans 7912. Property, plant and equipment 8713. Goodwill 9014. Intangible assets 9115. Associates 9416. Financial and other long-term assets 9517. Inventories 9518. Accounts receivable 9619. Other current assets 9620. Marketable securities 9721. Cash and cash equivalents 9822. Accounts payable 9823. Accrued and other current liabilities 9924. Derivative financial instruments 9925. Provisions and contingent liabilities 102
2 Roche Finance Report 2010 Roche Group – Finance in brief
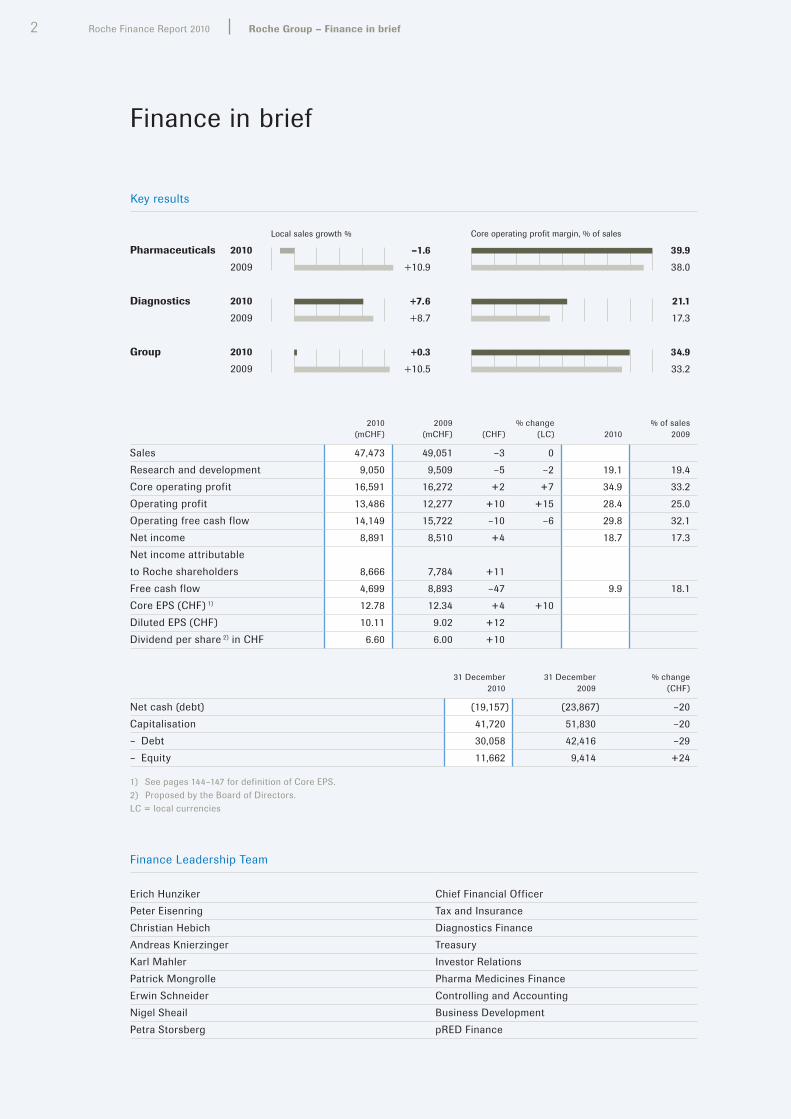
Finance in brief
Pharmaceuticals –1.6
+10.9
+7.6
+8.7
+0.3
+10.5
2010
2009
Key results
Local sales growth %
39.9
38.0
21.1
17.3
34.9
33.2
Core operating profit margin, % of sales
Diagnostics
Group
2010
2009
2010
2009
2010 2009 % change % of sales(mCHF) (mCHF) (CHF) (LC) 2010 2009
Sales 47,473 49,051 –3 0Research and development 9,050 9,509 –5 –2 19.1 19.4Core operating profit 16,591 16,272 +2 +7 34.9 33.2Operating profit 13,486 12,277 +10 +15 28.4 25.0Operating free cash flow 14,149 15,722 –10 –6 29.8 32.1Net income 8,891 8,510 +4 18.7 17.3Net income attributable to Roche shareholders 8,666 7,784 +11Free cash flow 4,699 8,893 –47 9.9 18.1Core EPS (CHF) 1) 12.78 12.34 +4 +10Diluted EPS (CHF) 10.11 9.02 +12Dividend per share 2) in CHF 6.60 6.00 +10
31 December 2010
31 December 2009
% change (CHF)
Net cash (debt) (19,157) (23,867) –20Capitalisation 41,720 51,830 –20– Debt 30,058 42,416 –29– Equity 11,662 9,414 +24
1) See pages 144–147 for definition of Core EPS.2) Proposed by the Board of Directors.LC = local currencies
Finance Leadership Team
Erich Hunziker Chief Financial OfficerPeter Eisenring Tax and InsuranceChristian Hebich Diagnostics FinanceAndreas Knierzinger TreasuryKarl Mahler Investor RelationsPatrick Mongrolle Pharma Medicines FinanceErwin Schneider Controlling and AccountingNigel Sheail Business DevelopmentPetra Storsberg pRED Finance

3 Roche Finance Report 2010Finance – 2010 in brief
Finance – 2010 in brief
Sales• Group sales were 47.5 billion Swiss francs, a decline of 3% due to the large pandemic sales of Tamiflu
in the comparative period and a currency translation effect from the strength of the Swiss franc relative to the US dollar and euro. Local currency sales were stable as growth in the underlying business compensated for the sharply reduced Tamiflu sales. Excluding Tamiflu, Group sales increased by 5% in local currencies.
• The Pharmaceuticals Division sales grew above the market at 5% in local currencies, excluding Tamiflu. There was solid growth in key oncology products, Lucentis in ophthalmology and Actemra/RoActemra in rheumatoid arthritis.
• Tamiflu sales in 2010 declined sharply by over 2.3 billion Swiss francs to 0.9 billion Swiss francs due to the 2009 pandemic A (H1N1) influenza virus (‘swine flu’) outbreak.
• Healthcare reforms in the United States, austerity measures in Europe and price cuts in Japan had a negative impact on Pharmaceuticals sales of almost 800 million Swiss francs and 2 percentage points on sales growth.
• Diagnostics sales increased by 8% in local currencies to 10.4 billion Swiss francs, driven by sales growth in Professional Diagnostics and Diabetes Care. This was significantly ahead of the estimated IVD market growth rate.
Operating results• Core operating profit increased by 7% in local currencies to 16.6 billion Swiss francs thanks to the
Genentech integration synergies and productivity improvements, which more than offset the substantially lower profit contribution from Tamiflu and the impact of the healthcare reforms.
• The core operating profit margin increased by 1.7 percentage points, while the increase in the Pharmaceuticals Division was 1.9 percentage points and in the Diagnostics Division 3.8 percentage points.
• Research and development expenditure on a core basis declined 2% in local currencies to 9.0 billion Swiss francs, representing 19.1% of Group sales.
• On 17 November 2010 the Group announced the details of its Operational Excellence programme. Initial restructuring charges of 1.3 billion Swiss francs were included in the 2010 IFRS operating results, mainly relating to severance costs and asset impairments.
Treasury• Core net financial expenses increased by 0.6 million Swiss francs primarily due to a full year of financing
costs in 2010 for the debt issued in the first quarter of 2009 in respect of the Genentech transaction, and losses on early redemption of debt in 2010.
• The repayment of debt is ahead of schedule as 2.5 billion US dollars of debt was redeemed early in September 2010. Of the 48.2 billion Swiss francs of bonds and notes issued in 2009 to finance the Genentech transaction, 33% has already been repaid by the end of 2010, and a further 1.0 billion US dollars has been called for early redemption in March 2011.
Financial condition• Strong financial condition with an operating free cash flow of 14.1 billion Swiss francs and a free cash flow
of 4.7 billion Swiss francs.• Net debt position of 19.2 billion Swiss francs at 31 December 2010, down 4.7 billion from 23.9 billion Swiss
francs at the previous year-end.• Strong credit rating: Moody’s at A2 and Standard & Poor’s at AA–.
Net income and Core EPS• Net income increased by 4% to 8.9 billion Swiss francs compared to 2009 primarily driven by the strong
operating result. • The Genentech transaction had an accretive impact on net income attributable to Roche shareholders,
which rose 11% to 8.7 billion Swiss francs. The synergies and the elimination of non-controlling interests more than compensated for the costs of financing the transaction.
• Core EPS was 10% higher at constant exchange rates and 4% higher in Swiss francs.
Shareholder return• Increase in proposed dividend of 10% to 6.60 Swiss francs, representing the 24th consecutive year
of dividend growth.• If approved by shareholders, this will result in an increased payout ratio of 51.6% and a higher dividend
yield on Roche shares of 4.6% and on non-voting equity securities of 4.8%, based on year-end prices.• Decline in Total Shareholder Return (TSR), i. e. share price movement plus dividends, of –19% combined
performance of share and non-voting equity security.

4 Roche Finance Report 2010 Roche Group – Financial Review
Roche Group
Financial Review
Group operating results
2010
2009
2008
+0.3
+10.5
+5.9
Sales | in billions of CHF
% LC growth
0 10 20 30 40 50
34.9
33.2
33.0
Core operating profit | in billions of CHF
% of sales
0 5 10 15 20
In 2010 the Group achieved another solid operating performance. Sales were stable in local currencies (–3% in Swiss francs; +1% in US dollars) at 47.5 billion Swiss francs as underlying growth was able to compensate for the expected decline in Tamiflu sales and the initial impacts of healthcare reforms and austerity measures. Excluding Tamiflu, sales increased by 5% in local currencies. The Pharmaceuticals Division represented 78% of Group sales and the Diagnostics Division contributed 22%.
Sales in the Pharmaceuticals Division declined by 2% in local currencies to 37.1 billion Swiss francs. Excluding Tamiflu, local growth was 5%, above market growth. Demand for the oncology drugs Avastin, MabThera/Rituxan, Herceptin, Xeloda and Tarceva continued to grow strongly. Additional major growth drivers were Lucentis in ophthalmology, Actemra/RoActemra in rheumatoid arthritis and Mircera in renal anemia. These positive factors mostly offset the expected decline in Tamiflu sales, the reduction in CellCept sales due to US patent expiry in May 2009 and the impacts of the US healthcare reforms, European austerity measures and price cuts in Japan. The Diagnostics Division increased sales to 10.4 billion Swiss francs, growing 8% in local currencies (4% in Swiss francs; 8% in US dollars), thereby strengthening its leading market position. Major growth areas were Professional Diagnostics and Diabetes Care.
The Group has expanded the presentation of its core results for 2010. Previously only Core EPS was shown, but now the full income statement for the Group and the operating results of the divisions are shown on both an IFRS and core basis. This allows a transparent assessment of both the actual results and the underlying performance of the business. The core concept is fully described on pages 144–147 and reconciliations between the IFRS and core results are given there.

5
On a core basis, the Group’s operating profit increased by 7% in local currencies (2% in Swiss francs), while sales were stable. The increase in profitability was driven by synergies from the Genentech integration, further productivity improvements and cost containment. This performance was achieved in spite of a substantially lower contribution from Tamiflu and the impacts of the healthcare reforms. Marketing and distribution costs remained at around the prior year’s level in local currencies and research and development costs declined. The Pharmaceuticals Division increased its core operating profit by 4% in local currencies, driven primarily by cost synergies from the Genentech integration, resource prioritisation and productivity improvements. Core operating profit growth in the Diagnostics Division was 30% in local currencies, mainly resulting from sales growth and the ongoing operational efficiency programmes. The Group’s core operating profit margin increased by 1.7 percentage points, with the Pharmaceuticals Division improving by 1.9 percentage points and the Diagnostics Division by 3.8 percentage points. The margin increase at Group level was lower than in the two divisions due to a mix effect, with a much stronger growth in the relatively lower-margin Diagnostics business, and due to a shift of certain administration activities from the Pharmaceuticals Division to Corporate as a result of the new Group organisation effective 1 January 2010.
The Group’s operating free cash flow remained strongly positive at over 14.1 billion Swiss francs. There was a decrease of 6% in local currencies (10% in Swiss francs), principally arising from payments in early 2010 of certain large year-end 2009 accrued liabilities, notably for Tamiflu royalties and employee retention/severance schemes. The free cash flow in 2010 decreased by 4.2 billion Swiss francs to 4.7 billion Swiss francs. This was primarily due to the non-recurrence of the one-time tax benefit in 2009 of 1.1 billion Swiss francs following the Genentech transaction, the interest payments on the new debt issued to fund the Genentech transaction which had no comparable payments in 2009, and higher dividend payments. The Group continued to pay down the debt issued in the first half of 2009 to finance the Genentech transaction.
On 17 November 2010 the Group announced the details of the Operational Excellence programme. As a consequence of implementing the respective restructuring measures, significant costs were incurred in 2010. The costs recognised in 2010 of 1.3 billion Swiss francs mainly relate to severance payments following reductions in positions in sales and marketing, global manufacturing, global development and research and early development, as well as impairments of intangible assets. The Pharmaceuticals Division accounts for 1.2 billion Swiss francs of these costs and 0.1 billion Swiss francs relate to the Diagnostics Division. Roughly 40% of the charges are non-cash, being mostly impairments of property, plant and equipment and intangible assets.
During 2010 the Pharmaceuticals Division completed the integration and restructuring activities at Genentech. Further expenses of 596 million Swiss francs were incurred in 2010, mainly due to site closure and employee-related costs. In the comparative period 2,415 million Swiss francs were incurred mainly for impairment of manufacturing facilities.
Divisional operating results for 2010
Pharmaceuticals (mCHF)
Diagnostics (mCHF)
Corporate (mCHF)
Group (mCHF)
Sales 37,058 10,415 – 47,473Core operating profit 14,776 2,202 (387) 16,591– margin, % of sales 39.9 21.1 – 34.9Operating profit 12,301 1,579 (394) 13,486– margin, % of sales 33.2 15.2 – 28.4Operating free cash flow 12,933 1,634 (418) 14,149– margin, % of sales 34.9 15.7 – 29.8

6 Roche Finance Report 2010 Roche Group – Financial Review
Divisional operating results – Development of results compared to 2009
Pharmaceuticals Diagnostics Corporate Group
Sales– % increase in local currencies –2 +8 – 0Core operating profit– % increase in local currencies +4 +30 +27 +7– margin: percentage point increase +1.9 +3.8 – +1.7Operating profit– % increase in local currencies +13 +34 +16 +15– margin: percentage point increase +3.9 +3.3 – +3.4Operating free cash flow– % increase in local currencies –9 +48 +19 –6– margin: percentage point increase –3.4 +4.2 – –2.3
Pharmaceuticals operating resultsSales in the Pharmaceuticals Division declined by 2% in local currencies to 37.1 billion Swiss francs. Excluding Tamiflu, local growth was 5%, above market growth. Core operating profit grew 4% in local currencies and was stable in Swiss francs at 14.8 billion Swiss francs. The core operating profit margin increased by 1.9 percentage points, driven by the Genentech integration synergies, resource prioritisation and productivity improvements. This was achieved in spite of the expected sharp decline in Tamiflu sales of more than 2.3 billion Swiss francs and the impact of healthcare reforms and austerity measures. Exchange rate movements had a negative 0.3 percentage point effect on the margin.
Marketing efforts focused on the growing oncology and rheumatoid arthritis portfolios, especially for the broader indications of Avastin and Herceptin, and the launch of Actemra/RoActemra. Marketing and distribution costs in local currencies decreased by 1% through tight cost management, which more than covered an increase in allowances for bad debts in Southern Europe. Research and development costs were reduced by 2% at constant exchange rates whereas in previous years they had increased significantly. This was achieved by resource prioritisation while securing long-term growth through the rich pipeline. The Pharmaceuticals Division acquired the US biopharmaceutical company Marcadia Biotech, whose research programmes focus on new peptide therapies for the treatment of Type 2 diabetes and obesity.
In 2010, the Pharmaceuticals Division incurred non-core expenses of 1.2 billion Swiss francs relating to the Operational Excellence programme. Of this 0.8 billion Swiss francs relate to termination and other costs which are shown as global restructuring costs in the reconciliations to the core results. The remaining 0.4 billion Swiss francs consists of impairments of intangible assets. Also included in global restructuring costs are the remaining costs of 0.6 billion Swiss francs from the Genentech integration and restructuring.

7
Pharmaceuticals Division results
2010 (mCHF)
2009 (mCHF)
% change (CHF)
% change (local currencies)
Sales 37,058 38,996 –5 –2Royalties and other operating income 1,537 1,948 –21 –18Cost of sales (7,947) (9,314) –15 –12Marketing and distribution (6,652) (6,964) –4 –1Research and development (8,160) (8,562) –5 –2General and administration (1,060) (1,268) –16 –14Core operating profit 14,776 14,836 0 +4
– margin, % of sales 39.9 38.0 +1.9 +2.2
Operating profit 12,301 11,419 +8 +13
– margin, % of sales 33.2 29.3 +3.9 +4.3
Operating free cash flow 12,933 14,923 –13 –9
– margin, % of sales 34.9 38.3 –3.4 –2.9
SalesSales by therapeutic area | The major growth drivers were key products in the oncology, ophthalmology and inflammation/autoimmune/transplantation therapeutic areas. In virology, sales of Tamiflu decreased substantially due to unusually high sales in 2009 arising from the A (H1N1) influenza virus (‘swine flu’). Sales in inflammation/autoimmune/transplantation increased slightly due to the continued success of MabThera/Rituxan in rheumatoid arthritis as well as the excellent uptake of Actemra/RoActemra, which more than compensated the negative impact from the CellCept patent expiry in the United States in May 2009. Sales in the renal anemia therapeutic area decreased in an increasingly competitive, cost-sensitive market.
Pharmaceuticals Division – Sales by therapeutic area for 2010
Therapeutic areaSales
(mCHF) % of sales% change
(local currencies)
Oncology 21,252 57 +7Virology 3,543 10 –39Inflammation/Autoimmune/Transplantation 2,950 8 +3Metabolism/Bone 2,568 7 –1Ophthalmology 1,458 4 +27Renal anemia 1,207 3 –6Others 4,080 11 0Total 37,058 100 –2
Sales by product | In 2010 the Top 20 Pharmaceuticals products, which represented 88% of sales of the Pharmaceuticals portfolio, declined by 1% in local currencies as the growth contribution of the majority of products could not entirely offset the expected significant decline of Tamiflu sales by more than 2.3 billion Swiss francs. Local sales growth of the Pharmaceuticals Division was primarily driven by six products: Avastin, MabThera/Rituxan, Herceptin, Lucentis, Actemra/RoActemra and Xeloda. These products represent 58% of the portfolio (2009: 52%; 2008: 51%) and together generated 1.3 billion Swiss francs of additional sales in 2010 compared to 2009. Sales of other products declined, as the contribution to sales growth from the renal anemia medication Mircera could not fully offset the lower sales of some other products due to generic erosion following patent expiry and the voluntary withdrawal of Raptiva from the US market in 2009.

8 Roche Finance Report 2010 Roche Group – Financial Review
Pharmaceuticals Division – Sales of Top 20 products for 2010
ProductSales
(mCHF) % of sales% change
(local currencies) Franchise
Avastin 6,461 17 +9 OncologyMabThera/Rituxan 6,356 17 +9 Oncology/IAT1)
Herceptin 5,429 15 +7 OncologyPegasys 1,645 4 +2 VirologyLucentis 1,458 4 +27 OphthalmologyXeloda 1,426 4 +17 OncologyTarceva 1,325 4 +6 OncologyCellCept 1,290 4 –15 IAT1)
NeoRecormon/Epogin 1,285 3 –15 Renal anemia, OncologyBonviva/Boniva 1,013 3 +1 Metabolism/BoneTamiflu 873 2 –73 VirologyXolair 641 2 +8 Respiratory diseasesValcyte/Cymevene 605 2 +12 VirologyPulmozyme 513 1 +6 Respiratory diseasesActivase/TNKase 460 1 +4 Cardiovascular diseasesNutropin 405 1 +5 Metabolism/BoneActemra/RoActemra 397 1 +177 IAT1)
Xenical 337 1 –12 Metabolism/BoneNeutrogin 331 1 –16 OncologyRocephin 311 1 +3 Infectious diseasesTotal Top 20 products 32,561 88 –1
Other products 4,497 12 –5Total 37,058 100 –2
1) Inflammation /Autoimmune/Transplantation.
Avastin | Sales for advanced colorectal, breast, lung and kidney cancer, and for relapsed glioblastoma (a type of brain tumour) rose 9% in local currencies to 6.5 billion Swiss francs, reflecting the continued positive uptake of the product overall. Sales growth of 7% in Western Europe is being driven primarily by continued uptake for breast cancer and improved uptake for lung cancer. US sales were stable overall, with lower sales in the second half reflecting regulatory and reimbursement uncertainty regarding the metastatic breast cancer indication. Very strong sales growth in Japan of 51% was driven by good uptake in colorectal cancer and non-small cell lung cancer. Significant sales growth was also recorded in Latin America. Following marketing approval in China earlier this year, Avastin was launched for the first-line treatment of metastatic colorectal cancer in the third quarter and contributed to a sharp growth of 49% in sales in Asia.
MabThera/Rituxan | Full-year sales in oncology and autoimmune disease areas for non-Hodgkin’s lymphoma (NHL), chronic lymphocytic leukemia (CLL) and rheumatoid arthritis (RA) totalled 6.4 billion Swiss francs in 2010, an increase of 9% in local currencies versus 2009. Sustained growth in the oncology segment was driven by uptake in CLL and continued strong use in NHL in Western Europe and the US. The high growth of 20% in the International region, including increases in key emerging markets, reflects uptake of the medicine in its NHL indications. The European rollout of MabThera in a new indication, first-line maintenance treatment of patients with follicular lymphoma, began in the fourth quarter. Estimated sales in the RA segment reached the 1.0 billion Swiss franc mark in 2010. Growth is being driven by increased use in patients with an inadequate response to one or more tumour necrosis factor inhibitors and by growing acceptance of six-month repeat treatment intervals.
9
Herceptin | Global sales for HER2-positive breast cancer and advanced HER2-positive stomach cancer rose 7% in local currencies to 5.4 billion Swiss francs due to sustained growth of 6% in both the United States and Western Europe and significant increase of 18% in the International region. Herceptin maintained its solid market penetration in breast cancer, with sales also benefiting from initial uptake for stomach cancer in EU countries and other markets. In addition improvements in the quality of HER2 testing are expanding the population of patients eligible for treatment with Herceptin. A higher sales volume in Japan was outweighed by the effect of revised reimbursement prices from April 2010, resulting in a significant decline in sales of 15% compared with 2009.
Pegasys | Sales for hepatitis B and C remained virtually stable year-on-year at 1.6 billion Swiss francs, with growth seen in the Asia region. Sales decreases of 4% in Western Europe and 6% in Japan were offset by growth of 9% in the International region, especially Asia and CEMAI countries. The product’s market share continued to expand in the main European markets, the US and Japan. Global sales continued to benefit from clinical data reinforcing the superiority of Pegasys over other hepatitis C treatment options and increased use in the treatment of hepatitis B.
Lucentis | US sales for wet age-related macular degeneration and macular edema following retinal vein occlusion grew 27% in local currencies to 1.5 billion Swiss francs. The strong growth throughout the year has been driven primarily by an increase in the total number of patients receiving Lucentis and the time patients are on treatment. The US launch of Lucentis for the treatment of macular edema (swelling in the retina) following retinal vein occlusion began in late June 2010 and the initial uptake is encouraging.
Xeloda | Sales for colorectal, stomach and breast cancer rose 17% in local currencies to 1.4 billion Swiss francs. Growth was driven primarily by significant increases in the United States, Japan and China, the product’s three largest markets. Global sales of Xeloda are benefitting from a number of new indications, including stomach cancer in China, an expanded metastatic colorectal cancer indication in Japan, and adjuvant colon cancer in Europe, as well as increased patient share in metastatic breast cancer in the EU.
Tarceva | Sales for advanced lung and pancreatic cancer grew 6% in local currencies to 1.3 billion Swiss francs, driven mainly by increased use in the second-line non-small cell lung cancer setting. The main growth contributions came from the International region with 16% growth, and also from Japan and the United States. Growth of 5% in the US reflects steady demand in the lung and pancreatic cancer indications and the impact of government healthcare reforms. Against a background of stable demand, sales in Western Europe declined slightly mainly as a result of government-mandated pharmaceutical price reductions and rebates in several major markets. Sustained sales growth of 37% in Japan reflects continued market penetration and oncologists’ increasing confidence in the benefits of treatment with Tarceva.
CellCept | At 1.3 billion Swiss francs, sales of CellCept for the prevention of solid organ transplant rejection remained significant. The sales decrease of 15% in local currencies was due to the loss of patent exclusivity in the United States in May 2009. The resulting losses to competition from generic versions caused US sales to decrease by 48%. This was partly offset by sales growth in the International region of 5% and in Japan of 16%.
NeoRecormon/Epogin | Combined sales of Roche’s NeoRecormon and Chugai’s Epogin (epoetin beta) declined 15% in local currencies to 1.3 billion Swiss francs. Roche’s overall share of the European anemia market remained stable, despite increasing biosimilars competition, due mainly to the strong performance of Mircera in the major EU countries and a robust market share by volume for NeoRecormon in the renal indication. A decline in sales of Epogin in Japan of 10% was mainly due to competition in the dialysis market and a lower National Health Insurance reimbursement price. These effects outweighed the increased demand for the medicine in the pre-dialysis segment.

10 Roche Finance Report 2010 Roche Group – Financial Review
Tamiflu | Following unprecedented demand in 2009 due to the influenza A (H1N1) pandemic sales of Tamiflu, for influenza A and B, totalled 0.9 billion Swiss francs in 2010, a decrease of 2.3 billion Swiss francs, or 73% lower than in 2009. With government stockpiling orders largely completed by early 2010 and the influenza A (H1N1) pandemic passing its peak, sales fell sharply in the last three quarters of 2010. Sales were also affected by relatively mild influenza seasons in both hemispheres during 2010.
Actemra/RoActemra | As the global rollout of the novel rheumatoid arthritis medicine Actemra continued, sales in 2010 totalled 397 million Swiss francs, a rise of 177% in local currencies over 2009. Uptake of Actemra/RoActemra in the EU, the United States and other launch markets remains very encouraging. Continued strong sales growth of 67% in Japan reflects increasing use of Actemra as a first-line biologic.
Mircera | Sales of the renal anemia medication Mircera rose 51% in local currencies to 255 million Swiss francs. Demand for Mircera, which is now available in over 100 countries worldwide, is coming mainly from the pre-dialysis segment and new patient commencements.
See the Business Report (Part 1 of this Annual Report) for more information on Roche’s pharmaceutical products.
Sales by region | The worldwide pandemic A (H1N1) 2009 influenza virus (‘swine flu’) outbreak that began in the first half of 2009 and other pandemic sales resulted in unusually high sales for Tamiflu in the comparative period. The significant decline in demand since December 2009 led to varying impacts across regions which are shown in the table below. Therefore the following comments focus on the business excluding Tamiflu. In the United States sales continued to grow by 4% in local currencies driven by the oncology products and Lucentis. This more than covered the substantial decline in CellCept post-patent expiry, which was down by 48% in US dollars, with a negative impact on regional sales growth of 2 percentage points. In addition the initial impact of the US healthcare reforms led to a reduction of sales of approximately 250 million US dollars (260 million Swiss francs) in 2010 through increased rebates, affecting all major products. Sales in Western Europe increased by 2% due to the strong oncology portfolio and good uptake of Actemra/RoActemra and Mircera and in spite of an estimated 275 million Swiss francs negative impact from European austerity measures. CEMAI (Central and Eastern Europe, Middle East, Africa, Central Asia and Indian subcontinent), Latin America and Asia–Pacific regions showed strong growth driven by MabThera/Rituxan, Herceptin, Avastin, Xeloda, Pegasys and Mircera. Sales in Japan increased by 3% as the continued success of Avastin, Actemra/RoActemra, Xeloda, Tarceva and MabThera outweighed the impact from biennial price cuts in Japan, which became effective 1 April 2010.
Pharmaceuticals Division – Sales by region for 2010
RegionSales
(mCHF) % of sales% change
(local currencies)
% change excluding Tamiflu (local currencies)
United States 14,071 38 –1 +4Western Europe 9,467 25 –5 +2Japan 4,319 12 –12 +3CEMAI 1) 3,336 9 +4 +11Latin America 2,694 7 +20 +16Asia–Pacific 2,166 6 +8 +16Other regions 1,005 3 –9 –7Total 37,058 100 –2 +5
1) Central and Eastern Europe, Middle East, Africa, Central Asia, Indian Subcontinent.

11
Operating resultsRoyalties and other operating income | The decline of 18% in local currencies was in particular due to 369 million Swiss francs lower income from out-licensing agreements in 2010. This decrease was mainly due to the non-recurrence of significant milestone payments in 2009 from GlaxoSmithKline (84 million Swiss francs related to orlistat OTC approval by the EU and 81 million Swiss francs for Bonviva/Boniva) and milestone income at Chugai in 2009. Furthermore the comparative period included income from the disposal of products, mainly in Latin America, of 226 million Swiss francs compared to 120 million Swiss francs in 2010. These effects were only partly offset in 2010 by higher royalty income. In total royalties and other operating income as a percentage of sales decreased by 0.8 percentage points to 4.2% (2009: 5.0%).
Pharmaceuticals Division – Royalties and other operating income 2010
2010 (mCHF)
2009 (mCHF)
% change (local currencies)
Royalty income 1,344 1,280 +9Income from out-licensing agreements 73 442 –83Income from disposal of products and other 120 226 –46Total – IFRS and Core basis 1,537 1,948 –18
Cost of sales | On a core basis, costs decreased by 12% in local currencies as a result of lower royalty expenses, reductions in manufacturing costs and lower costs from collaboration agreements. As a percentage of sales, cost of sales declined to 21.4% (2009: 23.9%). The 6% decline in manufacturing cost of goods sold and period costs was mainly due to productivity improvements and favourable product mix effects. The comparative period includes the one-time impact of the inventory write-off of 141 million Swiss francs for the voluntary withdrawal of Raptiva from the US market in 2009. Royalty expenses were 23% lower mainly due to lower sales of Tamiflu and CellCept in 2010. This was partly offset by higher royalties on Bonviva/Boniva of 176 million Swiss francs as a result of a contractual change with GlaxoSmithKline. Expenses for collaboration and profit-sharing agreements decreased by 13%. This reduction was primarily as a result of the same amended agreement with GlaxoSmithKline for Bonviva/Boniva, with expenses of 121 million Swiss francs in 2010 compared to 407 million Swiss francs in 2009. Expenses from collaboration agreements with Biogen Idec, Novartis and OSI in the US increased to 1,430 million Swiss francs (2009: 1,417 million Swiss francs). Project termination costs in the manufacturing and logistics area of 66 million Swiss francs were recorded as part of the Operational Excellence programme. The amortisation charge on marketed products in use was 28% lower in local currencies as certain acquisition intangibles were fully amortised by the end of 2009.
Pharmaceuticals Division – Cost of sales
2010 (mCHF)
2009 (mCHF)
% change (local currencies)
Manufacturing cost of goods sold and period costs (4,579) (5,008) –6Royalty expenses (1,738) (2,331) –23Collaboration and profit-sharing agreements (1,628) (1,948) –13Restructuring expenses 2 (1) –Impairment of property, plant and equipment (4) (26) –86Cost of sales – Core basis (7,947) (9,314) –12
Global restructuring – Operational Excellence (66) – –Amortisation of intangible assets (156) (221) –28Total – IFRS basis (8,169) (9,535) –12
12 Roche Finance Report 2010 Roche Group – Financial Review
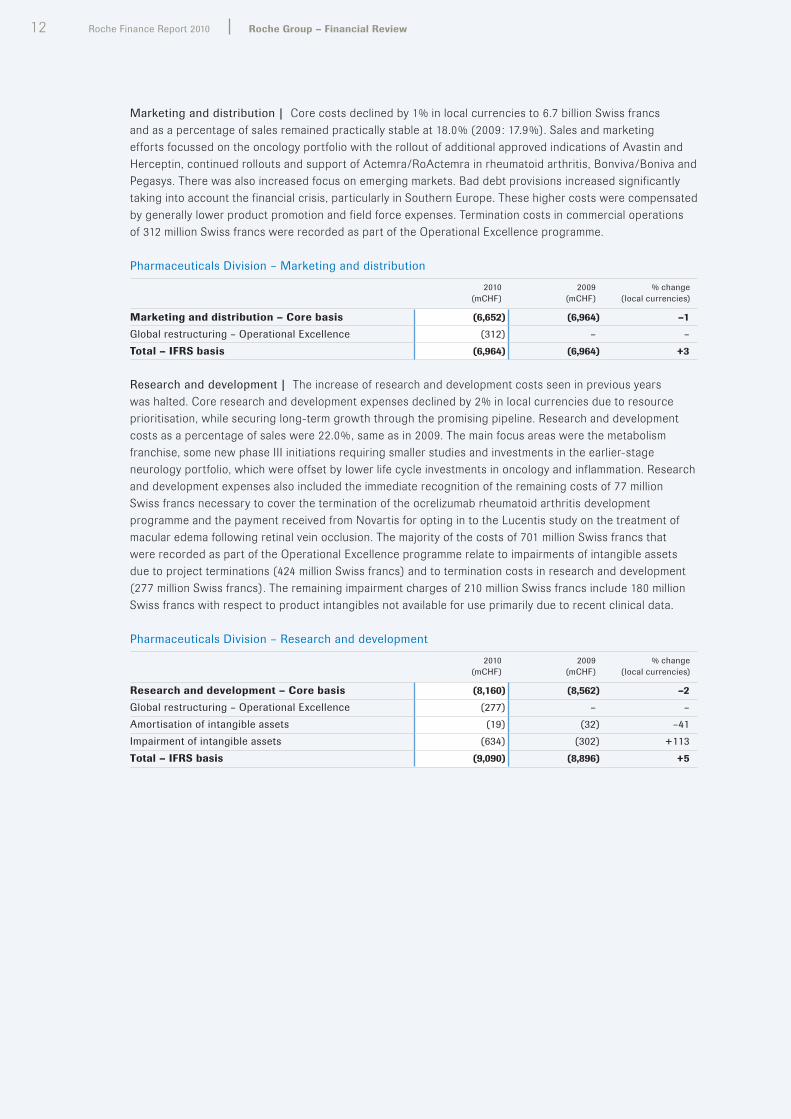
Marketing and distribution | Core costs declined by 1% in local currencies to 6.7 billion Swiss francs and as a percentage of sales remained practically stable at 18.0% (2009: 17.9%). Sales and marketing efforts focussed on the oncology portfolio with the rollout of additional approved indications of Avastin and Herceptin, continued rollouts and support of Actemra/RoActemra in rheumatoid arthritis, Bonviva/Boniva and Pegasys. There was also increased focus on emerging markets. Bad debt provisions increased significantly taking into account the financial crisis, particularly in Southern Europe. These higher costs were compensated by generally lower product promotion and field force expenses. Termination costs in commercial operations of 312 million Swiss francs were recorded as part of the Operational Excellence programme.
Pharmaceuticals Division – Marketing and distribution
2010 (mCHF)
2009 (mCHF)
% change (local currencies)
Marketing and distribution – Core basis (6,652) (6,964) –1
Global restructuring – Operational Excellence (312) – –Total – IFRS basis (6,964) (6,964) +3
Research and development | The increase of research and development costs seen in previous years was halted. Core research and development expenses declined by 2% in local currencies due to resource prioritisation, while securing long-term growth through the promising pipeline. Research and development costs as a percentage of sales were 22.0%, same as in 2009. The main focus areas were the metabolism franchise, some new phase III initiations requiring smaller studies and investments in the earlier-stage neurology portfolio, which were offset by lower life cycle investments in oncology and inflammation. Research and development expenses also included the immediate recognition of the remaining costs of 77 million Swiss francs necessary to cover the termination of the ocrelizumab rheumatoid arthritis development programme and the payment received from Novartis for opting in to the Lucentis study on the treatment of macular edema following retinal vein occlusion. The majority of the costs of 701 million Swiss francs that were recorded as part of the Operational Excellence programme relate to impairments of intangible assets due to project terminations (424 million Swiss francs) and to termination costs in research and development (277 million Swiss francs). The remaining impairment charges of 210 million Swiss francs include 180 million Swiss francs with respect to product intangibles not available for use primarily due to recent clinical data.
Pharmaceuticals Division – Research and development
2010 (mCHF)
2009 (mCHF)
% change (local currencies)
Research and development – Core basis (8,160) (8,562) –2
Global restructuring – Operational Excellence (277) – –Amortisation of intangible assets (19) (32) –41Impairment of intangible assets (634) (302) +113Total – IFRS basis (9,090) (8,896) +5

13
General and administration | Overall, core costs decreased by 14% in local currencies, driven by lower administration costs and an organisational shift effective from 1 January 2010 of certain finance, IT and communication functions to Corporate. In 2009 administration costs of 78 million Swiss francs (0.2 percentage points of sales) for these functions were included in the results of the Pharmaceuticals Division. The remaining reduction in administration costs was mainly due to synergies following the Genentech integration. The non-core costs in the general and administration area included costs of 113 million Swiss francs relating to Operational Excellence, which consists mainly of employee termination costs. Effective 26 March 2009 the Group obtained full ownership of Genentech and further continued the implementation of the reorganisation of the Group’s US Pharmaceuticals business announced on 21 July 2008. Subsequently, the Group commenced a restructuring of its Pharmaceuticals manufacturing operations, particularly in the biotech network. During 2010 further expenses of 596 million Swiss francs were incurred mainly due to site closure and employee-related costs. In the comparative period 2,415 million Swiss francs were incurred mainly for impairment of manufacturing facilities. Additional information is given in Note 8 to the Consolidated Financial Statements. The total cost of the integration and restructuring was 3.3 billion Swiss francs, which includes 2.7 billion Swiss francs that were incurred in years 2008 and 2009. Of this total of 3.3 billion Swiss francs approximately 2.0 billion Swiss francs were non-cash. Legal and environmental settlement costs were 301 million Swiss francs, a decrease of 115 million Swiss francs compared to 2009. These costs represent the current development of the various litigation and other issues. Additional information is given in Note 25 to the Consolidated Financial Statements.
Pharmaceuticals Division – General and administration
2010 (mCHF)
2009 (mCHF)
% change (local currencies)
Administration (1,110) (1,294) –12Gains (losses) on divestment of businesses – 11 –100Restructuring expenses 21 (20) –Gains (losses) on disposal of property, plant and equipment 9 (1) –Other general items 20 36 –69General and administration – Core basis (1,060) (1,268) –14
Global restructuring – Operational Excellence (113) – –Global restructuring – Genentech transaction (596) (2,415) –74Alliances and business combinations (1) (31) –97Legal and environmental settlements (301) (416) –25Total – IFRS basis (2,071) (4,130) –48
Operating free cash flowThe Pharmaceuticals Division generated a strong operating free cash flow of 12.9 billion Swiss francs. As a percentage of sales the division’s operating free cash flow decreased to 34.9% compared to 38.3% in 2009. The decrease of 9% in local currencies compared to 2009 is driven by the increase in net working capital of 0.8 billion Swiss francs which was mainly due to the payment in 2010 of some large 2009 year-end accruals. This included the payment of the employee retention/severance schemes and high royalty payments relating to the large Tamiflu sales in the second half of 2009. Third-party receivables remained at the end of 2010 at a similar level as in 2009 despite higher Days-Sales-Outstanding levels, particularly in Southern Europe. Operating profit cash adjustments decreased mainly due to the 1.1 billion Swiss francs impairments of property, plant and equipment following the Genentech transaction in the comparative period.
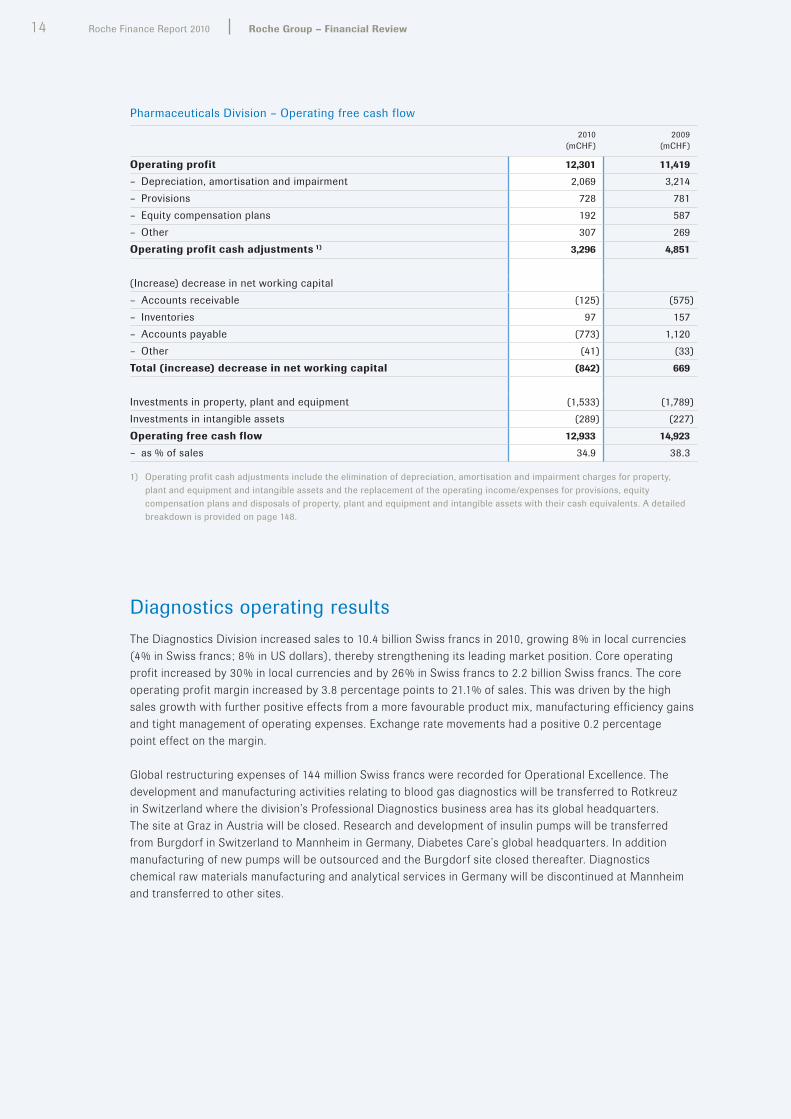
14 Roche Finance Report 2010 Roche Group – Financial Review
Pharmaceuticals Division – Operating free cash flow
2010 (mCHF)
2009 (mCHF)
Operating profit 12,301 11,419
– Depreciation, amortisation and impairment 2,069 3,214– Provisions 728 781– Equity compensation plans 192 587– Other 307 269Operating profit cash adjustments 1) 3,296 4,851
(Increase) decrease in net working capital– Accounts receivable (125) (575)– Inventories 97 157– Accounts payable (773) 1,120– Other (41) (33)Total (increase) decrease in net working capital (842) 669
Investments in property, plant and equipment (1,533) (1,789)Investments in intangible assets (289) (227)Operating free cash flow 12,933 14,923
– as % of sales 34.9 38.3
1) Operating profit cash adjustments include the elimination of depreciation, amortisation and impairment charges for property, plant and equipment and intangible assets and the replacement of the operating income/expenses for provisions, equity compensation plans and disposals of property, plant and equipment and intangible assets with their cash equivalents. A detailed breakdown is provided on page 148.
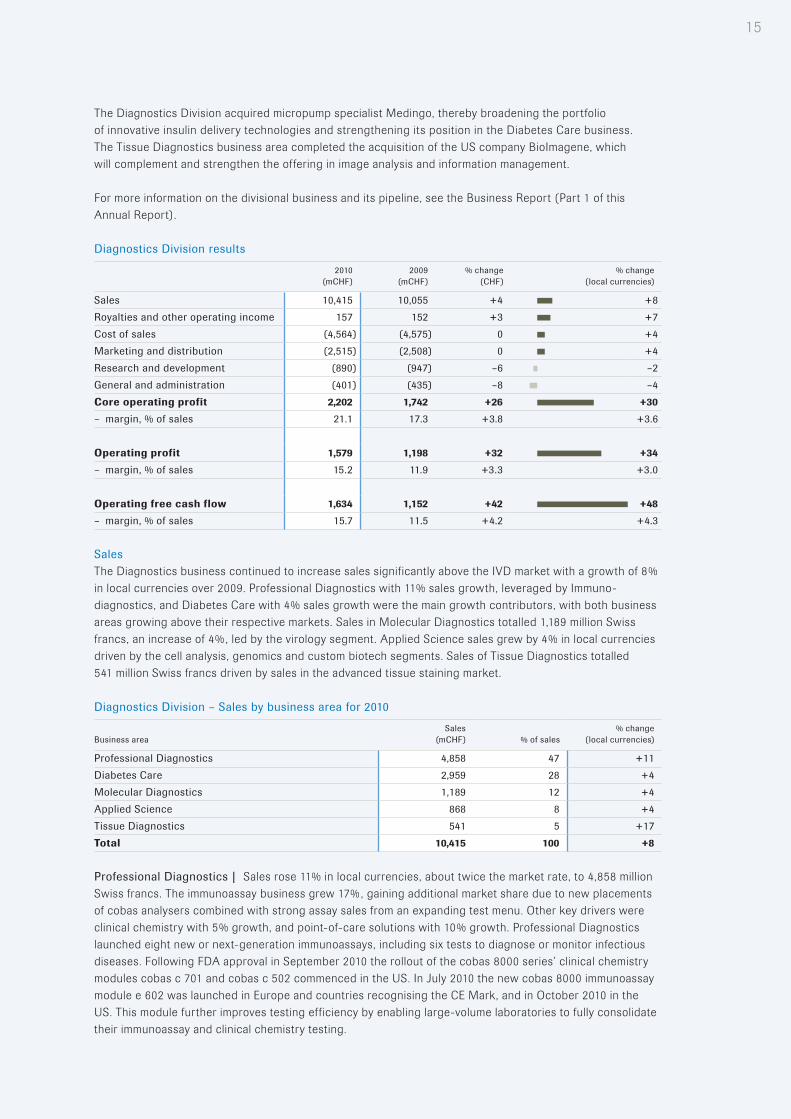
Diagnostics operating resultsThe Diagnostics Division increased sales to 10.4 billion Swiss francs in 2010, growing 8% in local currencies (4% in Swiss francs; 8% in US dollars), thereby strengthening its leading market position. Core operating profit increased by 30% in local currencies and by 26% in Swiss francs to 2.2 billion Swiss francs. The core operating profit margin increased by 3.8 percentage points to 21.1% of sales. This was driven by the high sales growth with further positive effects from a more favourable product mix, manufacturing efficiency gains and tight management of operating expenses. Exchange rate movements had a positive 0.2 percentage point effect on the margin.
Global restructuring expenses of 144 million Swiss francs were recorded for Operational Excellence. The development and manufacturing activities relating to blood gas diagnostics will be transferred to Rotkreuz in Switzerland where the division’s Professional Diagnostics business area has its global headquarters. The site at Graz in Austria will be closed. Research and development of insulin pumps will be transferred from Burgdorf in Switzerland to Mannheim in Germany, Diabetes Care’s global headquarters. In addition manufacturing of new pumps will be outsourced and the Burgdorf site closed thereafter. Diagnostics chemical raw materials manufacturing and analytical services in Germany will be discontinued at Mannheim and transferred to other sites.
15
The Diagnostics Division acquired micropump specialist Medingo, thereby broadening the portfolio of innovative insulin delivery technologies and strengthening its position in the Diabetes Care business. The Tissue Diagnostics business area completed the acquisition of the US company BioImagene, which will complement and strengthen the offering in image analysis and information management.
For more information on the divisional business and its pipeline, see the Business Report (Part 1 of this Annual Report).
Diagnostics Division results
2010 (mCHF)
2009 (mCHF)
% change (CHF)
% change (local currencies)
Sales 10,415 10,055 +4 +8Royalties and other operating income 157 152 +3 +7Cost of sales (4,564) (4,575) 0 +4Marketing and distribution (2,515) (2,508) 0 +4Research and development (890) (947) –6 –2General and administration (401) (435) –8 –4Core operating profit 2,202 1,742 +26 +30
– margin, % of sales 21.1 17.3 +3.8 +3.6
Operating profit 1,579 1,198 +32 +34
– margin, % of sales 15.2 11.9 +3.3 +3.0
Operating free cash flow 1,634 1,152 +42 +48
– margin, % of sales 15.7 11.5 +4.2 +4.3
SalesThe Diagnostics business continued to increase sales significantly above the IVD market with a growth of 8% in local currencies over 2009. Professional Diagnostics with 11% sales growth, leveraged by Immuno-diagnostics, and Diabetes Care with 4% sales growth were the main growth contributors, with both business areas growing above their respective markets. Sales in Molecular Diagnostics totalled 1,189 million Swiss francs, an increase of 4%, led by the virology segment. Applied Science sales grew by 4% in local currencies driven by the cell analysis, genomics and custom biotech segments. Sales of Tissue Diagnostics totalled 541 million Swiss francs driven by sales in the advanced tissue staining market.
Diagnostics Division – Sales by business area for 2010
Business areaSales
(mCHF) % of sales% change
(local currencies)
Professional Diagnostics 4,858 47 +11 Diabetes Care 2,959 28 +4Molecular Diagnostics 1,189 12 +4Applied Science 868 8 +4Tissue Diagnostics 541 5 +17Total 10,415 100 +8
Professional Diagnostics | Sales rose 11% in local currencies, about twice the market rate, to 4,858 million Swiss francs. The immunoassay business grew 17%, gaining additional market share due to new placements of cobas analysers combined with strong assay sales from an expanding test menu. Other key drivers were clinical chemistry with 5% growth, and point-of-care solutions with 10% growth. Professional Diagnostics launched eight new or next-generation immunoassays, including six tests to diagnose or monitor infectious diseases. Following FDA approval in September 2010 the rollout of the cobas 8000 series’ clinical chemistry modules cobas c 701 and cobas c 502 commenced in the US. In July 2010 the new cobas 8000 immunoassay module e 602 was launched in Europe and countries recognising the CE Mark, and in October 2010 in the US. This module further improves testing efficiency by enabling large-volume laboratories to fully consolidate their immunoassay and clinical chemistry testing.
16 Roche Finance Report 2010 Roche Group – Financial Review
Diabetes Care | Combined sales of blood glucose monitoring systems and insulin pumps outpaced their market, rising 4% in local currencies to 2,959 million Swiss francs. The main growth drivers were Accu-Chek Aviva /Accu-Chek Performa blood glucose monitoring systems, supported by continued market uptake of the Accu-Chek Aviva Nano /Accu-Chek Performa Nano meters and the strip-free Accu-Chek Mobile system. In the EU maltose-independent test strip chemistries received regulatory approval in June and were immediately rolled out. US and Japanese regulatory approvals for maltose-free test strip chemistries are expected in 2011, and will enable the latest additions to the Accu-Chek portfolio to be launched in these key markets. The insulin delivery business posted robust sales growth, primarily due to Accu-Chek Combo, a combined insulin pump and blood glucose monitoring system. In May 2010 Diabetes Care acquired Medingo, enhancing its portfolio with an innovative micropump to strengthen its offering in insulin delivery.
Molecular Diagnostics | Sales in local currencies increased by 4% to 1,189 million Swiss francs, with the main contribution from virology in Eastern Europe, North America and Asia–Pacific. Demand continued for the fully automated cobas 4800 system for mid- to high-throughput laboratories. The FDA approved LightCycler MRSA Advanced Test and dual PCR-target HIV Tests were successfully launched in the US. Molecular Diagnostics received CE mark certification for the cobas TaqScreen DPX Test, the first duplex test enabling simultaneous real-time detection of both parvovirus B19 and hepatitis A virus for increased safety of human plasma and plasma products. Data from the ATHENA trial assessing the utility of the cobas 4800 HPV Test in screening for cervical cancer were presented at the International Papillomavirus Conference in July 2010. The data confirmed the increased accuracy of HPV DNA testing, including 16/18 genotyping and was used to file the test with the FDA in June 2010.
Applied Science | Sales rose 4% in local currencies to 868 million Swiss francs, driven by strong growth in the cell analysis, genomics and custom biotech segments. Sales of MagNA Pure and LightCycler product lines for sample preparation and quantitative PCR analysis declined due to dramatically lower demand for influenza A (H1N1) virus testing. Cell analysis was driven by full integration of the innovatis product portfolio and continued demand for the xCELLigence Systems, including the recently launched RTCA HT Instrument for high-throughput analysis and RTCA Cardio Instrument for label-free cardiotoxicity testing. In genomics up-take of the medium-throughput benchtop GS Junior DNA sequencer was strong, enabling next-generation sequencing to thousands of research labs worldwide. Applied Science entered a partnership with IBM to develop third-generation sequencing through nanopore-based single-molecule sequencing.
Tissue Diagnostics | Sales totalled 541 million Swiss francs, up 17% in local currencies, outperforming the market in most key regions. Advanced tissue staining – immunohistochemistry (IHC) and in situ hybridisation (ISH) – continued to be the main growth driver, reflecting strong reagent sales along with continued robust uptake of the BenchMark ULTRA system for simultaneous IHC and ISH testing on a single platform. Tissue Diagnostics further expanded its advanced staining portfolio by launching 15 new antibodies to support the diagnosis of various cancers. In September 2010 the label of HER2 SISH DNA Probe was extended in Europe and other countries recognising the CE Mark to include use in assessing the likelihood of response to treatment with Herceptin in both breast and gastric cancer. Tissue Diagnostics completed the acquisition of BioImagene, a leader in digital pathology analysis and workflow, with products enabling high resolution of whole-slide digital images from glass microscope slides.
See the Business Report (Part 1 of this Annual Report) for more information on Roche’s diagnostics products and business areas.
17
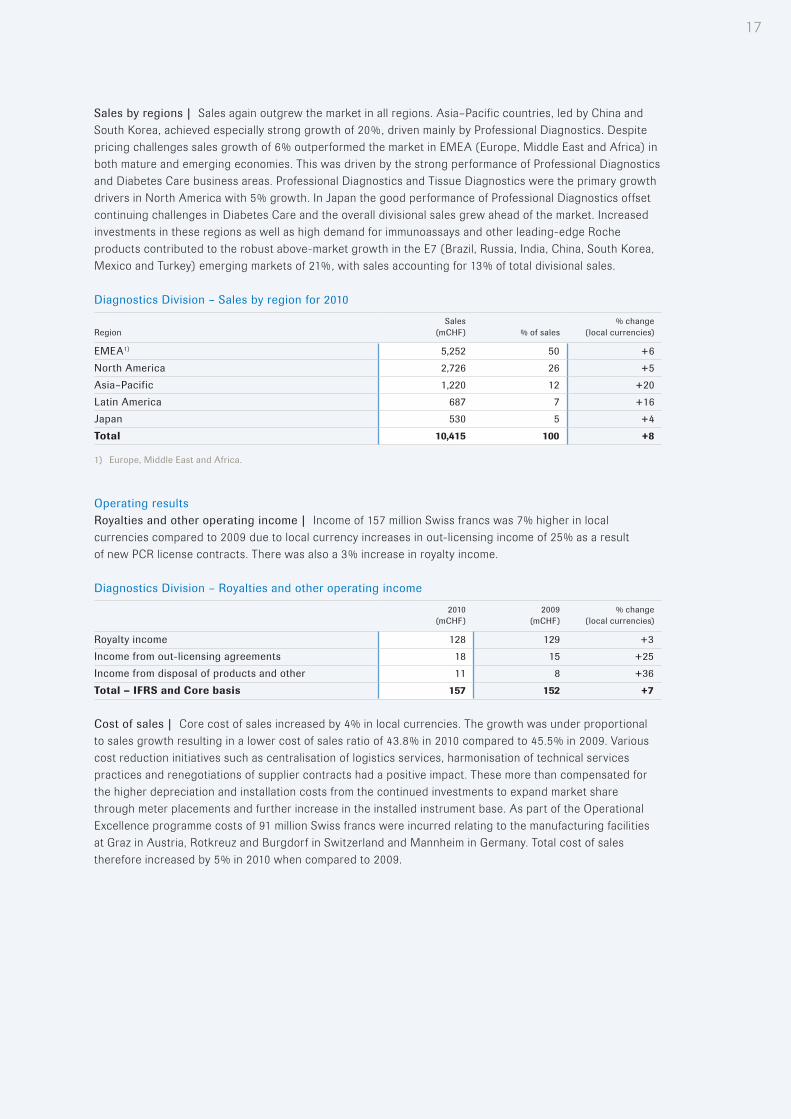
Sales by regions | Sales again outgrew the market in all regions. Asia–Pacific countries, led by China and South Korea, achieved especially strong growth of 20%, driven mainly by Professional Diagnostics. Despite pricing challenges sales growth of 6% outperformed the market in EMEA (Europe, Middle East and Africa) in both mature and emerging economies. This was driven by the strong performance of Professional Diagnostics and Diabetes Care business areas. Professional Diagnostics and Tissue Diagnostics were the primary growth drivers in North America with 5% growth. In Japan the good performance of Professional Diagnostics offset continuing challenges in Diabetes Care and the overall divisional sales grew ahead of the market. Increased investments in these regions as well as high demand for immunoassays and other leading-edge Roche products contributed to the robust above-market growth in the E7 (Brazil, Russia, India, China, South Korea, Mexico and Turkey) emerging markets of 21%, with sales accounting for 13% of total divisional sales.
Diagnostics Division – Sales by region for 2010
RegionSales
(mCHF) % of sales% change
(local currencies)
EMEA1) 5,252 50 +6North America 2,726 26 +5Asia–Pacific 1,220 12 +20Latin America 687 7 +16Japan 530 5 +4Total 10,415 100 +8
1) Europe, Middle East and Africa.
Operating resultsRoyalties and other operating income | Income of 157 million Swiss francs was 7% higher in local currencies compared to 2009 due to local currency increases in out-licensing income of 25% as a result of new PCR license contracts. There was also a 3% increase in royalty income.
Diagnostics Division – Royalties and other operating income
2010 (mCHF)
2009 (mCHF)
% change (local currencies)
Royalty income 128 129 +3Income from out-licensing agreements 18 15 +25Income from disposal of products and other 11 8 +36Total – IFRS and Core basis 157 152 +7
Cost of sales | Core cost of sales increased by 4% in local currencies. The growth was under proportional to sales growth resulting in a lower cost of sales ratio of 43.8% in 2010 compared to 45.5% in 2009. Various cost reduction initiatives such as centralisation of logistics services, harmonisation of technical services practices and renegotiations of supplier contracts had a positive impact. These more than compensated for the higher depreciation and installation costs from the continued investments to expand market share through meter placements and further increase in the installed instrument base. As part of the Operational Excellence programme costs of 91 million Swiss francs were incurred relating to the manufacturing facilities at Graz in Austria, Rotkreuz and Burgdorf in Switzerland and Mannheim in Germany. Total cost of sales therefore increased by 5% in 2010 when compared to 2009.

18 Roche Finance Report 2010 Roche Group – Financial Review
Diagnostics Division – Cost of sales
2010 (mCHF)
2009 (mCHF)
% change (local currencies)
Manufacturing cost of goods sold and period costs (4,271) (4,255) +5Royalty expenses (292) (315) –3Collaboration and profit-sharing agreements – (1) –100Impairment of property, plant and equipment (1) (4) –87 Cost of sales – Core basis (4,564) (4,575) +4
Global restructuring – Operational Excellence (91) – –Amortisation of product intangibles (436) (448) +2Impairment of product intangibles (33) (57) –42Total – IFRS basis (5,124) (5,080) +5
Marketing and distribution | The division introduced several major new products to their initial markets. The increase of 4% in local currencies mainly reflects higher costs in Professional Diagnostics and Tissue Diagnostics. Strong investments were made in EMEA and Asia–Pacific to accelerate growth in Tissue Diagnostics. On a core basis, marketing and distribution costs as a percentage of sales were 24.1% compared to 25.0% in 2009. Expenses of 5 million Swiss francs were incurred relating to Operational Excellence in marketing and distribution.
Diagnostics Division – Marketing and distribution
2010 (mCHF)
2009 (mCHF)
% change (local currencies)
Marketing and distribution – Core basis (2,515) (2,508) +4
Global restructuring – Operational Excellence (5) – –Amortisation of intangible assets (4) (3) +50Total – IFRS basis (2,524) (2,511) +4
Research and development | Core costs declined by 2% in local currencies as a result of tight cost control, in particular in Professional Diagnostics, Applied Science and Molecular Diagnostics. As a percentage of sales, research and development costs decreased from 9.4% in 2009 to 8.6% in 2010. Major programmes for 2010 included the ATHENA HPV trial and development of Maltose Independent Chemistry for the blood glucose meters. Expenses of 42 million Swiss francs were incurred relating to Operational Excellence in research and development as described above for Graz in Austria and Rotkreuz and Burgdorf in Switzerland.
Diagnostics Division – Research and development
2010 (mCHF)
2009 (mCHF)
% change (local currencies)
Research and development – Core basis (890) (947) –2
Global restructuring – Operational Excellence (42) – –Amortisation of intangible assets (4) (8) –58Impairment of intangible assets – (23) –100Total – IFRS basis (936) (978) 0
General and administration | Core general and administration costs decreased by 4% in local currencies due to lower restructuring expenses. As a percentage of sales, costs declined by 0.4 percentage points to 3.9%.

19
Diagnostics Division – General and administration
2010 (mCHF)
2009 (mCHF)
% change (local currencies)
Administration (364) (362) +5Restructuring expenses 10 (26) –Gains (losses) on disposal of property, plant and equipment – (4) –100 Other general items (47) (43) +12General and administration – Core basis (401) (435) –4
Global restructuring – Operational Excellence (6) – –Alliances and business combinations (4) – –Legal and environmental settlements 2 (5) –Total – IFRS basis (409) (440) –3
Operating free cash flowThe operating free cash flow of the Diagnostics Division of 1,634 million Swiss francs increased 48% in local currencies compared to 2009, as the strong increase in the operating profit was only partially offset by increases in net working capital. The increase in net working capital of 405 million Swiss francs was primarily due to increases in accounts receivable especially in certain European countries such as Greece, and higher inventory levels resulting from the launch of key products. As a percentage of sales, operating free cash flow of the Diagnostics Division increased to 15.7% compared to 11.5% in 2009.
Diagnostics Division – Operating free cash flow
2010 (mCHF)
2009 (mCHF)
Operating profit 1,579 1,198
– Depreciation, amortisation and impairment 1,281 1,269– Provisions 167 62– Equity compensation plans 28 29– Other 153 54Operating profit cash adjustments 1) 1,629 1,414
(Increase) decrease in net working capital– Accounts receivable (334) (319)– Inventories (202) (85)– Accounts payable 138 143– Other (7) 2Total (increase) decrease in net working capital (405) (259)
Investments in property, plant and equipment (1,119) (1,193)Investments in intangible assets (50) (8)Operating free cash flow 1,634 1,152
– as % of sales 15.7 11.5
1) Operating profit cash adjustments include the elimination of depreciation, amortisation and impairment charges for property, plant and equipment and intangible assets and the replacement of the operating income/expenses for provisions, equity compensation plans and disposals of property, plant and equipment and intangible assets with their cash equivalents. A detailed breakdown is provided on page 148.
20 Roche Finance Report 2010 Roche Group – Financial Review
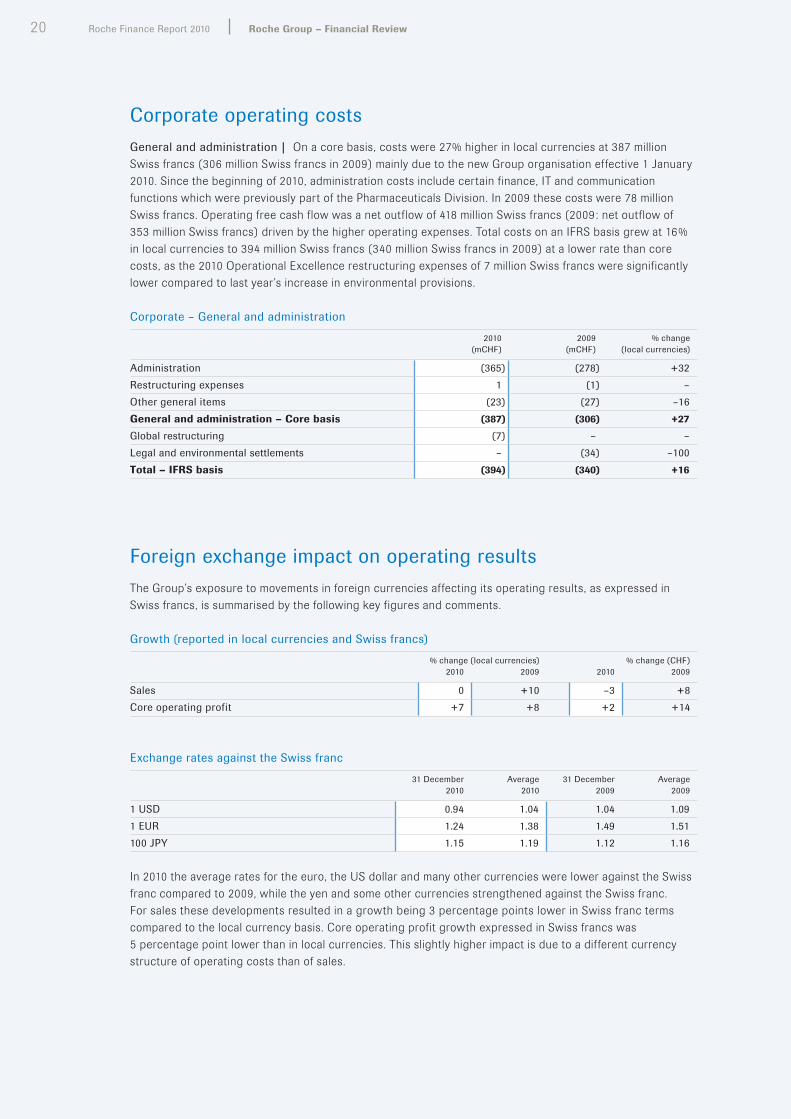
Corporate operating costsGeneral and administration | On a core basis, costs were 27% higher in local currencies at 387 million Swiss francs (306 million Swiss francs in 2009) mainly due to the new Group organisation effective 1 January 2010. Since the beginning of 2010, administration costs include certain finance, IT and communication functions which were previously part of the Pharmaceuticals Division. In 2009 these costs were 78 million Swiss francs. Operating free cash flow was a net outflow of 418 million Swiss francs (2009: net outflow of 353 million Swiss francs) driven by the higher operating expenses. Total costs on an IFRS basis grew at 16% in local currencies to 394 million Swiss francs (340 million Swiss francs in 2009) at a lower rate than core costs, as the 2010 Operational Excellence restructuring expenses of 7 million Swiss francs were significantly lower compared to last year’s increase in environmental provisions.
Corporate – General and administration
2010 (mCHF)
2009 (mCHF)
% change (local currencies)
Administration (365) (278) +32Restructuring expenses 1 (1) –Other general items (23) (27) –16General and administration – Core basis (387) (306) +27
Global restructuring (7) – –Legal and environmental settlements – (34) –100Total – IFRS basis (394) (340) +16
Foreign exchange impact on operating resultsThe Group’s exposure to movements in foreign currencies affecting its operating results, as expressed in Swiss francs, is summarised by the following key figures and comments.
Growth (reported in local currencies and Swiss francs)
% change (local currencies) % change (CHF)2010 2009 2010 2009
Sales 0 +10 –3 +8Core operating profit +7 +8 +2 +14
Exchange rates against the Swiss franc
31 December 2010
Average 2010
31 December 2009
Average 2009
1 USD 0.94 1.04 1.04 1.091 EUR 1.24 1.38 1.49 1.51100 JPY 1.15 1.19 1.12 1.16
In 2010 the average rates for the euro, the US dollar and many other currencies were lower against the Swiss franc compared to 2009, while the yen and some other currencies strengthened against the Swiss franc. For sales these developments resulted in a growth being 3 percentage points lower in Swiss franc terms compared to the local currency basis. Core operating profit growth expressed in Swiss francs was 5 percentage point lower than in local currencies. This slightly higher impact is due to a different currency structure of operating costs than of sales.

21
The sensitivity of Group sales and core operating profit in absolute terms to a 1% movement in foreign currencies against the Swiss franc during 2010 are shown in the table below.
Currency sensitivities
Impact of 1% rise in average exchange rate versus the Swiss franc
Sales (mCHF)
Core operating profit (mCHF)
US dollar 168 50Euro 119 75Japanese yen 48 17All other currencies 117 58
Non-operating resultsNon-operating results – Core basis
2010 (mCHF)
2009 (mCHF)
% change (CHF)
Operating profit 16,591 16,272 +2
Associates (3) – –Financial income 557 792 –30Financing costs (2,829) (2,460) +15Profit before taxes 14,316 14,604 –2
Income taxes (3,135) (3,287) –5Net income 11,181 11,317 –1
Attributable to– Roche shareholders 10,955 10,636 +3– Non-controlling interests 226 681 –67
Non-operating results – IFRS basis
2010 (mCHF)
2009 (mCHF)
% change (CHF)
Operating profit 13,486 12,277 +10
Associates (3) – –Financial income 557 554 +1Financing costs (2,829) (2,599) +9Profit before taxes 11,211 10,232 +10
Income taxes (2,320) (1,722) +35Net income 8,891 8,510 +4
Attributable to– Roche shareholders 8,666 7,784 +11– Non-controlling interests 225 726 –69

22 Roche Finance Report 2010 Roche Group – Financial Review
The 2010 results include a full twelve months of interest expenses for the new debt issued in 2009 to finance the Genentech transaction, compared to only nine months in 2009. The increase from the full-year effect was partly offset by lower interest expenses due to repayment of some of the bonds and notes. In 2010 there was also 255 million Swiss francs recorded as a loss on early redemption of debt. In 2010 financing costs therefore increased by 369 million Swiss francs, or 15%, to 2,829 million Swiss francs, exceeding financial income by 2,272 million Swiss francs. In addition the comparative period in 2009 included non-core financing costs of 377 million Swiss francs directly attributable to the Genentech transaction. The Group’s effective tax rate on a core basis decreased slightly to 21.9% compared to 22.5% in 2009. Net income increased by 4% driven by a strong operating performance in spite of significantly lower Tamiflu sales and by overall lower non-core items such as global restructuring charges and amortisation and impairment of intangible assets, although significant charges were already incurred in respect of the Operational Excellence initiative. On a core basis, net income decreased slightly. The core net income attributable to Roche shareholders was 3% higher compared to 2009 due to the further improving operating performance and elimination of non-controlling interests more than compensating for the higher financing costs arising from the Genentech transaction.
Net financial result – Core basis | in millions of CHF
0–1,000–2,000–3,000 1,000 2,000
(2,272)
(1,668)
236
Net financial result
2010
2009
2008
Financial incomeFinancing costs
0–1,000–2,000–3,000 1,000 2,000
Financial incomeFinancial income was 557 million Swiss francs in 2010, declining 30% compared to 2009. Interest income and income from debt securities were 64 million Swiss francs, down 71% due to decreases in interest rates on reduced debt security holdings. The net foreign exchange result was a loss of 147 million Swiss francs compared to a gain of 33 million Swiss francs in 2009, with the decline being mainly due to the currency devaluation in Venezuela. Net income from equity securities was 94 million Swiss francs compared to 36 million Swiss francs in 2009. Expected returns on pension plan assets were 562 million Swiss francs, up 11% compared to 2009, due to increases in value of the pension plan assets.
In order to execute the Genentech transaction in 2009, the Group liquidated certain debt securities into cash. This resulted in a non-core net loss of 238 million Swiss francs, which were included in the IFRS financial income in 2009.
A full analysis of financial income is given in Note 5 to the Consolidated Financial Statements.
23
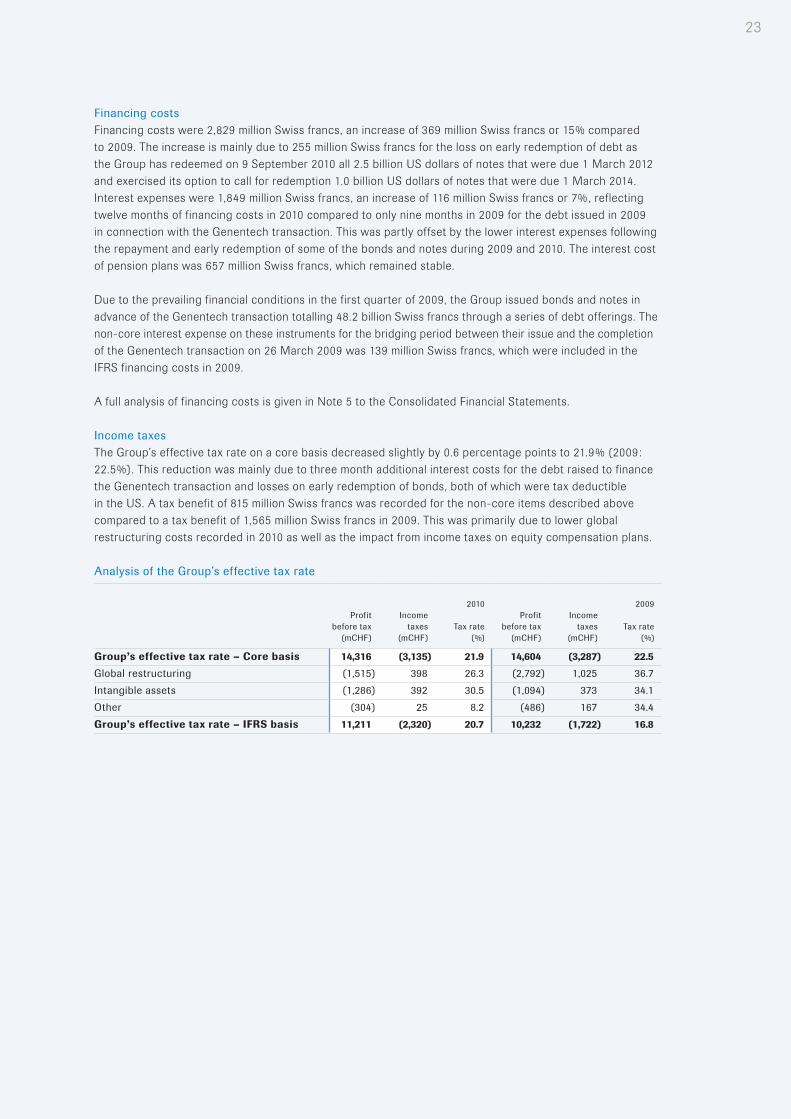
Financing costsFinancing costs were 2,829 million Swiss francs, an increase of 369 million Swiss francs or 15% compared to 2009. The increase is mainly due to 255 million Swiss francs for the loss on early redemption of debt as the Group has redeemed on 9 September 2010 all 2.5 billion US dollars of notes that were due 1 March 2012 and exercised its option to call for redemption 1.0 billion US dollars of notes that were due 1 March 2014. Interest expenses were 1,849 million Swiss francs, an increase of 116 million Swiss francs or 7%, reflecting twelve months of financing costs in 2010 compared to only nine months in 2009 for the debt issued in 2009 in connection with the Genentech transaction. This was partly offset by the lower interest expenses following the repayment and early redemption of some of the bonds and notes during 2009 and 2010. The interest cost of pension plans was 657 million Swiss francs, which remained stable.
Due to the prevailing financial conditions in the first quarter of 2009, the Group issued bonds and notes in advance of the Genentech transaction totalling 48.2 billion Swiss francs through a series of debt offerings. The non-core interest expense on these instruments for the bridging period between their issue and the completion of the Genentech transaction on 26 March 2009 was 139 million Swiss francs, which were included in the IFRS financing costs in 2009.
A full analysis of financing costs is given in Note 5 to the Consolidated Financial Statements.
Income taxesThe Group’s effective tax rate on a core basis decreased slightly by 0.6 percentage points to 21.9% (2009: 22.5%). This reduction was mainly due to three month additional interest costs for the debt raised to finance the Genentech transaction and losses on early redemption of bonds, both of which were tax deductible in the US. A tax benefit of 815 million Swiss francs was recorded for the non-core items described above compared to a tax benefit of 1,565 million Swiss francs in 2009. This was primarily due to lower global restructuring costs recorded in 2010 as well as the impact from income taxes on equity compensation plans.
Analysis of the Group’s effective tax rate
2010 2009Profit
before tax (mCHF)
Income taxes
(mCHF)Tax rate
(%)
Profit before tax
(mCHF)
Income taxes
(mCHF)Tax rate
(%)
Group’s effective tax rate – Core basis 14,316 (3,135) 21.9 14,604 (3,287) 22.5
Global restructuring (1,515) 398 26.3 (2,792) 1,025 36.7Intangible assets (1,286) 392 30.5 (1,094) 373 34.1Other (304) 25 8.2 (486) 167 34.4Group’s effective tax rate – IFRS basis 11,211 (2,320) 20.7 10,232 (1,722) 16.8

24 Roche Finance Report 2010 Roche Group – Financial Review
Net income and Earnings per share
2010
2009
2008
8.7
7.8
9.0
Net income attributable to Roche shareholders | in billions of CHF
0 2 4 6 8 10 12 0 2 4 6 8 10 12
12.78
12.34
11.17
Core EPS | in CHF
In 2010 the Group’s net income increased by 4% to 8.9 billion Swiss francs compared to 2009. This increase is due to a strong operating performance in spite of significantly lower Tamiflu sales and to overall lower non-core items such as global restructuring charges and amortisation and impairment of intangible assets. Excluding non-core items, core net income decreased slightly by 1%, and the portion attributable to Roche shareholders rose 3%.
IFRS net income attributable to Roche shareholders rose 11% to 8.7 billion Swiss francs. The comparative period included 431 million Swiss francs attributable to Genentech non-controlling interests until 25 March 2009. The Genentech transaction has a positive impact on net income attributable to Roche shareholders and earnings per share, as the synergy savings and the elimination of the allocation to non-controlling interests more than compensate for the costs of financing the transaction.
Diluted EPS
2010 (CHF)
2009 (CHF) % change
IFRS basis 10.11 9.02 +12Core 12.78 12.34 +4
The increase in diluted EPS was due to the increase in net income attributable to Roche shareholders, as described above. The Core EPS, which excludes non-core items such as global restructuring charges and amortisation and impairment of intangible assets, increased 4% in Swiss francs (10% in local currencies). Supplementary net income and EPS information is given on pages 144–147. This includes calculations of Core EPS and reconciles these to the Group’s published IFRS results.
Cash flows and net debt
2010
2009
2008
4.7
8.9
5.0
Operating free cash flow | in billions of CHF
14.1
15.7
12.4
Free cash flow | in billions of CHF
0 03 36 69 912 1215 15
25
Free cash flow
Pharmaceuticals (mCHF)
Diagnostics (mCHF)
Corporate (mCHF)
Group (mCHF)
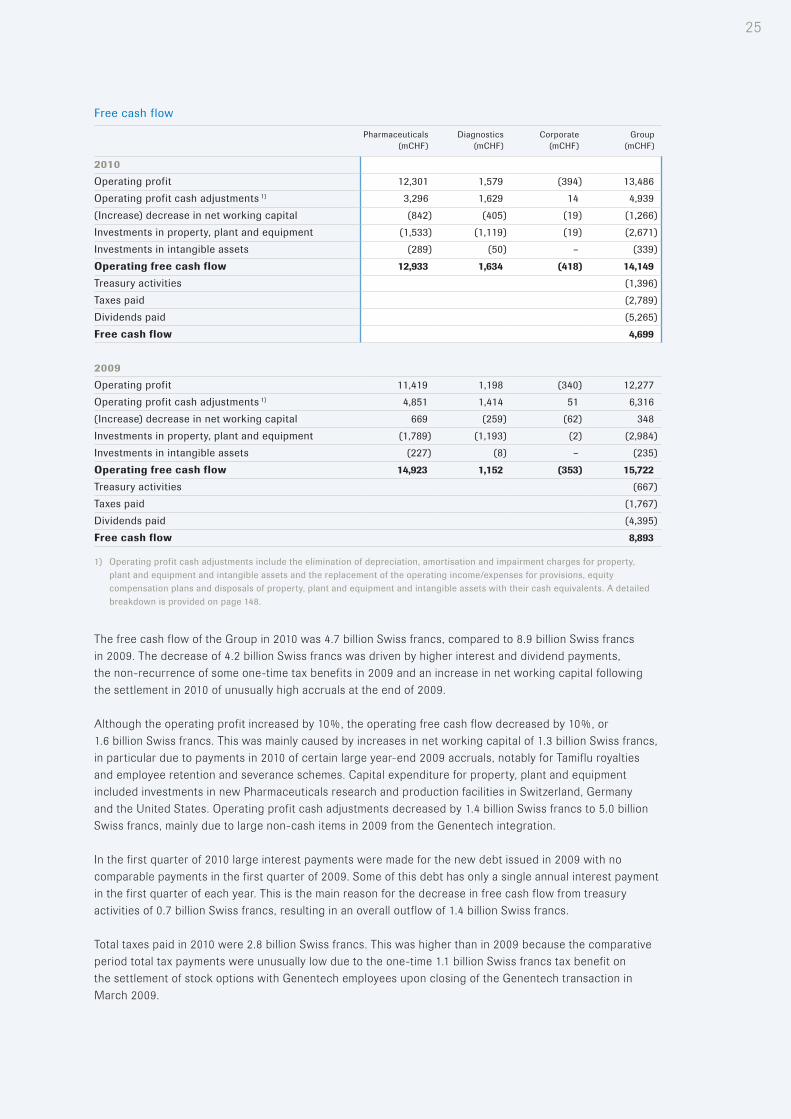
2010Operating profit 12,301 1,579 (394) 13,486Operating profit cash adjustments 1) 3,296 1,629 14 4,939(Increase) decrease in net working capital (842) (405) (19) (1,266)Investments in property, plant and equipment (1,533) (1,119) (19) (2,671)Investments in intangible assets (289) (50) – (339)Operating free cash flow 12,933 1,634 (418) 14,149
Treasury activities (1,396)Taxes paid (2,789)Dividends paid (5,265)Free cash flow 4,699
2009Operating profit 11,419 1,198 (340) 12,277Operating profit cash adjustments 1) 4,851 1,414 51 6,316(Increase) decrease in net working capital 669 (259) (62) 348Investments in property, plant and equipment (1,789) (1,193) (2) (2,984)Investments in intangible assets (227) (8) – (235)Operating free cash flow 14,923 1,152 (353) 15,722
Treasury activities (667)Taxes paid (1,767)Dividends paid (4,395)Free cash flow 8,893
1) Operating profit cash adjustments include the elimination of depreciation, amortisation and impairment charges for property, plant and equipment and intangible assets and the replacement of the operating income/expenses for provisions, equity compensation plans and disposals of property, plant and equipment and intangible assets with their cash equivalents. A detailed breakdown is provided on page 148.
The free cash flow of the Group in 2010 was 4.7 billion Swiss francs, compared to 8.9 billion Swiss francs in 2009. The decrease of 4.2 billion Swiss francs was driven by higher interest and dividend payments, the non-recurrence of some one-time tax benefits in 2009 and an increase in net working capital following the settlement in 2010 of unusually high accruals at the end of 2009.
Although the operating profit increased by 10%, the operating free cash flow decreased by 10%, or 1.6 billion Swiss francs. This was mainly caused by increases in net working capital of 1.3 billion Swiss francs, in particular due to payments in 2010 of certain large year-end 2009 accruals, notably for Tamiflu royalties and employee retention and severance schemes. Capital expenditure for property, plant and equipment included investments in new Pharmaceuticals research and production facilities in Switzerland, Germany and the United States. Operating profit cash adjustments decreased by 1.4 billion Swiss francs to 5.0 billion Swiss francs, mainly due to large non-cash items in 2009 from the Genentech integration.
In the first quarter of 2010 large interest payments were made for the new debt issued in 2009 with no comparable payments in the first quarter of 2009. Some of this debt has only a single annual interest payment in the first quarter of each year. This is the main reason for the decrease in free cash flow from treasury activities of 0.7 billion Swiss francs, resulting in an overall outflow of 1.4 billion Swiss francs.
Total taxes paid in 2010 were 2.8 billion Swiss francs. This was higher than in 2009 because the comparative period total tax payments were unusually low due to the one-time 1.1 billion Swiss francs tax benefit on the settlement of stock options with Genentech employees upon closing of the Genentech transaction in March 2009.

26 Roche Finance Report 2010 Roche Group – Financial Review
Total dividends paid in 2010 were 5.3 billion Swiss francs, an increase of 0.9 billion Swiss francs compared to 2009, reflecting the 20% increase of the Roche Group dividend for the year 2009.
Net debt | in millions of CHF
31 December 2009
Cash and cash equivalents 2,442Marketable securities 16,107Long-term debt (36,143)Short-term debt (6,273)Net debt at beginning of period (23,867)
Free cash flow for 2010 4,699Transactions in own equity instruments (696)Business combinations, net of divestments of subsidiaries (504)Hedging and collateral arrangements (1,717)Currency translation, fair value and other movements 2,928Change in net debt 4,710
31 December 2010Cash and cash equivalents 1,841Marketable securities 9,060Long-term debt (27,857)Short-term debt (2,201)Net debt at end of period (19,157)
The net debt position of the Group was 19.2 billion Swiss francs at the end of 2010, a decrease of 4.7 billion Swiss francs from 31 December 2009. This was mainly due to the free cash flow of 4.7 billion Swiss francs described above. An outflow of 0.7 billion Swiss francs came mainly from transactions in own equity instruments which were executed to cover the exposure from equity compensation plans issued to employees. In addition 0.5 billion Swiss francs were paid in business combinations, mainly for Marcadia. The net debt position improved also due to a translation gain of 2.9 billion Swiss francs on consolidation of the total debt in the Group’s US affiliates due to a stronger Swiss franc compared to US dollar. This improvement was partially offset by payments to the Group of 1.7 billion Swiss francs during 2010 from the hedging and collateral arrangements, which were set up following the financing of the Genentech transaction (see below).
The Group entered into derivative contracts in 2009 with third parties to hedge the foreign exchange risk arising from bonds and notes issued in currencies other than US dollar. The total exposure hedged at issuance of these bonds and notes was approximately 25 billion Swiss francs (see Note 27 to the Consolidated Financial Statements). Collateral agreements were entered into with the derivative counterparties to mitigate counterparty risk. As the fair value of the derivative instruments went down due to the strengthening of the US dollar against the euro during 2010, cash collateral of 1.4 billion Swiss francs was delivered by Roche. This decreased the 31 December 2009 cash collateral balance in favour of Roche of 1.5 billion Swiss francs to 0.1 billion Swiss francs at 31 December 2010. The collateral balance in relation to the hedges on the non-US dollar-denominated bonds and notes is mainly sensitive to the foreign exchange rate between the US dollar and the euro, but also to the Swiss franc and pound sterling. Currently the collateral balance moves by approximately 180 million US dollars if all of these foreign exchange rates move by 1% simultaneously. Collateral volatility will decrease to less than 80 million US dollars for each 1% movement in foreign exchange rates by mid-2013 as the non-US dollar-denominated bonds and notes will be repaid. The realised loss on derivatives in 2010 was 0.3 billion Swiss francs and relates mainly to hedges on the non-US dollar-denominated bonds and notes.
27
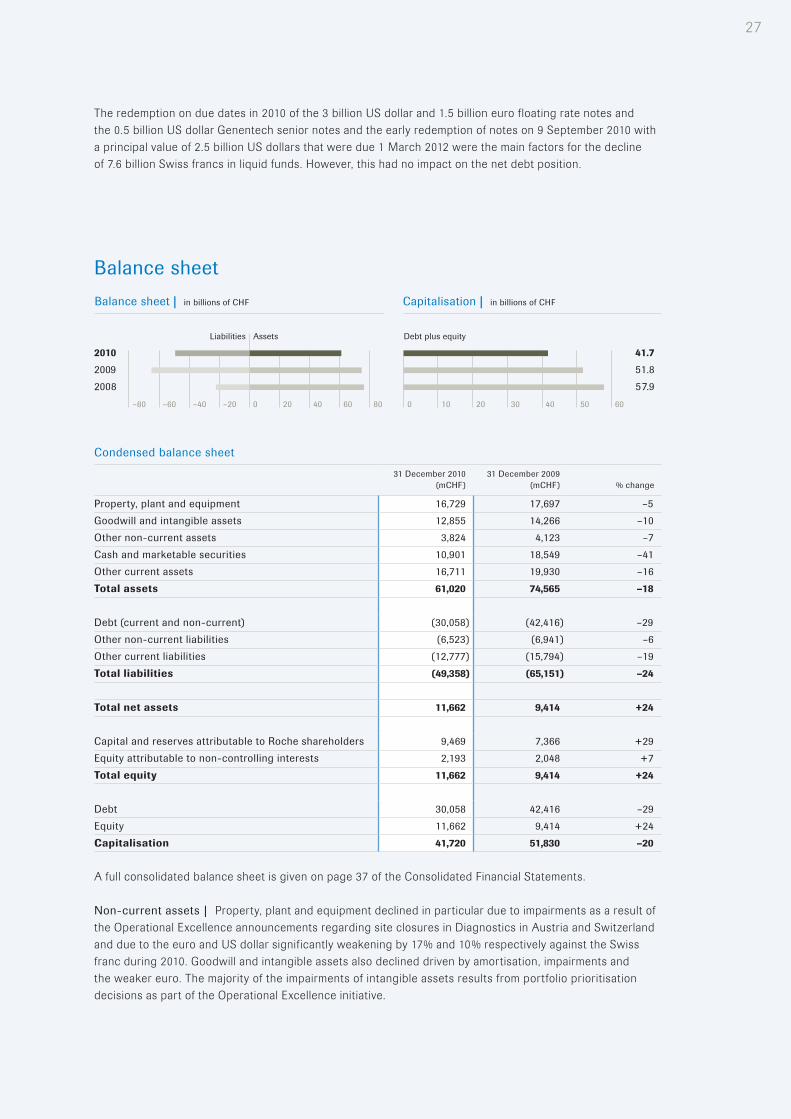
The redemption on due dates in 2010 of the 3 billion US dollar and 1.5 billion euro floating rate notes and the 0.5 billion US dollar Genentech senior notes and the early redemption of notes on 9 September 2010 with a principal value of 2.5 billion US dollars that were due 1 March 2012 were the main factors for the decline of 7.6 billion Swiss francs in liquid funds. However, this had no impact on the net debt position.
Balance sheet
2010
2009
2008
Balance sheet | in billions of CHF
AssetsLiabilities
0–20–40–60–80 20 40 60 80
41.7
51.8
57.9
Debt plus equity
0 2010 30 40 50 60
Capitalisation | in billions of CHF
Condensed balance sheet
31 December 2010 (mCHF)
31 December 2009 (mCHF) % change
Property, plant and equipment 16,729 17,697 –5Goodwill and intangible assets 12,855 14,266 –10Other non-current assets 3,824 4,123 –7Cash and marketable securities 10,901 18,549 –41Other current assets 16,711 19,930 –16Total assets 61,020 74,565 –18
Debt (current and non-current) (30,058) (42,416) –29Other non-current liabilities (6,523) (6,941) –6Other current liabilities (12,777) (15,794) –19Total liabilities (49,358) (65,151) –24
Total net assets 11,662 9,414 +24
Capital and reserves attributable to Roche shareholders 9,469 7,366 +29Equity attributable to non-controlling interests 2,193 2,048 +7Total equity 11,662 9,414 +24
Debt 30,058 42,416 –29Equity 11,662 9,414 +24Capitalisation 41,720 51,830 –20
A full consolidated balance sheet is given on page 37 of the Consolidated Financial Statements.
Non-current assets | Property, plant and equipment declined in particular due to impairments as a result of the Operational Excellence announcements regarding site closures in Diagnostics in Austria and Switzerland and due to the euro and US dollar significantly weakening by 17% and 10% respectively against the Swiss franc during 2010. Goodwill and intangible assets also declined driven by amortisation, impairments and the weaker euro. The majority of the impairments of intangible assets results from portfolio prioritisation decisions as part of the Operational Excellence initiative.

28 Roche Finance Report 2010 Roche Group – Financial Review
Current assets | Accounts receivable and inventories increased only moderately in local currencies, with the weakening of the euro having an impact on the overall balances in Swiss francs. The carrying value of derivative assets decreased by 1.3 billion Swiss francs, consistent with the decrease in the carrying value of the debt that they are hedging. Cash and marketable securities declined by 41% as described in the cash flows and net debt commentary above.
Debt | The carrying value of debt, mainly from the financing of the Genentech transaction, decreased by 29% to 30.1 billion Swiss francs. This reduction reflects the redemption on due dates 2010 of the 3 billion US dollar and 1.5 billion euro floating rate notes, the 0.5 billion US dollar Genentech senior notes and the early redemption on 9 September 2010 of 2.5 billion US dollars of notes that were due 1 March 2012. A detailed reconciliation of the debt movements is provided in Note 27 to the Consolidated Financial Statements.
Other non-current and current liabilities | The overall balance decreased by 3.4 billion Swiss francs mainly due to the repayment of 1.4 billion Swiss francs of collateral payable as the fair value of the derivatives declined. In addition accounts payable and other accrued liabilities decreased by 3.1 billion Swiss francs due to the payment in 2010 of accrued royalties, notably in respect of Tamiflu sales in the second half of 2009, and accrued employee retention/severance schemes.
Total net assets/equity | The most significant movements in equity were the net income of 8.9 billion Swiss francs and the dividend payments of 5.3 billion Swiss francs. Overall capitalisation, being total debt plus equity, declined by 20%. Debt was significantly lower due to repayments and equity was higher as the net income more than offset the dividend. At the end of 2010 equity made up 28% of the capitalisation compared to 18% a year previously.
DebtTo finance the Genentech transaction, the Group issued bonds and notes equivalent to 48.2 billion Swiss francs in February and March 2009. Of the bonds and notes raised in early 2009, roughly 33% had already been repaid by 31 December 2010. This includes the early redemption of notes on 9 September 2010 with a principal value of 2.5 billion US dollars that were due 1 March 2012.
In addition on 28 December 2010 the Group resolved to exercise its option to call for redemption a portion of the US dollar 5.00% fixed rate notes due 1 March 2014. Of the total principal amount of 2.75 billion US dollars, 1.0 billion US dollars will be redeemed on 24 March 2011. This portion of the notes is shown as due in 2011 in the table below.
The maturity schedule of the Group’s bonds and notes outstanding at 31 December 2010 is shown in the table below, which includes those instruments that were already in issue prior to the Genentech transaction.

29
Bonds and notes: nominal amounts at 31 December 2010 by contractual maturity
US dollar principal (mUSD)
Euro principal
(mEUR)
UK Sterling principal (mGBP)
Swiss franc principal (mCHF)
Total 1) (mUSD)
Total 1) (mCHF)
2011 1,931 – – – 1,931 1,8072012 – – – 2,500 2) 2,672 2,5002013 – 5,250 2) – – 6,974 6,5242014 1,750 – – – 1,750 1,6372015 1,000 – 1,250 2) – 2,928 2,7392016–2020 4,500 2,750 2) – 1,500 9,756 9,1272021 and beyond 3,000 1,750 2) 250 – 5,710 5,342Total 12,181 9,750 1,500 4,000 31,721 29,676
1) Total translated at 31 December 2010 exchange rates.2) The proceeds from these bonds and notes were swapped into US dollars, and therefore in the financial statements the bonds and
notes have economic characteristics equivalent to US dollar-denominated bonds and notes.
The Group plans to meet its debt obligations using existing liquid funds as well as cash generated from the ongoing business. In 2010 the free cash flow was 4.7 billion Swiss francs, which includes the cash generated from operations, as well as payment of interest, tax and dividends. In the second half of 2010 free cash flow was an inflow of 6.3 billion Swiss francs, while in the first half of 2010 free cash flow was an outflow of 1.6 billion Swiss francs, which included 5.2 billion Swiss francs used for the payment of the annual dividend.
For short-term financing requirements, the Group has a commercial paper programme in the United States under which it can issue up to 7.5 billion US dollars of unsecured commercial paper notes and committed credit lines of 2.5 billion euros and 950 million US dollars available as back-stop lines. Commercial paper notes totalling 0.2 billion US dollars were outstanding as of 31 December 2010. For longer-term financing the Group maintains strong long-term investment-grade credit ratings of AA– by Standard & Poor’s and A2 by Moody’s which should facilitate efficient access to international capital markets.
As described above in the commentary on the net debt position, in 2009 the Group entered into derivative contracts with third parties to hedge the foreign exchange risk arising from bonds and notes issued in currencies other than US dollar. At the same time collateral agreements were entered into with the derivative counterparties to mitigate counterparty risk.
Pensions and other post-employment benefitsPost-employment benefit plans are classified as ‘defined contribution plans’ if the Group pays fixed contributions into a separate fund or to a third-party financial institution and will have no further legal or constructive obligation to pay further contributions. In 2010 expenses for the Group’s defined contribution plans were 305 million Swiss francs (2009: 295 million Swiss francs).
All other plans are classified as ‘defined benefit plans’, even if the Group’s potential obligation is minor or has a relatively remote possibility of arising. The funding and asset management of the Group’s various defined benefit plans is overseen at a corporate level. Plans are usually established as trusts independent of the Group and are funded by payments from the Group and by employees, but in some cases the plan is unfunded and the Group pays pensions to retired employees directly from its own financial resources.

30 Roche Finance Report 2010 Roche Group – Financial Review
Funding status of defined benefit pension and other post-employment benefit plans
2010 (mCHF)
2009 (mCHF)
Funded plans– Fair value of plan assets 10,667 10,530– Defined benefit obligation (11,464) (11,267)– Over (under) funding (797) (737)
Unfunded plans– Defined benefit obligation (3,080) (3,486)
Funding status | Overall the funding status of the Group’s defined benefit plans was stable at 93%. The main movements came from an increase in the fair value of plan assets, which recovered in 2010, offset by an increase in the defined benefit obligation arising from a decrease in discount rates. The Group continues to closely monitor the funded status of its major pension funds. In addition to some cash injections, the Group has initiated plan changes in several local pension plans, with, for example, some of the major pension funds removing early retirement incentives. The Group continues to introduce more flexible retirement models in anticipation of an ageing workforce.
Expenses recorded in income statement | Total pension expenses in 2010 relating to the Group’s defined benefit plans were 330 million Swiss francs compared to 464 million Swiss francs in 2009. The decrease of 29% is primarily due to a higher expected return on plan assets arising mainly as a consequence of a higher asset base at the start of 2010. In addition there were curtailment gains of 95 million Swiss francs in 2010 compared to 48 million Swiss francs in 2009. Based on the revised actuarial assumptions at the end of 2010, total pension expenses for 2011 are expected to be broadly stable compared to 2010, excluding curtailment effects.
Full details of the Group’s pensions and other post-employment benefits are given in Note 10 to the Consolidated Financial Statements.
Roche securitiesShare price and market capitalisation (at 31 December)
2010 2009 % change
Share price (CHF) 142.80 181.00 –21Non-voting equity security (Genussschein) price (CHF) 137.00 175.80 –22Market capitalisation (billions of CHF) 118 151 –22
Roche ranked number 16 among a peer group of 18 healthcare companies 1) as listed below, in terms of Total Shareholder Return (TSR), i.e. share price growth plus dividends, in 2010 when measured in Swiss francs at actual exchange rates. Year-end return was –19% for the Roche share and –19% for the Roche non-voting equity security. The combined performance of share and non-voting equity security was –19% compared to a weighted average return for the peer group of –10% at actual exchange rates.
1) Peer group for 2010: Abbott Laboratories, Amgen, Astellas, AstraZeneca, Bayer, Becton Dickinson, Biogen Idec, Bristol-Myers Squibb, Eli Lilly, Gilead, GlaxoSmithKline, Johnson & Johnson, Merck & Co., Novartis, Pfizer, Roche, Sanofi-Aventis, Takeda.

31
75
80
85
90
95
100
105
110
115
Roche share Roche GS Peer Set Index
Total Shareholder Return development | in %
31 Dec. 09 31 March 10 30 June 10 30 Sept. 10 31 Dec. 10
Proposed dividendThe Board of Directors is proposing an increase of 10% in the dividend for 2010 to 6.60 Swiss francs per share and non-voting equity security (2009: 6.00 Swiss francs) for approval at the Annual General Meeting. This is the 24th consecutive increase in the dividend. If the dividend proposal is approved by shareholders, dividend payments on the shares and non-voting equity securities in issue will amount to 5.7 billion Swiss francs (2009: 5.2 billion Swiss francs), resulting in a payout ratio (based on core net income) of 52% (2009: 49%). Based on the prices at year-end 2010, the dividend yield on the Roche share is 4.6% (2009: 3.3%) and the yield on the non-voting equity security is 4.8% (2009: 3.4%). Further information on the Roche securities is given on pages 149–150 of the Finance Report
Information per share and non-voting equity security
2010 (CHF)
2009 (CHF) % change
Basic EPS 10.14 9.07 +12Diluted EPS 10.11 9.02 +12Core EPS 12.78 12.34 +4Equity attributable to Roche shareholders per share 11.12 8.61 +29Dividend per share 6.60 6.00 +10
For further details please refer to Notes 28 and 29 of the Consolidated Financial Statements and pages 144–147 of the Finance Report. Payout ratio is calculated as dividend per share divided by core earnings per share.
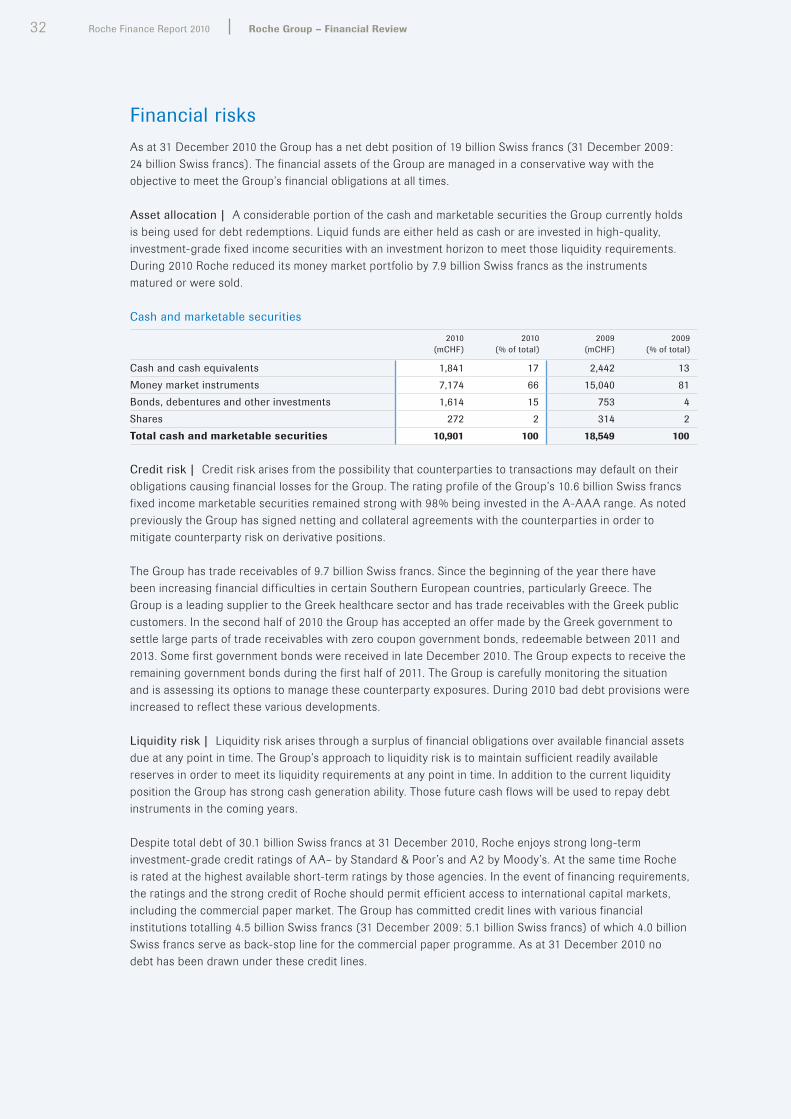
32 Roche Finance Report 2010 Roche Group – Financial Review
Financial risksAs at 31 December 2010 the Group has a net debt position of 19 billion Swiss francs (31 December 2009: 24 billion Swiss francs). The financial assets of the Group are managed in a conservative way with the objective to meet the Group’s financial obligations at all times.
Asset allocation | A considerable portion of the cash and marketable securities the Group currently holds is being used for debt redemptions. Liquid funds are either held as cash or are invested in high-quality, investment-grade fixed income securities with an investment horizon to meet those liquidity requirements. During 2010 Roche reduced its money market portfolio by 7.9 billion Swiss francs as the instruments matured or were sold.
Cash and marketable securities
2010 (mCHF)
2010 (% of total)
2009 (mCHF)
2009 (% of total)
Cash and cash equivalents 1,841 17 2,442 13Money market instruments 7,174 66 15,040 81Bonds, debentures and other investments 1,614 15 753 4Shares 272 2 314 2Total cash and marketable securities 10,901 100 18,549 100
Credit risk | Credit risk arises from the possibility that counterparties to transactions may default on their obligations causing financial losses for the Group. The rating profile of the Group’s 10.6 billion Swiss francs fixed income marketable securities remained strong with 98% being invested in the A-AAA range. As noted previously the Group has signed netting and collateral agreements with the counterparties in order to mitigate counterparty risk on derivative positions.
The Group has trade receivables of 9.7 billion Swiss francs. Since the beginning of the year there have been increasing financial difficulties in certain Southern European countries, particularly Greece. The Group is a leading supplier to the Greek healthcare sector and has trade receivables with the Greek public customers. In the second half of 2010 the Group has accepted an offer made by the Greek government to settle large parts of trade receivables with zero coupon government bonds, redeemable between 2011 and 2013. Some first government bonds were received in late December 2010. The Group expects to receive the remaining government bonds during the first half of 2011. The Group is carefully monitoring the situation and is assessing its options to manage these counterparty exposures. During 2010 bad debt provisions were increased to reflect these various developments.
Liquidity risk | Liquidity risk arises through a surplus of financial obligations over available financial assets due at any point in time. The Group’s approach to liquidity risk is to maintain sufficient readily available reserves in order to meet its liquidity requirements at any point in time. In addition to the current liquidity position the Group has strong cash generation ability. Those future cash flows will be used to repay debt instruments in the coming years.
Despite total debt of 30.1 billion Swiss francs at 31 December 2010, Roche enjoys strong long-term investment-grade credit ratings of AA– by Standard & Poor’s and A2 by Moody’s. At the same time Roche is rated at the highest available short-term ratings by those agencies. In the event of financing requirements, the ratings and the strong credit of Roche should permit efficient access to international capital markets, including the commercial paper market. The Group has committed credit lines with various financial institutions totalling 4.5 billion Swiss francs (31 December 2009: 5.1 billion Swiss francs) of which 4.0 billion Swiss francs serve as back-stop line for the commercial paper programme. As at 31 December 2010 no debt has been drawn under these credit lines.

33
Market risks | Market risk arises from changing market prices of the Group’s financial assets or financial liabilities. The exposures are predominantly related to changes in interest rates, foreign exchange rates and equity prices. The Group uses Value-at-Risk (VaR) to assess the impact of market risk on its financial instruments. VaR data indicates the value range within which a given financial instrument will f luctuate with a pre-set probability as a result of movements in market prices. The VaR data in the table below indicates the economic loss level over a period of one month which with 95% probability will not be exceeded. Actual future economic gains and losses associated with our treasury activities may differ materially from the VaR analyses performed due to the inherent limitations associated with predicting the timing and amount of changes to interest rates, foreign currency exchanges rates and equity investment prices, particularly in periods of high market volatilities. Furthermore, the VaR numbers below do not include a credit risk component.
Market risk of financial instruments
31 December 2010 (mCHF)
31 December 2009 (mCHF)
VaR – Interest rate component 466 717VaR – Foreign exchange component 44 43VaR – Other price component 34 57Diversification (77) (98)VaR – Total 467 719
At 31 December 2010 the total VaR of the financial assets and liabilities was 467 million Swiss francs (31 December 2009: 719 million Swiss francs). The interest rate VaR decreased to 466 million Swiss francs reflecting the ageing of debt, the repayment of debt during 2010 and a higher duration of fixed income assets held. As all issued debt is held at amortised cost, the interest rate VaR is a sole metric for economic fair value changes, but there is no impact on the carrying value or profit and loss of the Group. The foreign exchange VaR basically remained stable. Other price risk arises mainly from movements in the prices of equity securities and declined as equity securities holdings were reduced. At 31 December 2010 the Group held equity securities with a market value of 0.5 billion Swiss francs (31 December 2009: 0.6 billion Swiss francs). This includes holdings in biotechnology companies which were acquired in the context of licensing transactions or scientific collaborations.
Further information on financial risk management and financial risks and the VaR methodology is included in Note 32 to the Consolidated Financial Statements.
International Financial Reporting StandardsThe Roche Group has been using International Financial Reporting Standards (IFRS) to report its consolidated results since 1990. In 2008 the Group early adopted the revised versions of IFRS 3 ‘Business Combinations’ and IAS 27 ‘Consolidated and Separate Financial Statements’, which were required to be implemented from 1 January 2010 at the latest. The Group has also implemented various other amendments to existing standards and interpretations, which have no material impact on the Group’s overall results and financial position.
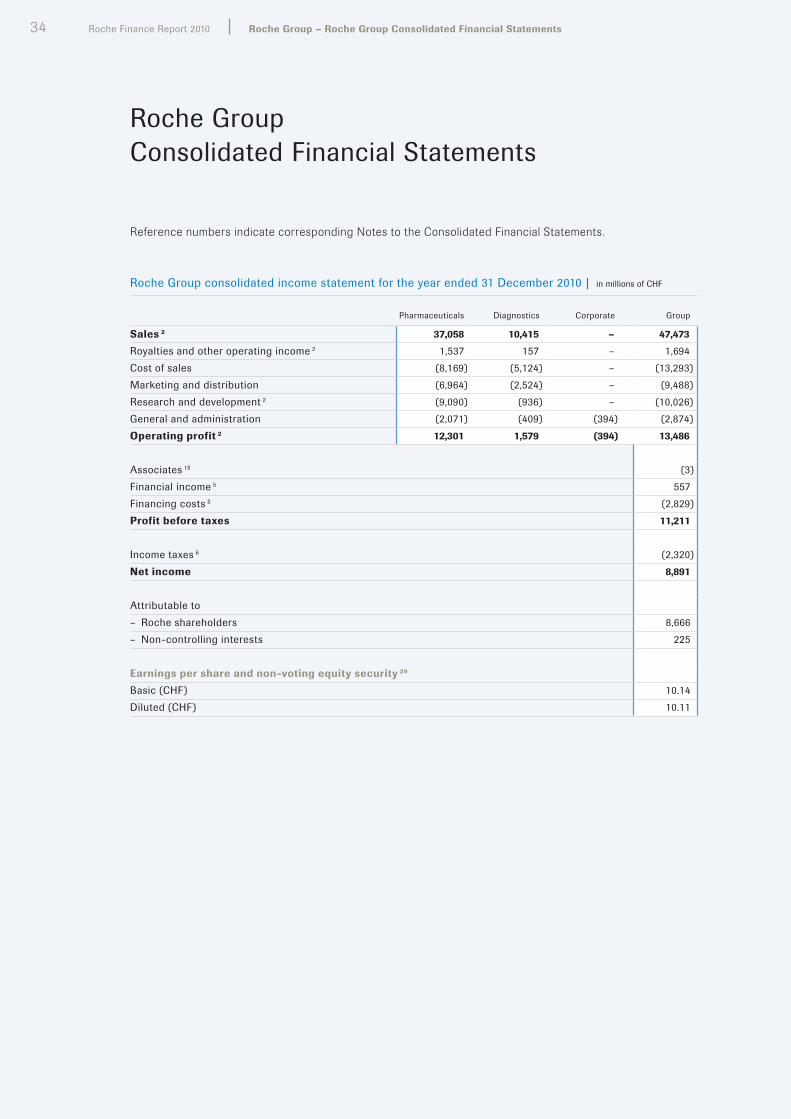
34 Roche Finance Report 2010 Roche Group – Roche Group Consolidated Financial Statements
Roche Group Consolidated Financial Statements
Reference numbers indicate corresponding Notes to the Consolidated Financial Statements.
Roche Group consolidated income statement for the year ended 31 December 2010 | in millions of CHF
Pharmaceuticals Diagnostics Corporate Group
Sales 2 37,058 10,415 – 47,473
Royalties and other operating income 2 1,537 157 – 1,694Cost of sales (8,169) (5,124) – (13,293)Marketing and distribution (6,964) (2,524) – (9,488)Research and development 2 (9,090) (936) – (10,026)General and administration (2,071) (409) (394) (2,874)Operating profit 2 12,301 1,579 (394) 13,486
Associates 15 (3)Financial income 5 557Financing costs 5 (2,829)Profit before taxes 11,211
Income taxes 6 (2,320)Net income 8,891
Attributable to– Roche shareholders 8,666– Non-controlling interests 225
Earnings per share and non-voting equity security 29
Basic (CHF) 10.14Diluted (CHF) 10.11

35
Roche Group consolidated income statement for the year ended 31 December 2009 | in millions of CHF
Pharmaceuticals Diagnostics Corporate Group
Sales 2 38,996 10,055 – 49,051
Royalties and other operating income 2 1,948 152 – 2,100Cost of sales (9,535) (5,080) – (14,615)Marketing and distribution (6,964) (2,511) – (9,475)Research and development 2 (8,896) (978) – (9,874)General and administration (4,130) (440) (340) (4,910)Operating profit 2 11,419 1,198 (340) 12,277
Associates 15 –Financial income 5 554Financing costs 5 (2,599)Profit before taxes 10,232
Income taxes 6 (1,722)Net income 8,510
Attributable to– Roche shareholders 7,784– Non-controlling interests 726
Earnings per share and non-voting equity security 29
Basic (CHF) 9.07Diluted (CHF) 9.02
As disclosed in Note 1, the income statement for 2009 has been restated following the accounting policy changes which were adopted in 2010. A reconciliation to the previously published income statement is provided in Note 1.

36 Roche Finance Report 2010 Roche Group – Roche Group Consolidated Financial Statements
Roche Group consolidated statement of comprehensive income | in millions of CHF
Year ended 31 December2010 2009
Net income recognised in income statement 8,891 8,510
Other comprehensive incomeAvailable-for-sale investments 28 17 355Cash flow hedges 28 (193) 75Currency translation of foreign operations 28 (498) 3,054Defined benefit post-employment plans 28 (266) (5)Other comprehensive income, net of tax (940) 3,479
Total comprehensive income 7,951 11,989
Attributable to– Roche shareholders 28 7,714 10,911– Non-controlling interests 30 237 1,078Total 7,951 11,989

37
Roche Group consolidated balance sheet | in millions of CHF
31 December 2010
31 December 2009
31 December 2008
Non-current assetsProperty, plant and equipment 12 16,729 17,697 18,190Goodwill 13 7,722 8,261 8,353Intangible assets 14 5,133 6,005 7,121Associates 15 13 16 9Financial long-term assets 16 428 481 940Other long-term assets 16 456 452 451Deferred income tax assets 6 2,368 2,573 1,829Post-employment benefit assets 10 559 601 592Total non-current assets 33,408 36,086 37,485
Current assetsInventories 17 4,972 5,648 5,830Accounts receivable 18 9,403 10,461 9,755Current income tax assets 6 168 244 268Other current assets 19 2,168 3,577 1,980Marketable securities 20 9,060 16,107 15,856Cash and cash equivalents 21 1,841 2,442 4,915Total current assets 27,612 38,479 38,604
Total assets 61,020 74,565 76,089
Non-current liabilitiesLong-term debt 27 (27,857) (36,143) (2,972)Deferred income tax liabilities 6 (885) (1,099) (1,409)Post-employment benefit liabilities 10 (4,367) (4,726) (4,669)Provisions 25 (934) (700) (654)Other non-current liabilities 26 (337) (416) (459)Total non-current liabilities (34,380) (43,084) (10,163)
Current liabilitiesShort-term debt 27 (2,201) (6,273) (1,117)Current income tax liabilities 6 (2,037) (2,478) (2,193)Provisions 25 (2,146) (1,618) (804)Accounts payable 22 (2,068) (2,300) (2,017)Accrued and other current liabilities 23 (6,526) (9,398) (5,973)Total current liabilities (14,978) (22,067) (12,104)
Total liabilities (49,358) (65,151) (22,267)
Total net assets 11,662 9,414 53,822
EquityCapital and reserves attributable to Roche shareholders 28 9,469 7,366 44,479Equity attributable to non-controlling interests 30 2,193 2,048 9,343Total equity 11,662 9,414 53,822

38 Roche Finance Report 2010 Roche Group – Roche Group Consolidated Financial Statements
Roche Group consolidated statement of cash flows | in millions of CHF
Year ended 31 December2010 2009
Cash flows from operating activitiesCash generated from operations 31 19,436 19,304(Increase) decrease in working capital (1,266) 349Payments made for defined benefit post-employment plans 10 (334) (467)Utilisation of provisions 25 (729) (709)Disposal of products 30 169Other operating cash flows (6) 167Cash flows from operating activities, before income taxes paid 17,131 18,813
Income taxes paid (2,789) (1,767)Total cash flows from operating activities 14,342 17,046
Cash flows from investing activitiesPurchase of property, plant and equipment (2,671) (2,984)Purchase of intangible assets (339) (235)Disposal of property, plant and equipment 112 113Disposal of intangible assets – 3Business combinations 7 (504) (98)Divestments of subsidiaries 34 – 15Interest and dividends received 31 59 306Sales of marketable securities 43,057 14,968Purchases of marketable securities (36,345) (15,171)Other investing cash flows 165 5Total cash flows from investing activities 3,534 (3,078)
Cash flows from financing activitiesProceeds from issue of bonds and notes 27 – 48,197Redemption and repurchase of bonds and notes 27 (8,625) (7,421)Increase (decrease) in commercial paper 27 (86) (261)Increase (decrease) in other debt 27 (51) (133)Hedging and collateral arrangements 27 (1,717) 3,264Change in ownership interest in subsidiaries– Genentech 3 – (52,708)– Memory 7 – (6)Equity contribution by non-controlling interests 30 14 –Interest paid (1,931) (748)Dividends paid (5,265) (4,395)Genentech equity compensation plans 11 – 108Equity-settled equity compensation plans, net of transactions in own equity instruments 11 (773) (651)Chugai share repurchases 4 – (14)Other financing cash flows – –Total cash flows from financing activities (18,434) (14,768)
Net effect of currency translation on cash and cash equivalents (43) (1,673)Increase (decrease) in cash and cash equivalents (601) (2,473)
Cash and cash equivalents at 1 January 2,442 4,915Cash and cash equivalents at 31 December 21 1,841 2,442
As disclosed in Note 1, the statement of cash flows for 2009 has been restated following the accounting policy changes which were adopted in 2010. The only change is that ‘Disposal of products’, totalling 169 million Swiss francs in 2009, are now reported as operating rather than investing cash flows.

39
Roche Group consolidated statement of changes in equity | in millions of CHF
Reserves Non– controlling
Total interestsShare
capitalRetained earnings
Fair value Hedging Trans lation
Total equity
Year ended 31 December 2009At 1 January 2009 160 52,081 (231) 9 (7,540) 44,479 9,343 53,822
Net income recognised in income statement – 7,784 – – – 7,784 726 8,510Available-for-sale investments – – 352 – – 352 3 355Cash flow hedges – – – 60 – 60 15 75Currency translation of foreign operations – – (22) (4) 2,747 2,721 333 3,054Defined benefit post-employment plans – (6) – – – (6) 1 (5)Total comprehensive income – 7,778 330 56 2,747 10,911 1,078 11,989
Business combinations 7 – – – – – – 4 4Dividends paid – (4,300) – – – (4,300) (95) (4,395)Equity compensation plans, net of transactions in own equity instruments – 77 – – – 77 178 255Chugai share repurchases 4 – (9) – – – (9) (5) (14)Changes in ownership interests in subsidiaries– Genentech 3 – (43,777) – – – (43,777) (8,464) (52,241)– Memory 7 – (2) – – – (2) (4) (6)Changes in non-controlling interests – (13) – – – (13) 13 –At 31 December 2009 160 11,835 99 65 (4,793) 7,366 2,048 9,414
Year ended 31 December 2010At 1 January 2010 160 11,835 99 65 (4,793) 7,366 2,048 9,414
Net income recognised in income statement – 8,666 – – – 8,666 225 8,891Available-for-sale investments – – 18 – – 18 (1) 17Cash flow hedges – – – (193) – (193) – (193)Currency translation of foreign operations – – (11) 3 (519) (527) 29 (498)Defined benefit post-employment plans – (250) – – – (250) (16) (266)Total comprehensive income – 8,416 7 (190) (519) 7,714 237 7,951
Dividends paid – (5,144) – – – (5,144) (107) (5,251)Equity compensation plans, net of transactions in own equity instruments – (467) – – – (467) 1 (466)Changes in non-controlling interests – – – – – – – –Equity contribution by non-controlling interests 30 – – – – – – 14 14Other movements – (90) 68 22 – – – –At 31 December 2010 160 14,550 174 (103) (5,312) 9,469 2,193 11,662

40 Roche Finance Report 2010 Roche Group – Notes to the Roche Group Consolidated Financial Statements
Notes to the Roche Group Consolidated Financial StatementsReference numbers indicate corresponding Notes to the Consolidated Financial Statements.
1. Summary of significant accounting policiesBasis of preparation of the consolidated financial statementsThe consolidated financial statements of the Roche Group have been prepared in accordance with International Financial Reporting Standards (IFRS) and comply with Swiss law. They have been prepared using the historical cost convention except that, as disclosed in the accounting policies below, certain items, including derivatives and available-for-sale investments, are shown at fair value. They were approved for issue by the Board of Directors on 27 January 2011 and are subject to approval by the Annual General Meeting of shareholders on 1 March 2011.
The preparation of the consolidated financial statements requires management to make estimates and assumptions that affect the reported amounts of revenues, expenses, assets and liabilities, and the disclosure of contingent liabilities at the date of the financial statements. If in the future such estimates and assumptions, which are based on management’s best judgement at the date of the financial statements, deviate from the actual circumstances, the original estimates and assumptions will be modified as appropriate in the year in which the circumstances change.
Changes in accounting policies that arise from the application of new or revised standards and interpretations are applied retrospectively, unless otherwise specified in the transitional requirements of the particular standard or interpretation. Retrospective application requires that the results of the comparative period and the opening balances of that period are restated as if the new accounting policy had always been applied. In some cases the transitional requirements of the particular standard or interpretation specify that the changes are to be applied prospectively. Prospective application requires that the new accounting policy only be applied to the results of the current period and the comparative period is not restated. In addition comparatives have been reclassified or extended from the previously reported results to take into account any presentational changes.
Consolidation policyThese financial statements are the consolidated financial statements of Roche Holding Ltd, a company registered in Switzerland, and its subsidiaries (‘the Group’).
The subsidiaries are those companies controlled, directly or indirectly, by Roche Holding Ltd, where control is defined as the power to govern the financial and operating policies of an enterprise so as to obtain benefits from its activities. This control is normally evidenced when Roche Holding Ltd owns, either directly or indirectly, more than 50% of the voting rights or currently exercisable potential voting rights of a company’s share capital. Special Purpose Entities are consolidated where the substance of the relationship is that the Special Purpose Entity is controlled by the Group. Companies acquired during the year are consolidated from the date on which control is transferred to the Group, and subsidiaries to be divested are included up to the date on which control passes from the Group. Inter-company balances, transactions and resulting unrealised income are eliminated in full. Changes in ownership interests in subsidiaries are accounted for as equity transactions if they occur after control has already been obtained and if they do not result in a loss of control.

41
Investments in associates are accounted for using the equity method. These are companies over which the Group exercises, or has the power to exercise, significant influence, but which it does not control. This is normally evidenced when the Group owns 20% or more of the voting rights or currently exercisable potential voting rights of the company. Balances and transactions with associates that result in unrealised income are eliminated to the extent of the Group’s interest in the associate. Interests in joint ventures are reported using the line-by-line proportionate consolidation method.
Segment reportingThe determination of the Group’s operating segments is based on the organisation units for which information is reported to the Group’s management. The Group has two divisions, Pharmaceuticals and Diagnostics. Revenues are primarily generated from the sale of prescription pharmaceutical products and diagnostic instruments, reagents and consumables, respectively. Both divisions also derive revenue from the sale or licensing of products or technology to third parties. Certain headquarter activities are reported as ‘Corporate’. These consist of corporate headquarters, including the Corporate Executive Committee, corporate communications, corporate human resources, corporate finance, including treasury, taxes and pension fund management, corporate legal and corporate safety and environmental services. Sub-divisional information for Roche Pharmaceuticals and Chugai, the previously aggregated operating segments within the Pharmaceuticals Division, is also presented.
Transfer prices between operating segments are set on an arm’s length basis. Operating assets and liabilities consist of property, plant and equipment, goodwill and intangible assets, trade receivables/payables, inventories and other assets and liabilities, such as provisions, which can be reasonably attributed to the reported operating segments. Non-operating assets and liabilities mainly include current and deferred income tax balances, post-employment benefit assets/liabilities and financial assets/liabilities such as cash, marketable securities, investments and debt.
Foreign currency translationMost Group companies use their local currency as their functional currency. Certain Group companies use other currencies (such as US dollars, Swiss francs or euros) as their functional currency where this is the currency of the primary economic environment in which the entity operates. Local transactions in other currencies are initially reported using the exchange rate at the date of the transaction. Gains and losses from the settlement of such transactions and gains and losses on translation of monetary assets and liabilities denominated in other currencies are included in income, except when they are qualifying cash flow hedges or arise on monetary items that, in substance, form part of the Group’s net investment in a foreign entity. In such cases the gains and losses are deferred into equity.
Upon consolidation, assets and liabilities of Group companies using functional currencies other than Swiss francs (foreign entities) are translated into Swiss francs using year-end rates of exchange. Sales, costs, expenses, net income and cash flows are translated at the average rates of exchange for the year. Translation differences due to the changes in exchange rates between the beginning and the end of the year and the difference between net income translated at the average and year-end exchange rates are taken directly to equity. On disposal of a foreign entity, the identified cumulative currency translation differences within equity relating to that foreign entity are recognised in income as part of the gain or loss on divestment.

42 Roche Finance Report 2010 Roche Group – Notes to the Roche Group Consolidated Financial Statements
Revenues Sales represent amounts received and receivable for goods supplied to customers after deducting trade discounts, cash discounts and volume rebates, and exclude value added taxes and other taxes directly linked to sales. Revenues from the sale of products are recognised upon transfer to the customer of significant risks and rewards. Trade discounts, cash discounts and volume rebates are recorded on an accrual basis consistent with the recognition of the related sales. Estimates of expected sales returns, charge-backs and other rebates, including Medicaid in the United States and similar rebates in other countries, are also deducted from sales and recorded as accrued liabilities or provisions or as a deduction from accounts receivable. Such estimates are based on analyses of existing contractual or legislatively mandated obligations, historical trends and the Group’s experience. If the circumstances are such that the level of sales returns, and hence revenues, cannot be reliably measured, then sales are only recognised when the right of return expires, which is generally upon prescription of the products to patients. Other revenues are recorded as earned or as the services are performed. Where necessary, single transactions are split into separately identifiable components to reflect the substance of the transaction. Conversely, two or more transactions may be considered together for revenue recognition purposes, where the commercial effect cannot be understood without reference to the series of transactions as a whole.
Cost of salesCost of sales includes the corresponding direct production costs and related production overheads of goods sold and services rendered. Royalties, alliance and collaboration expenses, including all collaboration profit-sharing arrangements are also reported as part of cost of sales. Start-up costs between validation and the achievement of normal production capacity are expensed as incurred.
Research and developmentInternal research costs are those costs incurred for the purpose of gaining new scientific or technical knowledge and understanding. These costs are expensed as incurred.
Internal development costs are those costs incurred for the application of research findings or other knowledge to plan and develop new products for commercial production. Such costs would qualify for capitalisation as intangible assets only if all of the following criteria can be demonstrated:
• The technical feasibility of completing the development project successfully so that it will be available for use or sale.
• The intention to complete the development project.
• The ability to use or sell the results of the development project.
• That the development project would generate economic benefits. This would normally be evidenced by the existence and size of a market for the results of the project itself or the products that would result from the project.
• The availability of adequate technical, financial and other resources to complete the development project.
• The ability to measure the development expenditure reliably that would qualify for capitalisation as an intangible asset.
The development projects undertaken by the Group are subject to technical, regulatory and other uncertainties, such that, in the opinion of management, the criteria for capitalisation are not met prior to obtaining marketing approval by the regulatory authorities in major markets. Internal development costs that do not meet these criteria are therefore expensed as incurred.
Post-marketing studies after regulatory approval, such as Phase IV costs in the pharmaceuticals business, are expensed as incurred. They generally involve safety surveillance and ongoing technical support of a drug after it receives marketing approval to be sold. They may be required by regulatory authorities or may be undertaken for safety or commercial reasons. The safety surveillance is designed to detect any rare or long-term adverse effects over a much larger patient population and longer time period than was possible during earlier stages of development. The costs of such post-marketing studies are not capitalised as intangible assets, as in the opinion of management, they do not generate separately identifiable incremental future economic benefits that can be reliably measured.

43
In addition to its internal research and development activities, the Group is also party to in-licensing and similar arrangements with its alliance partners. The Group may also acquire in-process research and development assets, either through business combinations or through purchases of specific assets.
In-process research and development resources acquired either through in-licensing arrangements, business combinations or separate purchases are capitalised as intangible assets if they are controlled by the Group, are separately identifiable and are expected to generate future economic benefits, even if uncertainty exists as to whether the research and development will ultimately result in a marketable product. Consequently, upfront and milestone payments to third parties for pharmaceutical products or compounds before regulatory marketing approval are recognised as intangible assets. Assets acquired through such arrangements are measured on the basis set out below in the ‘Intangible assets’ policy and are reviewed for impairment as set out below in the ‘Impairment of property, plant and equipment and intangible assets’ policy. Once available for use, such intangible assets are amortised on a straight-line basis over the period of the expected benefit and are reviewed for impairment at each reporting date. If research and development are embedded in contracts for strategic alliances, the Group carefully assess whether upfront or milestone payments constitute funding of research and development work or acquisition of an asset.
Licensing, milestone and other upfront receiptsRoyalty income is recognised on an accrual basis in accordance with the substance of the respective licensing agreements. If the collectability of a royalty amount is not reasonably assured, those royalties are recognised as revenue when the cash is received. Certain Group companies receive from third parties upfront, milestone and other similar payments relating to the sale or licensing of products or technology. Revenue associated with performance milestones is recognised based on achievement of the deliverables as defined in the respective agreements. Upfront payments and licence fees for which there are subsequent deliverables are initially reported as deferred income and are recognised in income as earned over the period of the development collaboration or the manufacturing obligation.
Employee benefitsWages, salaries, social security contributions, paid annual leave and sick leave, bonuses, and non-monetary benefits are accrued in the year in which the associated services are rendered by employees of the Group. Where the Group provides long-term employee benefits, the cost is accrued to match the rendering of the services by the employees concerned. Liabilities for long-term employee benefits are discounted to take into account the time value of money, where material.
Pensions and other post-employment benefitsMost employees are covered by defined benefit and defined contribution post-employment plans sponsored by Group companies. The Group’s contributions to defined contribution plans are charged to the appropriate income statement heading within the operating results in the year to which they relate. The accounting and reporting of defined benefit plans are based on recent actuarial valuations. The defined benefit obligations and service costs are calculated using the projected unit credit method. This reflects service rendered by employees to the dates of valuation and incorporates actuarial assumptions primarily regarding discount rates used in determining the present value of benefits, projected rates of remuneration growth and long-term expected rates of return for plan assets. Discount rates are based on the market yields of high-quality corporate bonds in the country concerned. Past service costs are allocated over the average period until the benefits become vested. Current and past service costs are charged to the appropriate income statement heading within the operating results. Pension plan administration and funding is overseen at a corporate level and any settlement gains and losses resulting from changes in funding arrangements are reported as general and administration expenses within the ‘Corporate’ segment. The expected returns on plan assets and interest costs are charged to financial income and financing costs, respectively. Actuarial gains and losses, which consist of differences between assumptions and actual experiences and the effects of changes in actuarial assumptions, are recorded directly in equity. Pension assets and liabilities in different defined benefit plans are not offset unless the Group has a legally enforceable right to use the surplus in one plan to settle obligations in the other plan. The recognition of pension assets is limited to the total of the present value of any future refunds from the plans or reductions in future contributions to the plans and any cumulative

44 Roche Finance Report 2010 Roche Group – Notes to the Roche Group Consolidated Financial Statements
unrecognised past service costs. Adjustments arising from the limit on the recognition of assets for defined benefit plans are recorded directly in equity.
Equity compensation plansCertain employees of the Group participate in equity compensation plans, including separate plans at Genentech (prior to the Genentech transaction) and at Chugai. The fair value of all equity compensation awards granted to employees is estimated at the grant date and recorded as an expense over the vesting period. The expense is charged to the appropriate income statement heading within the operating results. For equity-settled plans, an increase in equity is recorded for this expense and any subsequent cash flows from exercises of vested awards are recorded as changes in equity. For cash-settled plans, a liability is recorded, which is measured at fair value at each reporting date with any movements in fair value being recorded to the appropriate income statement heading within the operating results. Any subsequent cash flows from exercise of vested awards are recorded as a reduction of the liability.
Property, plant and equipmentProperty, plant and equipment are initially recorded at cost of purchase or construction, and include all costs directly attributable to bringing the asset to the location and condition necessary for it to be capable of operating in the manner intended by management. These include items such as costs of site preparation, installation and assembly costs and professional fees. The net costs of testing whether the asset is functioning properly, including validation costs, are also included in the initially recorded cost of construction. Interest and other borrowing costs incurred with respect to qualifying assets are capitalised and included in the carrying value of the assets.
Property, plant and equipment are depreciated on a straight-line basis, except for land, which is not depreciated. Estimated useful lives of major classes of depreciable assets are as follows:
Land improvements 40 yearsBuildings 10–50 yearsMachinery and equipment 5–15 yearsDiagnostic instruments 3–5 yearsOffice equipment 3 yearsMotor vehicles 5 years
Where parts of an item of property, plant and equipment have different useful lives, they are accounted for as separate components. The estimated useful life of the assets is regularly reviewed and, if necessary, the future depreciation charge is accelerated. Repairs and maintenance costs are expensed as incurred.
LeasesWhere the Group is the lessee, leases of property, plant and equipment where the Group has substantially all of the risks and rewards of ownership are classified as finance leases. Finance leases are capitalised at the start of the lease at fair value, or the present value of the minimum lease payments, if lower. The rental obligation, net of finance charges, is reported within debt. Assets acquired under finance leases are depreciated in accordance with the Group’s policy on property, plant and equipment. If there is no reasonable certainty that the Group will obtain ownership by the end of the lease term, the asset is depreciated over the shorter of the lease term and its useful life. The interest element of the lease payment is charged against income over the lease term based on the effective interest rate method. Leases where substantially all of the risks and rewards of ownership are not transferred to the Group are classified as operating leases. Payments made under operating leases are charged against income on a straight-line basis over the period of the lease.
Where the Group is the lessor, which primarily occurs in the Diagnostics Division, assets subject to finance leases are initially reported as receivables at an amount equal to the net investment in the lease. Assets subject to operating leases are reported within property, plant and equipment. Lease income from finance leases is subsequently recognised as earned income over the term of the lease based on the effective interest rate method. Lease income from operating leases is recognised over the lease term on a straight-line basis.

45
Business combinations and goodwillBusiness combinations are accounted for using the acquisition method of accounting. The consideration transferred in a business combination is measured at fair value at the date of acquisition. This consideration includes the cash paid plus the fair value at the date of exchange of assets given, liabilities incurred or assumed and equity instruments issued by the Group. The fair value of the consideration transferred also includes contingent consideration arrangements at fair value. Directly attributable acquisition-related costs are expensed in the current period and reported within general and administration expenses. At the date of acquisition the Group recognises the identifiable assets acquired, the liabilities assumed and any non-controlling interest in the acquired business. The identifiable assets acquired and the liabilities assumed are initially recognised at fair value. Where the Group does not acquire 100% ownership of the acquired business non-controlling interests are recorded as the proportion of the fair value of the acquired net assets attributable to the non-controlling interest. Goodwill is recorded as the surplus of the consideration transferred over the Group’s interest in the fair value of the acquired net assets. Any goodwill and fair value adjustments are recorded as assets and liabilities of the acquired business in the functional currency of that business. When the initial accounting for a business combination is incomplete at the end of a reporting period, provisional amounts are used. During the measurement period, the provisional amounts are retrospectively adjusted and additional assets and liabilities may be recognised, to reflect new information obtained about the facts and circumstances that existed at the acquisition date which would have affected the measurement of the amounts recognised at that date, had they been known. The measurement period does not exceed twelve months from the date of acquisition. Goodwill is not amortised, but is assessed for possible impairment at each reporting date and is additionally tested annually for impairment. Goodwill may also arise upon investments in associates, being the surplus of the cost of investment over the Group’s share of the fair value of the net identifiable assets. Such goodwill is recorded within investments in associates. Changes in ownership interests in subsidiaries are accounted for as equity transactions if they occur after control has already been obtained and if they do not result in a loss of control.
Intangible assetsPurchased patents, licences, trademarks and other intangible assets are initially recorded at cost. Where these assets have been acquired through a business combination, this will be the fair value allocated in the acquisition accounting. Intangible assets are amortised over their useful lives on a straight-line basis beginning from the point when they are available for use. Estimated useful life is the lower of the legal duration and the economic useful life. The estimated useful life of intangible assets is regularly reviewed.
Impairment of property, plant and equipment and intangible assetsAn impairment assessment is carried out when there is evidence that an asset may be impaired. In addition intangible assets that are not yet available for use are tested for impairment annually. When the recoverable amount of an asset, being the higher of its fair value less costs to sell and its value in use, is less than its carrying value, then the carrying value is reduced to its recoverable amount. This reduction is reported in the income statement as an impairment loss. Value in use is calculated using estimated cash flows, generally over a five-year period, with extrapolating projections for subsequent years. These are discounted using an appropriate long-term pre-tax interest rate. When an impairment loss arises, the useful life of the asset in question is reviewed and, if necessary, the future depreciation/amortisation charge is accelerated. The impairment of financial assets is discussed below in the ‘Financial assets’ policy.
Impairment of goodwillGoodwill is assessed for possible impairment at each reporting date and is additionally tested annually for impairment. Goodwill is allocated to cash-generating units as described in Note 13. When the recoverable amount of the cash-generating unit, being the higher of its fair value less costs to sell or its value in use, is less than its carrying value, then the carrying value of the goodwill is reduced to its recoverable amount. This reduction is reported in the income statement as an impairment loss. The methodology used in the impairment testing is further described in Note 13.

46 Roche Finance Report 2010 Roche Group – Notes to the Roche Group Consolidated Financial Statements
InventoriesInventories are stated at the lower of cost and net realisable value. The cost of finished goods and work in process includes raw materials, direct labour and other directly attributable costs and overheads based upon the normal capacity of production facilities. Cost is determined using the weighted average method. Net realisable value is the estimated selling price less cost to completion and selling expenses.
Accounts receivableAccounts receivable are carried at the original invoice amount less allowances made for doubtful accounts, trade discounts, cash discounts, volume rebates and similar allowances. An allowance for doubtful accounts is recorded for the difference between the carrying value and the recoverable amount where there is objective evidence that the Group will not be able to collect all amounts due. Trade discounts, cash discounts, volume rebates and similar allowances are recorded on an accrual basis consistent with the recognition of the related sales, using estimates based on existing contractual obligations, historical trends and the Group’s experience. Long-term accounts receivable are discounted to take into account the time value of money, where material.
Cash and cash equivalentsCash and cash equivalents include cash on hand and time, call and current balances with banks and similar institutions. Such balances are only reported as cash if they are readily convertible to known amounts of cash, are subject to insignificant risk of changes in value and have a maturity of three months or less from the date of acquisition. This definition is also used for the statement of cash flows.
ProvisionsProvisions are recognised where a legal or constructive obligation has been incurred which will probably lead to an outflow of resources that can be reasonably estimated. In particular, restructuring provisions are recognised when the Group has a detailed formal plan that has either commenced implementation or been announced. Provisions are recorded for the estimated ultimate liability that is expected to arise, taking into account foreign currency effects arising from their translation from their functional currency into Swiss francs and the time value of money, where material. A contingent liability is disclosed where the existence of the obligation will only be confirmed by future events or where the amount of the obligation cannot be measured with reasonable reliability. Contingent assets are not recognised, but are disclosed where an inflow of economic benefits is probable.
Fair valuesFair value is the amount for which a financial asset, liability or instrument could be exchanged between knowledgeable and willing parties in an arm’s length transaction. It is determined by reference to quoted market prices or by the use of established valuation techniques such as option pricing models and the discounted cash flow method if quoted prices in an active market are not available (‘fair value hierarchy’). Valuation techniques will incorporate observable market data about market conditions and other factors that are likely to affect the fair value of a financial instrument. Valuation techniques are typically used for derivative financial instruments. The fair values of financial assets and liabilities at the reporting date are not materially different from their reported carrying values unless specifically mentioned in the Notes to the Consolidated Financial Statements. Information on fair value hierarchy is included in Note 32 on risk management.
Financial assetsFinancial assets, principally investments, including marketable securities, are classified as either ‘Fair-value-through-profit-or-loss’, ‘Available-for-sale’, ‘Held-to-maturity’ or ‘Loans and receivables’. Fair-value-through-profit-or-loss financial assets are either classified as held-for-trading or designated upon initial recognition. Held-for-trading financial assets are acquired principally to generate profit from short-term fluctuations in price. Financial assets are designated as fair-value-through-profit-or-loss if doing so results in more relevant information by eliminating a measurement or recognition inconsistency. Held-to-maturity financial assets are securities with a fixed maturity that the Group has the intent and ability to hold until maturity. Loans and receivables are financial assets created by the Group or acquired from the issuer in a primary market. They are non-derivative financial assets with fixed or determinable payments that are not quoted in an active market. All other financial assets are considered to be available-for-sale.

47
All financial assets are initially recorded at fair value, including transaction costs, except for assets at fair-value-through-profit-or-loss, which exclude transaction costs. All purchases and sales are recognised on the settlement date. Fair-value-through-profit-or-loss financial assets are subsequently carried at fair value, with all changes in fair value recorded as financial income in the period in which they arise. Held-to-maturity financial assets are subsequently carried at amortised cost using the effective interest rate method. Available-for-sale financial assets are subsequently carried at fair value, with all unrealised changes in fair value recorded in equity except for interest calculated using the effective interest rate method and foreign exchange components. When the available-for-sale financial assets are sold, impaired or otherwise disposed of, the cumulative gains and losses previously recognised in equity are included in financial income for the current period. Loans and receivables are subsequently carried at amortised cost using the effective interest rate method.
Financial assets are individually assessed for possible impairment at each reporting date. An impairment charge is recorded where there is objective evidence of impairment, such as where the issuer is in bankruptcy, default or other significant financial difficulty. In addition any available-for-sale equity securities that have a market value of more than 25% below their original cost, net of any previous impairment, will be considered as impaired. Any available-for-sale equity securities that have a market value below their original cost, net of any previous impairment, for a sustained six-month period will also be considered as impaired. Any decreases in the market price of less than 25% of original cost, net of any previous impairment, which are also for less than a sustained six-month period are not by themselves considered as objective evidence of impairment. Such movements in fair value are recorded in equity until there is objective evidence of impairment or until the asset is sold or otherwise disposed of. For financial assets carried at amortised cost, any impairment charge is the difference between the carrying value and the recoverable amount, calculated using estimated future cash flows discounted using the original effective interest rate. For available-for-sale financial assets, any impairment charge is the amount currently carried in equity for the difference between the original cost, net of any previous impairment, and the fair value. An impairment loss is reversed if the reversal can be related objectively to an event occurring after the impairment loss was recognised. For debt securities measured at amortised cost or available-for-sale, the reversal is recognised in income. For equity securities held available-for-sale, the reversal is recognised directly in equity.
A financial asset is derecognised when the contractual cash flows from the asset expire or when the Group transfers the rights to receive the contractual cash flows from the financial assets in a transaction in which substantially all the risks and rewards of ownership of the financial asset are transferred. Any interest in transferred financial assets that is created or retained by the Group is recognised as a separate asset or liability.
DerivativesDerivative financial instruments are initially recorded and subsequently carried at fair value. Apart from those derivatives designated as qualifying cash flow hedging instruments as discussed in the ‘Hedging’ policy below, all changes in fair value are recorded as financial income in the period in which they arise. Embedded derivatives are recognised separately if not closely related to the host contract and where the host contract is carried at amortised cost.
Hedge accountingFor the purposes of hedge accounting, hedging relationships may be of three types. A ‘fair value hedge’ is a hedge of the exposure to changes in fair value of a recognised asset or liability, or an unrecognised firm commitment, or an identified portion of such an asset, liability or firm commitment, that is attributable to a particular risk and could affect profit or loss. A ‘cash flow hedge’ is a hedge of the exposure to variability in cash flows that is attributable to a particular risk associated with a recognised asset or liability or a highly probable forecast transaction and could affect profit or loss. A ‘hedge of a net investment in a foreign operation’ is a hedge of the foreign currency exposure on a net investment in a foreign operation.

48 Roche Finance Report 2010 Roche Group – Notes to the Roche Group Consolidated Financial Statements
To qualify for hedge accounting the hedging relationship must meet several strict conditions on documentation, probability of occurrence (for cash flow hedges), hedge effectiveness and reliability of measurement. If these conditions are not met, then the relationship does not qualify for hedge accounting. In this case the hedging instrument and the hedged item are reported independently as if there were no hedging relationship. In particular any derivatives are reported at fair value, with changes in fair value included in financial income.
For qualifying fair value hedges, the hedging instrument is recorded at fair value and the hedged item is recorded at its previous carrying value, adjusted for any changes in fair value that are attributable to the hedged risk. Any changes in the fair values are reported in financial income.
For qualifying cash flow hedges, the hedging instrument is recorded at fair value. The portion of any change in fair value that is an effective hedge is included in equity, and any remaining ineffective portion is reported in financial income. If the hedging relationship is the hedge of the foreign currency risk of a firm commitment or highly probable forecasted transaction that results in the recognition of a non-financial asset or liability, the cumulative changes in the fair value of the hedging instrument that have been recorded in equity are included in the initial carrying value of the asset or liability at the date of recognition. For all other qualifying cash flow hedges, the cumulative changes in the fair value of the hedging instrument that have been recorded in equity are included in financial income when the forecasted transaction affects net income.
For qualifying hedges of net investment in a foreign entity, the hedging instrument is recorded at fair value. The portion of any change in fair value that is an effective hedge is included in equity. Any remaining ineffective portion is recorded in financial income where the hedging instrument is a derivative and in equity in other cases. If the entity is disposed of, then the cumulative changes of fair value of the hedging instrument that have been recorded in equity are reclassified to income.
DebtDebt instruments are initially recorded at cost, which is the proceeds received, net of transaction costs. Subsequently they are reported at amortised cost. Any discount between the net proceeds received and the principal value due on redemption is amortised over the duration of the debt instrument and is recognised as part of financing costs using the effective interest rate method. The Group derecognises a financial liability when its contractual obligations are discharged, cancelled or expired.
Certain debt instruments have been designated as ‘ fair-value-through-profit-or-loss’ where doing so results in more relevant information as it eliminates or significantly reduces measurement or recognition inconsistencies. Such debt instruments were reported at fair value, based on quoted prices in an active market, with movements in fair value reported within financial income. The Group’s last such instrument was redeemed on 6 July 2009 as disclosed in Note 27.
TaxationIncome taxes include all taxes based upon the taxable profits of the Group, including withholding taxes payable on the distribution of retained earnings within the Group. Other taxes not based on income, such as property and capital taxes, are included within general and administration expenses.
Liabilities for income taxes, mainly withholding taxes, which could arise on the remittance of retained earnings, principally relating to subsidiaries, are only recognised where it is probable that such earnings will be remitted in the foreseeable future.
Deferred income tax assets and liabilities are recognised on temporary differences between the tax bases of assets and liabilities and their carrying values in the financial statements. Deferred income tax assets relating to the carry-forward of unused tax losses are recognised to the extent that it is probable that future taxable profit will be available against which the unused tax losses can be utilised.

49
Current and deferred income tax assets and liabilities are offset when the income taxes are levied by the same taxation authority and when there is a legally enforceable right to offset them. Deferred income taxes are determined based on the currently enacted tax rates applicable in each tax jurisdiction where the Group operates.
Discontinued businesses and non-current assets held for saleA discontinued business is a component of the Group’s business that represents a separate major line of business or geographical area of operations or is a subsidiary acquired exclusively with a view to resale. Reclassification as a discontinued business occurs upon disposal or when the operation meets the criteria to be classified as held for sale, if earlier.
A disposal group is a group of assets that are to be disposed of as a group in a single transaction, together with the liabilities directly associated with those assets that will be transferred in the transaction. The assets and liabilities in a disposal group are reclassified as held for sale if their value will be recovered principally through a sale rather than through continuing use. The disposal group must be available for sale in its current condition and the sale must be highly probable.
Immediately before classification as held for sale, the measurement of all assets and liabilities in a disposal group is updated in accordance with applicable accounting policies. Then, on initial classification as held for sale, disposal groups are recognised at the lower of carrying value and fair value less costs to sell. Impairment losses on initial classification as held for sale are included in the income statement.
Own equity instrumentsThe Group’s holdings in its own equity instruments are recorded as a deduction from equity. The original purchase cost, consideration received for subsequent resale of these equity instruments and other movements are reported as changes in equity. These instruments have been acquired primarily to meet the potential obligations to employees that may arise in respect of certain of the Group’s equity compensation plans.
Management judgements made in applying accounting policiesThe application of the Group’s accounting policies may require management to make judgements, apart from those involving estimates, that can have a significant effect on the amounts recognised in the consolidated financial statements. Management judgement is particularly required when assessing the substance of transactions that have a complicated structure or legal form. These include, but are not limited to, the following areas:
Revenue recognition | The nature of the Group’s business is such that many sales transactions do not have a simple structure. Sales agreements may consist of multiple components occurring at different times. The Group is also party to various out-licensing agreements, which can involve upfront and milestone payments that may occur over several years. These agreements may also involve certain future obligations. Revenue is only recognised when, in management’s judgement, the significant risks and rewards of ownership have been transferred and when the Group does not retain continuing managerial involvement or effective control over the goods sold or when the obligation has been fulfilled. For some transactions this can result in cash receipts being initially recognised as deferred income and then released to income over subsequent periods on the basis of the performance of the conditions specified in the agreement.

50 Roche Finance Report 2010 Roche Group – Notes to the Roche Group Consolidated Financial Statements
Consolidation of subsidiaries and associates | The Group periodically undertakes transactions that may involve obtaining the right to control or significantly influence the operations of other companies. These transactions include the acquisition of all or part of the equity of other companies, the purchase of certain assets and assumption of certain liabilities and contingent liabilities of other companies, and entering into alliance agreements with other companies. Also included are transactions involving Special Purpose Entities and similar vehicles. In all such cases management makes an assessment as to whether the Group has the right to control or significantly influence the other company’s operations, and based on this assessment the other company is consolidated as a subsidiary or associated company. In making this assessment management considers the underlying economic substance of the transaction and not only the contractual terms.
Business combinations | Where the Group acquires control of another business, the consideration transferred has to be allocated to the identifiable assets acquired, the liabilities assumed and any non-controlling interest in the acquired business, with any residual recorded as goodwill. This process involves management making an assessment of the fair value of these items. Management judgement is particularly involved in the recognition and measurement of the following items:
• Intellectual property. This may include patents, licences, trademarks and similar rights for currently marketed products, and also the rights and scientific knowledge associated with projects that are currently in research or development phases.
• Contingencies such as legal and environmental matters.
• Contingent consideration arrangements.
• The recoverability of any accumulated tax losses previously incurred by the acquired company.
In all cases management makes an assessment based on the underlying economic substance of the items concerned, and not only on the contractual terms, in order to fairly present these items.
Leases | The Group is party to leasing arrangements, both as a lessee and as a lessor. The treatment of leasing transactions in the financial statements is mainly determined by whether the lease is considered to be an operating lease or a finance lease. In making this assessment, management looks at the substance of the lease, as well as the legal form, and makes a judgement about whether substantially all of the risks and rewards of ownership are transferred. Arrangements which do not take the legal form of a lease but that nevertheless convey the right to use an asset are also covered by such assessments.
Key assumptions and sources of estimation uncertaintyThe preparation of the consolidated financial statements in conformity with IFRS requires management to make estimates and assumptions that affect the application of policies and reported amounts of assets, liabilities, income, expenses and related disclosures. The estimates and underlying assumptions are based on historical experience and various other factors that are believed to be reasonable under the circumstances, the results of which form the basis for making the judgements about carrying values of assets and liabilities that are not readily apparent from other sources. Actual results may differ from these estimates.
The estimates and underlying assumptions are reviewed on an ongoing basis. Changes in accounting estimates may be necessary if there are changes in the circumstances on which the estimate was based, or as a result of new information or more experience. Such changes are recognised in the period in which the estimate is revised.
The key assumptions about the future and key sources of estimation uncertainty that have a significant risk of causing a material adjustment to the carrying value of assets and liabilities within the next twelve months are described below.
Revenue recognition | If the circumstances are such that the level of sales returns, and hence revenues, cannot be reliably measured, then sales are only recognised when the right of return expires, which is generally upon prescription of the products to patients. In order to estimate this, management uses publicly available information about prescriptions as well as information provided by wholesalers and other intermediaries.

51
Sales allowances | The Group has provisions and accruals for expected sales returns, charge-backs and other rebates, including Medicaid in the United States and similar rebates in other countries, which at 31 December 2010 total 1,155 million Swiss francs. Such estimates are based on analyses of existing contractual or legislatively-mandated obligations, historical trends and the Group’s experience. Management believes that the total provisions and accruals for these items are adequate, based upon currently available information. As these deductions are based on management estimates, they may be subject to change as better information becomes available. Such changes that arise could impact the provisions and accruals recognised in the balance sheet in future periods and consequently the level of sales recognised in the income statement in future periods.
Property, plant and equipment and intangible assets, including goodwill | The Group has property, plant and equipment with a carrying value of 16,729 million Swiss francs as disclosed in Note 12. Goodwill has a carrying value of 7,722 million Swiss francs (see Note 13) and intangible assets have a carrying value of 5,133 million Swiss francs (see Note 14). All of these assets are reviewed annually for impairment as described above. To assess whether any impairment exists, estimates are made of the future cash flows expected to result from the use of the asset and its eventual disposal. Actual outcomes could vary significantly from such estimates of discounted future cash flows. Factors such as changes in the planned use of buildings, machinery or equipment, or closure of facilities, the presence or absence of competition, technical obsolescence or lower than anticipated sales of products with capitalised rights could result in shortened useful lives or impairment. Changes in the discount rates used could also lead to impairments.
Pensions and other post-employment benefits | Many of the Group’s employees participate in post-employment defined benefit plans. The calculations of the recognised assets and liabilities from such plans are based upon statistical and actuarial calculations. In particular the present value of the defined benefit obligation is impacted by assumptions on discount rates used to arrive at the present value of future pension liabilities, and assumptions on future increases in salaries and benefits. Furthermore, the Group’s independent actuaries use statistically based assumptions covering areas such as future withdrawals of participants from the plan and estimates of life expectancy. At 31 December 2010 the present value of the Group’s defined benefit obligation is 11,464 million Swiss francs for funded plans and 3,080 million Swiss francs for unfunded plans (see Note 10). The actuarial assumptions used may differ materially from actual results due to changes in market and economic conditions, higher or lower withdrawal rates, longer or shorter life spans of participants, and other changes in the factors being assessed. These differences could impact the assets or liabilities recognised in the balance sheet in future periods.
Legal provisions | Group companies are party to various legal proceedings, including claims arising from trade, and the most significant matters are described in Note 25. Legal provisions at 31 December 2010 total 781 million Swiss francs. Management believes that the total provisions for legal proceedings are adequate based upon currently available information. However, given the inherent difficulties in estimating liabilities in this area, it cannot be guaranteed that additional costs will not be incurred beyond the amounts accrued. Additional claims could be made which might not be covered by existing provisions or by insurance. There can be no assurance that there will not be an increase in the scope of these matters or that any future lawsuits, claims, proceedings or investigations will not be material. Such changes that arise could impact the provisions recognised in the balance sheet in future periods.

52 Roche Finance Report 2010 Roche Group – Notes to the Roche Group Consolidated Financial Statements
Environmental provisions | The Group has provisions for environmental remediation costs, which at 31 December 2010 total 261 million Swiss francs, as disclosed in Note 25. The material components of the environmental provisions consist of costs to fully clean and refurbish contaminated sites, including landfills, and to treat and contain contamination at certain other sites. Future remediation expenses are affected by a number of uncertainties that include, but are not limited to, the detection of previously unknown contaminated sites, the method and extent of remediation, the percentage of the problematic materials attributable to the Group at the remediation sites relative to that attributable to other parties, and the financial capabilities of the other potentially responsible parties. Management believes that the total provisions for environmental matters are adequate based upon currently available information. However, given the inherent difficulties in estimating liabilities in this area, it cannot be guaranteed that additional costs will not be incurred beyond the amounts accrued. The effect of the resolution of environmental matters on the results of operations cannot be predicted due to uncertainty concerning both the amount and the timing of future expenditures. Such changes that arise could impact the provisions recognised in the balance sheet in future periods.
Income taxes | At 31 December 2010 the net liability for current income taxes is 1,869 million Swiss francs and the net asset for deferred income taxes is 1,483 million Swiss francs, as disclosed in Note 6. Significant estimates are required to determine the current and deferred assets and liabilities for income taxes. Some of these estimates are based on interpretations of existing tax laws or regulations. Management believes that the estimates are reasonable and that the recognised liabilities for income tax-related uncertainties are adequate. Various internal and external factors may have favourable or unfavourable effects on the income tax assets and liabilities. These factors include, but are not limited to, changes in tax laws, regulations and/or rates, changing interpretations of existing tax laws or regulations, future levels of research and development spending and changes in overall levels of pre-tax earnings. Such changes that arise could impact the assets and liabilities recognised in the balance sheet in future periods.
Changes in accounting policiesIn 2008 the Group early adopted the revised versions of IFRS 3 ‘Business Combinations’ and IAS 27 ‘Consolidated and Separate Financial Statements’ which were required to be implemented from 1 January 2010 at the latest. In 2010 the Group implemented various amendments to existing standards and interpretations, which have no material impact on the Group’s overall results and financial position.
Presentation of income statement | During 2010 the Group has made certain presentational changes to the income statement. These have been made in light of current international and industry practice and taking into account the latest regulatory guidance. These changes, which have been applied retrospectively, are listed below:
• The term ‘exceptional items’ is no longer used in the financial statements.
• The income statement headings ‘Major legal cases’ and ‘Changes in Group organisation’ are no longer shown separately on the face of the income statement. Such income and expenses are included as part of ‘General and administration’. Disclosure is made in Notes 25 and 8 respectively.
• The sub-total for ‘Operating profit before exceptional items’ is deleted as it is redundant.
• The income statement heading ‘Exceptional financing costs’ is no longer shown separately on the face of the income statement. Such income and expenses are included as part of ‘Financial income’ or ‘Financing costs’, as appropriate. Disclosure is made in Note 5.
• The income statement heading ‘Income taxes on exceptional items’ is no longer shown separately on the face of the income statement. Such income and expenses are included as part of ‘Income taxes’. Disclosure is made in Note 6.

53
The income statement for the year ended 31 December 2009 has been restated following the above changes as set out in the table below.
Restated consolidated income statement for the year ended 31 December 2009 | in millions of CHF
As originally published Reclassifications Restated
Sales 49,051 – 49,051
Royalties and other operating income 2,100 – 2,100Cost of sales (14,615) – (14,615)Marketing and distribution (9,475) – (9,475)Research and development (9,874) – (9,874)General and administration (2,175) (2,735) (4,910)Major legal cases (320) 320 –Changes in Group organisation (2,415) 2,415 –Operating profit 12,277 – 12,277
Associates – – –Financial income 792 (238) 554Financing costs (2,460) (139) (2,599)Exceptional financing costs (377) 377 –Profit before taxes 10,232 – 10,232
Income taxes (2,870) 1,148 (1,722)Income taxes on exceptional items 1,148 (1,148) –Net income 8,510 – 8,510
Improvements to IFRS: IAS 7 ‘Statement of Cash Flows’ | During 2010 the Group has made a minor presentational change to the statement of cash flows, following the implementation of the ‘Improvements to IFRS’ issued in April 2009. The only change is that ‘Disposal of products’, totalling 169 million Swiss francs in 2009, are now reported as operating rather than investing cash flows. The statement of cash flows for the year ended 31 December 2009 has been restated accordingly.
The Group is currently assessing the potential impacts of the other new and revised standards and interpretations that will be effective from 1 January 2011 and beyond, and which the Group has not early adopted. The Group does not anticipate that these will have a material impact on the Group’s overall results and financial position.
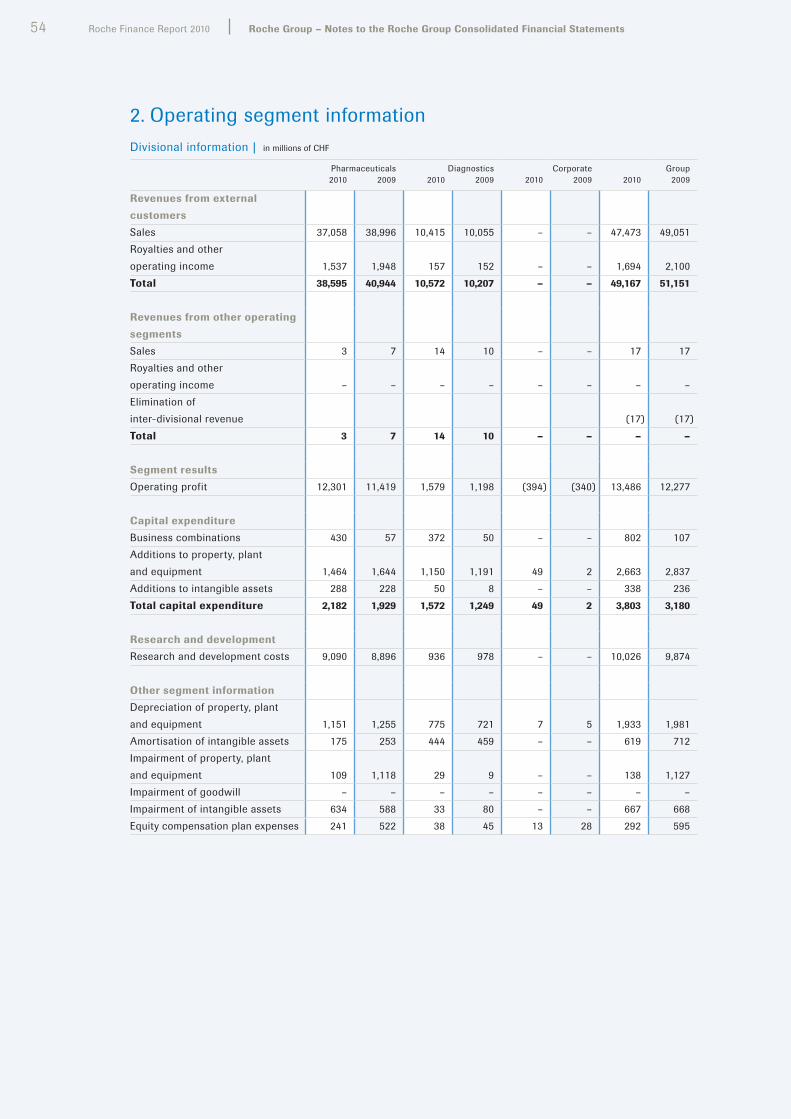
54 Roche Finance Report 2010 Roche Group – Notes to the Roche Group Consolidated Financial Statements
2. Operating segment informationDivisional information | in millions of CHF
Pharmaceuticals Diagnostics Corporate Group2010 2009 2010 2009 2010 2009 2010 2009
Revenues from external customersSales 37,058 38,996 10,415 10,055 – – 47,473 49,051Royalties and other operating income 1,537 1,948 157 152 – – 1,694 2,100Total 38,595 40,944 10,572 10,207 – – 49,167 51,151
Revenues from other operating segmentsSales 3 7 14 10 – – 17 17Royalties and other operating income – – – – – – – –Elimination of inter-divisional revenue (17) (17)Total 3 7 14 10 – – – –
Segment resultsOperating profit 12,301 11,419 1,579 1,198 (394) (340) 13,486 12,277
Capital expenditureBusiness combinations 430 57 372 50 – – 802 107Additions to property, plant and equipment 1,464 1,644 1,150 1,191 49 2 2,663 2,837Additions to intangible assets 288 228 50 8 – – 338 236Total capital expenditure 2,182 1,929 1,572 1,249 49 2 3,803 3,180
Research and developmentResearch and development costs 9,090 8,896 936 978 – – 10,026 9,874
Other segment informationDepreciation of property, plant and equipment 1,151 1,255 775 721 7 5 1,933 1,981Amortisation of intangible assets 175 253 444 459 – – 619 712Impairment of property, plant and equipment 109 1,118 29 9 – – 138 1,127Impairment of goodwill – – – – – – – –Impairment of intangible assets 634 588 33 80 – – 667 668Equity compensation plan expenses 241 522 38 45 13 28 292 595
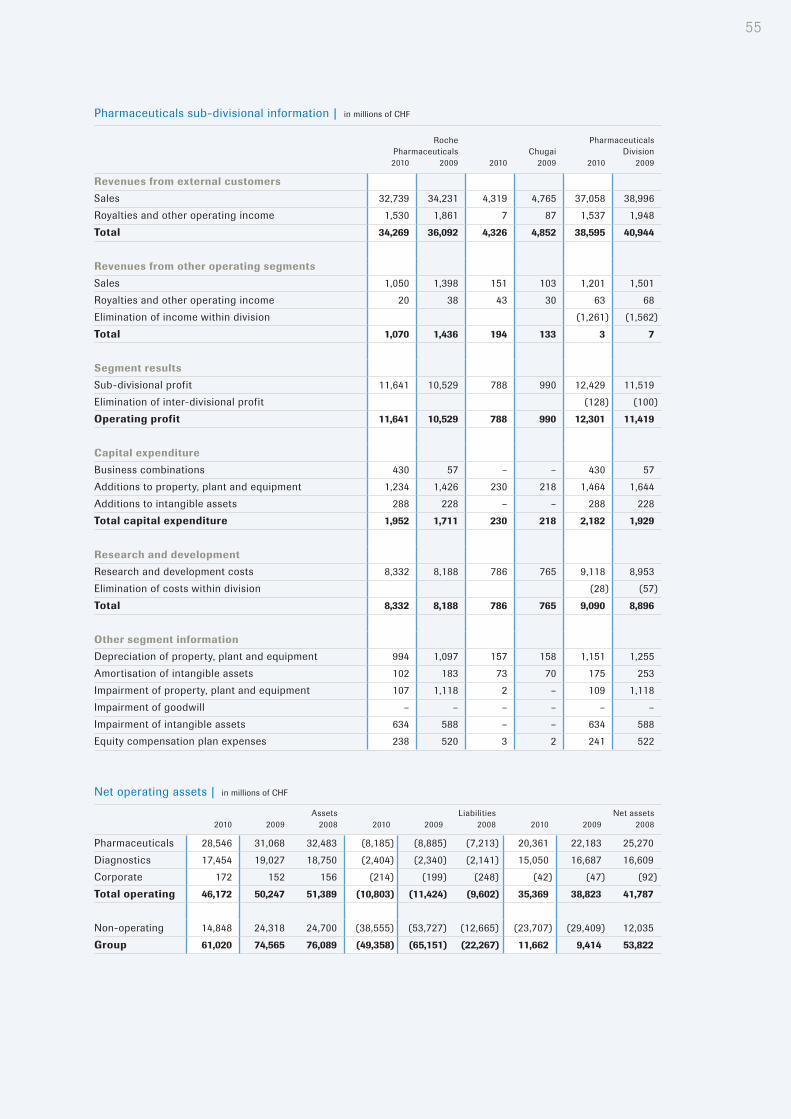
55
Pharmaceuticals sub-divisional information | in millions of CHF
Roche Pharmaceuticals Chugai
Pharmaceuticals Division
2010 2009 2010 2009 2010 2009
Revenues from external customersSales 32,739 34,231 4,319 4,765 37,058 38,996Royalties and other operating income 1,530 1,861 7 87 1,537 1,948Total 34,269 36,092 4,326 4,852 38,595 40,944
Revenues from other operating segmentsSales 1,050 1,398 151 103 1,201 1,501Royalties and other operating income 20 38 43 30 63 68Elimination of income within division (1,261) (1,562)Total 1,070 1,436 194 133 3 7
Segment resultsSub-divisional profit 11,641 10,529 788 990 12,429 11,519Elimination of inter-divisional profit (128) (100)Operating profit 11,641 10,529 788 990 12,301 11,419
Capital expenditureBusiness combinations 430 57 – – 430 57Additions to property, plant and equipment 1,234 1,426 230 218 1,464 1,644Additions to intangible assets 288 228 – – 288 228Total capital expenditure 1,952 1,711 230 218 2,182 1,929
Research and developmentResearch and development costs 8,332 8,188 786 765 9,118 8,953Elimination of costs within division (28) (57)Total 8,332 8,188 786 765 9,090 8,896
Other segment informationDepreciation of property, plant and equipment 994 1,097 157 158 1,151 1,255Amortisation of intangible assets 102 183 73 70 175 253Impairment of property, plant and equipment 107 1,118 2 – 109 1,118Impairment of goodwill – – – – – –Impairment of intangible assets 634 588 – – 634 588Equity compensation plan expenses 238 520 3 2 241 522
Net operating assets | in millions of CHF
Assets Liabilities Net assets2010 2009 2008 2010 2009 2008 2010 2009 2008
Pharmaceuticals 28,546 31,068 32,483 (8,185) (8,885) (7,213) 20,361 22,183 25,270Diagnostics 17,454 19,027 18,750 (2,404) (2,340) (2,141) 15,050 16,687 16,609Corporate 172 152 156 (214) (199) (248) (42) (47) (92)Total operating 46,172 50,247 51,389 (10,803) (11,424) (9,602) 35,369 38,823 41,787
Non-operating 14,848 24,318 24,700 (38,555) (53,727) (12,665) (23,707) (29,409) 12,035Group 61,020 74,565 76,089 (49,358) (65,151) (22,267) 11,662 9,414 53,822

56 Roche Finance Report 2010 Roche Group – Notes to the Roche Group Consolidated Financial Statements
Information by geographical area | in millions of CHF
Revenues from external customers Non-current assets
Sales
Royalties and other operating
incomeProperty, plant and equipment
Goodwill and intangible assets
2010 Switzerland 464 221 3,032 1,923European Union 14,596 59 4,261 1,785– of which Germany 2,970 59 3,097 1,740Rest of Europe 1,630 2 42 1Europe 16,690 282 7,335 3,709
United States 16,446 1,372 5,849 8,394Rest of North America 1,051 16 118 88North America 17,497 1,388 5,967 8,482
Latin America 3,397 12 476 17
Japan 4,718 7 1,848 427Rest of Asia 3,591 5 991 218Asia 8,309 12 2,839 645
Africa, Australia and Oceania 1,580 – 112 2Total 47,473 1,694 16,729 12,855
2009Switzerland 499 427 2,744 2,326European Union 16,219 59 4,902 2,265– of which Germany 3,320 57 3,481 2,210Rest of Europe 1,568 – 45 2Europe 18,286 486 7,691 4,593
United States 17,208 1,499 6,554 9,074Rest of North America 948 2 123 93North America 18,156 1,501 6,677 9,167
Latin America 2,940 22 485 18
Japan 5,036 87 1,776 486Rest of Asia 3,166 4 959 –Asia 8,202 91 2,735 486
Africa, Australia and Oceania 1,467 – 109 2Total 49,051 2,100 17,697 14,266
Supplementary unaudited information on sales by therapeutic areas in the Pharmaceuticals Division and by business areas in the Diagnostics Division are given on pages 6 to 10 and 14 to 16 respectively. Sales are allocated to geographical areas by destination according to the location of the customer. Royalties and other operating income are allocated according to the location of the Group company that receives the revenue. European Union information is based on members of the EU as at 31 December 2010.
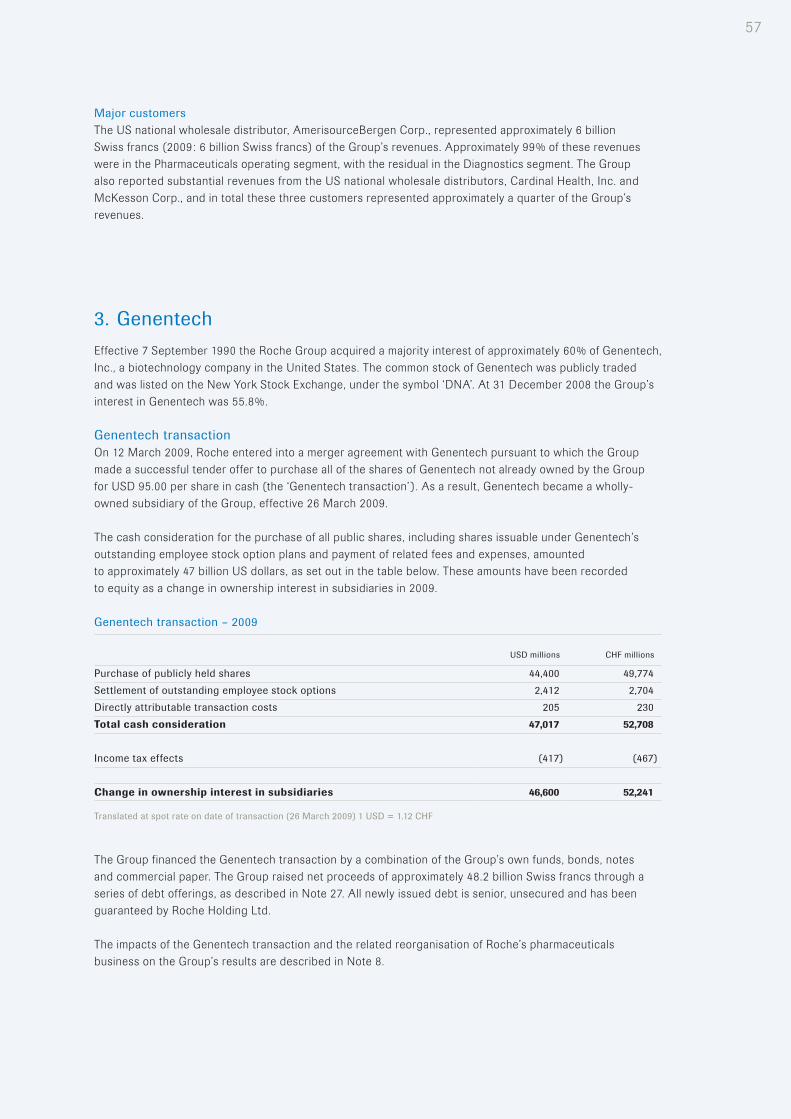
57
Major customersThe US national wholesale distributor, AmerisourceBergen Corp., represented approximately 6 billion Swiss francs (2009: 6 billion Swiss francs) of the Group’s revenues. Approximately 99% of these revenues were in the Pharmaceuticals operating segment, with the residual in the Diagnostics segment. The Group also reported substantial revenues from the US national wholesale distributors, Cardinal Health, Inc. and McKesson Corp., and in total these three customers represented approximately a quarter of the Group’s revenues.
3. GenentechEffective 7 September 1990 the Roche Group acquired a majority interest of approximately 60% of Genentech, Inc., a biotechnology company in the United States. The common stock of Genentech was publicly traded and was listed on the New York Stock Exchange, under the symbol ‘DNA’. At 31 December 2008 the Group’s interest in Genentech was 55.8%.
Genentech transactionOn 12 March 2009, Roche entered into a merger agreement with Genentech pursuant to which the Group made a successful tender offer to purchase all of the shares of Genentech not already owned by the Group for USD 95.00 per share in cash (the ‘Genentech transaction’). As a result, Genentech became a wholly-owned subsidiary of the Group, effective 26 March 2009.
The cash consideration for the purchase of all public shares, including shares issuable under Genentech’s outstanding employee stock option plans and payment of related fees and expenses, amounted to approximately 47 billion US dollars, as set out in the table below. These amounts have been recorded to equity as a change in ownership interest in subsidiaries in 2009.
Genentech transaction – 2009
USD millions CHF millions
Purchase of publicly held shares 44,400 49,774Settlement of outstanding employee stock options 2,412 2,704Directly attributable transaction costs 205 230Total cash consideration 47,017 52,708
Income tax effects (417) (467)
Change in ownership interest in subsidiaries 46,600 52,241
Translated at spot rate on date of transaction (26 March 2009) 1 USD = 1.12 CHF
The Group financed the Genentech transaction by a combination of the Group’s own funds, bonds, notes and commercial paper. The Group raised net proceeds of approximately 48.2 billion Swiss francs through a series of debt offerings, as described in Note 27. All newly issued debt is senior, unsecured and has been guaranteed by Roche Holding Ltd.
The impacts of the Genentech transaction and the related reorganisation of Roche’s pharmaceuticals business on the Group’s results are described in Note 8.

58 Roche Finance Report 2010 Roche Group – Notes to the Roche Group Consolidated Financial Statements
4. ChugaiEffective 1 October 2002 the Roche Group and Chugai completed an alliance to create a leading research-driven Japanese pharmaceutical company, which was formed by the merger of Chugai and Roche’s Japanese pharmaceuticals subsidiary, Nippon Roche. The merged company, known as Chugai, is a fully consolidated subsidiary of the Group. At 31 December 2010 the Group’s interest in Chugai was 61.6% (2009: 61.6%).
The common stock of Chugai is publicly traded and is listed on the Tokyo Stock Exchange under the stock code ‘TSE:4519’. Chugai prepares financial statements in conformity with accounting principles generally accepted in Japan (JGAAP). These are filed on a quarterly basis with the Tokyo Stock Exchange. Due to certain consolidation entries and differences in the requirements of International Financial Reporting Standards (IFRS) and JGAAP, there are differences between Chugai’s stand-alone results on a JGAAP basis and the results of Chugai as consolidated by the Roche Group in accordance with IFRS.
Roche’s relationship with Chugai Chugai has entered into certain agreements with Roche, which are discussed below:
Basic Alliance Agreement | As part of the Basic Alliance Agreement signed in December 2001, Roche and Chugai entered into certain arrangements covering the future operation and governance of Chugai. Amongst other matters these cover the following areas:
• The structuring of the alliance.
• Roche’s rights as a shareholder.
• Roche’s rights to nominate members of Chugai’s Board of Directors.
• Certain limitations to Roche’s ability to buy or sell Chugai’s common stock.
Chugai issues additional shares of common stock in connection with its convertible debt and equity compensation plans, and may issue additional shares for other purposes, which affects Roche’s percentage ownership interest. The Basic Alliance Agreement provides, amongst other matters, that Chugai will guarantee Roche’s right to maintain its shareholding percentage in Chugai at not less than 50.1%.
Licensing Agreements | Under the Japan Umbrella Rights Agreement signed in December 2001, Chugai has exclusive rights to market Roche’s pharmaceutical products in Japan. Chugai also has first right of refusal on the development and marketing in Japan of all development compounds advanced by Roche.
Under the Rest of the World Umbrella Rights Agreement signed in May 2002, Roche has the right of first refusal on the development and marketing of Chugai’s development compounds in markets outside Japan, excluding South Korea, if Chugai decides that it requires a partner for such activities.
Further to these agreements, Roche and Chugai have signed a series of separate agreements for certain specific products. Depending on the specific circumstances and the terms of the agreement, this may result in payments on an arm’s-length basis between Roche and Chugai, for any or all of the following matters:
• Upfront payments, if a right of first refusal to license a product is exercised.
• Milestone payments, dependent upon the achievement of agreed performance targets.
• Royalties on future product sales.
These specific product agreements may also cover the manufacture and supply of the respective products to meet the other party’s clinical and/or commercial requirements on an arm’s-length basis.
Research Collaboration Agreements | Roche and Chugai have entered into research collaboration agreements in the areas of small-molecule synthetic drug research and biotechnology-based drug discovery.

59
DividendsThe dividends distributed to third parties holding Chugai shares during 2010 totalled 99 million Swiss francs (2009: 87 million Swiss francs) and have been recorded against non-controlling interests (see Note 30). Dividends paid by Chugai to Roche are eliminated on consolidation as inter-company items.
Chugai share repurchasesDuring 2009 Chugai repurchased 640,800 of its common shares. As a result the Group’s ownership in Chugai increased to 61.6% from 61.5%. The total cash outflow, including repurchases of fractional shares, was 1.2 billion Japanese yen (14 million Swiss francs). There were no share repurchases in 2010.
Other mattersDetails of Chugai’s equity compensation plans are given in Note 11.
5. Financial income and financing costsFinancial income | in millions of CHF
Year ended 31 December2010 2009
Gains on sale of equity securities 119 55(Losses) on sale of equity securities (11) (4)Dividend income 2 1Gains (losses) on equity security derivatives, net 3 2Write-downs and impairments of equity securities (19) (18)Net income from equity securities 94 36
Interest income 51 179Gains on sale of debt securities 17 7(Losses) on sale of debt securities (4) (9)Gain (loss) on liquidation of debt securities – (238)Gains (losses) on debt security derivatives, net – 44Write-downs and impairments of long-term loans – (3)Net interest income and income from debt securities 64 (20)
Expected return on plan assets of defined benefit plans 10 562 507
Foreign exchange gains (losses), net (143) (990)Gains (losses) on foreign currency derivatives, net (4) 1,023Net foreign exchange gains (losses) (147) 33
Net other financial income (expense) (16) (2)
Total financial income 557 554

60 Roche Finance Report 2010 Roche Group – Notes to the Roche Group Consolidated Financial Statements
Financing costs | in millions of CHF
Year ended 31 December2010 2009
Interest expense (1,849) (1,733)Interest expense incurred on newly issued bonds and notes during bridging period – (139)Amortisation of debt discount 27 (47) (47)Gains (losses) on debt derivatives, net (1) –Gains (losses) on redemption and repurchase of bonds and notes, net 27 (255) (9)Gains (losses) on financial liabilities at fair-value-through-profit-or-loss, net – 6Time cost of provisions 25 (20) (21)Interest cost of defined benefit plans 10 (657) (656)Total financing costs (2,829) (2,599)
Net financial income | in millions of CHF
Year ended 31 December2010 2009
Financial income 557 554Financing costs (2,829) (2,599)Net financial income (2,272) (2,045)
Financial result from Treasury management (2,177) (1,896)Financial result from Pension management (95) (149)Net financial income (2,272) (2,045)
Genentech transaction financing costsAs described in Note 3, effective 26 March 2009 the Group purchased all publicly owned shares of Genentech for USD 95.00 per share in cash, with the total cash consideration of the transaction, including shares issuable under Genentech’s outstanding employee stock option plans and payment of related fees and expenses, being approximately 52.7 billion Swiss francs.
In order to execute this transaction, the Group liquidated certain debt securities into cash. This resulted in a net loss on these transactions of 238 million Swiss francs. Furthermore, due to the prevailing financial conditions, the Group issued bonds and notes in advance of the transaction totalling 48.2 billion Swiss francs through a series of debt offerings, as described in Note 27. The interest expense on these instruments for the bridging period between their issue and the completion of the Genentech transaction on 26 March 2009 was 139 million Swiss francs.
These were previously presented as ‘Exceptional financial costs’. As disclosed in Note 1, such income and expenses are no longer shown separately on the face of the income statement, but are now included as part of ‘Financial income’ or ‘Financing costs’, as appropriate. Appropriate reclassifications have been made to the 2009 disclosures in this Note.

61
6. Income taxes Income tax expenses | in millions of CHF
2010 2009
Current income taxes (2,569) (3,466)Adjustments recognised for current tax of prior periods 16 160Deferred income taxes 233 1,584Total income (expense) (2,320) (1,722)
As disclosed in Note 1, the income statement heading ‘Income taxes on exceptional items’ is no longer shown separately on the face of the income statement. Such income and expenses are included as part of ‘Income taxes’. Appropriate reclassifications have been made to the 2009 disclosures in this Note, including restatement of the reconciliation of the Group’s effective tax rate in the table below.
Since the Group operates internationally, it is subject to income taxes in many different tax jurisdictions. The Group calculates its average expected tax rate as a weighted average of the tax rates in the tax jurisdictions in which the Group operates. This rate changes from year to year due to changes in the mix of the Group’s taxable income and changes in local tax rates. The average expected rate increased in 2010 compared to 2009. There were no significant local tax rate changes in the main operating areas of the Group compared to 2009. The main driver of the increase comes from the US, which has a relatively higher local tax rate than the average Group rate. The Group’s taxable profits in the US increased significantly in 2010 which resulted in an increase in the percentage the US contributes to the overall mix of the Group’s profit. The increased profit made in the US is mainly due to lower global restructuring costs in the US recorded in 2010 (0.8 billion US dollars in 2010 compared to 1.8 billion US dollars in 2009). This more than offsets the increased interest expenses in the US. The Group’s effective tax rate can be reconciled to the Group’s average expected tax rate as follows:
Reconciliation of the Group’s effective tax rate
2010 2009
Average expected tax rate 20.2% 19.4%
Tax effect of– Utilisation of previously unrecognised tax losses –0.2% –0.1%– Non-taxable income/non-deductible expenses +0.9% +0.9%– Equity compensation plans +0.7% –1.0%– Research, development and other manufacturing tax credits –2.7% –3.3%– US state tax impacts +1.4% +0.4%– Other differences +0.4% +0.5%Group’s effective tax rate 20.7% 16.8%
The impact from equity compensation plans on the effective tax rate 2010 was an increase of 0.7%, while in 2009 it was a benefit of 1.0%. This is mainly due to the one-time impact of the accelerated vesting of Genentech plans in 2009. The increased profit contribution from the US also results in higher US state taxes which increases the Group’s effective tax rate.
The income tax benefits recorded in respect of equity compensation plans, which varies according to the price of the underlying equity, was 6 million Swiss francs (2009: 77 million Swiss francs, excluding accelerated vesting impacts from Genentech plans). Had the income tax benefits been recorded solely on the basis of the IFRS 2 expense multiplied by the applicable tax rate, then benefits of approximately 89 million Swiss francs (2009: 90 million Swiss francs) would have been recorded.

62 Roche Finance Report 2010 Roche Group – Notes to the Roche Group Consolidated Financial Statements
Tax effects of other comprehensive income | in millions of CHF
2010 2009Pre-tax amount
Tax benefit
After-tax amount
Pre-tax amount
Tax benefit
After-tax amount
Available-for-sale investments 11 6 17 369 (14) 355Cash flow hedges (300) 107 (193) 117 (42) 75Currency translation of foreign operations (498) – (498) 3,054 – 3,054Defined benefit post-employment plans (346) 80 (266) (72) 67 (5)Other comprehensive income (1,133) 193 (940) 3,468 11 3,479
Income tax assets (liabilities) | in millions of CHF
2010 2009 2008
Current income taxes– Assets 168 244 268– Liabilities (2,037) (2,478) (2,193)Net current income tax assets (liabilities) (1,869) (2,234) (1,925)
Deferred income taxes– Assets 2,368 2,573 1,829– Liabilities (885) (1,099) (1,409)Net deferred income tax assets (liabilities) 1,483 1,474 420
Movements in amounts recorded on the balance sheet for current income taxes are shown in the table below:
Current income taxes: movements in recognised net assets (liabilities) | in millions of CHF
2010 2009
Net current income tax asset (liability) at 1 January (2,234) (1,925)Income taxes paid 2,789 1,767(Charged) credited to the income statement– Current income taxes (2,569) (3,466)– Adjustments recognised for current tax of prior periods 16 160(Charged) credited to equity from equity compensation plans and other transactions with shareholders 9 1,179Currency translation effects and other 120 51Net current income tax asset (liability) at 31 December (1,869) (2,234)
Deferred income tax assets are recognised for tax loss carry-forwards only to the extent that realisation of the related tax benefit is probable. The Group has unrecognised tax losses, including valuation allowances, as follows:
Unrecognised tax losses: expiry
2010 2009Amount (mCHF)
Applicable tax rate
Amount (mCHF)
Applicable tax rate
Within one year 16 26% – –Between one and five years 70 17% 90 24%More than five years 1,522 9% 480 19%Total unrecognised tax losses 1,608 9% 570 20%
The ‘More than five years’ category includes losses that cannot be used for US state income tax purposes in those states which only permit tax reporting on a separate entity basis.

63
Deferred income tax liabilities have not been established for the withholding tax and other taxes that would be payable on the unremitted earnings of certain foreign subsidiaries, as such amounts are currently regarded as permanently reinvested. These unremitted earnings totalled 26.5 billion Swiss francs at 31 December 2010 (2009: 26.5 billion Swiss francs).
Movements in amounts recorded on the balance sheet for deferred income taxes are shown in the table below:
Deferred income taxes: movements in recognised net assets (liabilities) | in millions of CHF
Property, plant and equipment, and
intangible assets
Other temporary
differences Total
Year ended 31 December 2009Net deferred income tax asset (liability) at 1 January 2009 (3,040) 3,460 420Lonza Singapore acquisition 7 – – –Other business combinations 7 (22) 24 2(Charged) credited to the income statement 431 1,153 1,584(Charged) credited to other comprehensive income 28 – 11 11(Charged) credited to equity from equity compensation plans and other transactions with shareholders – (460) (460)Currency translation effects and other 25 (108) (83)Net deferred income tax asset (liability) at 31 December 2009 (2,606) 4,080 1,474
Year ended 31 December 2010Net deferred income tax asset (liability) at 1 January 2010 (2,606) 4,080 1,474Marcadia acquisition 7 (114) 7 (107)Other business combinations 7 (73) 23 (50)(Charged) credited to the income statement 120 113 233(Charged) credited to other comprehensive income 28 – 193 193(Charged) credited to equity from equity compensation plans and other transactions with shareholders – (34) (34)Currency translation effects and other 234 (460) (226)Net deferred income tax asset (liability) at 31 December 2010 (2,439) 3,922 1,483
7. Business combinations Acquisitions – 2010Marcadia | Effective 29 December 2010 the Group acquired a 100% controlling interest in Marcadia Biotech, Inc., ( ‘Marcadia’), a privately owned US company based in Carmel, Indiana. Marcadia is a biopharmaceutical company focused on developing a broad portfolio of drug candidates for the treatment of diabetes and obesity. Marcadia is now reported as part of the Roche Pharmaceuticals operating segment. The acquisition of Marcadia will allow the Group to integrate Marcadia’s development pipeline into its own Research and Development portfolio. Marcadia’s research programmes focus on new peptide therapies for the treatment of Type 2 diabetes and obesity. These include next generation peptides such as MAR701, a novel compound currently in Phase I development. Based on Marcadia’s unique peptide chemistry technology, these peptides are designed to offer patients improved efficacy, safety and convenience.

64 Roche Finance Report 2010 Roche Group – Notes to the Roche Group Consolidated Financial Statements
The total purchase consideration was 359 million Swiss francs, of which 273 million Swiss francs was paid in cash and 86 million Swiss francs arises from a contingent consideration arrangement. The payment from this arrangement is based on the achievement of two separate performance milestones that may arise between 2013 and 2015 and the range of outcomes, undiscounted, is between zero and 250 million US dollars, equivalent to 234 million Swiss francs at 31 December 2010 exchange rates. A liability of 86 million Swiss francs was recognised at the acquisition date, based on management’s best estimate of the probability-adjusted expected cash outflow from the arrangement. As at 31 December 2010 the amount recognised for this arrangement was unchanged based on the most recent management estimates.
The purchase consideration has been allocated as shown in the table below. The assets and liabilities and the amounts allocated to them are provisional based on preliminary information and valuations of the assets and liabilities of Marcadia. They are subject to adjustment during 2011 if new information is obtained about the facts and circumstances that existed at the acquisition date.
Marcadia acquisition: net assets acquired | in millions of CHF
Carrying value prior to acquisition
Fair value adjustments
Carrying value upon acquisition
Property, plant and equipment – – –Intangible assets– Product intangibles: in use – 89 89 – Product intangibles: not available for use – 196 196Inventories – – –Deferred income taxes 9 (116) (107)Cash 35 – 35Other net assets (liabilities) 1 – 1Net identifiable assets 45 169 214
Goodwill 145Purchase consideration 359
Goodwill represents a control premium and synergies that can be obtained from the Group’s existing business. None of the goodwill recognised is expected to be deductible for income tax purposes.
The fair value of other net assets (liabilities) includes receivables with a fair value of 5 million Swiss francs.
Other acquisitions | Effective 28 May 2010 the Group acquired a 100% controlling interest in Medingo Ltd. ( ‘Medingo’), a majority-owned subsidiary of the Elron group, based in Israel. Medingo is engaged in the development of a semi-disposable insulin patch pump and is reported as part of the Diagnostics operating segment. The acquisition broadens the Group’s portfolio of innovative insulin delivery technologies and strengthens its position in the diabetes care business. The total purchase consideration was 210 million Swiss francs, of which 178 million Swiss francs was paid in cash and 32 million Swiss francs arises from a contingent consideration arrangement. The payment from this arrangement is based on the achievement of four separate performance milestones that may arise between 2012 and 2014 and the range of outcomes, undiscounted, is between zero and 42 million US dollars, equivalent to 39 million Swiss francs at 31 December 2010 exchange rates. A liability of 32 million Swiss francs was recognised at the acquisition date, based on management’s best estimate of the probability-adjusted expected cash outflow from the arrangement. As at 31 December 2010 the amount recognised for this arrangement was unchanged based on the most recent management estimates.

65
Effective 3 September 2010 the Group acquired a 100% controlling interest in BioImagene, Inc., ( ‘BioImagene’), a privately owned US company, based in Sunnyvale, California. BioImagene is engaged in the digital pathology workflow and analysis field and is reported as part of the Diagnostics operating segment. The acquisition complements and strengthens the Group’s portfolio in image analysis and diagnosis. The total purchase consideration was 86 million Swiss francs in cash.
There were other minor business combinations in the Diagnostics business with a total purchase consideration of 2 million Swiss francs in cash.
The combined purchase consideration has been allocated as follows:
Other acquisitions – 2010: net assets acquired | in millions of CHF
Carrying value prior to acquisition
Fair value adjustments
Carrying value upon acquisition
Property, plant and equipment 2 – 2Intangible assets– Product intangibles: in use – 195 195– Product intangibles: not available for use – 52 52– Technology intangibles: in use – 4 4Inventories 2 – 2Deferred income taxes – (50) (50)Cash – – –Other net assets (liabilities) (26) – (26)Net identifiable assets (liabilities) (22) 201 179
Goodwill 119Purchase consideration 298
Goodwill represents a control premium and synergies that can be obtained from the Group’s existing business. None of the goodwill recognised is expected to be deductible for income tax purposes.
The fair value of other net assets (liabilities) does not include any receivables.
Directly attributable transaction costs of 2 million Swiss francs were incurred in these acquisitions. These are reported within general and administration expenses in the current period as part of the operating result of the Roche Pharmaceuticals and Diagnostics operating segment (1 million Swiss francs each).

66 Roche Finance Report 2010 Roche Group – Notes to the Roche Group Consolidated Financial Statements
Acquisitions – 2010: impact on results | in millions of CHF
Revenues from external
customers
Inventory fair value
adjustment
Amortisation of intangible
assetsOperating
profit Net income
Impact on reported resultsMarcadia – – – – –Pharmaceuticals Division – – – – –
Medingo – – (8) (18) (13)BioImagene 1 – (1) (6) (4)Minor business combinations – – – – –Diagnostics Division 1 – (9) (24) (17)
Group 1 – (9) (24) (17)
Estimated impact on results if acquisition assumed effective 1 January 2010Marcadia 21 – (9) (1) –Pharmaceuticals Division 21 – (9) (1) –
Medingo – – (14) (31) (23)BioImagene 2 – (1) (19) (12)Minor business combinations – – (1) (2) (1)Diagnostics Division 2 – (16) (52) (36)
Group 23 – (25) (53) (36)
The above figures exclude directly attributable acquisition-related costs of 1 million Swiss francs related to acquisitions by the Pharmaceuticals Division and 1 million Swiss francs related to acquisitions by the Diagnostics Division. Corresponding tax impacts are also excluded.The figures exclude integration costs of 3 million Swiss francs related to Medingo and BioImagene. Corresponding tax impacts are also excluded.
Acquisitions – 2010: net cash outflow | in millions of CHF
Cash consideration paid
Cash in acquired company
Net cash outflow
Marcadia (273) 35 (238)Other acquisitions (266) – (266)Total (539) 35 (504)
Acquisitions – 2009Lonza Singapore | In 2006 Genentech entered into a supply agreement for the manufacture of certain Genentech products at a facility under construction in Singapore by Lonza Group Ltd. ( ‘Lonza’). Genentech was committed to fund the pre-commissioning production qualification costs at this facility and, upon FDA licensure, Genentech was committed to purchase 100% of products successfully manufactured at the facility for a period of three years after commissioning of the facility. Genentech also received an exclusive option to purchase Lonza’s Singapore facility during the period from 2007 up to one year after FDA licensure for a purchase price of 290 million US dollars. Genentech also entered into a loan agreement with Lonza to advance up to 299 million US dollars to Lonza for the construction of the Singapore facility. If Genentech exercised its option to purchase the facility then any outstanding advances may be offset against the purchase price. If Genentech did not exercise its purchase option then the advances may be offset against supply purchases. Regardless of whether the purchase option were exercised, Genentech would be obliged to make a milestone payment of 70 million US dollars if certain performance milestones were met at the facility being constructed.
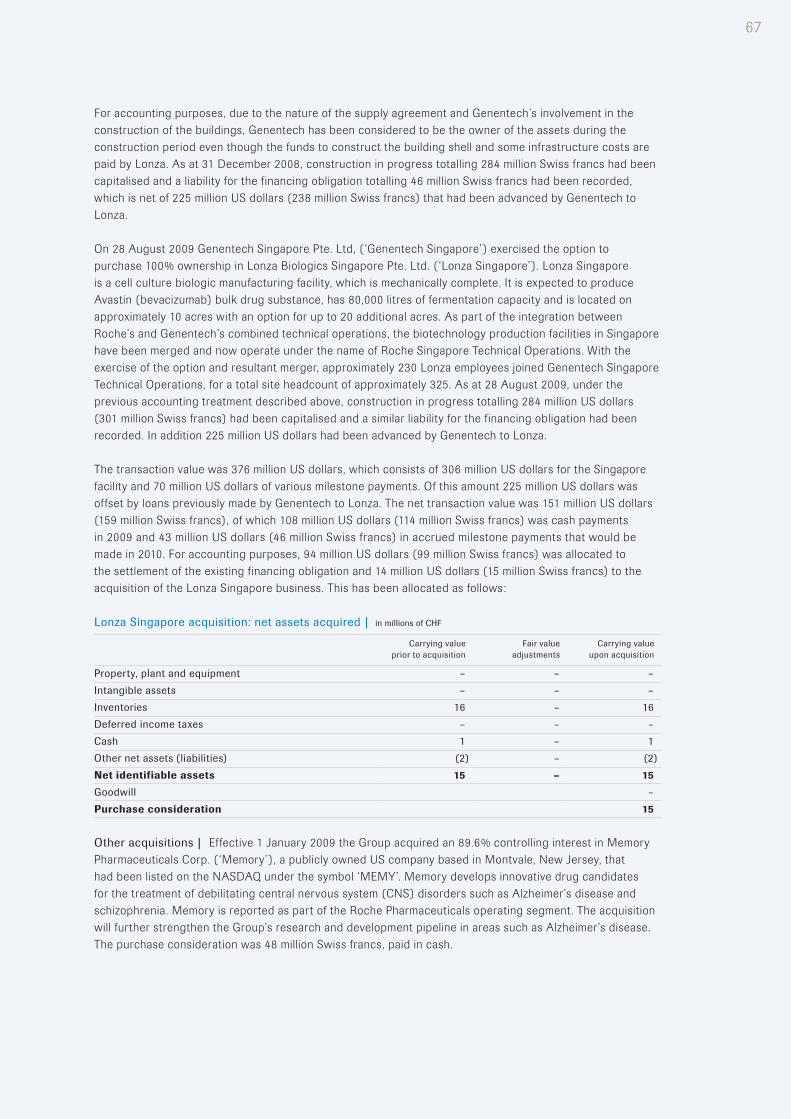
67
For accounting purposes, due to the nature of the supply agreement and Genentech’s involvement in the construction of the buildings, Genentech has been considered to be the owner of the assets during the construction period even though the funds to construct the building shell and some infrastructure costs are paid by Lonza. As at 31 December 2008, construction in progress totalling 284 million Swiss francs had been capitalised and a liability for the financing obligation totalling 46 million Swiss francs had been recorded, which is net of 225 million US dollars (238 million Swiss francs) that had been advanced by Genentech to Lonza.
On 28 August 2009 Genentech Singapore Pte. Ltd, ( ‘Genentech Singapore’) exercised the option to purchase 100% ownership in Lonza Biologics Singapore Pte. Ltd. ( ‘Lonza Singapore’). Lonza Singapore is a cell culture biologic manufacturing facility, which is mechanically complete. It is expected to produce Avastin (bevacizumab) bulk drug substance, has 80,000 litres of fermentation capacity and is located on approximately 10 acres with an option for up to 20 additional acres. As part of the integration between Roche’s and Genentech’s combined technical operations, the biotechnology production facilities in Singapore have been merged and now operate under the name of Roche Singapore Technical Operations. With the exercise of the option and resultant merger, approximately 230 Lonza employees joined Genentech Singapore Technical Operations, for a total site headcount of approximately 325. As at 28 August 2009, under the previous accounting treatment described above, construction in progress totalling 284 million US dollars (301 million Swiss francs) had been capitalised and a similar liability for the financing obligation had been recorded. In addition 225 million US dollars had been advanced by Genentech to Lonza.
The transaction value was 376 million US dollars, which consists of 306 million US dollars for the Singapore facility and 70 million US dollars of various milestone payments. Of this amount 225 million US dollars was offset by loans previously made by Genentech to Lonza. The net transaction value was 151 million US dollars (159 million Swiss francs), of which 108 million US dollars (114 million Swiss francs) was cash payments in 2009 and 43 million US dollars (46 million Swiss francs) in accrued milestone payments that would be made in 2010. For accounting purposes, 94 million US dollars (99 million Swiss francs) was allocated to the settlement of the existing financing obligation and 14 million US dollars (15 million Swiss francs) to the acquisition of the Lonza Singapore business. This has been allocated as follows:
Lonza Singapore acquisition: net assets acquired | in millions of CHF
Carrying value prior to acquisition
Fair value adjustments
Carrying value upon acquisition
Property, plant and equipment – – –Intangible assets – – –Inventories 16 – 16Deferred income taxes – – –Cash 1 – 1Other net assets (liabilities) (2) – (2)Net identifiable assets 15 – 15
Goodwill –Purchase consideration 15
Other acquisitions | Effective 1 January 2009 the Group acquired an 89.6% controlling interest in Memory Pharmaceuticals Corp. ( ‘Memory’), a publicly owned US company based in Montvale, New Jersey, that had been listed on the NASDAQ under the symbol ‘MEMY’. Memory develops innovative drug candidates for the treatment of debilitating central nervous system (CNS) disorders such as Alzheimer’s disease and schizophrenia. Memory is reported as part of the Roche Pharmaceuticals operating segment. The acquisition will further strengthen the Group’s research and development pipeline in areas such as Alzheimer’s disease. The purchase consideration was 48 million Swiss francs, paid in cash.

68 Roche Finance Report 2010 Roche Group – Notes to the Roche Group Consolidated Financial Statements
There were other minor business combinations in the Diagnostics business with a total purchase consideration of 57 million Swiss francs, of which 55 million Swiss francs was in cash and 2 million Swiss francs from a contingent consideration arrangement. A liability of 2 million Swiss francs was recognised at the acquisition date, based on management’s best estimate at that time of the probability-adjusted expected cash outflow from the arrangement. As at 31 December 2009 the amount recognised for this arrangement was reduced to zero, based on the most recent management estimates at that time.
The combined purchase consideration has been allocated as follows:
Other acquisitions – 2009: net assets acquired | in millions of CHF
Carrying value prior to acquisition
Fair value adjustments
Carrying value upon acquisition
Property, plant and equipment 3 – 3Goodwill 3 (3) –Intangible assets– Product intangibles: in use – 17 17– Marketing intangibles – 25 25– Product intangibles: not available for use – 47 47Inventories 7 – 7Provisions (4) – (4)Deferred income taxes 3 (1) 2Cash 19 – 19Other net assets (liabilities) (22) – (22)Net identifiable assets (liabilities) 9 85 94
Non-controlling interests (4)Goodwill 15Purchase consideration 105
Subsequent to the effective date of the acquisition on 1 January 2009, the Group purchased the remaining shares in Memory held by third parties to give the Group a 100% interest in Memory. The cash consideration was 6 million Swiss francs, which has been recorded to equity as a change in ownership interest in subsidiaries.
Goodwill represents a control premium and synergies that can be obtained from the Group’s existing business. None of the goodwill recognised is expected to be deductible for income tax purposes.
The fair value of other net assets (liabilities) includes receivables with a fair value of 4 million Swiss francs which includes an allowance for doubtful accounts of 1 million Swiss francs.
Directly attributable acquisition-related costs of 2 million Swiss francs were incurred in these acquisitions. These are reported within general and administration expenses in the current period as part of the operating result of the Pharmaceuticals operating segment (1 million Swiss francs) and the Diagnostics operating segment (1 million Swiss francs).
Acquisitions – 2009: net cash outflow | in millions of CHF
Cash consideration paid
Cash in acquired company
Net cash outflow
Lonza Singapore (15) 1 (14)Other acquisitions (103) 19 (84)Total (118) 20 (98)
The above cash consideration does not include the subsequent payment of 6 million Swiss francs to purchase the remaining shares in Memory held by third parties to give the Group a 100% interest in Memory. This is reported as financing cash flow in the statement of cash flows within the heading ‘Change in ownership interest in subsidiaries’.

69
Contingent consideration arrangementsThe Group is party to certain contingent consideration arrangements arising from previous business combination arrangements. The provisions for these arrangements are recorded as part of other provisions (see Note 25) and are set out in the table below.
Provisions for contingent consideration arrangements | in millions of CHF
2010 2009
At 1 January 15 7Additional provisions created 3 8Unused amounts reversed – (2)Utilised during the year (3) –Unwinding of discount – –Business combinations 7
– Marcadia 86 –– Medingo 32 –– Minor business combinations – 2Currency translation effects (1) –At 31 December 132 15
Expected outflow of resources– Within one year 17 15– Between one to two years – –– Between two to three years 85 –– More than three years 30 –Total 132 15
8. Global restructuring plansGenentech transaction: restructuring and integrationOn 21 July 2008 the Group announced an offer to purchase all outstanding shares of Genentech. Following the closing of the transaction, Genentech’s South San Francisco site would become the headquarters of the Group’s combined pharmaceuticals operations in the United States. On 21 July 2008 the Group also announced that Roche’s pharmaceuticals business in the US would close manufacturing operations at its site in Nutley, New Jersey, and commercial operations would be moved to Genentech. The research site at Palo Alto, California, would be closed with the research activities being transferred to Nutley and to Genentech. Subsequent to these announcements, initial restructuring activities started at the Nutley and Palo Alto sites in 2008.

70 Roche Finance Report 2010 Roche Group – Notes to the Roche Group Consolidated Financial Statements
As described in Note 3, the Genentech transaction was completed effective 26 March 2009. Following this the Pharmaceuticals Division initiated a detailed integration programme to align the Genentech business and the rest of the Roche’s pharmaceuticals business. Genentech’s South San Francisco site has now been established as the headquarters of the pharmaceuticals business in the US, including commercial operations for the US market. Genentech Research and Early Development has been set up as an autonomous unit while Genentech’s late-stage development activities have been integrated with the global Pharmaceuticals Division network. The integration programme included prioritising projects within the shared portfolio and eliminating activities that were either duplicated or no longer required, notably in the administration function.
Following the completion of the transaction, the Pharmaceuticals Division carried out a detailed reassessment of its global manufacturing network, with particular emphasis on its biotech manufacturing facilities. As a result several manufacturing facilities and construction projects have been discontinued, notably a bulk drug production unit on part of the site at Vacaville in California. In 2009 an impairment charge of 940 million Swiss francs was recorded in respect of this facility, which had a previous carrying value of 1.3 billion Swiss francs. Assets with a carrying value of 0.3 billion Swiss francs were subsequently transferred to other facilities for continuing use.
These restructuring activities have been substantially completed by the end of 2010. The total cost was 3.3 billion Swiss francs, which includes 2.7 billion Swiss francs that were incurred in 2008 and 2009. Of this total of 3.3 billion Swiss francs approximately 2.0 billion Swiss francs were non-cash.
Genentech transaction: restructuring and integration costs | in millions of CHF
2010 2009
Employee-related costs– Termination costs 43 227– Pensions and other post-employment benefits 6 (33)– Genentech stock options: accelerated vesting expenses 11 – 236– Other retention plans and other employee benefits 15 40– Other employee-related costs 83 100Total employee-related costs 147 570
Site closure costs– Impairment of property, plant and equipment 23 1,083– Accelerated depreciation of property, plant and equipment 55 103– Other site closure costs 116 232Total site closure costs 194 1,418
Impairment of intangible assets – 286Other reorganisation expenses 255 141Total 596 2,415
Operational ExcellenceOn 17 November 2010 the Group announced details concerning the ‘Operational Excellence’ global restructuring plan. The plan is aimed at adapting cost structures to an increasingly challenging market environment and achieving significant efficiency and productivity gains. The planned measures will enable sustained investment in research and product development and thus strengthen the Group’s long-term innovation capability.
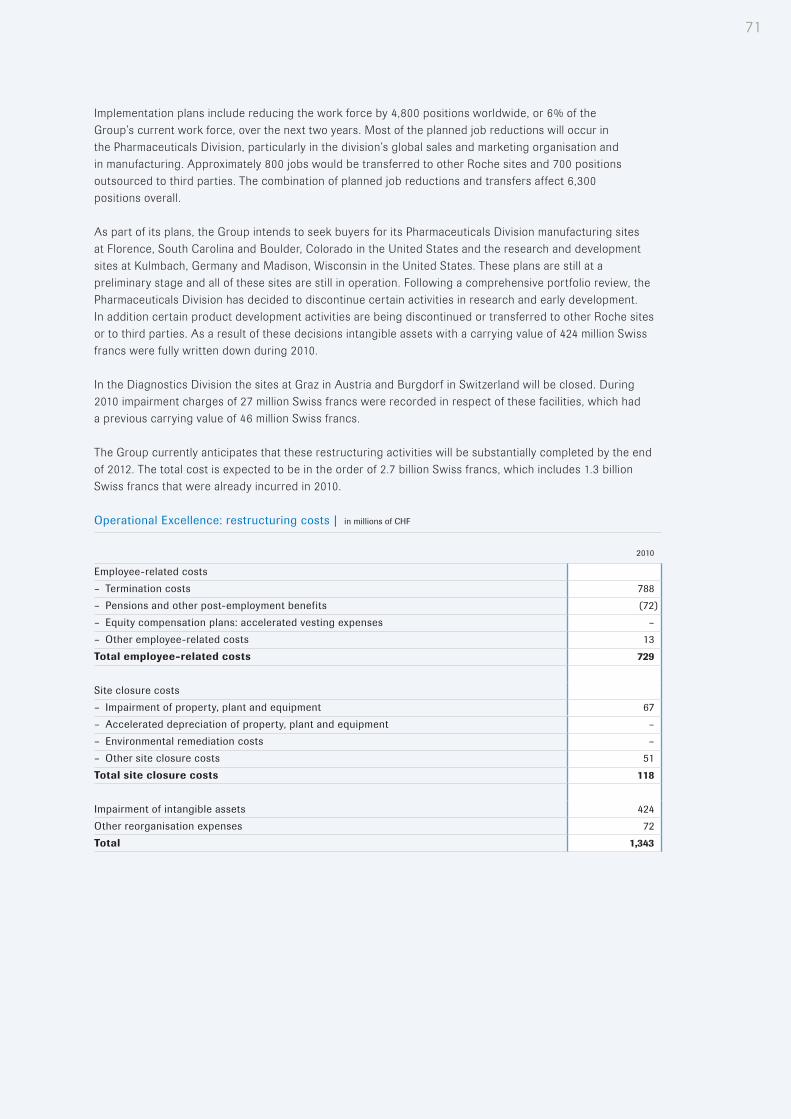
71
Implementation plans include reducing the work force by 4,800 positions worldwide, or 6% of the Group’s current work force, over the next two years. Most of the planned job reductions will occur in the Pharmaceuticals Division, particularly in the division’s global sales and marketing organisation and in manufacturing. Approximately 800 jobs would be transferred to other Roche sites and 700 positions outsourced to third parties. The combination of planned job reductions and transfers affect 6,300 positions overall.
As part of its plans, the Group intends to seek buyers for its Pharmaceuticals Division manufacturing sites at Florence, South Carolina and Boulder, Colorado in the United States and the research and development sites at Kulmbach, Germany and Madison, Wisconsin in the United States. These plans are still at a preliminary stage and all of these sites are still in operation. Following a comprehensive portfolio review, the Pharmaceuticals Division has decided to discontinue certain activities in research and early development. In addition certain product development activities are being discontinued or transferred to other Roche sites or to third parties. As a result of these decisions intangible assets with a carrying value of 424 million Swiss francs were fully written down during 2010.
In the Diagnostics Division the sites at Graz in Austria and Burgdorf in Switzerland will be closed. During 2010 impairment charges of 27 million Swiss francs were recorded in respect of these facilities, which had a previous carrying value of 46 million Swiss francs.
The Group currently anticipates that these restructuring activities will be substantially completed by the end of 2012. The total cost is expected to be in the order of 2.7 billion Swiss francs, which includes 1.3 billion Swiss francs that were already incurred in 2010.
Operational Excellence: restructuring costs | in millions of CHF
2010
Employee-related costs– Termination costs 788– Pensions and other post-employment benefits (72)– Equity compensation plans: accelerated vesting expenses –– Other employee-related costs 13Total employee-related costs 729
Site closure costs– Impairment of property, plant and equipment 67– Accelerated depreciation of property, plant and equipment –– Environmental remediation costs –– Other site closure costs 51Total site closure costs 118
Impairment of intangible assets 424Other reorganisation expenses 72Total 1,343

72 Roche Finance Report 2010 Roche Group – Notes to the Roche Group Consolidated Financial Statements
Classification of Operational Excellence restructuring costs | in millions of CHF
2010Depreciation,
amortisation and impairment Other costs Total
Cost of sales– Roche Pharmaceuticals 34 32 66– Diagnostics 23 68 91Marketing and distribution– Roche Pharmaceuticals – 312 312– Diagnostics – 5 5Research and development– Roche Pharmaceuticals 424 277 701– Diagnostics 4 38 42General and administration– Roche Pharmaceuticals 6 107 113– Diagnostics – 6 6– Corporate – 7 7Total 491 852 1,343
Total by operating segment– Roche Pharmaceuticals 464 728 1,192– Chugai – – –– Diagnostics 27 117 144– Corporate – 7 7Total 491 852 1,343
9. Employee benefitsEmployee remuneration | in millions of CHF
2010 2009
Wages and salaries 8,775 8,781Social security costs 936 934Defined contribution post-employment plans 305 295Operating expenses for defined benefit post-employment plans 10 235 315Equity compensation plans 11 292 595Termination costs– Genentech transaction: restructuring and integration 8 43 227– Operational excellence 8 788 –Other employee benefits 465 784Employee remuneration included in operating results 11,839 11,931
Expected return on plan assets for defined benefit post-employment plans 10 (562) (507)Interest cost for defined benefit post-employment plans 10 657 656Total employee remuneration 11,934 12,080
73
Other employee benefits consist mainly of life insurance schemes and certain other insurance schemes providing medical coverage and other long-term and short-term disability benefits. Other employee benefits in 2009 also include 192 million Swiss francs of expenses related to the Genentech Employee Retention Program. The charges for employee benefits in the operating results are included in the relevant expenditure line by function. The expected return on plan assets and interest cost from defined benefit plans are included as part of financial income and financing costs, respectively (see Note 5).
10. Pensions and other post-employment benefits The Group’s objective is to provide attractive and competitive post-employment benefits to employees, while at the same time ensuring that the various plans are appropriately financed and managing any potential impacts on the Group’s long-term financial position. Most employees are covered by pension plans sponsored by Group companies. The nature of such plans varies according to legal regulations, fiscal requirements and market practice in the countries in which the employees are employed. Other post-employment benefits consist mostly of post-retirement healthcare and life insurance schemes, principally in the United States. Post-employment benefit plans are classified for IFRS as ‘defined contribution plans’ if the Group pays fixed contributions into a separate fund or to a third-party financial institution and will have no further legal or constructive obligation to pay further contributions. All other plans are classified as ‘defined benefit plans’, even if the Group’s potential obligation is relatively minor or has a relatively remote possibility of arising. Consequently most of the Group’s post-employment benefit plans are classified as ‘defined benefit plans’ for the purpose of these financial statements.
Defined contribution plansDefined contribution plans typically consist of payments by employees and by the Group to funds administered by third parties. Payments by the Group were 305 million Swiss francs (2009: 295 million Swiss francs). No assets or liabilities are recognised in the Group’s balance sheet in respect of such plans, apart from regular prepayments and accruals of the contributions withheld from employees’ wages and salaries and of the Group’s contributions.
Defined benefit plansThe Group’s major defined benefit plans are located in Switzerland, the United States, Germany, the United Kingdom and Japan. Plans are usually established as trusts independent of the Group and are funded by payments from the Group and by employees. In some cases, notably for the major defined benefit plans in Germany, the plan is unfunded and the Group pays pensions to retired employees directly from its own financial resources.
Current and past service costs are charged to the appropriate income statement heading within the operating results. Pension plan administration and funding is overseen at a corporate level, and any settlement gains and losses resulting from changes in funding arrangements are reported as general and administration expenses within the Corporate segment. The expected returns on plan assets and interest costs are charged to financial income and financing costs, respectively. Actuarial gains and losses are recorded directly in equity. The recognition of pension assets is limited to the total of the present value of any future refunds from the plans or reductions in future contributions to the plans and any cumulative unrecognised past service costs. Adjustments arising from the limit on the recognition of assets for defined benefit plans are recorded directly in equity.

74 Roche Finance Report 2010 Roche Group – Notes to the Roche Group Consolidated Financial Statements
Defined benefit plans: expenses | in millions of CHF
2010 2009
Pension plans
Other post-employment
benefit plans TotalPension
plans
Other post-employment
benefit plans Total
Current service cost 339 20 359 335 18 353Past service cost (42) 13 (29) 2 8 10(Gain) loss on curtailment (78) (17) (95) (47) (1) (48)(Gain) loss on settlement – – – – – –Total operating expenses 219 16 235 290 25 315
Expected return on plan assets (529) (33) (562) (475) (32) (507)Interest cost 597 60 657 597 59 656Total financial (income) expense 68 27 95 122 27 149
Total expense recognised in income statement 287 43 330 412 52 464
The funding of the Group’s various defined benefit plans is overseen at a corporate level. Qualified independent actuaries carry out valuations on a regular basis and for major plans annually as at the reporting date. For funded plans, which are usually trusts independent of the Group’s finances, the net asset/liability recognised on the Group’s balance sheet corresponds to the over/under funding of the plan, adjusted for unrecognised past service costs. For unfunded plans, where the Group meets the pension obligations directly from its own financial resources, a liability for the defined benefit obligation is recorded in the Group’s balance sheet. Pension assets and liabilities in different defined benefit plans are not offset unless the Group has a legally enforceable right to use the surplus in one plan to settle obligations in the other plan. Amounts recognised in the balance sheet for post-employment benefits are predominantly non-current and are reported in non-current assets and liabilities.
Defined benefit plans: funding status | in millions of CHF
2010 2009Funded
plansUnfunded
plans TotalFunded
plansUnfunded
plans Total
Fair value of plan assets 10,667 – 10,667 10,530 – 10,530Defined benefit obligation (11,464) (3,080) (14,544) (11,267) (3,486) (14,753)Over (under) funding (797) (3,080) (3,877) (737) (3,486) (4,223)
Unrecognised past service costs (15) (16) (31) (18) (1) (19)Limit on asset recognition (4) – (4) (3) – (3)Reimbursement rights 83 21 104 104 16 120Net recognised asset (liability) (733) (3,075) (3,808) (654) (3,471) (4,125)
Reported as– Defined benefit plans 455 – 455 481 – 481– Reimbursement rights 83 21 104 104 16 120Post-employment benefit assets 538 21 559 585 16 601
Post-employment benefit liabilities (1,271) (3,096) (4,367) (1,239) (3,487) (4,726)Net recognised asset (liability) (733) (3,075) (3,808) (654) (3,471) (4,125)
Further detailed information on plan assets and the defined benefit obligation is given below.

75
Defined benefit plans: fair value of plan assets and reimbursement rights | in millions of CHF
2010 2009Fair value
of plan assets
Reim– bursement
rights Total
Fair value of plan assets
Reim– bursement
rights Total
At 1 January 10,530 120 10,650 9,438 89 9,527Expected return on plan assets 554 8 562 500 7 507Actuarial gains (losses) 249 (9) 240 691 33 724Currency translation effects and other (426) (11) (437) (31) (4) (35)Employer contributions 198 (2) 196 338 (5) 333Employee contributions 72 – 72 68 – 68Benefits paid – funded plans (510) – (510) (474) – (474)Past service cost – – – – – –Divestment of subsidiaries – – – – – –Curtailments – (2) (2) – – –Settlements – – – – – –At 31 December 10,667 104 10,771 10,530 120 10,650
2010 2009
Invested as– Shares and other equity instruments 4,160 4,709– Bonds, debentures and other debt instruments 4,410 4,179– Property 589 583– Other assets 1,612 1,179Total 10,771 10,650
Included within the fair value of plan assets are none of the Group’s shares (2009: 27 thousand shares with a fair value of 5 million Swiss francs) and 601 thousand of the Group’s non-voting equity securities with a fair value of 82 million Swiss francs (2009: 407 thousand non-voting equity securities with a total fair value of 71 million Swiss francs).

76 Roche Finance Report 2010 Roche Group – Notes to the Roche Group Consolidated Financial Statements
Defined benefit plans: defined benefit obligation | in millions of CHF
2010 2009
Pension plans
Other post-employment
benefit plans TotalPension
plans
Other post-employment
benefit plans Total
At 1 January 13,665 1,088 14,753 12,669 913 13,582Current service cost 339 20 359 335 18 353Interest cost 597 60 657 597 59 656Employee contributions 72 – 72 68 – 68Actuarial (gains) losses 646 (62) 584 619 174 793Currency translation effects and other (995) (98) (1,093) (32) (24) (56)Benefits paid – funded plans (462) (48) (510) (427) (47) (474)Benefits paid – unfunded plans (126) (12) (138) (122) (12) (134)Past service cost (38) (5) (43) 5 8 13Divestment of subsidiaries – – – – – –Curtailments (78) (19) (97) (47) (1) (48)Settlements – – – – – –At 31 December 13,620 924 14,544 13,665 1,088 14,753
Of which– Funded plans 10,803 661 11,464 10,451 816 11,267– Unfunded plans 2,817 263 3,080 3,214 272 3,486
Actuarial assumptionsActuarial assumptions are unbiased and mutually compatible estimates of variables that determine the ultimate cost of providing post-employment benefits. They are set on an annual basis by local management and actuaries and are subject to approval by corporate management and the Group’s actuaries. Actuarial assumptions consist of demographic assumptions on matters such as mortality and employee turnover, and financial assumptions on matters such as salary and benefit levels, interest rates, return on investments and costs of medical benefits. The Group operates defined benefit plans in many countries and the actuarial assumptions vary based upon local economic and social conditions.
Demographic assumptions | The most significant demographic assumptions relate to mortality rates. The Group’s actuaries use mortality tables which take into account historic patterns and expected changes, such as further increases in longevity. The mortality tables used for the major schemes are:
• Germany: Heubeck tables 2005G.
• Japan: National Census (No. 20 Life Table).
• Switzerland: BVG 2005.
• United Kingdom: non-pensioners – S1NA_L table rated up 1.5 years (male) and 0.5 years (female). Future improvements: medium cohort (from 2002) with a 1% underpin (from 2009)
• United Kingdom: pensioners – S1NA_L table rated up 1.5 years. Future improvements: medium cohort (from 2002) with a 1% underpin (from 2009).
• United States: RP2000 projected to 2017.
Rates of employee turnover, disability and early retirement are based on historical behaviour within Group companies.
Financial assumptions | These are based on market expectations for the period over which the obligations are to be settled. The ranges of assumptions used in the actuarial valuations of the most significant plans, which are in countries with stable currencies and interest rates, are shown below.
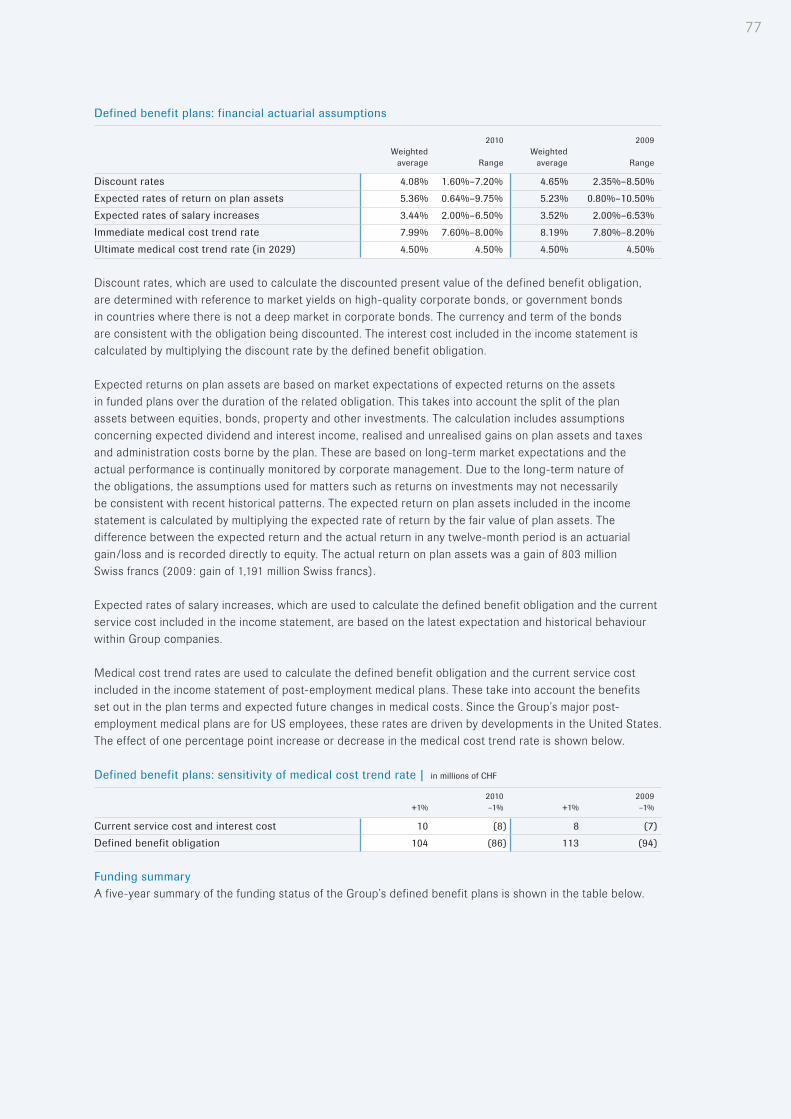
77
Defined benefit plans: financial actuarial assumptions
2010 2009Weighted
average RangeWeighted
average Range
Discount rates 4.08% 1.60%–7.20% 4.65% 2.35%–8.50%Expected rates of return on plan assets 5.36% 0.64%–9.75% 5.23% 0.80%–10.50%Expected rates of salary increases 3.44% 2.00%–6.50% 3.52% 2.00%–6.53%Immediate medical cost trend rate 7.99% 7.60%–8.00% 8.19% 7.80%–8.20%Ultimate medical cost trend rate (in 2029) 4.50% 4.50% 4.50% 4.50%
Discount rates, which are used to calculate the discounted present value of the defined benefit obligation, are determined with reference to market yields on high-quality corporate bonds, or government bonds in countries where there is not a deep market in corporate bonds. The currency and term of the bonds are consistent with the obligation being discounted. The interest cost included in the income statement is calculated by multiplying the discount rate by the defined benefit obligation.
Expected returns on plan assets are based on market expectations of expected returns on the assets in funded plans over the duration of the related obligation. This takes into account the split of the plan assets between equities, bonds, property and other investments. The calculation includes assumptions concerning expected dividend and interest income, realised and unrealised gains on plan assets and taxes and administration costs borne by the plan. These are based on long-term market expectations and the actual performance is continually monitored by corporate management. Due to the long-term nature of the obligations, the assumptions used for matters such as returns on investments may not necessarily be consistent with recent historical patterns. The expected return on plan assets included in the income statement is calculated by multiplying the expected rate of return by the fair value of plan assets. The difference between the expected return and the actual return in any twelve-month period is an actuarial gain/loss and is recorded directly to equity. The actual return on plan assets was a gain of 803 million Swiss francs (2009: gain of 1,191 million Swiss francs).
Expected rates of salary increases, which are used to calculate the defined benefit obligation and the current service cost included in the income statement, are based on the latest expectation and historical behaviour within Group companies.
Medical cost trend rates are used to calculate the defined benefit obligation and the current service cost included in the income statement of post-employment medical plans. These take into account the benefits set out in the plan terms and expected future changes in medical costs. Since the Group’s major post-employment medical plans are for US employees, these rates are driven by developments in the United States. The effect of one percentage point increase or decrease in the medical cost trend rate is shown below.
Defined benefit plans: sensitivity of medical cost trend rate | in millions of CHF
2010 2009+1% –1% +1% –1%
Current service cost and interest cost 10 (8) 8 (7)Defined benefit obligation 104 (86) 113 (94)
Funding summaryA five-year summary of the funding status of the Group’s defined benefit plans is shown in the table below.
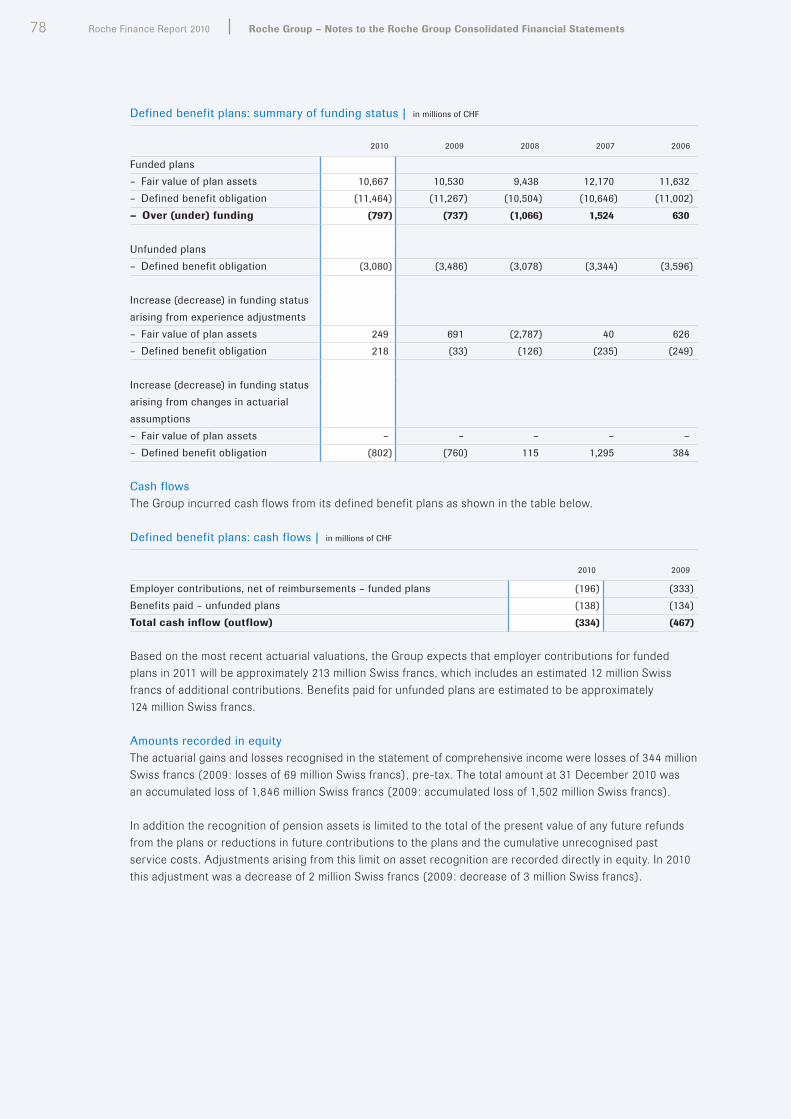
78 Roche Finance Report 2010 Roche Group – Notes to the Roche Group Consolidated Financial Statements
Defined benefit plans: summary of funding status | in millions of CHF
2010 2009 2008 2007 2006
Funded plans– Fair value of plan assets 10,667 10,530 9,438 12,170 11,632– Defined benefit obligation (11,464) (11,267) (10,504) (10,646) (11,002)– Over (under) funding (797) (737) (1,066) 1,524 630
Unfunded plans– Defined benefit obligation (3,080) (3,486) (3,078) (3,344) (3,596)
Increase (decrease) in funding status arising from experience adjustments– Fair value of plan assets 249 691 (2,787) 40 626– Defined benefit obligation 218 (33) (126) (235) (249)
Increase (decrease) in funding status arising from changes in actuarial assumptions– Fair value of plan assets – – – – –– Defined benefit obligation (802) (760) 115 1,295 384
Cash flows The Group incurred cash flows from its defined benefit plans as shown in the table below.
Defined benefit plans: cash flows | in millions of CHF
2010 2009
Employer contributions, net of reimbursements – funded plans (196) (333)Benefits paid – unfunded plans (138) (134)Total cash inflow (outflow) (334) (467)
Based on the most recent actuarial valuations, the Group expects that employer contributions for funded plans in 2011 will be approximately 213 million Swiss francs, which includes an estimated 12 million Swiss francs of additional contributions. Benefits paid for unfunded plans are estimated to be approximately 124 million Swiss francs.
Amounts recorded in equityThe actuarial gains and losses recognised in the statement of comprehensive income were losses of 344 million Swiss francs (2009: losses of 69 million Swiss francs), pre-tax. The total amount at 31 December 2010 was an accumulated loss of 1,846 million Swiss francs (2009: accumulated loss of 1,502 million Swiss francs).
In addition the recognition of pension assets is limited to the total of the present value of any future refunds from the plans or reductions in future contributions to the plans and the cumulative unrecognised past service costs. Adjustments arising from this limit on asset recognition are recorded directly in equity. In 2010 this adjustment was a decrease of 2 million Swiss francs (2009: decrease of 3 million Swiss francs).

79
11. Employee stock options and other equity compensation plansThe Group operates several equity compensation plans, including separate plans at Genentech (prior to the Genentech transaction) and Chugai. Effective 1 January 2005 the Group adopted IFRS 2 ‘Share-based Payment’. Amongst other matters, the standard requires that the fair value of all equity compensation plan awards granted to employees be estimated at grant date and recorded as an expense over the vesting period. The expense is charged against the appropriate income statement heading. General and administration costs in 2009 include 236 million Swiss francs of expenses from accelerated vesting of Genentech equity compensation plans following the Genentech transaction (see Note 8).
Expenses for equity compensation plans | in millions of CHF
2010 2009
Cost of sales 34 84Marketing and distribution 58 60Research and development 76 65General and administration 124 386Total operating expenses 292 595
Share option plansRoche Option Plan 6 6Genentech Stock Option Plan – 330Chugai Stock Acquisition Rights 2 1Total share option plans 8 337
Other equity compensation plansSpecial Stock Awards – 22Roche Connect 14 13Genentech Employee Stock Purchase Program – 37Roche Stock-settled Stock Appreciation Rights 193 142Roche Restricted Stock Unit Plan 72 17Chugai Retirement Stock Acquisition Rights 1 1Roche Performance Share Plan 14 17Roche Stock Appreciation Rights (10) 9Total other equity compensation plans 284 258
Total operating expenses 292 595
of which– Equity-settled 302 586– Cash-settled (10) 9

80 Roche Finance Report 2010 Roche Group – Notes to the Roche Group Consolidated Financial Statements
Cash inflow (outflow) from equity compensation plans | in millions of CHF
2010 2009
Genentech equity compensation plansGenentech Stock Option Plan – 81Genentech Employee Stock Purchase Program – 27Total cash inflow from Genentech equity compensation plans – 108
Other equity-settled equity compensation plansRoche Option Plan exercises 33 28Chugai Stock Acquisition Rights exercises – –Roche Connect costs (14) (13)Total other equity-settled equity compensation plans 19 15
Cash outflow from transactions in own equity instruments (792) (666)Total cash inflow (outflow) from other equity-settled equity compensation plans, net of transactions in own equity instruments (773) (651)
Cash-settled plans (included as part of movements in net working capital)Roche Stock Appreciation Rights (19) (17)
The net cash outflow from transactions in own equity instruments arises from sales and purchases of non-voting equity securities (Genussscheine) and derivative instruments thereon which are held for the Group’s potential conversion obligations that may arise from the Group’s equity-settled equity compensation plans. These derivative instruments mainly consist of call options that are exercisable at any time up to their maturity (see Note 28).
In addition to the above cash flows, upon the completion of the Genentech transaction in 2009 the remaining outstanding Genentech employee stock options were fully redeemed for cash. The resulting cash outflow was 2,704 million Swiss francs, which was reported as a change in ownership interest in subsidiaries (see Note 3).
Roche Long-Term | During 2005 the Group implemented a new global long-term incentive programme which is available to certain directors, management and employees selected at the discretion of the Group. The programme consists of Stock-settled Stock Appreciation Rights (‘S-SARs’), with the Group having the alternative of granting awards under the existing Roche Option Plan. In 2009, following the integration of Genentech, the Group also established a Restricted Stock Unit ( ‘RSU’) plan. The first awards of this plan were made in September 2009 to employees at Genentech. The S-SARs are issued in accordance with the Roche S-SAR Plan (the Regulations of 1 January 2005 including amendments effective as of 1 January 2007 and the addenda, including the Roche S-SAR Plan’s 2009 Addendum United States as of 1 September 2009). The Remuneration Committee determines the number of non-voting equity securities (Genussscheine) that will be available under the plan each year. The above regulations collectively provide that 60 million non-voting equity securities (Genussscheine) will be available for issuance under the Roche S-SAR Plan over a ten-year period. The RSUs are issued in accordance with the Roche Restricted Stock Unit Plan (the Regulations effective 1 September 2009), under which 10 million non-voting equity securities (Genussscheine) will be available for issuance over a ten-year period. Further details of both plans are given in the relevant sections below.

81
Share option plansRoche Option Plan | Awards under this plan give employees the right to purchase non-voting equity securities (Genussscheine) at an exercise price specified at the grant date. The options, which are non-tradable equity-settled awards, have a seven-year duration and vest on a phased basis over three years, subject to continued employment. The Group covers such obligations by purchasing non-voting equity securities or derivatives thereon (see Note 28). With the introduction of Roche Long-Term in 2005, the number of options granted under the Roche Option Plan was significantly reduced, as most eligible employees now receive Roche Stock-settled Stock Appreciation Rights instead.
Roche Option Plan – movement in number of options outstanding
2010 2009Number
of options (thousands)
Weighted average exercise price
(CHF)
Number of options
(thousands)
Weighted average exercise price
(CHF)
Outstanding at 1 January 1,457 162.92 1,394 154.71Granted 344 171.92 377 149.57Forfeited (77) 189.21 (32) 194.07Exercised (283) 115.25 (277) 100.68Expired (4) 77.80 (5) 115.50Outstanding at 31 December 1,437 173.29 1,457 162.92
– of which exercisable 770 178.22 810 155.81
Roche Option Plan – terms of options outstanding as at 31 December 2010
Options outstanding Options exercisable
Year of grant
Number outstanding (thousands)
Weighted average years remaining contractual life
Weighted average exercise price
(CHF)
Number exercisable (thousands)
Weighted average exercise price
(CHF)
2004 123 0.17 129.00 123 129.002005 72 1.17 123.25 72 123.252006 93 2.17 195.25 93 195.252007 156 3.18 229.70 156 229.702008 318 4.11 194.48 214 194.492009 342 5.21 149.81 109 150.022010 333 6.24 171.80 3 175.50Total 1,437 4.15 173.29 770 178.22
Genentech Stock Option Plan | The Genentech Stock Option Plan was adopted in 1999 and amended thereafter. In April 2004 Genentech’s shareholders approved an equity incentive plan. The plans allowed for the granting of various stock options, incentive stock options and stock purchase rights to employees, directors and consultants of Genentech. The options granted, which were non-tradable equity-settled awards, had a ten-year duration and vested on a phased basis over four years, subject to continued employment. Upon the completion of the Genentech transaction (see Note 3) the remaining outstanding options were fully redeemed for cash. For accounting purposes the remaining fair value of 217 million Swiss francs was expensed for the options that were not fully vested at that time.

82 Roche Finance Report 2010 Roche Group – Notes to the Roche Group Consolidated Financial Statements
Genentech Stock Option Plan – movement in number of options outstanding
2010 2009Number
of options (millions)
Weighted average exercise price
(USD)
Number of options (millions)
Weighted average exercise price
(USD)
Outstanding at 1 January – – 77 63.06Granted – – – –Forfeited – – – –Exercised – – (1) 52.66Expired – – – –Genentech transaction 3 – – (76) 63.14Outstanding at 31 December – – – –
– of which exercisable – – – –
Chugai Stock Acquisition Rights | During 2003 Chugai adopted a Stock Acquisition Rights programme. The programme allows for the granting of rights to employees and directors of Chugai. Each right entitles the holder to purchase 100 Chugai shares at a specified exercise price. The rights, which are non-tradable equity-settled awards, have a ten-year duration and vest after two years.
Chugai Stock Acquisition Rights – movement in number of rights outstanding
2010 2009
Number of rights
Weighted average exercise price
(JPY)Number of rights
Weighted average exercise price
(JPY)
Outstanding at 1 January 15,845 208,333 12,966 217,288Granted 3,240 188,100 3,300 169,600Forfeited (200) 215,540 (190) 212,089Exercised – – (231) 154,556Expired – – – –Outstanding at 31 December 18,885 204,785 15,845 208,333
– of which exercisable 12,365 218,491 12,545 218,522
Chugai Stock Acquisition Rights – terms of rights outstanding at 31 December 2010
Rights outstanding Rights exercisable
Year of grantNumber
outstanding
Weighted average years remaining contractual life
Weighted average exercise price
(JPY)Number
exercisable
Weighted average exercise price
(JPY)
2003 1,064 2.50 145,400 1,064 145,4002004 2,069 3.25 167,500 2,069 167,5002005 2,452 4.25 164,900 2,452 164,9002006 3,330 5.25 224,500 3,330 224,5002007 3,450 6.25 303,900 3,450 303,9002008 – no awards – – – – –2009 3,280 8.25 169,600 – –2010 3,240 9.33 188,100 – –Total 18,885 6.15 204,785 12,365 218,491

83
Issues of share options in 2010 | Issues of share options in 2010, including the methodology used to calculate fair value and the main inputs to the valuation models, are described below.
Issues of share option plans in 2010
Roche Option Plan
Chugai Stock Acquisition Rights
Number of options granted 344,433 3,240Underlying equity Roche non-voting
equity securitiesChugai shares in
blocks of 100Currency Swiss francs Japanese yenVesting period Progressively
over 3 yearsAfter 2 years
Contractual life 7 years 10 yearsWeighted average fair value of options issued 20.87 491Option pricing model used Binomial BinomialInputs to option pricing model– Share price at grant date 171.92 165,500– Exercise price 171.92 188,100– Expected volatility 24.60% 33.05%– Expected dividend yield 6.02% 2.05%– Early exercise factor 1.564 n/a– Expected exit rate 7.19% 0%
Volatility for Roche and Chugai options was determined primarily by reference to historically observed prices of the underlying equity. Risk-free interest rates are derived from zero coupon swap rates at the grant date taken from Datastream. The early exercise factor describes the ratio between the expected market price at the exercise date and the exercise price at which early exercises can be expected, based on historically observed behaviour.
Other equity compensation plansSpecial Stock Awards | In March and December 2009 the Group issued Special Stock Awards to certain directors, management and employees selected at the discretion of the Group. The awards consisted of immediately vesting non-voting equity securities (Genussscheine). The fair value of the awards was calculated on the basis of the market value of Roche non-voting equity securities at the date of issue.
Roche Connect | This programme enables all employees worldwide, except for those in the United States and certain other countries, to make regular deductions from their salaries to purchase non-voting equity securities (Genussscheine). It is administered by independent third parties. The Group contributes to the programme, which allows the employees to purchase non-voting equity securities at a discount (usually 20%). The administrator purchases the necessary non-voting equity securities directly from the market. At 31 December 2010 the administrator held 1.9 million non-voting equity securities (2009: 1.6 million). The programme has been operational since 1 October 2002. During the year the cost of the plan was 14 million Swiss francs (2009: 13 million Swiss francs), which was reported within the relevant expenditure line by function.
Genentech Employee Stock Purchase Program (ESPP) | Genentech had an employee stock purchase programme that allowed employees to purchase Genentech’s common stock at 85% of the lower of market value at the grant date or purchase date. In 2009 a total of 0.4 million shares of Genentech common stock were purchased resulting in a cash inflow of 27 million Swiss francs and the cost of the plan was 37 million Swiss francs, which was reported within the relevant expenditure line by function. Upon the completion of the Genentech transaction (see Note 3) the remaining outstanding awards were fully redeemed for cash. For accounting purposes the remaining fair value of 19 million Swiss francs was expensed for the awards that were not fully vested at that time.

84 Roche Finance Report 2010 Roche Group – Notes to the Roche Group Consolidated Financial Statements
Roche Stock-settled Stock Appreciation Rights | With the introduction of Roche Long-Term in 2005, the Group offers Stock-settled Stock Appreciation Rights (S-SARs) to certain directors, management and employees selected at the discretion of the Group. The S-SARs give employees the right to receive non-voting equity securities (Genussscheine) reflecting the value of any appreciation in the market price of the non-voting equity securities between the grant date and the exercise date. The rights, which are non-tradable equity-settled awards, have a seven-year duration and vest on a phased basis over three years, subject to continued employment. The Group covers such obligations by purchasing non-voting equity securities, or derivatives thereon (see Note 28).
Roche S-SARs – movement in number of rights outstanding
2010 2009Number of rights
(thousands)
Weighted average exercise price
(CHF)
Number of rights
(thousands)
Weighted average exercise price
(CHF)
Outstanding at 1 January 26,185 173.12 13,063 191.72Granted 16,064 154.56 14,342 155.85Forfeited (2,439) 181.85 (780) 191.64Exercised (977) 139.58 (440) 129.88Expired – – – –Outstanding at 31 December 38,833 165.73 26,185 173.12
– of which exercisable 13,041 182.01 7,506 187.61
Roche S-SARs – terms of rights outstanding at 31 December 2010
Rights outstanding Rights exercisable
Year of grant
Number outstanding (thousands)
Weighted average years remaining contractual life
Weighted average exercise price
(CHF)
Number exercisable (thousands)
Weighted average exercise price
(CHF)
2005 1,244 1.17 123.48 1,244 123.482006 1,696 2.17 195.13 1,696 195.132007 2,355 3.17 229.37 2,355 229.372008 5,232 4.10 194.27 3,556 194.302009 12,482 5.48 156.45 4,120 156.732010 15,824 6.60 154.32 70 175.40Total 38,833 5.33 165.73 13,041 182.01
The weighted average fair value of the rights granted in 2010 was calculated using a binomial model. The inputs to the model were consistent with those used for the Roche Option Plan 2010 awards given previously, except that the early exercise factor was 1.280 and the expected exit rate was 7.55%. The resulting weighted average fair value per right is CHF 15.16 giving a total fair value of 244 million Swiss francs which is charged over the vesting period of three years.
Roche Restricted Stock Unit Plan | For the first time in September 2009 the Group issued Restricted Stock Units (RSUs) awards to certain directors, management and employees selected at the discretion of the Group. The RSUs, which are non-tradable, represent the right to receive non-voting equity securities (Genussscheine) which vest only after a three-year period. The weighted average fair value of the awards granted in 2010 was CHF 123.55 calculated on the basis of the market value of Roche non-voting equity securities at the date of issue, discounted to take into account that the awards would not accrue for any dividends during the vesting period.

85
Roche RSUs – movement in number of awards outstanding
2010 Number of awards
(thousands)
2009 Number of awards
(thousands)
Outstanding at 1 January 1,247 –Granted 1,359 1,257Forfeited (107) (10)Transferred to participants (4) –Outstanding at 31 December 2,495 1,247
– of which exercisable 5 –
Chugai Retirement Stock Acquisition Rights | For the first time in 2009 Chugai issued Stock Acquisition Rights in lieu of the Retirement Gratuities System for Directors which was abolished. The 716 rights issued in 2010 (2009: 785) have a thirty-year duration and vest upon the holder’s retirement as a director of Chugai. Each right entitles the holder to purchase 100 Chugai shares at an exercise price of 100 Japanese yen. The total fair value of rights issued was equivalent to 1 million Swiss francs (2009: 1 million Swiss francs), which was calculated using a binomial model with inputs consistent with those used for the Chugai Stock Appreciation Rights given previously.
Roche Performance Share Plan | The Group offers future non-voting equity security awards (or, at the discretion of the Board of Directors, their cash equivalent) to certain directors and key senior managers. The programme was established at the beginning of 2002 and currently operates in annual three-year cycles. The terms of the currently outstanding awards are set out in the table below. The amount of non-voting equity securities allocated will depend upon the individual’s salary level, the achievement of performance targets linked to the Group’s Total Shareholder Return (shares and non-voting equity securities combined) relative to the Group’s peers during the three-year period from the date of the grant, and the discretion of the Board of Directors. These are non-tradable equity-settled awards. Each award will result in between zero and two non-voting equity securities, depending upon the achievement of the performance targets.
Roche Performance Share Plan – terms of outstanding awards at 31 December 2010
2008–2010 2009–2011 2010–2012
Number of awards outstanding (thousands) 73 95 103Vesting period 3 years 3 years 3 yearsAllocated to recipients in Feb. 2011 Feb. 2012 Feb. 2013Fair value per unit at grant (CHF) 201.22 156.06 173.39Total fair value at grant (CHF millions) 18 18 19
The weighted average fair value of the 107,796 awards granted in 2010 was calculated using a Monte Carlo simulation. The input parameters to the model were the covariance matrix between Roche and the other individual companies of the peer group based on a three-year history and a risk-free rate of 0.59%. The valuation also takes into account the defined rank and performance structure which determines the payout of the plan.

86 Roche Finance Report 2010 Roche Group – Notes to the Roche Group Consolidated Financial Statements
Roche Stock Appreciation Rights | Some employees of certain North American subsidiaries of the Group receive Stock Appreciation Rights (SARs) as part of their compensation. The SARs, which are non-tradable cash-settled awards, may be exercised after a vesting period of between one and three years for a cash payment, based upon the amount by which the market price of the Group’s American Depositary Receipts (ADRs) at the point of exercise exceeds the strike price (grant price at issuance). Following the implementation of Roche Long-Term (see above), the Group does not plan to award any further cash-settled SARs and no awards have been made since 2004.
Roche Stock Appreciation Rights | in millions of CHF
2010 2009
Liability at 31 December 6 35Intrinsic value of vested rights at 31 December 6 35
Roche Stock Appreciation Rights – terms of rights outstanding at 31 December 2010
Number outstanding and exercisable
(thousands)
Rights outstanding and exercisable
Year of grant ExpiryWeighted average
price (USD)
2004 522 Feb. 2011 26.04Total 522 26.04
The fair value at 31 December 2010 was calculated using a binomial model. The inputs to the model were the ADR price at 31 December 2010 (USD 36.65), the exercise prices given in the above table, and other inputs consistent with those used for the Roche Option Plan awards given previously.

87
12. Property, plant and equipment Property, plant and equipment: movements in carrying value of assets | in millions of CHF
Land
Buildings and land
improvementsMachinery and
equipmentConstruction
in progress Total
At 1 January 2009Cost 1,073 11,410 15,203 2,453 30,139Accumulated depreciation and impairment – (3,473) (8,476) – (11,949)Net book value 1,073 7,937 6,727 2,453 18,190
Year ended 31 December 2009At 1 January 2009 1,073 7,937 6,727 2,453 18,190Additions 2 31 972 1,832 2,837Disposals (3) (21) (64) (47) (135)Lonza Singapore acquisition 7 – – – – –Other business combinations 7 – – 3 – 3Transfers – 789 1,062 (1,851) –Depreciation charge – (505) (1,476) – (1,981)Impairment charge – (687) (338) (102) (1,127)Currency translation effects (18) (34) (29) (9) (90)At 31 December 2009 1,054 7,510 6,857 2,276 17,697
Cost 1,054 12,022 16,467 2,377 31,920Accumulated depreciation and impairment – (4,512) (9,610) (101) (14,223)Net book value 1,054 7,510 6,857 2,276 17,697
Year ended 31 December 2010At 1 January 2010 1,054 7,510 6,857 2,276 17,697Additions – 58 1,034 1,571 2,663Disposals (8) (8) (22) (4) (42)Marcadia acquisition 7 – – – – –Other business combinations 7 – – 2 – 2Transfers (2) 835 1,016 (1,849) –Depreciation charge – (489) (1,444) – (1,933)Impairment charge – (18) (61) (59) (138)Currency translation effects (74) (592) (704) (150) (1,520)At 31 December 2010 970 7,296 6,678 1,785 16,729
Cost 970 11,853 16,257 1,908 30,988Accumulated depreciation and impairment – (4,557) (9,579) (123) (14,259)Net book value 970 7,296 6,678 1,785 16,729
Impairment charges arise from changes in the estimates of the future cash flows expected to result from the use of the asset and its eventual disposal. Factors such as changes in the planned use of buildings, machinery or equipment, or closure of facilities, the presence or absence of competition and technical obsolescence could result in shortened useful lives or impairment. Impairment charges of 61 million Swiss francs (2009: 30 million Swiss francs) are reported as part of ‘Cost of sales’, 71 million Swiss francs (2009: 14 million Swiss francs) in ‘Research and development’ and 6 million Swiss francs (2009: 1,083 million Swiss francs) are reported within ‘General and administration’. The major part of the impairment reported in ‘General and administration’ in 2009 related to the discontinuation of a bulk drug production unit on part of the site at Vacaville in California (see Note 8).

88 Roche Finance Report 2010 Roche Group – Notes to the Roche Group Consolidated Financial Statements
Borrowing costs totalling 6 million Swiss francs using a rate of 4.79% (2009: 9 million Swiss francs using a rate of 4.79%) were capitalised as property, plant and equipment.
Leasing arrangements where the Group is the lesseeFinance leases | As at 31 December 2010 the capitalised cost of property, plant and equipment under finance leases was 132 million Swiss francs (2009: 157 million Swiss francs) and the net book value of these assets was 27 million Swiss francs (2009: 43 million Swiss francs).
Finance leases: future minimum lease payments under non-cancellable leases | in millions of CHF
Future minimum lease payments
Present value of future minimum lease payments
2010 2009 2010 2009
Within one year 1 1 1 1Between one and five years – 1 – 1More than five years – – – –Total 1 2 1 2
Future finance charges – – – –Total future minimum lease payments (undiscounted) 1 2 1 2
In addition to the above, Genentech leasing arrangements are disclosed below.
Operating leases | Group companies are party to a number of operating leases, mainly for plant and machinery, including motor vehicles, and for certain short-term property rentals. The arrangements do not impose any significant restrictions on the Group. Total operating lease rental expense was 428 million Swiss francs (2009: 424 million Swiss francs).
Operating leases: future minimum lease payments under non-cancellable leases | in millions of CHF
2010 2009
Within one year 215 235Between one and five years 373 432More than five years 183 175Total minimum payments 771 842
Leasing arrangements where the Group is the lessorFinance leases | Certain assets, mainly diagnostics instruments, are leased to third parties through finance lease arrangements. Such assets are reported as receivables at an amount equal to the net investment in the lease. Lease income from finance leases is recognised over the term of the lease based on the effective interest rate method.
Finance leases: future minimum lease payments under non-cancellable leases | in millions of CHF
Gross investment in lease Present value of future minimum lease payments
2010 2009 2010 2009
Within one year 27 27 24 24Between one and five years 66 57 62 55More than five years 1 2 1 2Total 94 86 87 81
Unearned finance income (6) (4) n/a n/aUnguaranteed residual value n/a n/a 1 1Net investment in lease 88 82 88 82

89
The accumulated allowance for uncollectible minimum lease payments was 1 million Swiss francs (2009: 2 million Swiss francs). There were no contingent rents recognised in income.
Operating leases | Certain assets, mainly some diagnostics instruments, are leased to third parties through operating lease arrangements. Such assets are reported within property, plant and equipment. Lease income from operating leases is recognised over the lease term on a straight-line basis.
Operating leases: future minimum lease payments under non-cancellable leases | in millions of CHF
2010 2009
Within one year 107 107Between one and five years 190 224More than five years – 2Total minimum payments 297 333
At 31 December 2010, machinery and equipment with an original cost of 2,792 million Swiss francs (2009: 2,742 million Swiss francs) and a net book value of 1,182 million Swiss francs (2009: 1,175 million Swiss francs) was being leased to third parties. There was no contingent rent recognised as income.
Genentech leasing arrangementsIn December 2004 Genentech entered into a Master Lease Agreement with Slough SSF LLC, which was subsequently acquired by Health Care Properties (‘HCP’) for the development of property adjacent to Genentech’s South San Francisco site. The development includes a total of eight buildings, which are subject to separate agreements as contemplated by the Master Lease Agreement. HCP as the developer will construct the building shell for each building and Genentech will f inish the interior of each building as laboratory or office space, as applicable. The construction of the first buildings was completed in 2006, at which point the lease term for those buildings was deemed to begin. Construction of the final buildings was completed during 2008. The lease term expires twelve years from the occupation of the final building. Genentech has two five-year renewal options for each building and has an option to purchase the various buildings at different dates between 2016 and 2020. Genentech also has a right of first refusal with respect to each building or the entire development should HCP consider selling part or all of the development.
As at 31 December 2010 the total carrying value of property, plant and equipment from this agreement was 174 million Swiss francs (2009: 213 million Swiss francs) and the carrying value of Genentech leasing obligations was 237 million Swiss francs (2009: 273 million Swiss francs). Estimates of the total future minimum lease payments anticipated by the entire Master Lease Agreement are shown below.
Estimated total future minimum lease payments under HCP leases | in millions of CHF
Principal Ground lease InterestTotal minimum lease payment
Within one year 13 8 15 36Between one and five years 78 31 48 157More than five years 140 37 22 199Total 231 76 85 392
Capital commitmentsThe Group has non-cancellable capital commitments for the purchase or construction of property, plant and equipment totalling 0.6 billion Swiss francs (2009: 0.8 billion Swiss francs).

90 Roche Finance Report 2010 Roche Group – Notes to the Roche Group Consolidated Financial Statements
13. Goodwill Goodwill: movements in carrying value of assets | in millions of CHF
2010 2009
At 1 January 8,261 8,353Lonza Singapore acquisition 7 – –Marcadia acquisition 7 145 –Other business combinations 7 119 15Impairment charge – –Currency translation effects (803) (107)At 31 December 7,722 8,261
Allocated to the following cash-generating unitsPharmaceuticals Division– Roche Pharmaceuticals 2,078 2,122– Chugai 127 124Total Pharmaceuticals Division 2,205 2,246
Diagnostics Division– Diabetes Care 837 770– Professional Diagnostics 1,548 1,728– Molecular Diagnostics – –– Applied Science 222 246– Tissue Diagnostics 744 782– Strategic goodwill
(held at divisional level and not allocated to business areas) 2,166 2,489Total Diagnostics Division 5,517 6,015
There are no accumulated impairment losses in goodwill. The goodwill arising from investments in associates is classified as part of the investments in associates (see Note 15).
Goodwill impairment testingPharmaceuticals Division | The division’s sub-divisions are the cash-generating units used for the testing of goodwill. For Chugai, the recoverable amount is based on fair value less costs to sell, determined with reference to the publicly quoted share prices of Chugai shares. For Roche Pharmaceuticals, the recoverable amount used in the impairment testing is based on value in use. The cash flow projections used are based on the most recent business plans approved by management. These assume no significant changes in the organisation of the division and include management’s latest estimates on sales volume and pricing, and production and other operating costs. These reflect past experience and are projected over five years. The cash flow projections used do not extend beyond management’s most recent business plans. The discount rate used is based on a rate of 7.31%, which is derived from a capital asset pricing model using data from Swiss capital markets, including Swiss Federal Government twenty-year bonds and the Swiss Market Index. A weighted average tax rate of 24.98% is used in the calculations. Management believes that any reasonably possible change in any of the key assumptions would not cause the carrying value of goodwill to exceed the recoverable amount.
Diagnostics Division | The division’s business areas are the cash-generating units used for the testing of goodwill. The goodwill arising from the Corange/Boehringer Mannheim acquisition and part of the goodwill from the Ventana acquisition is recorded and monitored at a divisional level as it relates to the strategic development of the whole division and cannot be meaningfully allocated to the division’s business areas. Therefore the cash-generating unit for this goodwill is the entire division. The recoverable amount used in the impairment testing is based on value in use. The cash flow projections used are based on the most recent business plans approved by management. These assume no significant changes in the organisation of the division and include management’s latest estimates on sales volume and pricing, and production and other

91
operating costs. These reflect past experience and are projected over five years. The estimates for the Tissue Diagnostics business area are projected over ten years, which management believes reflects the long-term nature of this business. The cash flow projections used do not extend beyond management’s most recent business plans. The discount rate used is based on a rate of 7.31%, which is derived from a capital asset pricing model using data from Swiss capital markets, including Swiss Federal Government twenty-year bonds and the Swiss Market Index. A weighted average tax rate of 19.71% is used in the calculations. Management believes that any reasonably possible change in any of the key assumptions would not cause the carrying value of goodwill to exceed the recoverable amount.
14. Intangible assets Intangible assets: movements in carrying value of assets | in millions of CHF
Product intangibles:
in use
Product intangibles:
not available for use
Marketing intangibles:
in use
Technology intangibles:
in use Total
At 1 January 2009Cost 14,304 2,568 – 805 17,677Accumulated amortisation and impairment (9,891) (67) – (598) (10,556)Net book value 4,413 2,501 – 207 7,121
Year ended 31 December 2009At 1 January 2009 4,413 2,501 – 207 7,121Lonza Singapore acquisition 7 – – – – –Other business combinations 7 17 47 25 – 89Additions 40 183 – 13 236Disposals (3) – – – (3)Amortisation charge (673) – (4) (35) (712)Impairment charge (225) (405) – (38) (668)Currency translation effects (41) (22) – 5 (58)At 31 December 2009 3,528 2,304 21 152 6,005
Cost 13,759 2,750 42 790 17,341Accumulated amortisation and impairment (10,231) (446) (21) (638) (11,336)Net book value 3,528 2,304 21 152 6,005
Allocation by operating segment – Roche Pharmaceuticals 558 1,751 – 114 2,423– Chugai 353 9 – – 362– Diagnostics 2,617 544 21 38 3,220Total Group 3,528 2,304 21 152 6,005
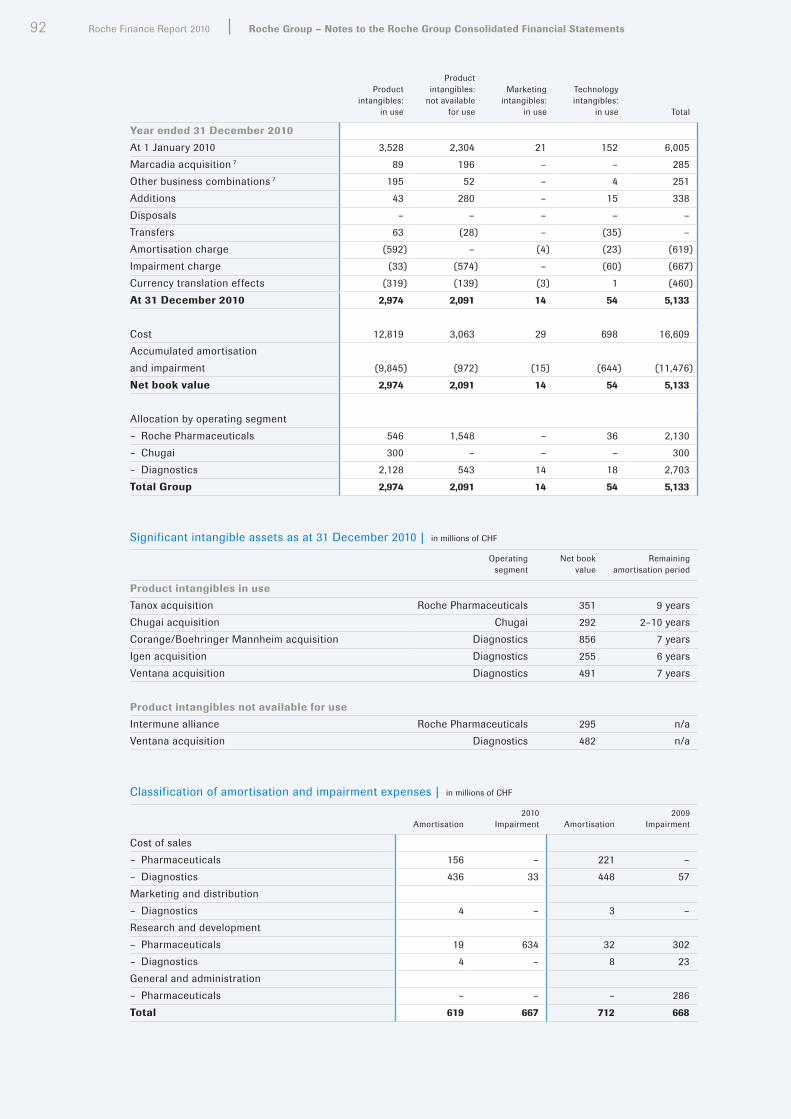
92 Roche Finance Report 2010 Roche Group – Notes to the Roche Group Consolidated Financial Statements
Product intangibles:
in use
Product intangibles:
not available for use
Marketing intangibles:
in use
Technology intangibles:
in use Total
Year ended 31 December 2010At 1 January 2010 3,528 2,304 21 152 6,005Marcadia acquisition 7 89 196 – – 285Other business combinations 7 195 52 – 4 251Additions 43 280 – 15 338Disposals – – – – –Transfers 63 (28) – (35) –Amortisation charge (592) – (4) (23) (619)Impairment charge (33) (574) – (60) (667)Currency translation effects (319) (139) (3) 1 (460)At 31 December 2010 2,974 2,091 14 54 5,133
Cost 12,819 3,063 29 698 16,609Accumulated amortisation and impairment (9,845) (972) (15) (644) (11,476)Net book value 2,974 2,091 14 54 5,133
Allocation by operating segment – Roche Pharmaceuticals 546 1,548 – 36 2,130– Chugai 300 – – – 300– Diagnostics 2,128 543 14 18 2,703Total Group 2,974 2,091 14 54 5,133
Significant intangible assets as at 31 December 2010 | in millions of CHF
Operating segment
Net book value
Remaining amortisation period
Product intangibles in useTanox acquisition Roche Pharmaceuticals 351 9 yearsChugai acquisition Chugai 292 2–10 yearsCorange/Boehringer Mannheim acquisition Diagnostics 856 7 yearsIgen acquisition Diagnostics 255 6 yearsVentana acquisition Diagnostics 491 7 years
Product intangibles not available for useIntermune alliance Roche Pharmaceuticals 295 n/aVentana acquisition Diagnostics 482 n/a
Classification of amortisation and impairment expenses | in millions of CHF
2010 2009Amortisation Impairment Amortisation Impairment
Cost of sales– Pharmaceuticals 156 – 221 –– Diagnostics 436 33 448 57Marketing and distribution– Diagnostics 4 – 3 –Research and development– Pharmaceuticals 19 634 32 302– Diagnostics 4 – 8 23General and administration– Pharmaceuticals – – – 286Total 619 667 712 668
93
Internally generated intangible assetsThe Group currently has no internally generated intangible assets from development as the criteria for the recognition as an asset are not met.
Intangible assets with indefinite useful livesThe Group currently has no intangible assets with indefinite useful lives.
Impairment of intangible assetsImpairment charges arise from changes in the estimates of the future cash flows expected to result from the use of the asset and its eventual disposal. Factors such as the presence or absence of competition, technical obsolescence or lower than anticipated sales for products with capitalised rights could result in shortened useful lives or impairment.
2010 | In 2010 the Roche Pharmaceuticals operating segment recorded an impairment charge of 634 million Swiss francs and the Diagnostics operating segment recorded an impairment charge of 33 million Swiss francs.
Of the amount recorded in the Roche Pharmaceuticals operating segment, an impairment charge of 424 million Swiss francs was recorded as part of the Operational Excellence programme (see Note 8). As part of the programme the division carried out a comprehensive portfolio review and decided to discontinue certain activities in research and early development. In addition certain product development activities are being discontinued or transferred to other Roche sites or to third parties. As a result of these decisions intangible assets with a carrying value of 424 million Swiss francs were fully written down during 2010.
Apart from the Operational Excellence programme, an impairment charge of 179 million Swiss francs was also recorded in the Pharmaceuticals Division with respect to product intangibles not available for use and follows primarily from recent clinical data and portfolio prioritisation decisions relating to certain projects either with alliance partners or acquired in business combinations. The assets concerned, which were not yet being amortised, were fully written down by these charges. A further charge of 47 million Swiss francs was recorded, resulting from a portfolio prioritisation decision on a project acquired as part of a previous business combination. The asset concerned, which was not yet being amortised, was written down to its recoverable value of 95 million Swiss francs, based on a value in use calculation using a discount rate of 7.31%. A reversal of previously recorded impairment loss of 16 million Swiss francs was recorded, which followed from the latest clinical data assessment of the project concerned.
In the Diagnostics operating segment, an impairment charge of 33 million Swiss francs was recorded. This was in respect of intangible assets in use and followed the regular updating of the division’s business plans and technology assessments in the second half of 2010. The assets concerned were written down to their recoverable amount of 23 million Swiss francs, based on a value in use calculation using a discount rate of 7.31%.
2009 | In 2009 the Roche Pharmaceuticals operating segment recorded an impairment charge of 588 million Swiss francs and the Diagnostics operating segment recorded an impairment charge of 80 million Swiss francs.
In the Roche Pharmaceuticals operating segment an impairment charge of 286 million Swiss francs was recorded related to the Pharmaceuticals Division reorganisation (see Note 8). The integration programme included prioritising projects within the shared portfolio. The assets concerned were fully written down by these charges. An impairment charge of 286 million Swiss francs was also recorded in respect of product intangibles not available for use and followed from recent clinical data and portfolio prioritisation decisions relating to certain projects either with alliance partners or acquired in business combinations. The assets concerned, which were not yet being amortised, were written down to their recoverable amount of 321 million Swiss francs, based on a value in use calculation using a discount rate of 7.7%. In addition an impairment charge of 16 million Swiss francs was recorded relating to intangible assets in use. These followed the regular updating of the division’s business plans and technology assessments in the second half of 2009. The assets were written down to their recoverable amount of 66 million Swiss francs, based on a value in use calculation using a discount rate of 7.7%.

94 Roche Finance Report 2010 Roche Group – Notes to the Roche Group Consolidated Financial Statements
In the Diagnostics operating segment an impairment charge of 80 million Swiss francs was recorded. This was in respect of intangibles assets in use and followed the regular updating of the division’s business plans and technology assessments in the second half of 2009. The assets were written down to their recoverable amount of 71 million Swiss francs, based on a value in use calculation using a discount rate of 7.7%.
Intangible assets not available for use | These mostly represent in-process research and development assets acquired either through in-licensing arrangements, business combinations or separate purchases. As at 31 December 2010 the carrying value of such assets in the Pharmaceuticals Division is 1,548 million Swiss francs. Of this amount approximately 49% represents projects that have potential decision points within the next twelve months which in certain circumstances could lead to impairment. Due to the inherent uncertainties in the research and development process, such assets are particularly at risk of impairment if the project in question does not result in a commercialised product.
Potential commitments from alliance collaborationsThe Group is party to in-licensing and similar arrangements with its alliance partners. These arrangements may require the Group to make certain milestone or other similar payments dependent upon the achievement of agreed objectives or performance targets as defined in the collaboration agreements.
The Group’s current estimate of future third-party commitments for such payments is set out in the table below. These figures are not risk adjusted, meaning that they include all such potential payments that can arise assuming all projects currently in development are successful. The timing is based on the Group’s current best estimate. These figures do not include any potential commitments within the Group, such as may arise between the Roche and Chugai businesses.
Potential future third-party collaboration payments as at 31 December 2010 | in millions of CHF
Pharmaceuticals Diagnostics Group
Within one year 163 26 189Between one and two years 39 15 54Between two and three years 199 17 216Total 401 58 459
15. Associates The Group’s investments in associates are accounted for using the equity method. The goodwill arising from investments in associates is classified as part of the investments in associates.
Investments in associates | in millions of CHF
Share of net income Carrying value2010 2009 2010 2009 2008
Total investments in associates (3) – 13 16 9
The Group has no significant investments in associates and there were no material transactions between the Group and its associates. Additional information about associates is given in Note 34.

95
16. Financial and other long-term assets Financial and other long-term assets | in millions of CHF
2010 2009 2008
Available-for-sale investments 239 315 588Held-to-maturity investments – 5 16Loans receivable 9 18 16Long-term trade receivables 75 45 73Restricted cash 41 41 205Other 64 57 42Total financial long-term assets 428 481 940
Long-term employee benefits 230 226 230Other 226 226 221Total other long-term assets 456 452 451
Financial long-term assets are held for strategic purposes and are classified as non-current. The available-for-sale investments are mainly equity investments. These are primarily investments in private biotechnology companies, which are kept as part of the Group’s strategic alliance efforts. Some unquoted equity investments classif ied as available-for-sale are measured at cost, as their fair value cannot be measured reliably. The carrying value of equity investments held at cost is 39 million Swiss francs (2009: 34 million Swiss francs, 2008: 25 million Swiss francs). Loans receivable comprise all loans to third parties with a term of over one year.
17. Inventories Inventories | in millions of CHF
2010 2009 2008
Raw materials and supplies 793 814 702Work in process 169 262 196Intermediates 3,290 3,766 4,313Finished goods 1,174 1,244 960Less: provision for slow-moving and obsolete inventory (454) (438) (341)Total inventories 4,972 5,648 5,830
In 2010 expenses relating to inventories expensed through cost of sales totalled 8,951 million Swiss francs (2009: 9,263 million Swiss francs).

96 Roche Finance Report 2010 Roche Group – Notes to the Roche Group Consolidated Financial Statements
18. Accounts receivable Accounts receivable | in millions of CHF
2010 2009 2008
Trade accounts receivable 9,700 10,540 9,781Notes receivable 224 270 181Other 24 24 23Allowances for doubtful accounts (376) (273) (147)Charge-backs and other allowances (169) (100) (83)Total accounts receivable 9,403 10,461 9,755
At 31 December 2010 accounts receivable include amounts denominated in US dollars equivalent to 2.0 billion Swiss francs (2009: 2.3 billion Swiss francs, 2008: 2.8 billion Swiss francs) and amounts denominated in euros equivalent to 3.2 billion Swiss francs (2009: 3.9 billion Swiss francs, 2008: 3.9 billion Swiss francs).
Allowances for doubtful accounts receivable: movements in recognised liability | in millions of CHF
2010 2009
At 1 January (273) (147)Additional allowances created (198) (192)Unused amounts reversed 26 54Utilised during the year 56 9Currency translation effects 13 3At 31 December (376) (273)
In 2010 expenses relating to bad debts expensed through marketing and distribution totalled 182 million Swiss francs (2009: 138 million Swiss francs). Significant concentrations within trade receivables of counterparty credit risk are described in Note 32.
19. Other current assets Other current assets | in millions of CHF
2010 2009 2008
Accrued interest income 53 4 145Derivative financial instruments 24 485 1,756 262Restricted cash – 1 –Other 612 669 624Total financial current assets 1,150 2,430 1,031
Prepaid expenses 462 499 452Other 556 648 497Total non-financial current assets 1,018 1,147 949
Total other current assets 2,168 3,577 1,980

97
Derivative financial instrument assets are primarily related to hedges on the non-US dollar-denominated bonds and notes issued to finance the Genentech transaction. The decline compared to 31 December 2010 is mainly due to a strengthening of the US dollar compared to the euro during 2010. This was offset by foreign currency transaction gains on the non-US dollar-denominated bonds and notes (see Note 27).
20. Marketable securities Marketable securities | in millions of CHF
2010 2009 2008
Financial assets at fair-value-through-profit-or-loss Held-for-trading investments– Bonds and debentures – – 1,027Total financial assets at fair-value-through-profit-or-loss – – 1,027
Held-to-maturity financial assets– Money market instruments and time accounts
over three months 4 11 –Total held-to-maturity financial assets 4 11 –
Available-for-sale financial assets– Shares 272 314 51– Bonds and debentures 1,614 753 6,814– Money market instruments and time accounts
over three months 7,170 15,029 7,961– Other investments – – 3Total available-for-sale financial assets 9,056 16,096 14,829
Total marketable securities 9,060 16,107 15,856
Marketable securities are held for fund management purposes and are classif ied as current. They are primarily denominated in Swiss francs. Other investments held for strategic purposes are classified as non-current (see Note 16). During 2009 all held-for-trading investments, which had been held at Genentech, were sold.
Shares | These consist primarily of readily saleable equity securities.
Bonds and debentures | The carrying values and contracted maturity of debt securities are shown below.
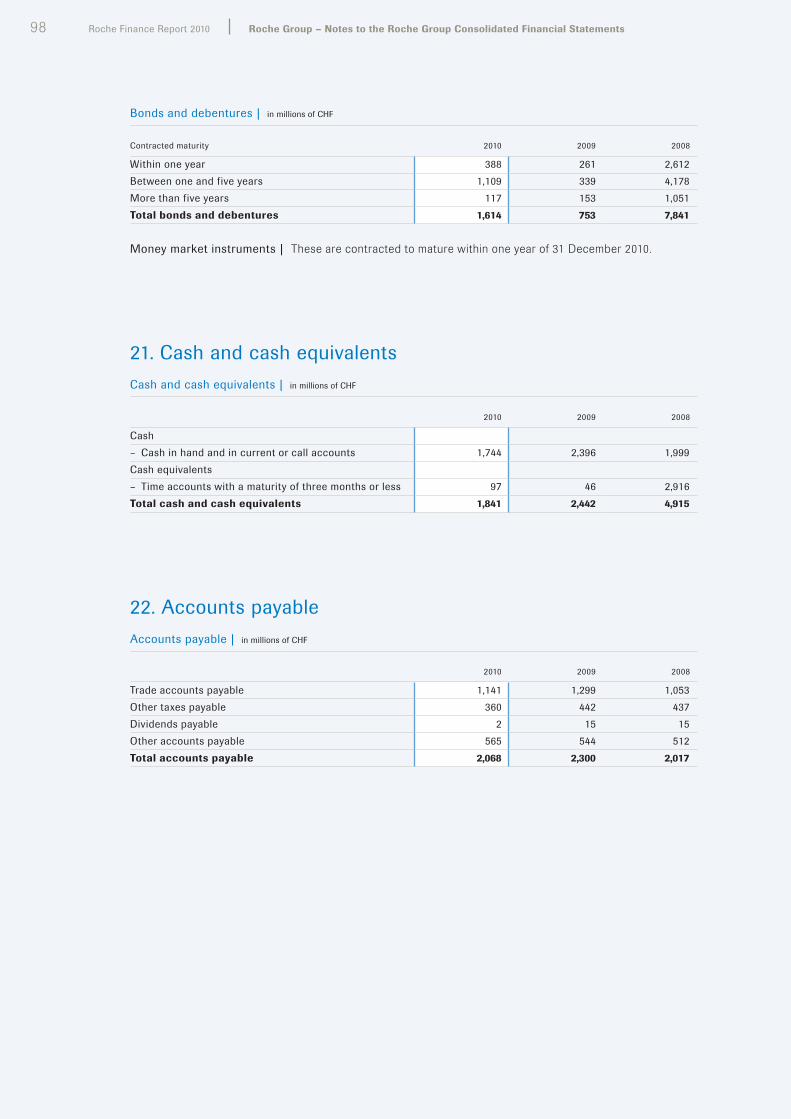
98 Roche Finance Report 2010 Roche Group – Notes to the Roche Group Consolidated Financial Statements
Bonds and debentures | in millions of CHF
Contracted maturity 2010 2009 2008
Within one year 388 261 2,612Between one and five years 1,109 339 4,178More than five years 117 153 1,051Total bonds and debentures 1,614 753 7,841
Money market instruments | These are contracted to mature within one year of 31 December 2010.
21. Cash and cash equivalents Cash and cash equivalents | in millions of CHF
2010 2009 2008
Cash– Cash in hand and in current or call accounts 1,744 2,396 1,999Cash equivalents– Time accounts with a maturity of three months or less 97 46 2,916Total cash and cash equivalents 1,841 2,442 4,915
22. Accounts payableAccounts payable | in millions of CHF
2010 2009 2008
Trade accounts payable 1,141 1,299 1,053Other taxes payable 360 442 437Dividends payable 2 15 15Other accounts payable 565 544 512Total accounts payable 2,068 2,300 2,017

99
23. Accrued and other current liabilitiesAccrued liabilities and other current liabilities | in millions of CHF
2010 2009 2008
Deferred income 458 562 262Accrued payroll and related items 1,753 2,026 1,838Interest payable 1,028 1,138 95Derivative financial instruments 24 102 343 194Other accrued liabilities 3,185 5,329 3,584Total accrued and other current liabilities 6,526 9,398 5,973
24. Derivative financial instruments The Group uses derivative financial instruments as part of its risk management activities. This is discussed in Note 32. Derivative financial instruments are carried at fair value. The methods used for determining fair value are described in Note 1.
Derivative financial instruments | in millions of CHF
Assets Liabilities2010 2009 2008 2010 2009 2008
Foreign currency derivatives– Forward exchange contracts 129 25 155 (95) (343) (119)– Cross-currency swaps 356 1,698 – – – –– Other – – 21 – – (32)Interest rate derivatives– Swaps – 11 20 – – (1)– Other – 2 23 – – –Other derivatives – 20 43 (7) – (42)Total derivative financial instruments 19, 23 485 1,756 262 (102) (343) (194)
Hedge accountingThe Group’s accounting policy on hedge accounting, which is described in Note 1, requires that to qualify for hedge accounting the hedging relationship must meet several strict conditions on documentation, probability of occurrence, hedge effectiveness and reliability of measurement.
As described in Note 32, the Group has financial risk management policies for foreign exchange risk, interest rate risk, market risk, credit risk and liquidity risk. When deemed appropriate, certain of the above risks are managed by using derivatives. While many of these transactions can be considered as hedges in economic terms, if the required conditions are not met, then the relationship does not qualify for hedge accounting. In this case the hedging instrument and the hedged item are reported independently as if there were no hedging relationship, which means that any derivatives are reported at fair value, with changes in fair value included in financial income.
The Group generally limits the use of hedge accounting to certain significant transactions. Consequently as at 31 December 2010 the Group has no fair value hedges, cash flow hedges or hedges of net investment in a foreign entity that meet the strict requirements to qualify for hedge accounting, apart from those described below.

100 Roche Finance Report 2010 Roche Group – Notes to the Roche Group Consolidated Financial Statements
Cash flow hedgesThe Group has issued bonds and notes in 2009 to finance the Genentech transaction (see Note 27). On some of the bonds and notes which are denominated in euros and sterling, the Group has entered into cross-currency swaps to hedge foreign exchange and interest rate risk. These cash flow hedges qualify for hedge accounting. As at 31 December 2010 such instruments, which are designated and qualify for hedge accounting, are recorded as assets with a fair value of 356 million Swiss francs (2009: assets of 1,698 million Swiss francs). There was no ineffective portion.
The expected undiscounted cash flows from qualifying cash flow hedges, including interest payments during the duration of the derivative contract and final settlement on maturity, are shown in the table below. The decline in expected cash flows is due to a stronger Swiss franc against the euro, US dollar and pound sterling.
Expected cash flows of qualifying cash flow hedges | in millions of CHF
Total0–3
months4–6
months7–12
months1–2
years2–3
years3–4
years4–5
yearsOver 5 years
Year ended 31 December 2010Cash inflows 16,833 683 – – 683 7,207 381 1,247 6,632Cash outflows (16,561) (749) – – (751) (7,003) (403) (1,199) (6,456)Total 272 (66) – – (68) 204 (22) 48 176
Year ended 31 December 2009Cash inflows 20,903 815 – – 815 815 8,618 454 9,386Cash outflows (19,185) (830) – – (830) (832) (7,762) (447) (8,484)Total 1,718 (15) – – (15) (17) 856 7 902
The undiscounted cash flows in the table above will affect profit and loss as shown below. These include interest payments during the duration of the derivative contract but do not include the final settlement on maturity. The decline in expected cash flows is due to a stronger Swiss franc against the euro, US dollar and pound sterling.
Expected cash flows of qualifying cash flow hedges with impact on profit and loss | in millions of CHF
Total0–3
months4–6
months7–12
months1–2
years2–3
years3–4
years4–5
yearsOver 5 years
Year ended 31 December 2010Cash inflows 3,851 683 – – 683 683 381 381 1,040Cash outflows (4,138) (749) – – (751) (747) (403) (403) (1,085)Total (287) (66) – – (68) (64) (22) (22) (45)
Year ended 31 December 2009Cash inflows 5,412 815 – – 815 815 815 454 1,698Cash outflows (5,417) (830) – – (830) (832) (828) (447) (1,650)Total (5) (15) – – (15) (17) (13) 7 48
The changes in the hedging reserve within equity are shown in Note 28.
101
Fair value hedgesAs at 31 December 2009 the Group had hedged some of its fixed-term debt instruments with interest rate swaps. These instruments, which had been designated and qualified as fair value hedges, were recorded in the balance sheet at 31 December 2009 as assets with a fair value of 11 million Swiss francs. These instruments expired in July 2010 when the underlying bond was redeemed. During 2010 a loss of 11 million Swiss francs was recorded on these interest rate swaps (2009: loss of 9 million Swiss francs). As the fair value hedge had been highly effective since inception, the result of the interest rate swaps was largely offset by changes in the fair value of the hedged debt instruments.
The Group has equity investments in various biotechnology companies that are subject to a greater risk of market fluctuation than the stock market in general. To manage part of this exposure the Group has entered into forward contracts, which have been designated and qualify as fair value hedges. As at 31 December 2010 such instruments are recorded as liabilities with a fair value of 7 million Swiss francs (2009: assets of 20 million Swiss francs). During 2010 a loss of 27 million Swiss francs was recorded on these forward contracts (2009: loss of 22 million Swiss francs). The result of the forward contracts is offset by the changes in the fair value of the hedged equity investments.
The Group uses other derivatives, not designated in a qualifying hedge relationship, to manage its exposures to foreign currency, interest rate, equity market and credit risks. The instruments used may include interest rate swaps, cross-currency swaps, forwards contracts, options.

102 Roche Finance Report 2010 Roche Group – Notes to the Roche Group Consolidated Financial Statements
25. Provisions and contingent liabilitiesProvisions: movements in recognised liabilities | in millions of CHF
Legal provisions
Environmental provisions
Restructuring provisions
Employee provisions
Other provisions Total
Year ended 31 December 2009At 1 January 2009 223 161 264 279 531 1,458Additional provisions created 513 101 457 131 582 1,784Unused amounts reversed (113) (3) (22) (12) (62) (212)Utilised during the year (64) (20) (157) (126) (342) (709)Unwinding of discount 5 5 13 1 2 – 21Business combinations 7 – – 2 – 2 4Currency translation effects (15) (5) (13) 4 1 (28)At 31 December 2009 549 247 532 278 712 2,318
Of which– Current portion 514 17 421 60 606 1,618– Non-current portion 35 230 111 218 106 700Total provisions 549 247 532 278 712 2,318
Year ended 31 December 2010At 1 January 2010 549 247 532 278 712 2,318Additional provisions created 444 42 897 118 430 1,931Unused amounts reversed (54) (13) (80) (6) (153) (306)Utilised during the year (76) (17) (299) (100) (237) (729)Unwinding of discount 5 5 12 2 1 – 20Business combinations 7
– Acquired companies – – – – – –– Contingent consideration – – – – 118 118Currency translation effects (87) (10) (82) (38) (55) (272)At 31 December 2010 781 261 970 253 815 3,080
Of which– Current portion 716 10 761 61 598 2,146– Non-current portion 65 251 209 192 217 934Total provisions 781 261 970 253 815 3,080
Expected outflow of resources– Within one year 716 10 761 61 598 2,146– Between one to two years 42 8 138 31 16 235– Between two to three years 7 33 63 21 104 228– More than three years 16 210 8 140 97 471Total provisions 781 261 970 253 815 3,080
Legal provisionsLegal provisions consist of a number of separate legal matters, including claims arising from trade, in various Group companies. The majority of any cash outflows for these other matters are expected to occur within the next one to three years, although these are dependent on the development of the various litigations. Significant provisions are discounted by between 4% and 5% where the time value of money is material.

103
Environmental provisionsProvisions for environmental matters include various separate environmental issues in a number of countries. By their nature the amounts and timings of any outflows are difficult to predict. The estimated timings of these cash outflows are shown in the table above. Significant provisions are discounted by between 5% and 6% where the time value of money is material.
Restructuring provisionsThese arise from planned programmes that materially change the scope of business undertaken by the Group or the manner in which business is conducted. Such provisions include only the costs necessarily entailed by the restructuring which are not associated with the recurring activities of the Group. The timings of these cash outflows are reasonably certain on a global basis and are shown in the table above. These provisions are not discounted as the time value of money is not material in these matters.
Employee provisionsThese mostly relate to certain employee benefit obligations, such as sabbatical leave and long-service benefits. The timings of these cash outflows can be reasonably estimated based on past performance and are shown in the table above. Significant provisions are discounted by 6% where the time value of money is material.
Other provisionsOther provisions mostly relate to sales returns and various other provisions from Group companies that do not fit into the above categories. The timings of cash outflows are by their nature uncertain and the best estimates are shown in the table above. These provisions are not discounted as the time value of money is not material in these matters.
Contingent liabilitiesThe operations and earnings of the Group continue, from time to time and in varying degrees, to be affected by political, legislative, fiscal and regulatory developments, including those relating to environmental protection, in the countries in which it operates. The industries in which the Group operates are also subject to other risks of various kinds. The nature and frequency of these developments and events, not all of which are covered by insurance, as well as their effect on future operations and earnings, are not predictable.
The Group has entered into strategic alliances with various companies in order to gain access to potential new products or to utilise other companies to help develop the Group’s own potential new products. Potential future payments may become due to certain collaboration partners achieving certain milestones as defined in the collaboration agreements. The Group’s best estimates of future commitments for such payments are given in Note 14.
Pharmaceuticals legal casesAccutane | Hoffmann-La Roche Inc. ( ‘HLR’) and various other Roche affiliates have been named as defendants in numerous legal actions in the United States and elsewhere relating to the acne medication Accutane. The litigation alleges that Accutane caused certain serious conditions, including, but not limited to, inflammatory bowel disease (‘IBD’), birth defects and psychiatric disorders. As of 31 December 2010 HLR was defending approximately 2,422 actions brought in various federal and state courts throughout the United States for personal injuries allegedly resulting from their use of Accutane. Most of the actions allege IBD as a result of Accutane use. On 26 June 2009 HLR announced that, following a re-evaluation of its portfolio of medicines that are now available from generic manufacturers, rapidly declining brand sales in the US and high costs from personal-injury lawsuits that it continues to defend vigorously, it had decided to immediately discontinue the manufacture and distribution of the product in the United States.

104 Roche Finance Report 2010 Roche Group – Notes to the Roche Group Consolidated Financial Statements
All of the actions pending in federal court alleging IBD were consolidated for pre-trial proceedings in a Multi-District Litigation in the United States District Court for the Middle District of Florida, Tampa Division. In July 2007 the District Court granted summary judgment in favour of HLR in the lead federal IBD cases. The plaintiffs appealed and in August 2008 these rulings were affirmed by the United States Court of Appeals for the Eleventh Circuit. In October 2009 the District Court granted summary judgment in favour of HLR in the next five federal IBD cases. The plaintiffs appealed in November 2009 and in May 2010 these rulings were affirmed by the United States Court of Appeals for the Eleventh Circuit. Several recently filed matters remain pending.
All of the actions pending in state court in New Jersey alleging IBD were consolidated for pre-trial proceedings in the Superior Court of New Jersey, Law Division, Atlantic County. As of 31 December 2010 juries in the Superior Court have ruled in favour of the plaintiff in six cases, assessing total compensatory damages totalling 48 million US dollars. The first verdict was reversed on appeal; the re-trial resulted in a verdict in favour of the plaintiff assessing total compensatory damages of 25.2 million US dollars; HLR is currently in the process of post-trial briefing. The second verdict was reversed on appeal; the re-trial is scheduled for May 2011; additional plaintiffs may be added to the trial. HLR has appealed the third verdict to the Superior Court of New Jersey, Appellate Division, which involved three plaintiffs. The next trial, involving three plaintiffs, is scheduled for February 2011.
In October 2007 a jury in the Circuit Court of Escambia County, Florida, returned a verdict in favour of the plaintiff, assessing total compensatory damages of 7 million US dollars, subsequently reduced to 6.8 million US dollars by the court, against the Company. In October 2009, the District Court of Appeal, State of Florida, reversed and entered judgment as to HLR. The Supreme Court of Florida declined to review plaintiff ’s appeal.
Additional trials may be scheduled for 2011. Individual trial results depend on a variety of factors, including many that are unique to the particular case and therefore the trial results to date may not be predictive of future trial results. The Group continues to defend vigorously the remaining personal injury cases and claims.
Boniva | HLR and various other Roche affiliates have been named as defendants in numerous legal actions in the United States relating to the post-menopausal osteoporosis medication Boniva. In these litigations, the plaintiffs allege that Boniva caused one of the following conditions: osteonecrosis of jaw (‘ONJ’), atypical femoral fractures, or severe bone pain. As of 31 December 2010 HLR is defending approximately 30 actions brought in federal and state courts in the States of New Jersey, New York and California for personal injuries allegedly resulting from the use of Boniva.
All of these Boniva cases are in the early discovery stages of litigation, with no trial dates having been set. Individual trial results depend on a variety of factors, including many that are unique to the particular case. HLR and the other named Roche affiliates intend to vigorously defend themselves in these matters. The outcome of these matters cannot be determined at this time.
Cabilly patent | On 30 May 2008 Centocor, Inc. filed a patent lawsuit against Genentech and City of Hope National Medical Center (‘City of Hope’) in the US District Court for the Central District of California. The lawsuit related to US Patent No. 6,331,415 (‘the Cabilly patent’) that is co-owned by Genentech and the City of Hope. The Cabilly patent, which expires in 2018, relates to methods used by Genentech and others to make certain antibodies or antibody fragments, as well as cells and DNA used in these methods. Genentech has licensed the Cabilly patent to other companies and derives significant royalties from these licences. The lawsuit sought a declaratory judgment of patent invalidity and unenforceability with regard to the Cabilly patent and of patent non-infringement with regard to certain of Centocor’s products. On 30 August 2010 Genentech and Centocor entered into a settlement agreement resolving this lawsuit and certain additional patent issues. The agreement was effective as of 30 April 2010 with regard to royalties that Centocor has agreed to pay for licenses under the Cabilly patent. This matter has been finally resolved.

105
On 8 October 2009, Glaxo Group Limited, SmithKline Beecham Corporation, and GlaxoSmithKline LLC (collectively ‘GSK’) filed a patent lawsuit against Genentech and City of Hope in the US District Court for the Southern District of Florida. The lawsuit relates to the Cabilly patent and seeks a declaratory judgment of patent invalidity and unenforceability with regard to the Cabilly patent and of patent non-infringement with regard to a certain GSK product. On 16 December 2009 Genentech filed a motion to dismiss, or in the alternative to transfer to the Central District of California. GSK dismissed its Florida lawsuit in its entirety on 17 February 2010 and filed a related action on the same day in Northern District of California. Genentech filed a motion to transfer to the Central District of California, an answer, and a counterclaim against GSK on 10 March 2010. On 12 April 2010 Genentech’s motion to transfer was granted. On 13 October 2010 the Court entered an Order related to claim construction matters, including setting a Markman hearing date of 14 February 2011. The outcome of this matter cannot be determined at this time.
Other litigation | On 28 June 2003 Mr Ubaldo Bao Martinez filed a lawsuit against the Porriño Town Council and Genentech España S. L. in the Contentious Administrative Court Number One of Pontevedra, Spain. The lawsuit challenged the Town Council’s decision to grant licenses to Genentech España S. L. for the construction and operation of a warehouse and biopharmaceutical manufacturing facility in Porriño, Spain. On 16 January 2008 the Administrative Court ruled in favour of Mr Bao on one of the claims in the lawsuit and ordered the closing and demolition of the facility, subject to certain further legal proceedings. On 12 February 2008 Genentech España S. L. and the Town Council filed appeals of the Administrative Court decision at the High Court in Galicia, Spain. On 16 March 2010 Genentech received notice that it prevailed over Mr Bao on the appeal. This decision revokes the January 2008 ruling in its entirety.
On 4 October 2004 Genentech received a subpoena from the United States Department of Justice, requesting documents related to the promotion of Rituxan. Genentech co-operated with the government’s associated investigation. Previously the investigation had been both civil and criminal in nature. Genentech was informed in August 2008 by the criminal prosecutor who handled this matter that the government has declined to prosecute Genentech criminally in connection with this investigation. The civil matter was still ongoing. Through counsel Genentech continued to have discussions with government representatives about the status of their investigation and Genentech’s views on this matter, including potential resolution. On 20 October 2009 the government notified Genentech that it had decided not to make any civil claim against Genentech. The government’s investigation was initiated by a complaint that was filed under seal in the US District Court for the Eastern District of Pennsylvania in 2003 by an individual plaintiff. The complaint was unsealed on 31 December 2009 and is currently the basis of civil litigation by the plaintiff against Roche Holdings, Inc. and Genentech. Discovery in this matter is on-going. The Group intends to vigorously defend itself. The outcome of this civil litigation cannot be determined at this time.
HLR, Roche Laboratories Inc. ( ‘RLI’) and Genentech, along with approximately 50 other brand and generic pharmaceutical companies, have been named as defendants in several legal actions in the United States relating to the pricing of pharmaceutical drugs and State Medicaid reimbursement. The primary allegation in these litigations is that the pharmaceutical companies misrepresented or otherwise reported inaccurate Average Wholesale Prices (‘AWP’) and/or Wholesale Acquisition Costs (‘WAC’) for their drugs, which prices were allegedly relied upon by the States in calculating Medicaid reimbursements to entities such as retail pharmacies. The States, through their respective Attorney General, are seeking repayment of the amounts they claim were over-reimbursed. The time period associated with these cases is 1991–2005. As of 31 December 2010, HLR and RLI are defending six actions filed in the following states: Alabama, Mississippi, New Jersey, Kansas, Oklahoma and Louisiana. Genentech is defending one action filed in the state of Kansas. Discovery is currently pending in each of these cases. HLR, RLI and Genentech intend to vigorously defend themselves in these matters. The outcome of these matters cannot be determined at this time.

106 Roche Finance Report 2010 Roche Group – Notes to the Roche Group Consolidated Financial Statements
HLR, along with various other branded pharmaceutical companies, has been named as a defendant in several legal actions in the United States brought by retail pharmacies relating to the discounting practices for Brand Name Prescription Drugs (‘BNPD’). In these BNPD litigations, the plaintiffs allege that they were denied discounts for certain prescription drugs that were offered to other mail order and managed care entities, which denial is claimed to be a violation of the Robinson-Patman Act (‘RPA’). The RPA is a Federal law that prohibits unlawful price discrimination. In addition, the plaintiffs alleged that the defendants conspired in their refusal to offer them certain discounts. The conspiracy claims against all defendants were previously settled, with only the RPA claims remaining to be litigated. As of 31 December 2010 HLR is defending approximately 10 BNPD actions brought by approximately 120 retail pharmacies in various federal and state courts throughout the United States. Discovery is currently pending in each of these cases. HLR is not currently scheduled for a trial in any of these BNPD matters in 2011. HLR intends to vigorously defend itself. The outcome of these matters cannot be determined at this time.
On 19 November 2007 Novartis Vaccines & Diagnostics, Inc. (the former Chiron affiliate of Novartis) filed a lawsuit against Trimeris, Inc. and four Roche Group companies: Hoffmann-La Roche Inc., F. Hoffmann-La Roche Ltd, Roche Laboratories Inc. and Roche Colorado Corp., in the US District Court for the Eastern District of Texas. The complaint sought an injunction and damages for the manufacture and sale of Roche’s anti-AIDS drug Fuzeon in the United States. Novartis alleged that these activities infringed the claims of US Patent No. 7,285,271. On 23 September 2010 the matter was settled by Roche and Trimeris taking a royalty-bearing license under the Novartis patent.
On 8 May, 11 June, 8 August, and 29 September 2008, Genentech was named as a defendant, along with InterMune, Inc. and its former chief executive officer, W. Scott Harkonen, in four separate class-action complaints filed in the US District Court for the Northern District of California on behalf of plaintiffs who allegedly paid part or all of the purchase price for a product that was licensed by Genentech to Connectics Corporation and was subsequently assigned to InterMune. Genentech responded to these complaints with a motion to dismiss these matters, which was granted on 28 April 2009. Plaintiffs filed amended complaints including only state law claims on 28 May 2009. Genentech responded to these complaints with another motion to dismiss, which was heard on 11 September 2009. The Court again granted Genentech’s motion to dismiss with respect to all claims, but with leave for plaintiffs to replead specific claims under California unfair competition law. Plaintiffs filed an amended class action complaint on 23 December 2009 naming Genentech as a defendant in claims for unfair competition law, false advertising law, consumer remedies law, consumer protection law, and unjust enrichment. Genentech sought dismissal of this amended complaint. On 1 September 2010 the Court entered an order granting Genentech’s motion to dismiss all claims against it with prejudice. Plaintiffs filed an appeal of the District Court’s ruling with the United States Court of Appeals for the Ninth Circuit and briefing on the appeal is ongoing. The outcome of this matter cannot be determined at this time.

107
On 27 October 2008 Genentech and Biogen Idec Inc. filed a complaint against Sanofi-Aventis Deutschland GmbH (‘Sanofi’), Sanofi-Aventis US LLC and Sanofi-Aventis US Inc. in the Northern District of California seeking a declaratory judgement that certain Genentech products, including Rituxan, do not infringe Sanofi’s US Patents 5,849,522 and 6,218,140 and a declaratory judgement that the ‘522 and ‘140 patents are invalid. Also on 27 October 2008 Sanofi filed suit against Genentech and Biogen Idec in the Eastern District of Texas, Lufkin Division, claiming that Rituxan and at least eight other Genentech products infringe the ‘522 and ‘140 patents. Sanofi brought claims for preliminary and permanent injunctions, compensatory and exemplary damages, and other relief. Genentech challenged the venue of the Texas case and, after an opinion by the Federal Circuit Court of Appeals, the Texas and California cases were consolidated in the Northern District of California. The District Court issued a claim construction order on 23 June 2010. Sanofi filed a motion for reconsideration that was denied. Genentech and Biogen Idec have filed motions for summary judgment that Sanofi has opposed and no ruling on these motions has been issued. Discovery in these consolidated matters is ongoing. In addition on 24 October 2008 Hoechst GmbH filed with the ICC International Court of Arbitration (Paris) a request for arbitration with Genentech, relating to a terminated agreement between Hoechst’s predecessors and Genentech that pertained to the above patents and related patents outside the United States. Hoechst is seeking payments on royalties on sales of Genentech products, damages for breach of contract, and other relief. The ICC arbitration hearing was held on 30 August 2010 through 3 September 2010. Post-hearing briefs have been filed and a ruling is expected in the first half of 2011. The outcome of these matters cannot be determined at this time.
On 11 May 2010 Genentech filed a patent lawsuit against the University of Pennsylvania in the US District Court for the Northern District of California. The lawsuit relates to United States Patent No. 6,733,752 and seeks a declaratory judgment of patent non-infringement and invalidity with regard to that patent. On 12 July 2010 the University counterclaimed against Genentech for infringement of the ‘752 patent, seeking unspecified damages based on the sales of Herceptin. Genentech filed its answer on 2 August 2010. A case management conference was held on 24 August 2010 and a Markman hearing is currently scheduled for 28 March 2011. Discovery in this matter is ongoing. The outcome of this matter cannot be determined at this time.
On 27 August 2010 PDL Biopharma (‘PDL’) filed a complaint against Genentech in Nevada state court seeking a judicial declaration concerning Genentech’s obligation to pay royalties on certain ex-US sales of Herceptin, Avastin, Xolair and Lucentis under a 2003 agreement between the parties. On 13 September 2010 PDL filed a first amended complaint asserting additional claims against Genentech, including breach of contract and breach of the implied covenant of good faith and fair dealing. PDL also asserted new claims against Roche and Novartis for intentional interference with contractual relations. In addition to declaratory relief, PDL is seeking monetary damages including liquidated and punitive damages. On 1 November 2010 Genentech and Roche filed a motion to dismiss for failure to state a claim, and Roche filed an additional motion to dismiss for lack of personal jurisdiction. The outcome of this matter cannot be determined at this time.
On 20 September 2010 GSK and Genentech each filed patent lawsuits against one another (and in the case of GSK, also against Roche Holding Ltd) in US District Courts for the District of Delaware and the Northern District of California respectively. The lawsuits concern GSK’s US Patent Nos. RE41,070 and RE41,555. GSK has asserted claims against Genentech and Roche alleging infringement of the ‘070 and ‘555 patents by certain ‘therapeutic antibody products’, although the complaint only specifically refers to Herceptin. In its lawsuit Genentech is seeking a judicial declaration of non-infringement by certain Genentech products. In the Delaware action on 12 November 2010 Genentech filed a motion to dismiss for failure to state a claim and a motion to transfer the case to California. Roche filed a motion to dismiss for lack of personal jurisdiction (and joining Genentech‘s motion in the event its personal jurisdiction motion is denied). All motions are currently pending. In the California action on 1 December 2010 the Court entered an order staying the California action pending resolution by the Delaware Court of Genentech‘s motion to transfer. The outcome of these matters cannot be determined at this time.

108 Roche Finance Report 2010 Roche Group – Notes to the Roche Group Consolidated Financial Statements
26. Other non-current liabilities Other non-current liabilities | in millions of CHF
2010 2009 2008
Deferred income 74 109 174Other long-term liabilities 263 307 285Total other non-current liabilities 337 416 459
27. DebtDebt: movements in carrying value of recognised liabilities | in millions of CHF
2010 2009
At 1 January 42,416 4,089Proceeds from issue of bonds and notes – 48,197Redemption and repurchase of bonds and notes (8,625) (7,421)Increase (decrease) in commercial paper (86) (261)Increase (decrease) in other debt (51) (133)(Gains) losses on redemption and repurchase of bonds and notes, net 5 255 9Amortisation of debt discount 5 47 47(Gains) losses on financial liabilities at fair-value-through-profit-or-loss, net 5 – (6)Foreign currency transaction (gains) losses, net (959) 3,057Currency translation effects and other (2,939) (5,162)At 31 December 30,058 42,416
Consisting of– Bonds and notes 29,499 41,710– Commercial paper 166 270– Amounts due to banks and other financial institutions 133 136– Genentech leasing obligations 12 237 273– Finance lease obligations 1 2– Other borrowings 22 25Total debt 30,058 42,416
Reported as– Long-term debt 27,857 36,143– Short-term debt 2,201 6,273Total debt 30,058 42,416
The fair value of the bonds and notes is 33.1 billion Swiss francs (2009: 45.4 billion Swiss francs, 2008: 3.0 billion Swiss francs) and the fair value of total debt is 33.6 billion Swiss francs (2009: 46.1 billion Swiss francs, 2008: 4.0 billion Swiss francs). This is calculated based on the observable market prices of the debt instruments or the present value of the future cash flows on the instrument, discounted at a market rate of interest for instruments with similar credit status, cash flows and maturity periods.
There are no pledges on the Group’s assets in connection with debt.

109
Bonds and notesRecognised liabilities and effective interest rates of bonds and notes | in millions of CHF
Effective interest rateUnderlying instrument
Including hedging 2010 2009 2008
US dollar-denominated notes – floating rate 3 months LIBORNotes due 25 February 2010, principal 3 billion US dollars +1.13% n/a – 3,110 –Notes due 25 February 2011, principal 931 million US dollars +2.10% n/a 871 964 –
US dollar-denominated notes – fixed rate4.50% notes due 1 March 2012, principal 2.5 billion US dollars 4.84% n/a – 2,578 –5.00% notes due 1 March 2014, principal 2.75 billion US dollars a) 5.31% n/a 2,652 2,826 –6.00% notes due 1 March 2019, principal 4.5 billion US dollars 6.37% n/a 4,137 4,577 –7.00% notes due 1 March 2039, principal 2.5 billion US dollars 7.43% n/a 2,257 2,500 –
European Medium Term Note programme – floating rate 3 months EURIBORNotes due 4 March 2010, principal 1.5 billion euros +1.05% +0.92% – 2,229 –
European Medium Term Note programme – fixed rate4.625% notes due 4 March 2013, principal 5.25 billion euros 4.82% 5.53% 6,499 7,759 –5.5% notes due 4 March 2015, principal 1.25 billion pounds sterling 5.70% 5.73% 1,791 2,065 –5.625% notes due 4 March 2016, principal 2.75 billion euros 5.70% 6.37% 3,407 4,072 –6.5% notes due 4 March 2021, principal 1.75 billion euros 6.66% 6.99% 2,150 2,569 –5.375% notes due 29 August 2023, principal 250 million pounds sterling 5.46% n/a 356 411 377
Swiss franc bonds2.5% bonds due 23 March 2012, principal amount 2.5 billion Swiss francs 2.68% 3.05% 2,497 2,490 –4.5% bonds due 23 March 2017, principal amount 1.5 billion Swiss francs 4.77% n/a 1,480 1,477 –
US dollar bonds‘Chameleon’ 6.75% due 6 July 2009, principal 487 million US dollars 6.77% n/a – – 522
Genentech Senior Notes4.40% Senior Notes due 15 July 2010, principal 500 million US dollars 4.53% n/a – 528 5494.75% Senior Notes due 15 July 2015, principal 1 billion US dollars 4.87% n/a 935 1,037 1,0585.25% Senior Notes due 15 July 2035, principal 500 million US dollars 5.39% n/a 467 518 529Total 29,499 41,710 3,035
a) Of the principal amount of 2.75 billion US dollars, notes of 1.0 billion US dollars will be redeemed on 24 March 2011 following the Group’s resolution to early redeem these notes (see below).
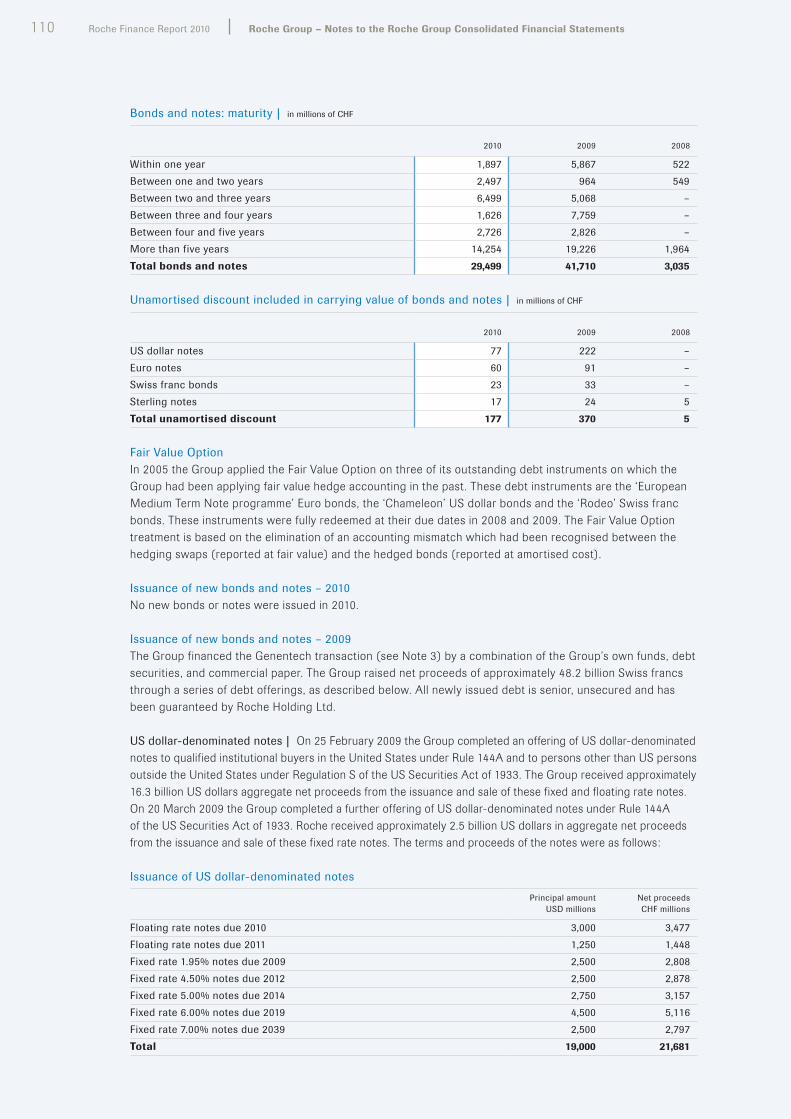
110 Roche Finance Report 2010 Roche Group – Notes to the Roche Group Consolidated Financial Statements
Bonds and notes: maturity | in millions of CHF
2010 2009 2008
Within one year 1,897 5,867 522Between one and two years 2,497 964 549Between two and three years 6,499 5,068 –Between three and four years 1,626 7,759 –Between four and five years 2,726 2,826 –More than five years 14,254 19,226 1,964Total bonds and notes 29,499 41,710 3,035
Unamortised discount included in carrying value of bonds and notes | in millions of CHF
2010 2009 2008
US dollar notes 77 222 –Euro notes 60 91 –Swiss franc bonds 23 33 –Sterling notes 17 24 5Total unamortised discount 177 370 5
Fair Value OptionIn 2005 the Group applied the Fair Value Option on three of its outstanding debt instruments on which the Group had been applying fair value hedge accounting in the past. These debt instruments are the ‘European Medium Term Note programme’ Euro bonds, the ‘Chameleon’ US dollar bonds and the ‘Rodeo’ Swiss franc bonds. These instruments were fully redeemed at their due dates in 2008 and 2009. The Fair Value Option treatment is based on the elimination of an accounting mismatch which had been recognised between the hedging swaps (reported at fair value) and the hedged bonds (reported at amortised cost).
Issuance of new bonds and notes – 2010No new bonds or notes were issued in 2010.
Issuance of new bonds and notes – 2009The Group financed the Genentech transaction (see Note 3) by a combination of the Group’s own funds, debt securities, and commercial paper. The Group raised net proceeds of approximately 48.2 billion Swiss francs through a series of debt offerings, as described below. All newly issued debt is senior, unsecured and has been guaranteed by Roche Holding Ltd.
US dollar-denominated notes | On 25 February 2009 the Group completed an offering of US dollar-denominated notes to qualified institutional buyers in the United States under Rule 144A and to persons other than US persons outside the United States under Regulation S of the US Securities Act of 1933. The Group received approximately 16.3 billion US dollars aggregate net proceeds from the issuance and sale of these fixed and floating rate notes. On 20 March 2009 the Group completed a further offering of US dollar-denominated notes under Rule 144A of the US Securities Act of 1933. Roche received approximately 2.5 billion US dollars in aggregate net proceeds from the issuance and sale of these fixed rate notes. The terms and proceeds of the notes were as follows:
Issuance of US dollar-denominated notes
Principal amount USD millions
Net proceeds CHF millions
Floating rate notes due 2010 3,000 3,477Floating rate notes due 2011 1,250 1,448Fixed rate 1.95% notes due 2009 2,500 2,808Fixed rate 4.50% notes due 2012 2,500 2,878Fixed rate 5.00% notes due 2014 2,750 3,157Fixed rate 6.00% notes due 2019 4,500 5,116Fixed rate 7.00% notes due 2039 2,500 2,797Total 19,000 21,681

111
European Medium Term Note programme | On 4 March 2009 the Group issued euro- and sterling-denominated fixed and floating rate notes. The terms and proceeds of the notes were as follows:
Issuance of European Medium Term Notes
Principal amount Net proceedsEUR millions GBP millions CHF millions
Floating rate EUR notes due 2010 1,500 – 2,214Fixed rate 4.625% EUR notes due 2013 5,250 – 7,701Fixed rate 5.5% GBP notes due 2015 – 1,250 2,045Fixed rate 5.625% EUR notes due 2016 2,750 – 4,045Fixed rate 6.5% EUR notes due 2021 1,750 – 2,551Total 11,250 1,250 18,556
Subsequent to the debt issuances, the proceeds of all notes were swapped into US dollars. As a result, in these financial statements, the notes have economic characteristics equivalent to US dollar-denominated notes.
Swiss franc-denominated bonds and notes | On 23 March 2009 the Group completed an offering of Swiss franc-denominated fixed-rate bonds. The terms and proceeds of the bonds were as follows:
Issuance of Swiss franc-denominated bonds
Principal amount CHF millions
Net proceeds CHF millions
Fixed rate 1.2% bonds due 2009 4,000 3,998Fixed rate 2.5% bonds due 2012 2,500 2,487Fixed rate 4.5% bonds due 2017 1,500 1,475Total 8,000 7,960
Subsequent to the debt issuances, the proceeds of the 2009 and 2012 Swiss franc-denominated bonds were swapped into US dollars. As a result, in these financial statements, the bonds have economic characteristics equivalent to US dollar-denominated bonds.
Cash inflows from issuance of bonds and notes | in millions of CHF
2010 2009
US dollar-denominated notes – 21,681European Medium Term Note programme euro- and sterling-denominated notes – 18,556Swiss franc-denominated notes – 7,960Total cash inflows from issuance of bonds and notes – 48,197
Redemption and repurchase of bonds and notes – 2010Redemption of US dollar-denominated notes | On the due date of 25 February 2010 the Group redeemed notes with a principal of 3 billion US dollars at the original issue amount plus accrued original issue discount (‘OID’). The effective interest rate of these notes was 3 months LIBOR plus 1.13%. The cash outflow was 3,244 million Swiss francs and there was no gain or loss recorded on the redemption.
Redemption of European Medium Term Note programme notes | On the due date of 4 March 2010 the Group redeemed notes with a principal of 1.5 billion euros at the original issue amount plus accrued original issue discount (‘OID’). The effective interest rate of these notes was 3 months EURIBOR plus 1.05% (plus 0.92% including hedging). The cash outflow was 2,194 million Swiss francs and there was no gain or loss recorded on the redemption.

112 Roche Finance Report 2010 Roche Group – Notes to the Roche Group Consolidated Financial Statements
Redemption of Genentech Senior Notes | On the due date of 15 July 2010 the Group redeemed notes with a principal of 500 million US dollars at the original issue amount plus accrued original issue discount (‘OID’). The effective interest rate of these bonds was 4.53%. The cash outflow was 526 million Swiss francs and there was no gain or loss recorded on the redemption.
Early redemption of US dollar-denominated notes | On 29 June 2010 the Group resolved to exercise its option to call for redemption the US dollar-denominated 4.50% fixed rate notes due 1 March 2012 with a principal of 2.5 billion US dollars. The Group redeemed these notes on 9 September 2010 at an amount equal to the sum of the present values of the remaining scheduled payments of these notes discounted to the redemption date at the US Treasury rate plus 0.50%, together with accrued and unpaid interest on the principal. The effective interest rate of these notes before the redemption was 4.84%. The cash outflow was 2,661 million Swiss francs, plus accrued interest. The loss on redemption of 147 million Swiss francs is recorded within financing costs (see Note 5).
On 28 December 2010 the Group resolved to exercise its option to call for redemption a portion of the US dollar-denominated 5.00% fixed rate notes due 1 March 2014. The Group will redeem 1.0 billion US dollars of the total principal amount of 2.75 billion US dollars of these notes on 24 March 2011 at an amount equal to the sum of the present values of the remaining scheduled payments of these notes discounted to the redemption date at the US Treasury rate plus 0.50%, together with accrued and unpaid interest on the principal. The US Treasury rate will be determined by an independent investment banker on the third business day preceding the redemption. A cash outflow of approximately 1,098 million US dollars, plus accrued interest, is expected on redemption. The Group has revised the carrying value of these notes to take into account the changes to the amounts and timings of the estimated cash flows. The revised carrying value of these notes at 31 December 2010 is 1,097 million US dollars (1,026 million Swiss francs). The increase in carrying value of 103 million US dollars (108 million Swiss francs) is recorded within financing costs (see Note 5) as a loss on redemption. The effective interest rate of these notes is 5.31%.
Redemption and repurchase of bonds and notes – 2009Redemption of ‘Chameleon’ US dollar bonds | The Group redeemed these bonds with a remaining outstanding principal value of 487 million US dollars, which had a due date of 6 July 2009, at the original issue amount plus accrued original issue discount (‘OID’). The effective interest rate of these bonds was 6.77%. The cash outflow was 530 million Swiss francs. There was no gain or loss recorded in the income statement upon the redemption.
Redemption and repurchase of US dollar-denominated notes | The Group redeemed notes with a principal value of 2,500 million US dollars, which had a due date of 23 September 2009, at the original issue amount plus accrued original issue discount (‘OID’). The effective interest rate of these bonds was 1.98%. The cash outflow was 2,560 million Swiss francs. There was no gain or loss recorded in the income statement upon the redemption.
In addition the Group repurchased floating rate notes with a principal value of 319 million US dollars and original due date of 25 February 2011, at various dates during 2009 in open market purchases. The effective interest rate of these bonds was 3 months LIBOR plus 2.10%. The cash outflow was 331 million Swiss francs. A loss of 9 million Swiss francs was recorded in the income statement upon the repurchase.
Redemption of Swiss franc-denominated notes | The Group redeemed notes with a principal value of 4,000 million Swiss francs, which had a due date of 23 September 2009, at the original issue amount plus accrued original issue discount (‘OID’). The effective interest rate of these bonds was 1.30%, or 2.20% including associated hedging instruments. The cash outflow was 4,000 million Swiss francs. There was no gain or loss recorded in the income statement upon the redemption.

113
Cash outflows from redemption and repurchase of bonds and notes | in millions of CHF
2010 2009
US dollar-denominated notes (5,905) (2,891)European Medium Term Note programme euro-denominated notes (2,194) –Genentech Senior Notes (526) –‘Chameleon’ US dollar bonds – (530)Swiss franc-denominated notes – (4,000)Total cash outflows from redemption and repurchase of bonds and notes (8,625) (7,421)
Collateral arrangementsCollateral agreements were entered into with the derivative counterparties to the above currency swaps to mitigate counterparty risk. As the fair value of the derivative instruments moved down during 2010, due mainly to a stronger US dollar compared to the euro, a total of 1.4 billion Swiss francs cash collateral was delivered by the Group during 2010 (2009: 1.5 billion Swiss francs delivered to the Group). This collateral delivered in 2010 is recorded as a decrease in cash and a corresponding decrease in accrued liabilities. The carrying value of accrued liabilities in respect of these agreements was 0.1 billion Swiss francs (31 December 2009: accrued liabilities of 1.5 billion Swiss francs). The realised loss on derivatives was 0.3 billion Swiss francs (2009: realised gain of 1.8 billion Swiss francs) and relates mainly to hedges on the non-US dollar-denominated bonds and notes.
Commercial paperGenentech commercial paper program | In October 2007 Genentech established a commercial paper program under which it could issue up to 1 billion US dollars of unsecured commercial paper notes. As at 31 December 2008 unsecured commercial paper notes with a principal amount of 500 million US dollars were outstanding. During the first six months of 2009 the Group fully redeemed these notes at maturity at their principal value. Genentech has terminated its commercial paper program as of 15 May 2009 and there were no amounts outstanding at 31 December 2010.
Roche Holdings, Inc. commercial paper program | In March 2009 Roche Holdings, Inc. established a commercial paper program under which it can issue up to 7.5 billion US dollars of unsecured commercial paper notes guaranteed by Roche Holding Ltd. Committed credit lines of 2.5 billion euros and 950 million US dollars are available as back-stop lines. Maturity of the notes under the program cannot exceed 365 days from the date of issuance. As at 31 December 2010 unsecured commercial paper notes with a principal amount of 177 million US dollars and an average interest rate of 0.19% were outstanding. These amounts were due at various dates until 7 January 2011.
Movements in commercial paper obligations | in millions of CHF
2010 2009
At 1 January 270 529
Net cash proceeds (payments)– Genentech commercial paper program – (543)– Roche Holdings, Inc. commercial paper program (86) 282Total net cash proceeds (payments) (86) (261)
Currency translation effects (18) 2At 31 December 166 270
Amounts due to banks and other financial institutionsThese amounts are denominated in various currencies, notably in Taiwanese dollars, and the average interest rate was 3.06%. The average interest rate in 2009 was 4.1%, when the balance was primarily denominated in Chinese renminbi. Repayment dates are up to three years and 71 million Swiss francs (2009: 65 million Swiss francs) are due within one year.

114 Roche Finance Report 2010 Roche Group – Notes to the Roche Group Consolidated Financial Statements
28. Equity attributable to Roche shareholdersChanges in equity attributable to Roche shareholders | in millions of CHF
ReservesShare
capitalRetained earnings
Fair value Hedging Translation Total
Year ended 31 December 2009At 1 January 2009 160 52,081 (231) 9 (7,540) 44,479
Net income recognised in income statement – 7,784 – – – 7,784
Available-for-sale investments– Valuation gains (losses)
taken to equity – – 162 – – 162– Transferred to income statement
on sale or impairment – – 207 – – 207– Income taxes – – (14) – – (14)– Non-controlling interests – – (3) – – (3)Cash flow hedges– Gains (losses) taken to equity – – – 2,090 – 2,090– Transferred to income statement a) – – – (1,973) – (1,973)– Transferred to the initial carrying
value of hedged items – – – – – –– Income taxes – – – (42) – (42)– Non-controlling interests – – – (15) – (15)Currency translation of foreign operations– Exchange differences – – (22) (4) 3,081 3,055– Accumulated differences transferred
to income statement on divestment 34 – – – – (1) (1)– Non-controlling interests – – – – (333) (333)Defined benefit post-employment plans– Actuarial gains (losses) 10 – (69) – – – (69)– Limit on asset recognition 10 – (3) – – – (3)– Income taxes – 67 – – – 67– Non-controlling interests – (1) – – – (1)Other comprehensive income, net of tax – (6) 330 56 2,747 3,127
Total comprehensive income – 7,778 330 56 2,747 10,911
Dividends paid – (4,300) – – – (4,300)Equity compensation plans, net of transactions in own equity instruments – 77 – – – 77Chugai share repurchases 4 – (9) – – – (9)Changes in ownership interests in subsidiaries– Genentech 3 – (43,777) – – – (43,777)– Memory 7 – (2) – – – (2)Changes in non-controlling interests – (13) – – – (13)At 31 December 2009 160 11,835 99 65 (4,793) 7,366
a) Of amounts transferred to income statement, losses of 12 million Swiss francs were reported as ‘Royalties and other operating income’ and gains of 1,985 million Swiss francs as ‘Financial income’.
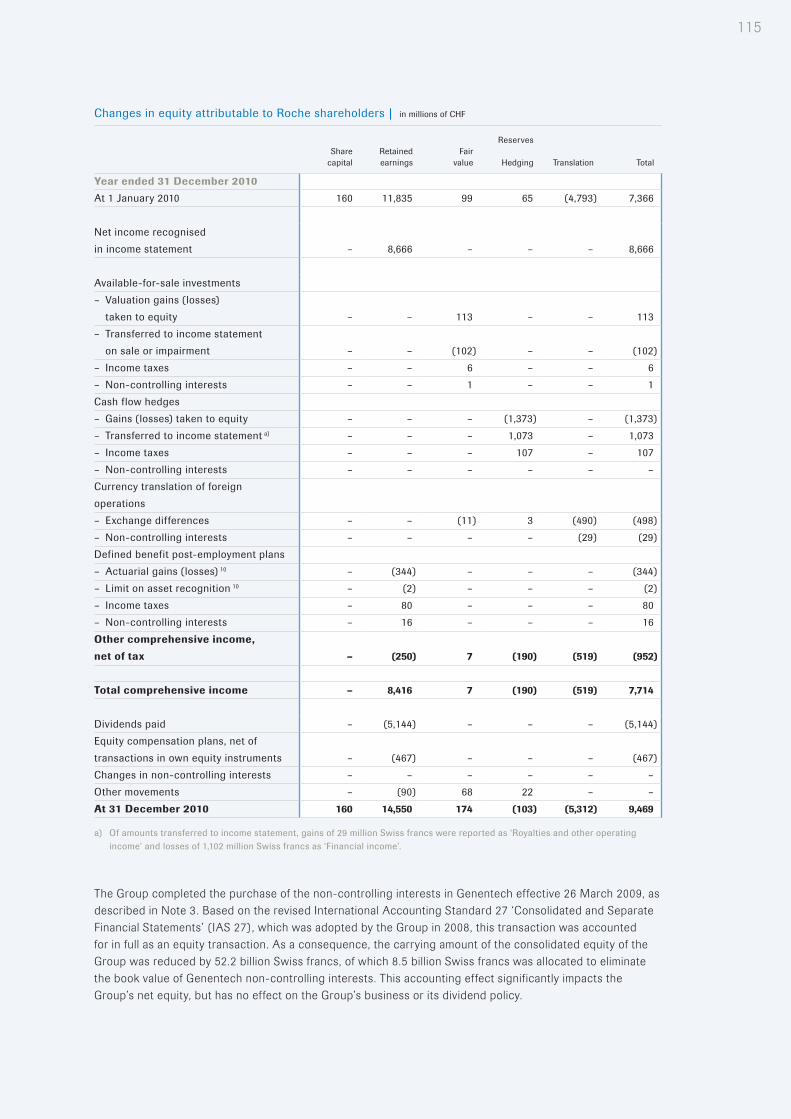
115
Changes in equity attributable to Roche shareholders | in millions of CHF
ReservesShare
capitalRetained earnings
Fair value Hedging Translation Total
Year ended 31 December 2010At 1 January 2010 160 11,835 99 65 (4,793) 7,366
Net income recognised in income statement – 8,666 – – – 8,666
Available-for-sale investments– Valuation gains (losses)
taken to equity – – 113 – – 113– Transferred to income statement
on sale or impairment – – (102) – – (102)– Income taxes – – 6 – – 6– Non-controlling interests – – 1 – – 1Cash flow hedges– Gains (losses) taken to equity – – – (1,373) – (1,373)– Transferred to income statement a) – – – 1,073 – 1,073– Income taxes – – – 107 – 107– Non-controlling interests – – – – – –Currency translation of foreign operations– Exchange differences – – (11) 3 (490) (498)– Non-controlling interests – – – – (29) (29)Defined benefit post-employment plans– Actuarial gains (losses) 10 – (344) – – – (344)– Limit on asset recognition 10 – (2) – – – (2)– Income taxes – 80 – – – 80– Non-controlling interests – 16 – – – 16Other comprehensive income, net of tax – (250) 7 (190) (519) (952)
Total comprehensive income – 8,416 7 (190) (519) 7,714
Dividends paid – (5,144) – – – (5,144)Equity compensation plans, net of transactions in own equity instruments – (467) – – – (467)Changes in non-controlling interests – – – – – –Other movements – (90) 68 22 – –At 31 December 2010 160 14,550 174 (103) (5,312) 9,469
a) Of amounts transferred to income statement, gains of 29 million Swiss francs were reported as ‘Royalties and other operating income’ and losses of 1,102 million Swiss francs as ‘Financial income’.
The Group completed the purchase of the non-controlling interests in Genentech effective 26 March 2009, as described in Note 3. Based on the revised International Accounting Standard 27 ‘Consolidated and Separate Financial Statements’ (IAS 27), which was adopted by the Group in 2008, this transaction was accounted for in full as an equity transaction. As a consequence, the carrying amount of the consolidated equity of the Group was reduced by 52.2 billion Swiss francs, of which 8.5 billion Swiss francs was allocated to eliminate the book value of Genentech non-controlling interests. This accounting effect significantly impacts the Group’s net equity, but has no effect on the Group’s business or its dividend policy.

116 Roche Finance Report 2010 Roche Group – Notes to the Roche Group Consolidated Financial Statements
Share capitalAs of 31 December 2010, the authorised and issued share capital of Roche Holding Ltd, which is the Group’s parent company, consisted of 160,000,000 shares with a nominal value of 1.00 Swiss franc each, as in the preceding year. The shares are bearer shares and the Group does not maintain a register of shareholders. Based on information supplied to the Group, a shareholder group with pooled voting rights owns 50.0125% (2009: 50.0125%) of the issued shares. This is further described in Note 33. Based on information supplied to the Group, Novartis Ltd, Basel, and its affiliates own 33.3330% (participation below 331⁄3%) of the issued shares (2009: 33.3330%).
Non-voting equity securities (Genussscheine)As of 31 December 2010, 702,562,700 non-voting equity securities have been authorised and were in issue as in the preceding year. Under Swiss company law these non-voting equity securities have no nominal value, are not part of the share capital and cannot be issued against a contribution which would be shown as an asset in the balance sheet of Roche Holding Ltd. Each non-voting equity security confers the same rights as any of the shares to participate in the net profit and any remaining proceeds from liquidation following repayment of the nominal value of the shares and, if any, participation certificates. In accordance with the law and the Articles of Incorporation of Roche Holding Ltd, the Company is entitled at all times to exchange all or some of the non-voting equity securities into shares or participation certificates.
DividendsOn 2 March 2010 the shareholders approved the distribution of a dividend of 6.00 Swiss francs per share and non-voting equity securities (2009: 5.00 Swiss francs) in respect of the 2008 business year. The distribution to holders of outstanding shares and non-voting equity securities totalled 5,144 million Swiss francs (2009: 4,300 million Swiss francs) and has been recorded against retained earnings in 2010. The Board of Directors has proposed dividends for the 2010 business year of 6.60 Swiss francs per share and non-voting equity security which, if approved, would result in a total distribution to shareholders of 5,693 million Swiss francs. This is subject to approval at the Annual General Meeting on 1 March 2011.
Own equity instrumentsHoldings of own equity instruments in equivalent number of non-voting equity securities
31 December 2010 (millions)
31 December 2009 (millions)
Non-voting equity securities 11.2 6.7Derivative instruments 9.9 7.4Total 21.1 14.1
Own equity instruments are recorded within equity at original purchase cost. Details of own equity instruments held at 31 December 2010 are shown in the table below. Fair values are disclosed for information purposes.
Own equity instruments at 31 December 2010: supplementary information
Equivalent number of non-voting
equity securities (millions) Maturity
Strike price (CHF)
Market value (CHF billions)
Non-voting equity securities 11.2 – – 1.5Derivative instruments
9.98 Feb. 2012– 16 Sep. 2016
145.40–229.60 0.1
Total 21.1 1.6

117
Non-voting equity securities and derivative instruments are held for the Group’s potential conversion obligations that may arise from the Roche Option Plan, Roche Stock-settled Stock Appreciation Rights and Roche Restricted Stock Unit Plan (see Note 11). These mainly consist of call options that are exercisable at any time up to their maturity.
The Group holds none of its own shares.
ReservesFair value reserve | The fair value reserve represents the cumulative net change in the fair value of available-for-sale financial assets until the asset is sold, impaired or otherwise disposed of.
Hedging reserve | The hedging reserve represents the effective portion of the cumulative net change in the fair value of cash flow hedging instruments related to hedged transactions that have not yet occurred.
Translation reserve | The translation reserve represents the cumulative currency translation differences relating to the consolidation of Group companies that use functional currencies other than Swiss francs.
29. Earnings per share and non-voting equity securityBasic earnings per share and non-voting equity securityFor the calculation of basic earnings per share and non-voting equity security, the number of shares and non-voting equity securities is reduced by the weighted average number of its own non-voting equity securities held by the Group during the period.
Basic earnings per share and non-voting equity security
2010 2009
Net income attributable to Roche shareholders (CHF millions) 8,666 7,784
Number of shares (millions) 28 160 160Number of non-voting equity securities (millions) 28 703 703Weighted average number of own non-voting equity securities held (millions) (8) (5)Weighted average number of shares and non-voting equity securities in issue (millions) 855 858
Basic earnings per share and non-voting equity security (CHF) 10.14 9.07
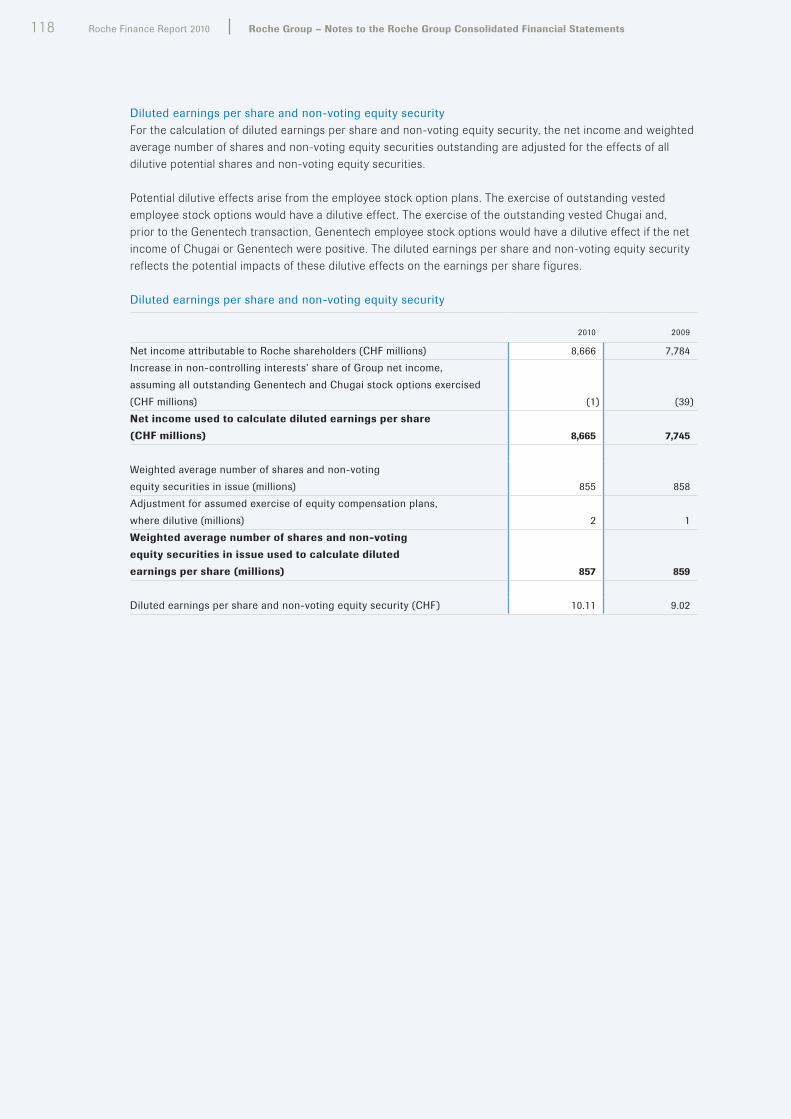
118 Roche Finance Report 2010 Roche Group – Notes to the Roche Group Consolidated Financial Statements
Diluted earnings per share and non-voting equity securityFor the calculation of diluted earnings per share and non-voting equity security, the net income and weighted average number of shares and non-voting equity securities outstanding are adjusted for the effects of all dilutive potential shares and non-voting equity securities.
Potential dilutive effects arise from the employee stock option plans. The exercise of outstanding vested employee stock options would have a dilutive effect. The exercise of the outstanding vested Chugai and, prior to the Genentech transaction, Genentech employee stock options would have a dilutive effect if the net income of Chugai or Genentech were positive. The diluted earnings per share and non-voting equity security reflects the potential impacts of these dilutive effects on the earnings per share figures.
Diluted earnings per share and non-voting equity security
2010 2009
Net income attributable to Roche shareholders (CHF millions) 8,666 7,784Increase in non-controlling interests’ share of Group net income, assuming all outstanding Genentech and Chugai stock options exercised (CHF millions) (1) (39)Net income used to calculate diluted earnings per share (CHF millions) 8,665 7,745
Weighted average number of shares and non-voting equity securities in issue (millions) 855 858Adjustment for assumed exercise of equity compensation plans, where dilutive (millions) 2 1Weighted average number of shares and non-voting equity securities in issue used to calculate diluted earnings per share (millions) 857 859
Diluted earnings per share and non-voting equity security (CHF) 10.11 9.02

119
30. Non-controlling interests Changes in equity attributable to non-controlling interests | in millions of CHF
2010 2009
At 1 January 2,048 9,343
Net income recognised in income statement– Genentech 3 – 431– Chugai 4 206 277– Other non-controlling interests 19 18Total net income recognised in income statement 225 726
Available-for-sale investments (1) 3Cash flow hedges – 15Currency translation of foreign operations 29 333Defined benefit post-employment plans (16) 1Other comprehensive income, net of tax 12 352
Total comprehensive income 237 1,078
Memory acquisition 7 – 4Dividends paid to non-controlling shareholders– Chugai 4 (99) (87)– Other non-controlling interests (8) (8)Equity compensation plans, net of transactions in own equity instruments 1 178Chugai share repurchases 4 – (5)Changes in ownership interests in subsidiaries– Genentech 3 – (8,464)– Memory 7 – (4)Changes in non-controlling interests – 13Equity contribution by non-controlling interests 14 –At 31 December 2,193 2,048
Of which– Chugai 4 2,130 2,004– Other non-controlling interests 63 44Total non-controlling interests 2,193 2,048
During 2010, non-controlling interests made equity contributions of 14 million Swiss francs (2009: zero).

120 Roche Finance Report 2010 Roche Group – Notes to the Roche Group Consolidated Financial Statements
31. Statement of cash flows Cash flows from operating activitiesCash flows from operating activities arise from the Group’s primary activities in the Pharmaceuticals and Diagnostics businesses. These are calculated by the indirect method by adjusting the Group’s operating profit for any operating income and expenses that are not cash flows (for example depreciation, amortisation and impairment) in order to derive the cash generated from operations. This and other operating cash flows are shown in the statement of cash flows. Operating cash flows also include income taxes paid on all activities.
Cash generated from operations | in millions of CHF
2010 2009
Net income 8,891 8,510Add back non-operating (income) expense– Associates 15 3 –– Financial income 5 (557) (554)– Financing costs 5 2,829 2,599– Income taxes 6 2,320 1,722Operating profit 13,486 12,277
Depreciation of property, plant and equipment 12 1,933 1,981Amortisation of intangible assets 14 619 712Impairment of intangible assets 14 667 668Impairment of property, plant and equipment 12 138 1,127Operating expenses for defined benefit post-employment plans 10 235 315Operating expenses for equity-settled equity compensation plans 11 302 586Net (income) expense for provisions 25 1,625 1,572Bad debt expense 182 138Inventory write-downs 374 55Other adjustments (125) (127)Cash generated from operations 19,436 19,304
Cash flows from investing activitiesCash flows from investing activities are principally those arising from the Group’s investments in property, plant and equipment and intangible assets, and from the acquisition and divestment of subsidiaries, associates and businesses. Cash flows connected with the Group’s portfolio of marketable securities and other investments are also included, as are any interest and dividend payments received in respect of these securities and investments. These cash flows indicate the Group’s net reinvestment in its operating assets and the cash flow effects of business combinations and divestments, as well as the cash generated by the Group’s other investments.
Interest and dividends received | in millions of CHF
2010 2009
Interest received 57 305Dividends received 2 1Total 59 306

121
Cash flows from financing activities Cash flows from financing activities are primarily the proceeds from the issue and repayment of the Group’s equity and debt instruments. They also include interest payments and dividend payments on these instruments. Cash flows from short-term financing, including finance leases, are also included. These cash flows indicate the Group’s transactions with the providers of its equity and debt financing. Cash flows from short-term borrowings are shown as a net movement, as these consist of a large number of transactions with short maturity.
Significant non-cash transactions2010 | There were no significant non-cash transactions.
2009 | Of the total purchase consideration of 376 million US dollars for Lonza Singapore, 225 million US dollars (238 million Swiss francs) was a non-cash settlement of loans previously made by Genentech to Lonza. See Note 7 for further information.
32. Risk managementGroup risk managementRisk management is a fundamental element of the Group’s business practice on all levels and encompasses different types of risks. At a group level risk management is an integral part of the business planning and controlling processes. Material risks are monitored and regularly discussed with the Corporate Executive Committee and the Audit Committee of the Board of Directors. Financial risk management specifically is described in further detail below.
Financial risk managementThe Group is exposed to various financial risks arising from its underlying operations and corporate finance activities. The Group’s financial risk exposures are predominantly related to changes in foreign exchange rates, interest rates and equity prices as well as the creditworthiness and the solvency of the Group’s counterparties.
Financial risk management within the Group is governed by policies reviewed by the boards of directors of Roche or Chugai as appropriate to their areas of statutory responsibility. These policies cover credit risk, liquidity risk and market risk. The policies provide guidance on risk limits, type of authorised financial instruments and monitoring procedures. As a general principle, the policies prohibit the use of derivative financial instruments for speculative trading purposes. Policy implementation and day-to-day risk management are carried out by the relevant treasury functions and regular reporting on these risks is performed by the relevant accounting and controlling functions within Roche and Chugai.
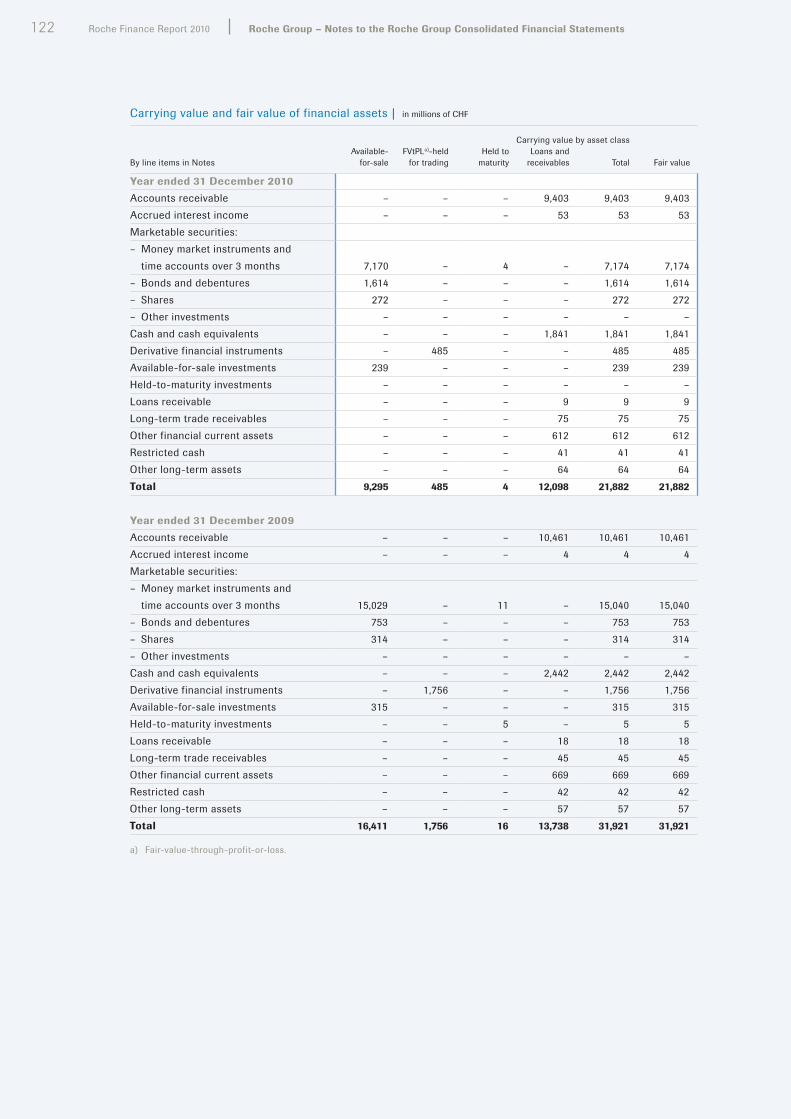
122 Roche Finance Report 2010 Roche Group – Notes to the Roche Group Consolidated Financial Statements
Carrying value and fair value of financial assets | in millions of CHF
Carrying value by asset class
By line items in NotesAvailable-
for-saleFVtPLa)-held
for tradingHeld to
maturityLoans and
receivables Total Fair value
Year ended 31 December 2010Accounts receivable – – – 9,403 9,403 9,403Accrued interest income – – – 53 53 53Marketable securities:– Money market instruments and
time accounts over 3 months 7,170 – 4 – 7,174 7,174– Bonds and debentures 1,614 – – – 1,614 1,614– Shares 272 – – – 272 272– Other investments – – – – – –Cash and cash equivalents – – – 1,841 1,841 1,841Derivative financial instruments – 485 – – 485 485Available-for-sale investments 239 – – – 239 239Held-to-maturity investments – – – – – –Loans receivable – – – 9 9 9Long-term trade receivables – – – 75 75 75Other financial current assets – – – 612 612 612Restricted cash – – – 41 41 41Other long-term assets – – – 64 64 64Total 9,295 485 4 12,098 21,882 21,882
Year ended 31 December 2009Accounts receivable – – – 10,461 10,461 10,461Accrued interest income – – – 4 4 4Marketable securities:– Money market instruments and
time accounts over 3 months 15,029 – 11 – 15,040 15,040– Bonds and debentures 753 – – – 753 753– Shares 314 – – – 314 314– Other investments – – – – – –Cash and cash equivalents – – – 2,442 2,442 2,442Derivative financial instruments – 1,756 – – 1,756 1,756Available-for-sale investments 315 – – – 315 315Held-to-maturity investments – – 5 – 5 5Loans receivable – – – 18 18 18Long-term trade receivables – – – 45 45 45Other financial current assets – – – 669 669 669Restricted cash – – – 42 42 42Other long-term assets – – – 57 57 57Total 16,411 1,756 16 13,738 31,921 31,921
a) Fair-value-through-profit-or-loss.

123
Following the implementation of amendments to IFRS 7 ‘Financial Instruments: Disclosures’ that were published in March 2009 the Group has established a fair value hierarchy that reflects the significance of inputs used in making the fair value measurements. The fair value hierarchy includes the following three levels:
• Level 1 – quoted prices in active markets for identical assets and liabilities
• Level 2 – observable inputs other than quoted prices in active markets for identical assets and liabilities
• Level 3 – unobservable inputs
Fair value hierarchy of financial assets and liabilities at 31 December 2010 | in millions of CHF
Level 1 Level 2 Level 3 Total
Financial assets recognised at fair valueMarketable securities:– Money market instruments and time accounts
over 3 months 2,585 4,589 – 7,174– Bonds and debentures 1,304 310 – 1,614– Shares 255 17 – 272Derivative financial instruments – 485 – 485Available-for-sale investments 36 164 – 200Total 4,180 5,565 – 9,745
Financial liabilities recognised at fair valueDerivative financial instruments – (102) – (102)Total – (102) – (102)
Fair value hierarchy of financial assets and liabilities at 31 December 2009 | in millions of CHF
Level 1 Level 2 Level 3 Total
Financial assets recognised at fair valueMarketable securities:– Money market instruments and time accounts
over 3 months 1,862 13,167 – 15,029– Bonds and debentures 388 346 19 753– Shares 294 20 – 314Derivative financial instruments – 1,756 – 1,756Available-for-sale investments 112 169 – 281Total 2,656 15,458 19 18,133
Financial liabilities recognised at fair valueDerivative financial instruments – (343) – (343)Total – (343) – (343)
Available-for-sale investments exclude equity securities held at cost of 39 million Swiss francs (2009: 34 million Swiss francs), as those are not carried at fair value (see Note 16).
At 31 December 2010 Level 1 financial assets consist of treasury bills, bonds and quoted shares. Level 2 financial assets consist primarily of commercial paper, certificates of deposit, derivative financial instruments and unquoted shares. At 31 December 2009 Level 3 financial assets consist of auction-rate student loan securities. These securities were valued based on broker-provided valuation models, which approximate fair value and were sold at par value during 2010. There were no significant transfers between Level 1 and Level 2 and vice versa.

124 Roche Finance Report 2010 Roche Group – Notes to the Roche Group Consolidated Financial Statements
Changes in fair value of Level 3 financial assets | in millions of CHF
2010 2009
At 1 January 19 292Impairment charges – (3)Valuation gains (losses) taken to equity 2 95Gains (losses) recognised in the income statement – 5Sales (21) (376)Currency translation difference – 6At 31 December – 19
Credit riskCredit risk arises from the possibility that counterparties to transactions may default on their obligations, causing financial losses for the Group. The objective of managing counterparty credit risk is to prevent losses of liquid funds deposited with or invested in such counterparties.
The maximum exposure to credit risk resulting from financial activities, without considering netting agreements and without taking account of any collateral held or other credit enhancements, is equal to the carrying value of the Group’s financial assets.
Trade receivables | These are subject to a policy of active credit risk management which focuses on the assessment of country risk, credit availability, ongoing credit evaluation and account monitoring procedures. The objective of the management of trade receivables is to sustain the growth and profitability of the Group by optimising asset utilisation whilst maintaining risks at an acceptable level. Except as noted below, there is no significant concentration of counterparty credit risk due to the Group’s large number of customers and their wide geographical spread. Risk limits and exposures are continuously monitored by country and by the nature of counterparties. Additionally, the Group obtains credit insurance and similar enhancements when appropriate to protect the collection of trade receivables. As at 31 December 2010 no collateral was held for loans and receivables (2009: none).
At 31 December 2010 the Group’s combined trade accounts receivable balance with three US national wholesale distributors, AmerisourceBergen Corp., Cardinal Health, Inc. and McKesson Corp., was equivalent to 1.1 billion Swiss francs representing 12% of the Group’s consolidated trade accounts receivable (2009: 1.3 billion Swiss francs representing 13%).
Nature and geographical location of trade receivables (not overdue) counterparties | in millions of CHF
2010 2009
Regions Total Public
Whole-salers/
distributors Private Total Public
Whole-salers/
distributors Private
Switzerland 89 42 8 39 89 37 9 43European Union 1,993 703 748 542 2,340 994 812 534Rest of Europe 468 30 389 49 456 12 394 50North America 1,712 91 1,344 277 2,006 82 1,235 689Latin America 552 134 226 192 501 132 189 180Japan 1,429 1 1,405 23 1,472 – 1,447 25Rest of Asia 678 99 241 338 756 114 251 391Africa, Australia and Oceania 214 36 84 94 224 64 77 83Total 7,135 1,136 4,445 1,554 7,844 1,435 4,414 1,995

125
Cash and marketable securities | These are subject to a policy of restricting exposures to high-quality counterparties and setting defined limits for individual counterparties. These limits and counterparty credit ratings are reviewed regularly. Investments in marketable securities are entered into on the basis of guidelines with regard to liquidity, quality and maximum amount. As a general rule, the Group invests only in high-quality securities with adequate liquidity. Cash and short-term time deposits are subject to rules which limit the Group’s exposure to individual financial institutions. In 2010 the Group received zero coupon Greek government bonds in settlement of overdue receivables which have been allocated to the ‘Below BBB-range’.
Rating analysis of cash and fixed income marketable securities (market values)
2010 (mCHF)
2010 (% of total)
2009 (mCHF)
2009 (% of total)
AAA-range 6,325 60 8,978 49AA-range 3,104 29 7,065 39A-range 1,008 9 1,945 11BBB-range 120 1 245 1Below BBB-range 71 1 2 0Total 10,628 100 18,235 100
Derivatives | The Group signs netting and collateral agreements under an ISDA (International Swaps and Derivatives Association) master agreement with the respective counterparties in order to mitigate counterparty risk on derivative positions. During 2009 the Group entered into derivative contracts with third parties to hedge the foreign exchange risk arising from bonds and notes issued by the Group’s US affiliate, Roche Holdings, Inc. in currencies other than US dollar. The total exposure hedged at issuance of these bonds and notes was approximately 25 billion Swiss francs (see Note 27). As the fair value of the derivative instruments moved up during 2009 due to a weaker US dollar, net cash collateral of 1.5 billion Swiss francs was delivered to the Group by 31 December 2009. In 2010 the Group returned 1.4 billion Swiss francs due to the strengthening of the US dollar against the euro and pound sterling.
Overdue assets | Financial assets which are past due but not impaired total 2.5 billion Swiss francs (2009: 2.8 billion Swiss francs).
Analysis of overdue but not impaired financial assets by class | in millions of CHF
Total amount overdue
under 1 month
1–3 months
4–6 months
6–12 months
more than 1 year
Year ended 31 December 2010Loans and receivables 2,476 437 479 451 353 756Year ended 31 December 2009Loans and receivables 2,805 504 609 632 454 606
Since the beginning of 2010 there have been increasing financial difficulties in certain Southern European countries, particularly Greece. The Group is a leading supplier to the Greek healthcare sector and has trade receivables with the Greek public customers. In the second half of 2010 the Group has accepted an offer made by the Greek government to settle large parts of overdue trade receivables with zero coupon government bonds, redeemable between 2011 and 2013. Some first government bonds were received in late December 2010. The Group expects to receive the remaining government bonds during the first half of 2011. The Group is carefully monitoring the situation and is assessing its options to manage these counterparty exposures.
As at 31 December 2010 there are no other financial assets whose terms have been renegotiated (2009: none).
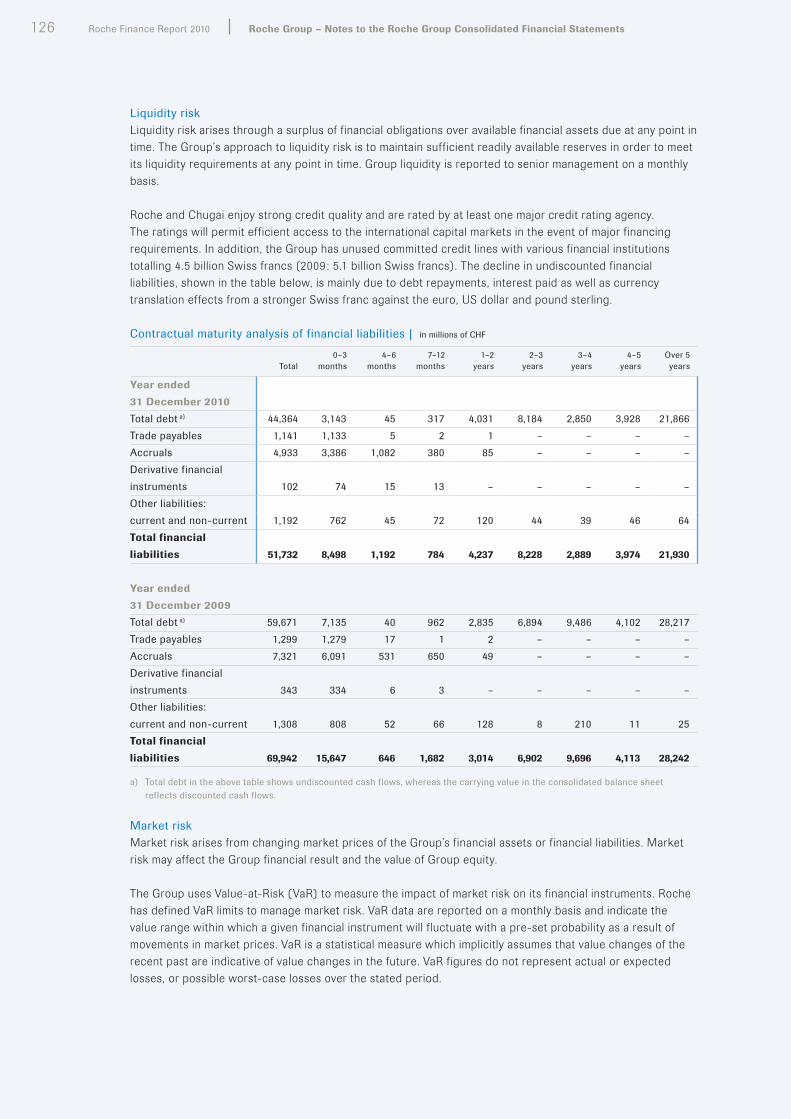
126 Roche Finance Report 2010 Roche Group – Notes to the Roche Group Consolidated Financial Statements
Liquidity riskLiquidity risk arises through a surplus of financial obligations over available financial assets due at any point in time. The Group’s approach to liquidity risk is to maintain sufficient readily available reserves in order to meet its liquidity requirements at any point in time. Group liquidity is reported to senior management on a monthly basis.
Roche and Chugai enjoy strong credit quality and are rated by at least one major credit rating agency. The ratings will permit efficient access to the international capital markets in the event of major financing requirements. In addition, the Group has unused committed credit lines with various financial institutions totalling 4.5 billion Swiss francs (2009: 5.1 billion Swiss francs). The decline in undiscounted financial liabilities, shown in the table below, is mainly due to debt repayments, interest paid as well as currency translation effects from a stronger Swiss franc against the euro, US dollar and pound sterling.
Contractual maturity analysis of financial liabilities | in millions of CHF
Total0–3
months4–6
months7–12
months1–2
years2–3
years3–4
years4–5
yearsOver 5 years
Year ended 31 December 2010Total debt a) 44,364 3,143 45 317 4,031 8,184 2,850 3,928 21,866Trade payables 1,141 1,133 5 2 1 – – – –Accruals 4,933 3,386 1,082 380 85 – – – –Derivative financial instruments 102 74 15 13 – – – – –Other liabilities:current and non-current 1,192 762 45 72 120 44 39 46 64Total financial liabilities 51,732 8,498 1,192 784 4,237 8,228 2,889 3,974 21,930
Year ended 31 December 2009Total debt a) 59,671 7,135 40 962 2,835 6,894 9,486 4,102 28,217Trade payables 1,299 1,279 17 1 2 – – – –Accruals 7,321 6,091 531 650 49 – – – –Derivative financial instruments 343 334 6 3 – – – – –Other liabilities: current and non-current 1,308 808 52 66 128 8 210 11 25Total financial liabilities 69,942 15,647 646 1,682 3,014 6,902 9,696 4,113 28,242
a) Total debt in the above table shows undiscounted cash flows, whereas the carrying value in the consolidated balance sheet reflects discounted cash flows.
Market riskMarket risk arises from changing market prices of the Group’s financial assets or financial liabilities. Market risk may affect the Group financial result and the value of Group equity.
The Group uses Value-at-Risk (VaR) to measure the impact of market risk on its financial instruments. Roche has defined VaR limits to manage market risk. VaR data are reported on a monthly basis and indicate the value range within which a given financial instrument will f luctuate with a pre-set probability as a result of movements in market prices. VaR is a statistical measure which implicitly assumes that value changes of the recent past are indicative of value changes in the future. VaR figures do not represent actual or expected losses, or possible worst-case losses over the stated period.
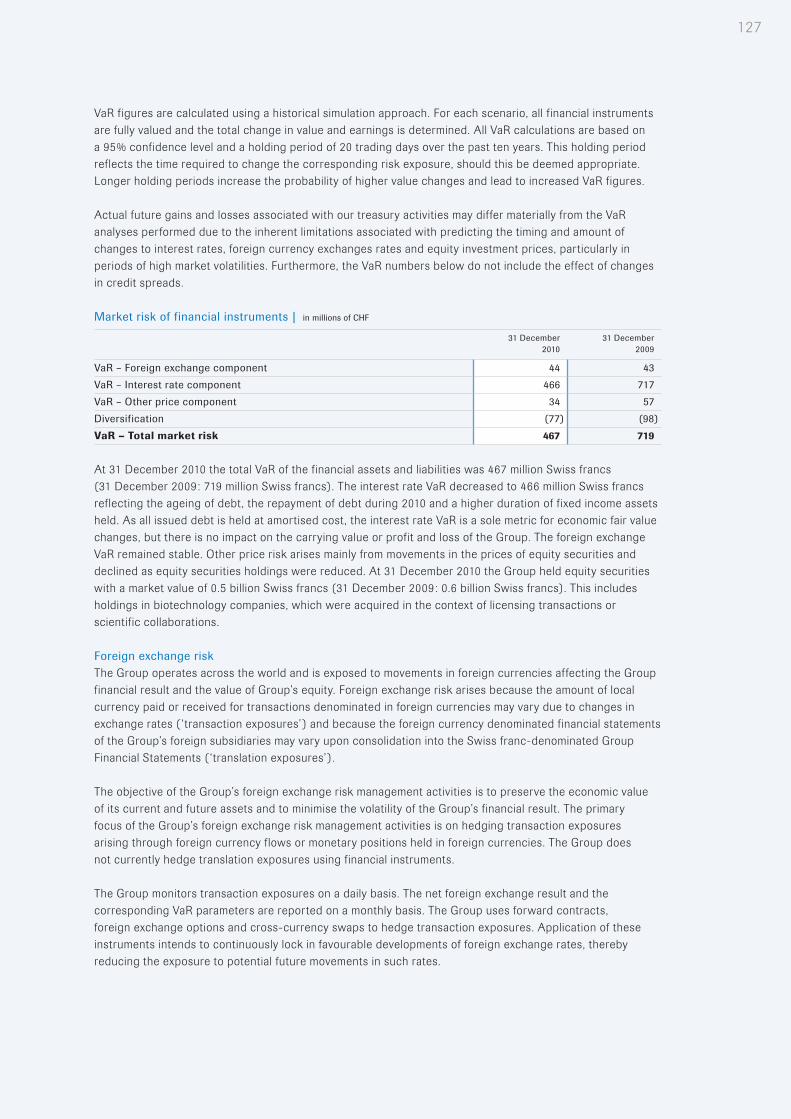
127
VaR figures are calculated using a historical simulation approach. For each scenario, all f inancial instruments are fully valued and the total change in value and earnings is determined. All VaR calculations are based on a 95% confidence level and a holding period of 20 trading days over the past ten years. This holding period reflects the time required to change the corresponding risk exposure, should this be deemed appropriate. Longer holding periods increase the probability of higher value changes and lead to increased VaR figures.
Actual future gains and losses associated with our treasury activities may differ materially from the VaR analyses performed due to the inherent limitations associated with predicting the timing and amount of changes to interest rates, foreign currency exchanges rates and equity investment prices, particularly in periods of high market volatilities. Furthermore, the VaR numbers below do not include the effect of changes in credit spreads.
Market risk of financial instruments | in millions of CHF
31 December 2010
31 December 2009
VaR – Foreign exchange component 44 43VaR – Interest rate component 466 717VaR – Other price component 34 57Diversification (77) (98)VaR – Total market risk 467 719
At 31 December 2010 the total VaR of the financial assets and liabilities was 467 million Swiss francs (31 December 2009: 719 million Swiss francs). The interest rate VaR decreased to 466 million Swiss francs reflecting the ageing of debt, the repayment of debt during 2010 and a higher duration of fixed income assets held. As all issued debt is held at amortised cost, the interest rate VaR is a sole metric for economic fair value changes, but there is no impact on the carrying value or profit and loss of the Group. The foreign exchange VaR remained stable. Other price risk arises mainly from movements in the prices of equity securities and declined as equity securities holdings were reduced. At 31 December 2010 the Group held equity securities with a market value of 0.5 billion Swiss francs (31 December 2009: 0.6 billion Swiss francs). This includes holdings in biotechnology companies, which were acquired in the context of licensing transactions or scientific collaborations.
Foreign exchange riskThe Group operates across the world and is exposed to movements in foreign currencies affecting the Group financial result and the value of Group’s equity. Foreign exchange risk arises because the amount of local currency paid or received for transactions denominated in foreign currencies may vary due to changes in exchange rates (‘transaction exposures’) and because the foreign currency denominated financial statements of the Group’s foreign subsidiaries may vary upon consolidation into the Swiss franc-denominated Group Financial Statements (‘translation exposures’).
The objective of the Group’s foreign exchange risk management activities is to preserve the economic value of its current and future assets and to minimise the volatility of the Group’s financial result. The primary focus of the Group’s foreign exchange risk management activities is on hedging transaction exposures arising through foreign currency flows or monetary positions held in foreign currencies. The Group does not currently hedge translation exposures using financial instruments.
The Group monitors transaction exposures on a daily basis. The net foreign exchange result and the corresponding VaR parameters are reported on a monthly basis. The Group uses forward contracts, foreign exchange options and cross-currency swaps to hedge transaction exposures. Application of these instruments intends to continuously lock in favourable developments of foreign exchange rates, thereby reducing the exposure to potential future movements in such rates.

128 Roche Finance Report 2010 Roche Group – Notes to the Roche Group Consolidated Financial Statements
Interest rate riskInterest rate risk arises from movements in interest rates which could affect the Group financial result or the value of Group equity. Changes in interest rates may cause variations in interest income and expense. In addition, they may affect the market value of certain financial assets, liabilities and hedging instruments. The primary objective of the Group’s interest rate management is to protect the net interest result.
Interest rate exposures and the corresponding VaR parameters are reported on a monthly basis. The Group uses forward contracts, options and swaps to hedge its interest rate exposures. Depending on the interest rate environment of major currencies, the Group will use these instruments to generate the appropriate mix of fixed and floating rate exposures.
Other price riskOther price risk arises mainly from movements in the prices of equity securities. At 31 December 2010 the Group held equity securities with a market value of 0.5 billion Swiss francs (2009: 0.6 billion Swiss francs). This amount includes holdings in biotechnology companies, which were acquired in the context of licensing transactions or scientific collaborations. Due to the nature of their business, biotechnology companies are exposed to greater equity volatilities than general stock market fluctuations.
The Group manages the price risk through placing limits on individual and total equity investments. These limits are defined both as a percentage of total liquid funds and as an absolute number for individual equity investments. Equity price risk is reported as a VaR figure on a monthly basis to senior management.
Impairment of financial assetsIn 2010 and 2009 impairments of loans and receivables were mainly due to an increase in the expected non-recoverability of trade receivables (see also Note 18).
Impairment losses by asset classes | in millions of CHF
2010 2009
Loans and receivables (182) (138)Available-for-sale financial assets – Shares – –– Investments (19) (18)– Debt securities – (3)Total impairment losses (201) (159)
CapitalThe Group defines the capital that it manages as the Group’s total capitalisation, being the sum of debt plus equity, including non-controlling interests. The Group’s objectives when managing capital are:
• To safeguard the Group’s ability to continue as a going concern, so that it can continue to provide benefits for patients and returns to investors.
• To provide an adequate return to investors based on the level of risk undertaken.
• To have available the necessary financial resources to allow the Group to invest in areas that may deliver future benefits for patients and returns to investors.
• To maintain sufficient financial resources to mitigate against risks and unforeseen events.
The Group completed the purchase of the non-controlling interests in Genentech effective 26 March 2009, as described in Note 3. Based on the revised International Accounting Standard 27 ‘Consolidated and Separate Financial Statements’ (IAS 27), which was adopted by the Group in 2008, this transaction was accounted for in full as an equity transaction. As a consequence, the carrying amount of the consolidated equity of the Group was reduced by 52.2 billion Swiss francs, of which 8.5 billion Swiss francs was allocated to eliminate the book value of Genentech non-controlling interests. This accounting effect significantly impacts the Group’s net equity, but has no effect on the Group’s business or its dividend policy.

129
Capital is monitored on the basis of the capitalisation, which is calculated as being debt plus equity (including non-controlling interests). This is reported to senior management as part of the Group’s regular internal management reporting. The Group’s capitalisation is shown in the table below.
Capital | in millions of CHF
2010 2009 2008
Capital and reserves attributable to Roche shareholders 28 9,469 7,366 44,479Equity attributable to non-controlling interests 30 2,193 2,048 9,343Total equity 11,662 9,414 53,822
Total debt 27 30,058 42,416 4,089
Capitalisation 41,720 51,830 57,911
The Group is not subject to regulatory capital adequacy requirements as known in the financial services industry.
The Group has a majority shareholding in Chugai (see Note 4). Chugai is a public company and its objectives, policies and processes for managing its own capital are determined by local management.
33. Related partiesControlling shareholdersThe share capital of Roche Holding Ltd, which is the Group’s parent company, consists of 160,000,000 bearer shares. Based on information supplied by a shareholder group with pooled voting rights, comprising at 31 December 2010 of Ms Vera Michalski-Hoffmann, Ms Maja Hoffmann, Mr André Hoffmann, Dr Andreas Oeri, Ms Sabine Duschmalé-Oeri, Ms Catherine Oeri, Ms Maja Oeri, Mr Jörg Duschmalé and Mr Lukas Duschmalé, that group holds 80,020,000 shares as in the preceding year, which represents 50.0125% of the issued shares. This figure does not include any shares without pooled voting rights that are held outside this group by individual members of the group.
Mr André Hoffmann and Dr Andreas Oeri are members of the Board of Directors of Roche Holding Ltd. Mr Hoffmann received remuneration totalling 400,000 Swiss francs (2009: 400,000 Swiss francs) and Dr Oeri received remuneration totalling 360,000 Swiss francs (2009: 360,000 Swiss francs).
There were no other transactions between the Group and the individual members of the above shareholder group.
Subsidiaries and associatesA listing of the major Group subsidiaries and associates is included in Note 34. Transactions between the parent company and its subsidiaries and between subsidiaries are eliminated on consolidation. There were no significant transactions between the Group and its associates.
Key management personnelMembers of the Board of Directors of Roche Holding Ltd receive an annual remuneration and payment for their time and expenses related to their membership of Board committees. Total remuneration of the Board of Directors, excluding the Chairman, in 2010 totalled 5 million Swiss francs (2009: 4 million Swiss francs).
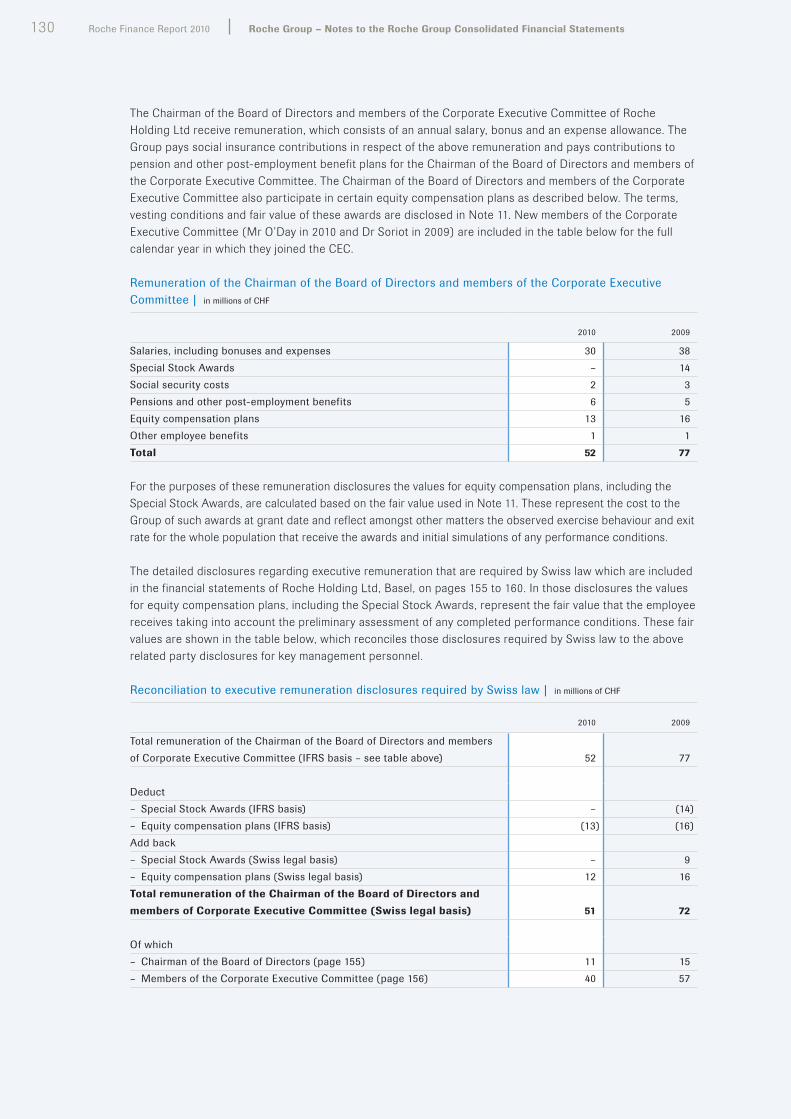
130 Roche Finance Report 2010 Roche Group – Notes to the Roche Group Consolidated Financial Statements
The Chairman of the Board of Directors and members of the Corporate Executive Committee of Roche Holding Ltd receive remuneration, which consists of an annual salary, bonus and an expense allowance. The Group pays social insurance contributions in respect of the above remuneration and pays contributions to pension and other post-employment benefit plans for the Chairman of the Board of Directors and members of the Corporate Executive Committee. The Chairman of the Board of Directors and members of the Corporate Executive Committee also participate in certain equity compensation plans as described below. The terms, vesting conditions and fair value of these awards are disclosed in Note 11. New members of the Corporate Executive Committee (Mr O’Day in 2010 and Dr Soriot in 2009) are included in the table below for the full calendar year in which they joined the CEC.
Remuneration of the Chairman of the Board of Directors and members of the Corporate Executive Committee | in millions of CHF
2010 2009
Salaries, including bonuses and expenses 30 38Special Stock Awards – 14Social security costs 2 3Pensions and other post-employment benefits 6 5Equity compensation plans 13 16Other employee benefits 1 1Total 52 77
For the purposes of these remuneration disclosures the values for equity compensation plans, including the Special Stock Awards, are calculated based on the fair value used in Note 11. These represent the cost to the Group of such awards at grant date and reflect amongst other matters the observed exercise behaviour and exit rate for the whole population that receive the awards and initial simulations of any performance conditions.
The detailed disclosures regarding executive remuneration that are required by Swiss law which are included in the financial statements of Roche Holding Ltd, Basel, on pages 155 to 160. In those disclosures the values for equity compensation plans, including the Special Stock Awards, represent the fair value that the employee receives taking into account the preliminary assessment of any completed performance conditions. These fair values are shown in the table below, which reconciles those disclosures required by Swiss law to the above related party disclosures for key management personnel.
Reconciliation to executive remuneration disclosures required by Swiss law | in millions of CHF
2010 2009
Total remuneration of the Chairman of the Board of Directors and members of Corporate Executive Committee (IFRS basis – see table above) 52 77
Deduct– Special Stock Awards (IFRS basis) – (14)– Equity compensation plans (IFRS basis) (13) (16)Add back– Special Stock Awards (Swiss legal basis) – 9– Equity compensation plans (Swiss legal basis) 12 16Total remuneration of the Chairman of the Board of Directors and members of Corporate Executive Committee (Swiss legal basis) 51 72
Of which– Chairman of the Board of Directors (page 155) 11 15– Members of the Corporate Executive Committee (page 156) 40 57

131
Special Stock Awards | During 2009 the Chairman of the Board of Directors and members of the Corporate Executive Committee were granted 96,750 Special Stock Awards in lieu of part of their cash-settled bonus for the financial year 2009. There were no such awards in 2010.
Roche Long-Term | During 2010 members of the Corporate Executive Committee were granted 10,412,953 Stock-settled Stock Appreciation Rights (S-SARs) and no Roche Option Plan (ROP) or Restricted Stock Unit (RSU) awards (2009: 669,675 S-SARs and no ROP or RSU awards).
Roche Connect | During 2010 contributions paid by the Group with respect to the Chairman of the Board of Directors and members of the Corporate Executive Committee totalled 0.3 million Swiss francs (2009: 0.3 million Swiss francs).
Roche Performance Share Plan | During 2010 members of the Corporate Executive Committee were targeted with 20,568 awards of the 2010–2012 cycle (2009: 21,546 awards from the 2009–2011 cycle). Each award will result in between zero and two non-voting equity securities, depending upon the achievement of the performance targets.
Transactions with former members of the Corporate Executive Committee | Pensions and tax consulting services totalling 2 million Swiss francs were paid by the Group to four former Corporate Executive Committee members (2009: 2 million Swiss francs to two former members).
Post-employment benefit plansTransactions between the Group and the various post-employment defined benefit plans for the employees of the Group are described in Note 10.
34. Subsidiaries and associatesDivestments of subsidiariesEffective 31 August 2009 the Group sold its wholly owned subsidiary Lakeside de México SA de CV (‘Lakeside’) for 17 million Swiss francs in cash.
Gain (loss) on divestment of subsidiaries | in millions of CHF
2010 2009
Consideration – 17
Net assets disposed– Property, plant and equipment 12 – –– Cash – (2)– Other net assets – (3)– Accumulated currency translation adjustments 28 – (1)Gain (loss) on divestment – 11
The total gain (loss) on divestment in 2009 was reported within general and administration expenses as part of the segment result of the Roche Pharmaceuticals operating segment. The net cash inflow from divestments in 2009 was 15 million Swiss francs.

132 Roche Finance Report 2010 Roche Group – Notes to the Roche Group Consolidated Financial Statements
Listed companies
Share capital Equity interestCountry Company City (in millions) (in %)Switzerland Roche Holding Ltd Basel CHF 160.0 Stock Exchange: SIX Swiss Exchange Zurich Valor Share: 1203211 Valor Genussschein: 1203204 ISIN Share: CH0012032113 ISIN Genussschein: CH0012032048 Market Capitalisation: CHF 117,562.7 m Japan Chugai Pharmaceutical Co., Ltd. Tokyo JPY 335.2 61.6 Stock Exchange: Tokyo ISIN: JP3519400000 Market Capitalisation: JPY 810,849.7 m
Non-listed companies
Share capital Equity interestCountry Company City (in millions) (in %)Argentina Productos Roche S.A. Química e Industrial Buenos Aires ARS 83.0 100Australia Roche Diagnostics Australia Pty. Limited Castle Hill AUD 5.0 100 Roche Products Pty. Limited Dee Why AUD 65.0 100Austria Roche Austria GmbH Vienna EUR 14.5 100 Roche Diagnostics GmbH Vienna EUR 1.1 100 Roche Diagnostics Graz GmbH Graz EUR 0.4 100Belgium N.V. Roche S.A. Brussels EUR 32.0 100 Roche Diagnostics Belgium S.A. Brussels EUR 3.8 100Bermuda Chemical Manufacturing and Trading
Company Limited Hamilton USD 9.6 100 Roche Capital Services Ltd. Hamilton RUB (–) 100 Roche Catalyst Investments Ltd. Hamilton USD (–) 100 Roche Financial Investments Ltd. Hamilton USD (–) 100 Roche Financial Management Ltd. Hamilton USD (–) 100 Roche Financial Services Ltd. Hamilton USD 0.1 100 Roche International Ltd. Hamilton USD (–) 100 Roche Intertrade Limited Hamilton USD 10.0 100 Roche Operations Ltd. Hamilton USD 1.0 100 Roche Services Holdings Ltd. Hamilton USD (–) 100 Syntex Pharmaceuticals International Ltd. Hamilton USD (–) 100Bosnia-Herzegovina Roche Ltd. Pharmaceutical Company Sarajevo BAM 0.4 100Brazil Produtos Roche Químicos e Farmacêuticos S.A. São Paulo BRL 41.7 100 Roche Diagnostica Brasil Ltda. São Paulo BRL 401.7 100 Bulgaria Roche Bulgaria EOOD Sofia BGN 5.1 100 Canada Chempharm Limited Toronto CAD (–) 100 Hoffmann-La Roche Limited Toronto CAD 40.3 100 Sapac Corporation Ltd. St. John CAD (–) 100 Chile Roche Chile Limitada Santiago de Chile CLP 70.9 100 China Roche (China) Holding Shanghai USD 30.0 100 Roche Diagnostics (Hong Kong) Limited Hong Kong HKD 10.0 100 Roche Diagnostics (Shanghai) Limited Shanghai USD 1.0 100 Roche Hong Kong Limited Hong Kong HKD 10.0 100 Roche R & D Center (China) Ltd. Shanghai USD 6.3 100 Shanghai Roche Pharmaceuticals Limited Shanghai USD 62.4 70 Colombia Productos Roche S.A. Bogotá COP 26,923.7 100 Costa Rica Roche Servicios S.A. Heredia USD (–) 100 Croatia Roche d.o.o. Zagreb HRK 4.8 100 Czech Republic Roche s.r.o. Prague CZK 200.0 100Denmark Roche a/s Hvidovre DKK 4.0 100 Roche Diagnostics a/s Hvidovre DKK 1.3 100Dominican Republic Productos Roche Dominicana S.A. Santo Domingo DOP 0.6 100Ecuador Roche Ecuador S.A. Quito USD 1.1 100El Salvador Productos Roche (El Salvador) S.A. San Salvador SVC 0.2 100Estonia Roche Eesti OÜ Tallinn EEK 2.0 100Finland Roche Diagnostics Oy Espoo EUR 0.2 100 Roche Oy Espoo EUR (–) 100France Roche Diagnostics France S.A.S. Meylan EUR 16.0 100 Roche S.A.S. Neuilly-sur-Seine EUR 38.2 100 Ventana Medical Systems S.A. Illkirch EUR 0.9 100

133
Germany Galenus Mannheim GmbH Mannheim EUR 1.7 100 NimbleGen Systems GmbH Pleiskirchen EUR (–) 100 Roche Beteiligungs GmbH Grenzach-Wyhlen EUR 3.6 100 Roche Deutschland Holding GmbH Grenzach-Wyhlen DEM 10.0 100 Roche Diagnostics Deutschland GmbH Mannheim EUR 1.0 100 Roche Diagnostics GmbH Mannheim EUR 94.6 100 Roche Innovatis AG Bielefeld EUR 1.2 100 Roche Kulmbach GmbH Kulmbach EUR (–) 100 Roche Pharma AG Grenzach-Wyhlen EUR 61.4 100 Swisslab GmbH Berlin EUR (–) 100Greece Roche (Hellas) S.A. Athens EUR 20.1 100 Roche Diagnostics (Hellas) S.A. Athens EUR 48.7 100Guatemala Productos Roche Guatemala S.A. Guatemala GTQ 0.6 100Honduras Productos Roche (Honduras), S.A. Tegucigalpa HNL (–) 100Hungary Roche (Hungary) Ltd. Budapest HUF 30.0 100 Roche Services (Europe) Ltd. Budapest HUF 3.0 100India Roche Diagnostics (India) Pvt. Ltd. Mumbai INR 99.2 100 Roche Products (India) Pvt. Ltd. Mumbai INR 10.0 100Indonesia P.T. Roche Indonesia Jakarta IDR 1,323.0 98.3Ireland Roche Ireland Limited Clarecastle EUR 1.9 100 Roche Products (Ireland) Limited Dublin EUR (–) 100Israel Medingo Ltd. Yoqneam Illit ILS (–) 100 Roche Pharmaceuticals (Israel) Ltd. Petach Tikva ILS (–) 100Italy Roche Diagnostics S.p.A. Milan EUR 18.1 100 Roche S.p.A. Milan EUR 34.1 100Japan Roche Diagnostics K.K. Tokyo JPY 2,500.0 100Latvia Roche Latvija SIA Riga LVL 0.2 100Lithuania UAB Roche Lietuva Vilnius LIT 0.8 100Malaysia Roche (Malaysia) Sdn Bhd. Kuala Lumpur MYR 4.0 100 Roche Diagnostics (Malaysia) Sdn Bhd. Kuala Lumpur MYR 0.9 100Mexico Productos Roche, S.A. de C.V. Mexico City MXN 82.6 100 Roche Servicios de México, S.A. de C.V. Mexico City MXN 3.5 100Morocco Roche S.A. Casablanca MAD 59.5 100Netherlands Roche Diagnostics Nederland B.V. Almere EUR 2.3 100 Roche Finance Europe B.V. Woerden EUR 2.0 100 Roche Nederland B.V. Woerden EUR 10.9 100 Roche Pharmholding B.V. Woerden EUR 467.8 100New Zealand Roche Diagnostics NZ Limited Auckland NZD 3.0 100 Roche Products (New Zealand) Limited Auckland NZD 13.5 100Nicaragua Productos Roche (Nicaragua) S.A. Managua NIO (–) 100Norway Roche Diagnostics Norge A/S Oslo NOK 5.8 100 Roche Norge A/S Oslo NOK 6.2 100Pakistan Roche Pakistan Limited Karachi PKR 38.3 100Panama Productos Roche (Panamá) S.A. Panama City PAB (–) 100 Productos Roche Interamericana S.A. Panama City USD 0.1 100 Roche Products Inc. Panama City USD 0.5 100 Syntex Puerto Rico Inc. Panama City USD (–) 100 Technical Development Corp. Panama City CHF 0.8 100Peru Productos Roche Química Farmacéutica S.A. Lima PEN 11.1 100Philippines Roche (Philippines) Inc. Makati PHP 300.0 100Poland Roche Diagnostics Polska Sp. z o.o. Warsaw PLN 8.0 100 Roche Polska Sp. z o.o. Warsaw PLN 25.0 100Portugal Roche Farmacêutica Química, Lda. Amadora EUR 1.1 100 Roche Sistemas de Diagnósticos,
Sociedade Unipessoal, Lda. Amadora EUR 2.6 100 Puerto Rico Roche Operations Ltd. Ponce USD (–) 100 Romania Roche Romania S.R.L. Bucharest RON 472.1 100 Russian Federation Limited Liability Company Roche
Diagnostics Rus Moscow RUB 250.0 100 Roche – Moscow Ltd. Moscow RUB 2.6 100 Serbia Roche d.o.o. Beograd Belgrade EUR 1.9 100 Singapore Roche Diagnostics Asia Pacific Pte. Ltd. Singapore SGD 7.4 100 Roche Singapore Pte. Ltd. Singapore SGD 4.0 100 Roche Singapore Technical Operations, Pte. Ltd. Singapore USD 795.0 100 Slovakia Roche Slovensko, S.R.O. Bratislava EUR 0.3 100 Slovenia Roche d.o.o. Pharmaceutical Company Ljubljana EUR 0.2 100 South Africa Roche Products (Proprietary) Limited Johannesburg ZAR 60.0 100 South Korea Roche Diagnostics Korea Co., Ltd. Seoul KRW 22,969.0 100 Roche Korea Company Ltd. Seoul KRW 13,375.0 100
Share capital Equity interestCountry Company City (in millions) (in %)

134 Roche Finance Report 2010 Roche Group – Notes to the Roche Group Consolidated Financial Statements
Spain Andreu Roche S.A. Madrid EUR 0.1 100 Roche Diagnostics S.L. Barcelona EUR 18.0 100 Roche Farma S.A. Madrid EUR 54.1 100 Syntex Roche S.A. Madrid EUR 0.1 100 Sweden Roche AB Stockholm SEK 20.0 100 Roche Diagnostics Scandinavia AB Bromma SEK 9.0 100 Switzerland Disetronic Handels AG Burgdorf CHF 0.1 100 Disetronic Holding AG Burgdorf CHF 9.7 100 F. Hoffmann-La Roche Ltd Basel CHF 150.0 100 Hoffmann-La Roche Ltd. Basel CHF 0.5 100 IMIB Institute for Medical Informatics
and Biostatistics Ltd. Basel CHF 0.1 100 Rabbit-Air Ltd. Bachenbülach CHF 3.0 100 Roche Capital Market Ltd. Basel CHF 1.0 100 Roche Diabetes Care AG Burgdorf CHF 0.9 100 Roche Diagnostics (Switzerland) Ltd. Rotkreuz CHF 1.0 100 Roche Diagnostics AG Rotkreuz CHF 5.0 100 Roche Diagnostics International Ltd. Steinhausen CHF 20.0 100 Roche Finance Ltd. Basel CHF 409.2 100 Roche Glycart AG Schlieren CHF 0.3 100 Roche Long Term Foundation Basel CHF 0.5 100 Roche Pharma (Switzerland) Ltd. Reinach CHF 2.0 100Taiwan Roche Diagnostics Ltd. Taipei TWD 80.0 100 Roche Products Ltd. Taipei TWD 100.0 100Thailand Roche Diagnostics (Thailand) Limited Bangkok THB 103.0 100 Roche Thailand Limited Bangkok THB 12.0 100Turkey Roche Diagnostik Sistemleri Ticaret A.S. Istanbul TRY 50.0 100 Roche Müstahzarlari Sanayi Anonim Sirketi Istanbul TRY 249.5 100Ukraine Roche Ukraine LLC Kiev USD 0.5 100United Kingdom Piramed Limited Berkshire GBP (–) 100 Roche Diagnostics Ltd. Lewes GBP 32.6 100 Roche Holding (UK) Limited Welwyn Garden City GBP 100.0 100 Roche Products Limited Welwyn Garden City GBP 98.3 100 Roche Registration Limited Welwyn Garden City GBP (–) 100United States 454 Life Sciences Corporation Branford USD (–) 100 Alios Biopharma, Inc. South San Francisco USD (–) 22 BioVeris Corporation Gaithersburg USD (–) 100 Genentech, Inc. South San Francisco USD (–) 100 Genentech USA, Inc. South San Francisco USD (–) 100 Hoffmann-La Roche Inc. Nutley USD 3.0 100 Idaho Technology Inc. Salt Lake City USD (–) 22.9 IGEN International, Inc. Wilmington USD (–) 100 Marcadia Biotech, Inc. Wilmington USD (–) 100 Memory Pharmaceuticals Corp. Montvale USD (–) 100 Roche Carolina Inc. Florence USD (–) 100 Roche Colorado Corporation Boulder USD (–) 100 Roche Diagnostics Corporation Indianapolis USD (–) 100 Roche Diagnostics Operations, Inc. Indianapolis USD (–) 100 Roche Holdings, Inc. Wilmington USD 1.0 100 Roche Insulin Delivery Systems Inc. Fishers USD (–) 100 Roche Laboratories Inc. Nutley USD (–) 100 Roche Madison Inc. Madison USD (–) 100 Roche Molecular Systems, Inc. Pleasanton USD (–) 100 Roche NimbleGen, Inc. Madison USD (–) 100 Roche Palo Alto LLC Palo Alto USD (–) 100 Spring Bioscience Corp. Fremont USD (–) 100 Therapeutic Human Polyclonals, Inc. Palo Alto USD (–) 100 Ventana Medical Systems, Inc. Tucson USD (–) 100Uruguay Roche International Ltd. – Montevideo Branch Montevideo UYU (–) 100Venezuela Productos Roche S.A. Caracas VEF 0.2 100
(–) = share capital of less than 100,000 local currency units.
Share capital Equity interestCountry Company City (in millions) (in %)

135 Roche Finance Report 2010Roche Group – Report of Roche Management on Internal Control over Financial Reporting
Report of Roche Management on Internal Control over Financial Reporting
Report of Roche Management on Internal Control over Financial ReportingThe Board of Directors and management of Roche Holding Ltd are responsible for establishing and maintaining adequate control over financial reporting. The internal control system was designed to provide reasonable assurance over the reliability of financial reporting and the preparation and fair presentation of consolidated financial statements in accordance with International Financial Reporting Standards.
All internal control systems, no matter how well designed, have inherent limitations. Therefore, even those systems determined to be effective may not prevent or detect misstatements and can provide only reasonable assurance with respect to financial statement preparation and presentation. Also, projections of any evaluation of effectiveness to future periods are subject to the risk that controls may become inadequate because of changes in conditions or that the degree of compliance with the policies or procedures may deteriorate.
Management assessed the effectiveness of its system of internal control over financial reporting as of 31 December 2010 based on the criteria for effective internal control over financial reporting described in Internal Control – Integrated Framework issued by the Committee of Sponsoring Organizations of the Treadway Commission (COSO). Based on this assessment, management has concluded that the system of internal control over financial reporting was effective as of 31 December 2010.
The Statutory Auditor KPMG AG have audited the consolidated financial statements of Roche Holding Ltd for the year ended 31 December 2010, in accordance with Swiss Auditing Standards and with the International Standards on Auditing (ISA). They have also issued a report on the effectiveness of the Group’s system of internal control over financial reporting. This report is set out on pages 138 to 139.
Franz B. Humer Erich Hunziker Chairman of the Board of Directors Chief Financial Officer and Deputy Head of the Corporate Executive Committee
Basel, 27 January 2011

136 Roche Finance Report 2010 Roche Group – Report of the Statutory Auditor on the Consolidated Financial Statements
Report of the Statutory Auditor on the Consolidated Financial Statements
Report of the Statutory Auditor on the Consolidated Financial Statements to the Annual General Meeting of Roche Holding Ltd, BaselAs statutory auditor, we have audited the accompanying consolidated financial statements of Roche Holding Ltd, which comprise the income statement, statement of comprehensive income, balance sheet, statement of cash flows, statement of changes in equity and notes on pages 34 to 134 for the year ended 31 December 2010.
Board of Directors’ Responsibility | The Board of Directors is responsible for the preparation and fair presentation of the consolidated financial statements in accordance with International Financial Reporting Standards (IFRS) and the requirements of Swiss law. This responsibility includes designing, implementing and maintaining an internal control system relevant to the preparation and fair presentation of consolidated financial statements that are free from material misstatement, whether due to fraud or error. The Board of Directors is further responsible for selecting and applying appropriate accounting policies and making accounting estimates that are reasonable in the circumstances.
Auditor’s Responsibility | Our responsibility is to express an opinion on these consolidated financial statements based on our audit. We conducted our audit in accordance with Swiss law, Swiss Auditing Standards and International Standards on Auditing. Those standards require that we plan and perform the audit to obtain reasonable assurance whether the consolidated financial statements are free from material misstatement.
An audit involves performing procedures to obtain audit evidence about the amounts and disclosures in the consolidated financial statements. The procedures selected depend on the auditor’s judgment, including the assessment of the risks of material misstatement of the consolidated financial statements, whether due to fraud or error. In making those risk assessments, the auditor considers the internal control system relevant to the entity’s preparation and fair presentation of the consolidated financial statements in order to design audit procedures that are appropriate in the circumstances. An audit also includes evaluating the appropriateness of the accounting policies used and the reasonableness of accounting estimates made, as well as evaluating the overall presentation of the consolidated financial statements. We believe that the audit evidence we have obtained is sufficient and appropriate to provide a basis for our audit opinion.
Opinion | In our opinion, the consolidated financial statements for the year ended 31 December 2010 give a true and fair view of the financial position, the results of operations and the cash flows in accordance with International Financial Reporting Standards (IFRS) and comply with Swiss law.

137
Report on Other Legal RequirementsWe confirm that we meet the legal requirements on licensing according to the Auditor Oversight Act (AOA) and independence (article 728 CO and article 11 AOA) and that there are no circumstances incompatible with our independence.
In accordance with article 728a paragraph 1 item 3 CO and Swiss Auditing Standard 890, we confirm that an internal control system exists, which has been designed for the preparation of consolidated financial statements according to the instructions of the Board of Directors.
We recommend that the consolidated financial statements submitted to you be approved.
KPMG AG
John A. Morris François RouillerLicensed Audit Expert Licensed Audit ExpertAuditor in Charge
Basel, 27 January 2011
138 Roche Finance Report 2010 Roche Group – Report of the Independent Auditor on
Internal Control over Financial Reporting
Report of the Independent Auditor on Internal Control over Financial Reporting
Report of the Independent Auditor on Internal Control over Financial Reporting to the Annual General Meeting of Roche Holding Ltd, BaselWe have examined the Roche Group’s system of internal control over financial reporting as of 31 December 2010, based on criteria established in Internal Control – Integrated Framework issued by the Committee of Sponsoring Organizations of the Treadway Commission (COSO).
The Board of Directors and management of Roche Holding Ltd are responsible for maintaining effective internal control over financial reporting and for its assessment of the effectiveness of internal control over financial reporting as included in the accompanying Report of Roche Management on Internal Control over Financial Reporting. Our responsibility is to express an opinion on the company’s internal control over financial reporting based on our examination. An entity’s internal control over financial reporting is a process effected by the entity’s Board of Directors, management, and other personnel, designed to provide reasonable assurance regarding the reliability of financial statements prepared in accordance with International Financial Reporting Standards (IFRS) and includes those policies and procedures that (1) pertain to the maintenance of records that, in reasonable detail, accurately and fairly reflect the transactions and dispositions of the assets of the entity; (2) provide reasonable assurance that transactions are recorded as necessary to permit the preparation of financial statements in accordance with the applicable financial reporting framework; and (3) provide reasonable assurance regarding the prevention or timely detection of the unauthorised acquisition, use, or disposition of the entity’s assets that could have a material effect on the entity’s financial statements.
We conducted our examination in accordance with the International Standard on Assurance Engagements 3000 (ISAE 3000). This standard requires that we plan and perform our examination to obtain reasonable assurance about whether effective internal control over financial reporting was maintained in all material respects. Our examination included obtaining an understanding of internal control over financial reporting, testing and evaluating the design and operating effectiveness of internal control, and performing such other procedures as we considered necessary in the circumstances. We believe that our examination provides a reasonable basis for our opinion.
Because of the inherent limitations of internal control over financial reporting, including the possibility of management override of controls, misstatements due to error or fraud may occur and not be detected. Also, projections of any evaluation of internal control over financial reporting to future periods are subject to the risk that internal control may become inadequate because of changes in conditions or because the degree of compliance with the policies or procedures may deteriorate.

139
In our opinion, the Roche Group maintained, in all material respects, effective internal control, over financial reporting as of 31 December 2010 based on criteria established in Internal Control – Integrated Framework issued by the Committee of Sponsoring Organizations of the Treadway Commission (COSO).
We also have audited, in accordance with Swiss Auditing Standards and International Standards on Auditing, the consolidated financial statements of Roche Holding Ltd for the year ended 31 December 2010 and our report dated 27 January 2011 expressed an unqualified opinion on those consolidated financial statements.
KPMG AG
John A. Morris François Rouiller
Basel, 27 January 2011

140 Roche Finance Report 2010 Roche Group – Multi-Year Overview and Supplementary Information
Multi-Year Overview and Supplementary Information
Multi-year overviewStatistics, as reported
2001 2002 2003 2004 2005 2006 2007 2008 2009 2010
Statement of income | in millions of CHF
Sales 29,163 29,453 31,220 31,273 35,511 42,041 46,133 45,617 49,051 47,473EBITDA 6,438 7,993 8,609 9,566 11,404 14,436 17,068 16,637 18,028 17,658Operating profit 3,247 1,335 5,592 8,979 8,669 11,730 14,468 13,924 12,277 13,486Net income attributable to Roche shareholders 3,697 (4,026) 3,069 6,641 5,787 7,880 9,761 8,969 7,784 8,666Research and development 3,893 4,257 4,766 5,093 5,705 6,589 8,385 8,845 9,874 10,026
Balance sheet | in millions of CHF
Non-current assets 36,411 33,143 29,820 28,670 33,739 33,519 35,349 37,485 36,086 33,408Current assets 38,875 30,852 29,666 29,406 35,626 40,895 42,834 38,604 38,479 27,612Total assets 75,286 63,995 59,486 58,076 69,365 74,414 78,183 76,089 74,565 61,020Non-current liabilities (25,772) (22,850) (18,658) (14,882) (18,130) (14,908) (10,422) (10,163) (43,084) (34,380)Current liabilities (15,647) (15,372) (11,664) (9,901) (9,492) (12,692) (14,454) (12,104) (22,067) (14,978)Total liabilities (41,419) (38,222) (30,322) (24,783) (27,622) (27,600) (24,876) (22,267) (65,151) (49,358)Net assets 33,867 25,773 29,164 33,293 41,743 46,814 53,307 53,822 9,414 11,662Capital and reserves attributable to Roche shareholders 28,973 20,810 23,570 28,223 34,922 39,444 45,347 44,479 7,366 9,469Equity attributable to non-controlling interests 4,894 4,963 5,594 5,070 6,821 7,370 7,960 9,343 2,048 2,193Additions to property, plant and equipment 1,931 2,044 2,265 2,357 3,428 3,878 3,648 3,187 2,837 2,633
PersonnelNumber of employees at end of year 63,717 69,659 65,357 64,703 68,218 74,372 78,604 80,080 81,507 80,653
Key ratiosNet income attributable to Roche shareholders as % of sales 13 –14 10 21 16 19 21 20 16 18Net income as % of equity, attributable to Roche shareholders 13 –19 13 24 17 20 22 20 106 92Research and development as % of sales 13 14 15 16 16 16 18 19 20 21Current ratio % 248 201 254 297 375 322 296 319 174 184Equity and non-controlling interests as % of total assets 45 40 49 57 60 63 68 71 13 19Sales per employee in thousands of CHF 458 427 482 483 521 565 587 570 602 589
Data on shares and non-voting equity securitiesNumber of shares 160,000,000 160,000,000 160,000,000 160,000,000 160,000,000 160,000,000 160,000,000 160,000,000 160,000,000 160,000,000Number of non-voting equity securities (Genussscheine) 702,562,700 702,562,700 702,562,700 702,562,700 702,562,700 702,562,700 702,562,700 702,562,700 702,562,700 702,562,700Total shares and non-voting equity securities 862,562,700 862,562,700 862,562,700 862,562,700 862,562,700 862,562,700 862,562,700 862,562,700 862,562,700 862,562,700Total dividend in millions of CHF 1,121 1,251 1,423 1,725 2,156 2,933 3,968 4,313 5,175 5,693a)
Earnings per share and non-voting equity security (diluted) in CHF 4.37 (4.80) 3.61 7.81 6.71 9.05 11.16 10.23 9.02 10.11Dividend per share and non-voting equity security in CHF 1.30 1.45 1.65 2.00 2.50 3.40 4.60 5.00 6.00 6.60a)
Information in this table is stated as reported. Changes in accounting policies arising from changes in International Financial Reporting Standards are not applied retrospectively.
a) Dividend 2010 as proposed by the Board of Directors.
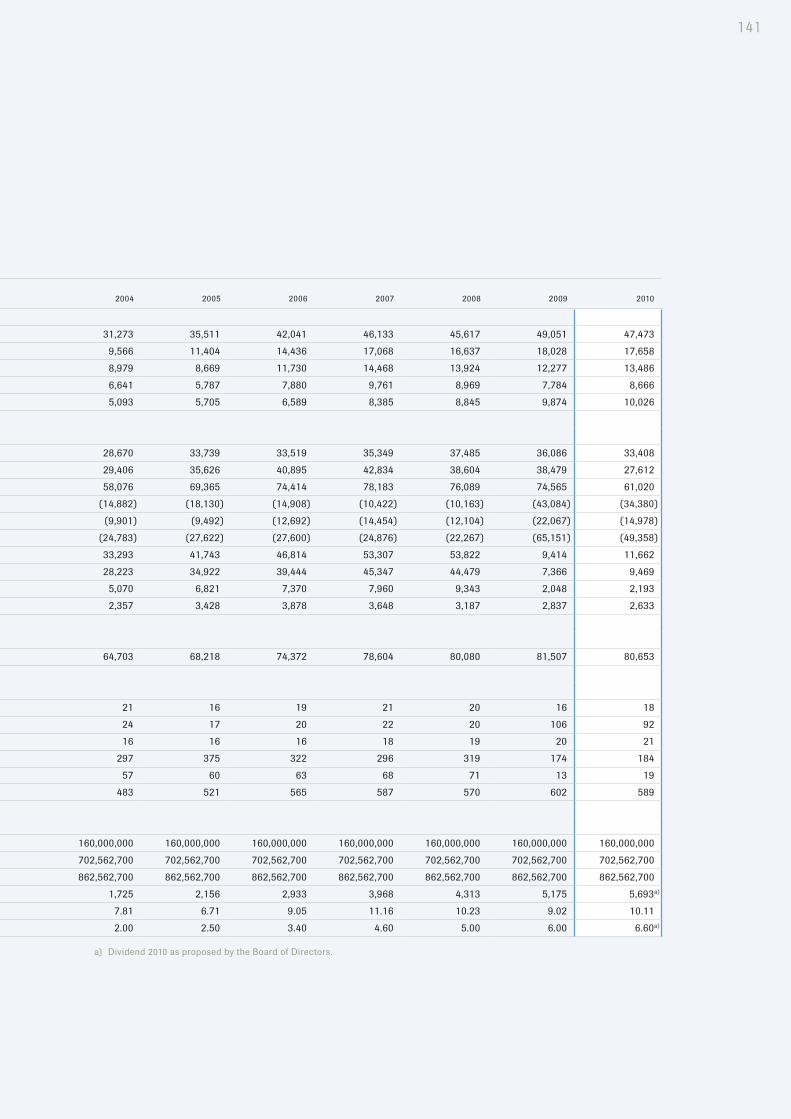
141
Statistics, as reported
2001 2002 2003 2004 2005 2006 2007 2008 2009 2010
Statement of income | in millions of CHF
Sales 29,163 29,453 31,220 31,273 35,511 42,041 46,133 45,617 49,051 47,473EBITDA 6,438 7,993 8,609 9,566 11,404 14,436 17,068 16,637 18,028 17,658Operating profit 3,247 1,335 5,592 8,979 8,669 11,730 14,468 13,924 12,277 13,486Net income attributable to Roche shareholders 3,697 (4,026) 3,069 6,641 5,787 7,880 9,761 8,969 7,784 8,666Research and development 3,893 4,257 4,766 5,093 5,705 6,589 8,385 8,845 9,874 10,026
Balance sheet | in millions of CHF
Non-current assets 36,411 33,143 29,820 28,670 33,739 33,519 35,349 37,485 36,086 33,408Current assets 38,875 30,852 29,666 29,406 35,626 40,895 42,834 38,604 38,479 27,612Total assets 75,286 63,995 59,486 58,076 69,365 74,414 78,183 76,089 74,565 61,020Non-current liabilities (25,772) (22,850) (18,658) (14,882) (18,130) (14,908) (10,422) (10,163) (43,084) (34,380)Current liabilities (15,647) (15,372) (11,664) (9,901) (9,492) (12,692) (14,454) (12,104) (22,067) (14,978)Total liabilities (41,419) (38,222) (30,322) (24,783) (27,622) (27,600) (24,876) (22,267) (65,151) (49,358)Net assets 33,867 25,773 29,164 33,293 41,743 46,814 53,307 53,822 9,414 11,662Capital and reserves attributable to Roche shareholders 28,973 20,810 23,570 28,223 34,922 39,444 45,347 44,479 7,366 9,469Equity attributable to non-controlling interests 4,894 4,963 5,594 5,070 6,821 7,370 7,960 9,343 2,048 2,193Additions to property, plant and equipment 1,931 2,044 2,265 2,357 3,428 3,878 3,648 3,187 2,837 2,633
PersonnelNumber of employees at end of year 63,717 69,659 65,357 64,703 68,218 74,372 78,604 80,080 81,507 80,653
Key ratiosNet income attributable to Roche shareholders as % of sales 13 –14 10 21 16 19 21 20 16 18Net income as % of equity, attributable to Roche shareholders 13 –19 13 24 17 20 22 20 106 92Research and development as % of sales 13 14 15 16 16 16 18 19 20 21Current ratio % 248 201 254 297 375 322 296 319 174 184Equity and non-controlling interests as % of total assets 45 40 49 57 60 63 68 71 13 19Sales per employee in thousands of CHF 458 427 482 483 521 565 587 570 602 589
Data on shares and non-voting equity securitiesNumber of shares 160,000,000 160,000,000 160,000,000 160,000,000 160,000,000 160,000,000 160,000,000 160,000,000 160,000,000 160,000,000Number of non-voting equity securities (Genussscheine) 702,562,700 702,562,700 702,562,700 702,562,700 702,562,700 702,562,700 702,562,700 702,562,700 702,562,700 702,562,700Total shares and non-voting equity securities 862,562,700 862,562,700 862,562,700 862,562,700 862,562,700 862,562,700 862,562,700 862,562,700 862,562,700 862,562,700Total dividend in millions of CHF 1,121 1,251 1,423 1,725 2,156 2,933 3,968 4,313 5,175 5,693a)
Earnings per share and non-voting equity security (diluted) in CHF 4.37 (4.80) 3.61 7.81 6.71 9.05 11.16 10.23 9.02 10.11Dividend per share and non-voting equity security in CHF 1.30 1.45 1.65 2.00 2.50 3.40 4.60 5.00 6.00 6.60a)
Information in this table is stated as reported. Changes in accounting policies arising from changes in International Financial Reporting Standards are not applied retrospectively.
a) Dividend 2010 as proposed by the Board of Directors.

142 Roche Finance Report 2010 Roche Group – Multi-Year Overview and Supplementary Information
Sales by division | in millions of CHF
2006 2007 2008 2009 2010
Pharmaceuticals 33,294 36,783 35,961 38,996 37,058Diagnostics 8,747 9,350 9,656 10,055 10,415Total 42,041 46,133 45,617 49,051 47,473
Sales by geographical area | in millions of CHF
2006 2007 2008 2009 2010
Switzerland 471 489 509 499 464European Union 13,823 15,465 15,601 16,219 14,596– of which Germany 2,993 3,277 3,200 3,320 2,970Rest of Europe 1,307 1,620 1,521 1,568 1,630Europe 15,601 17,574 17,631 18,286 16,690
United States 15,685 17,069 16,362 17,208 16,446Rest of North America 985 1,004 932 948 1,051North America 16,670 18,073 17,294 18,156 17,497
Latin America 2,539 2,784 2,975 2,940 3,397
Japan 3,713 3,562 3,532 5,036 4,718Rest of Asia 2,384 2,681 2,920 3,166 3,591Asia 6,097 6,243 6,452 8,202 8,309
Africa, Australia and Oceania 1,134 1,459 1,265 1,467 1,580Total 42,041 46,133 45,617 49,051 47,473

143
Additions to property, plant and equipment by division | in millions of CHF
2006 2007 2008 2009 2010
Pharmaceuticals 3,030 2,588 1,940 1,644 1,464Diagnostics 846 1,058 1,245 1,191 1,150Corporate 2 2 2 2 49Total 3,878 3,648 3,187 2,837 2,663
Additions to property, plant and equipment by geographical area | in millions of CHF
2006 2007 2008 2009 2010
Switzerland 350 418 421 315 413European Union 995 993 960 972 890– of which Germany 661 660 591 646 577Rest of Europe 15 30 17 20 21Europe 1,360 1,441 1,398 1,307 1,324
United States 2,061 1,679 1,212 866 658Rest of North America 47 34 21 13 24North America 2,108 1,713 1,233 879 682
Latin America 101 133 127 115 127
Japan 201 230 292 230 242Rest of Asia 69 103 116 285 254Asia 270 333 408 515 496
Africa, Australia and Oceania 39 28 21 21 34Total 3,878 3,648 3,187 2,837 2,663
European Union information is based on members of the EU as at 31 December 2010. The comparative information has been restated to include new EU members for the whole five-year period.

144 Roche Finance Report 2010 Roche Group – Multi-Year Overview and Supplementary Information
Core results and EPS InformationThe Group’s basic and diluted earnings per share information is given in Note 29 to the Consolidated Financial Statements on pages 117 to 118. The Group has expanded the presentation of its core results for 2010. Previously only core EPS was shown, but now the full income statement for the Group and the operating results of the divisions are shown on both an IFRS and core basis. This allows a transparent assessment of both the actual results and the underlying performance of the business.
The core results concept, which is used in the internal management of the business, is based on the IFRS results, with the following adjustments:
• Global restructuring costs (see Note 8) are excluded.
• Amortisation and impairment of intangible assets (see Note 14) are excluded.
• Acquisition accounting and other one-time impacts from Alliance arrangements and Business Combinations (see Financial Review) are excluded.
• Discontinued operations (currently none) would be excluded.
• Legal and environment expenses (see Financial Review) are excluded.
• The tax benefit recorded under IFRS in respect of Equity Compensation Plans (ECPs), which varies according to price of the underlying equity, is replaced by a normalised tax benefit, being the IFRS 2 expense multiplied by the applicable tax rate (see Note 6).
• Material one-time treasury items such as major debt restructurings or settlement of pension plans (both currently none) would be excluded.
• Global issues outside healthcare sector beyond the Group’s control (currently none) would be excluded.
The core results concept was further described on 22 October 2010 at an Investor Update teleconference, which is available for download at: http://www.roche.com/investors/ir_agenda/csr_151010.htm
The Group’s IFRS results, including the divisional breakdown, are reconciled to the core results in the tables below. The calculation of core EPS is also given in the tables below. To avoid double-counting, amounts shown for ‘Global Restructuring’ below exclude items in 2010 from the Operational Excellence programme that are included in the other adjustment columns: these are impairment of intangible assets totalling 424 million Swiss francs (see Note 8). Additional commentary to the adjustment items is given in the Financial Review.

145
Core results reconciliation – 2010 | in millions of CHF
IFRS
Global restruc-
turing
Intangibles amorti-
sationIntangibles impairment
Alliances & Business
combi-nations
Legal & environ-
mental
Normali-sation of ECP tax benefit Core
Sales 47,473 – – – – – – 47,473Royalties and other operating income 1,694 – – – – – – 1,694Cost of sales (13,293) 157 592 33 – – – (12,511)Marketing and distribution (9,488) 317 4 – – – – (9,167)Research and development (10,026) 319 23 634 – – – (9,050)General and administration (2,874) 722 – – 5 299 – (1,848)Operating profit 13,486 1,515 619 667 5 299 – 16,591
Associates (3) – – – – – – (3)Financial income 557 – – – – – – 557Financing costs (2,829) – – – – – – (2,829)Profit before taxes 11,211 1,515 619 667 5 299 – 14,316
Income taxes (2,320) (398) (207) (185) (1) (107) 83 (3,135)Net income 8,891 1,117 412 482 4 192 83 11,181
Attributable to – Roche shareholders 8,666 1,117 412 482 4 191 83 10,955– Non-controlling interests 225 – – – – 1 – 226
Core results reconciliation – 2009 | in millions of CHF
IFRS
Global restruc-
turing
Intangibles amorti-
sationIntangibles impairment
Alliances & Business
combi-nations
Legal & environ-
mental
Normali-sation of ECP tax benefit Core
Sales 49,051 – – – – – – 49,051Royalties and other operating income 2,100 – – – – – – 2,100Cost of sales (14,615) – 669 57 – – – (13,889)Marketing and distribution (9,475) – 3 – – – – (9,472)Research and development (9,874) – 40 325 – – – (9,509)General and administration (4,910) 2,415 – – 31 455 – (2,009)Operating profit 12,277 2,415 712 382 31 455 – 16,272
Associates – – – – – – – –Financial income 554 238 – – – – – 792Financing costs (2,599) 139 – – – – – (2,460)Profit before taxes 10,232 2,792 712 382 31 455 – 14,604
Income taxes (1,722) (1,025) (246) (127) (9) (171) 13 (3,287)Net income 8,510 1,767 466 255 22 284 13 11,317
Attributable to – Roche shareholders 7,784 1,817 453 255 22 284 21 10,636– Non-controlling interests 726 (50) 13 – – – (8) 681

146 Roche Finance Report 2010 Roche Group – Multi-Year Overview and Supplementary Information
Divisional core results reconciliation – 2010 | in millions of CHF
IFRS
Global restruc-
turing
Intangibles amorti-
sationIntangibles impairment
Alliances & Business
combi-nations
Legal & environ-
mental Core
PharmaceuticalsSales 37,058 – – – – – 37,058Royalties and other operating income 1,537 – – – – – 1,537Cost of sales (8,169) 66 156 – – – (7,947)Marketing and distribution (6,964) 312 – – – – (6,652)Research and development (9,090) 277 19 634 – – (8,160)General and administration (2,071) 709 – – 1 301 (1,060)Operating profit 12,301 1,364 175 634 1 301 14,776
DiagnosticsSales 10,415 – – – – – 10,415Royalties and other operating income 157 – – – – – 157Cost of sales (5,124) 91 436 33 – – (4,564)Marketing and distribution (2,524) 5 4 – – – (2,515)Research and development (936) 42 4 – – – (890)General and administration (409) 6 – – 4 (2) (401)Operating profit 1,579 144 444 33 4 (2) 2,202
CorporateGeneral and administration (394) 7 – – – – (387)Operating profit (394) 7 – – – – (387)
Divisional core results reconciliation – 2009 | in millions of CHF
IFRS
Global restruc-
turing
Intangibles amorti-
sationIntangibles impairment
Alliances & Business
combi-nations
Legal & environ-
mental Core
PharmaceuticalsSales 38,996 – – – – – 38,996Royalties and other operating income 1,948 – – – – – 1,948Cost of sales (9,535) – 221 – – – (9,314)Marketing and distribution (6,964) – – – – – (6,964)Research and development (8,896) – 32 302 – – (8,562)General and administration (4,130) 2,415 – – 31 416 (1,268)Operating profit 11,419 2,415 253 302 31 416 14,836
DiagnosticsSales 10,055 – – – – – 10,055Royalties and other operating income 152 – – – – – 152Cost of sales (5,080) – 448 57 – – (4,575)Marketing and distribution (2,511) – 3 – – – (2,508)Research and development (978) – 8 23 – – (947)General and administration (440) – – – – 5 (435)Operating profit 1,198 – 459 80 – 5 1,742
CorporateGeneral and administration (340) – – – – 34 (306)Operating profit (340) – – – – 34 (306)

147
Core EPS
2010 2009
Core net income (CHF millions)Core net income attributable to Roche shareholders 10,955 10,636Increase in non-controlling interests’ share of core net income, assuming all outstanding Genentech and Chugai stock options exercised (1) (36)Net income used to calculate diluted earnings per share 10,954 10,600
Per share information (millions of shares and non-voting equity securities)Weighted average number of shares and non-voting equity securities in issue 855 858Adjustment for assumed exercise of equity compensation plans, where dilutive 2 1Weighted average number of shares and non-voting equity securities in issue used to calculate diluted earnings per share 857 859
Core earnings per share (diluted) (CHF) 12.78 12.34

148 Roche Finance Report 2010 Roche Group – Multi-Year Overview and Supplementary Information
Supplementary Operating Free Cash Flow InformationDivisional operating free cash flow information | in millions of CHF
Pharmaceuticals Diagnostics Corporate Group2010 2009 2010 2009 2010 2009 2010 2009
Depreciation, amortisation and impairmentDepreciation of property, plant and equipment 1,151 1,255 775 721 7 5 1,933 1,981Amortisation of intangible assets 175 253 444 459 – – 619 712Impairment of property, plant and equipment 109 1,118 29 9 – – 138 1,127Impairment of intangible assets 634 588 33 80 – – 667 668Total 2,069 3,214 1,281 1,269 7 5 3,357 4,488
Other adjustmentsAdd back– Expenses for
equity-settled equity compensation plans 248 516 41 42 13 28 302 586
– Net (income) expense for provisions 1,307 1,331 311 206 7 35 1,625 1,572
– Net gain (loss) from disposals (51) (161) 7 10 – – (44) (151)
– Non-cash working capital and other items 323 173 48 16 (9) 1 362 190
Deduct– Net cash flow from equity
compensation plans (56) 71 (13) (13) (7) (3) (76) 55– Utilisation of provisions (579) (550) (144) (144) (6) (15) (729) (709)– Proceeds from disposals 35 257 98 28 9 – 142 285Total 1,227 1,637 348 145 7 46 1,582 1,828
Operating profit cash adjustments 3,296 4,851 1,629 1,414 14 51 4,939 6,316
EBITDACore operating profit 14,776 14,836 2,202 1,742 (387) (306) 16,591 16,272Depreciation and impairment of property, plant and equipment – Core basis 1,142 1,187 777 730 7 5 1,926 1,922EBITDA 15,918 16,023 2,979 2,472 (380) (301) 18,517 18,194
– margin, % of sales 43.0 41.1 28.6 24.6 – – 39.0 37.1

149 Roche Finance Report 2010Roche Group – Roche Securities
250
200
150
100
50
300
Roche share Swiss Market Index (rebased)
Price development of share | in CHF
2006 2007 2008 2009 2010
150
100
50
200
250
Roche non-voting equity security Swiss Market Index (rebased)
Price development of non-voting equity security (Genussschein) | in CHF
2006 2007 2008 2009 2010
60
40
20
80
100
Roche ADR S&P 500 Index (rebased)
Price development of American Depositary Receipt (ADR) | in USD
2006 2007 2008 2009 2010
Four Roche American Depositary Receipts (ADRs) are equivalent to one non-voting equity security (Genussschein). ADRs have been traded in the United States over-the-counter market since July 1992.
Information in these tables is restated for the change in the ratio for the ADRs from 1:1 to 2:1 effective 24 January 2005 and the change in the ratio for the ADRs from 2:1 to 4:1 effective 9 January 2009.
Roche Securities

150 Roche Finance Report 2010 Roche Group – Roche Securities
Number of shares and non-voting equity securities a)
2006 2007 2008 2009 2010
Number of shares (nominal value: CHF 1.00) 160,000,000 160,000,000 160,000,000 160,000,000 160,000,000Number of non-voting equity securities (Genussscheine) (no nominal value) 702,562,700 702,562,700 702,562,700 702,562,700 702,562,700Total 862,562,700 862,562,700 862,562,700 862,562,700 862,562,700
Number of own non-voting equity securities (Genussscheine) held (year-end) (7,023,214) (2,255,365) (2,958,402) (6,682,120) (11,214,765)Total in issue 855,539,486 860,307,335 859,604,298 855,880,580 851,347,935
Data per share and non-voting equity security | in CHF
2006 2007 2008 2009 2010
Earnings (diluted) 9.05 11.16 10.23 9.02 10.11Equity attributable to Roche shareholders 46.10 52.87 51.74 8.61 11.12Dividend 3.40 4.60 5.00 6.00 6.60c)
Stock price of share b) Opening 219.20 247.50 213.00 168.70 181.00High 252.50 266.25 229.50 182.10 191.70Low 198.00 209.70 155.20 130.30 134.30Year-end 247.50 213.00 168.70 181.00 142.80
Stock price of non-voting equity security (Genussschein) b) Opening 197.30 218.50 195.60 162.50 175.80
High 227.00 240.10 208.60 179.00 186.00Low 185.80 190.30 148.20 124.10 130.20Year-end 218.50 195.60 162.50 175.80 137.00
Market capitalisation | in millions of CHF
2006 2007 2008 2009 2010
Year-end 191,575 171,060 140,678 151,296 117,563
Key ratios (year-end)
2006 2007 2008 2009 2010
Dividend yield of shares in % 1.4 2.2 3.0 3.3 4.6Dividend yield of non-voting equity securities (Genussscheine) in % 1.6 2.4 3.1 3.4 4.8Price/earnings of shares 27 19 16 20 14Price/earnings of non-voting equity securities (Genussscheine) 24 18 16 19 14
a) Each non-voting equity security (Genussschein) confers the same rights as any of the shares to participate in the available earnings and any remaining proceeds from liquidation following repayment of the nominal value of the shares and the participation certificate capital (if any). Shares and non-voting equity securities are listed on the SIX Swiss Exchange. Roche Holding Ltd has no restrictions as to ownership of its shares or non-voting equity securities.
b) All stock price data reflect daily closing prices.c) Dividend 2010 as proposed by the Board of Directors.
Ticker symbols
Share Non-voting equity security American Depositary Receipt (ADR)
SIX Swiss Exchange RO ROG –Bloomberg RO SW ROG VX RHHBY USReuters RO.S ROG.VX RHHBY.PK
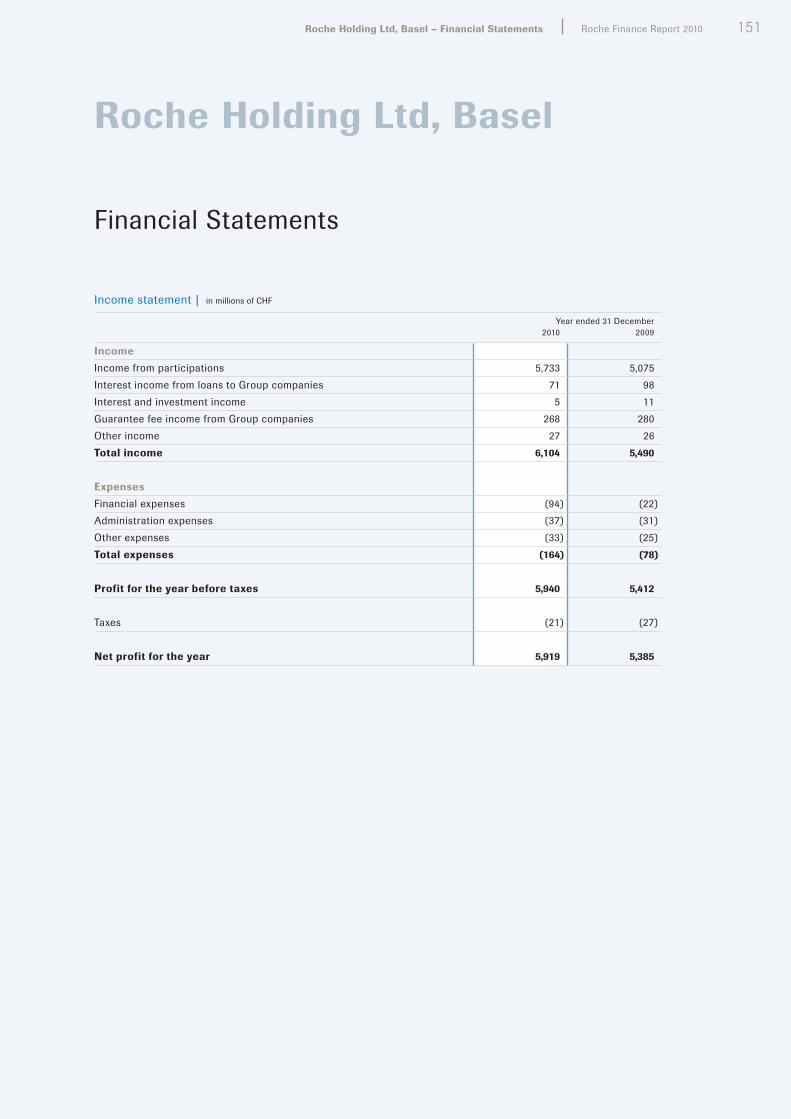
151 Roche Finance Report 2010Roche Holding Ltd, Basel – Financial Statements
Roche Holding Ltd, Basel
Financial Statements
Income statement | in millions of CHF
Year ended 31 December2010 2009
IncomeIncome from participations 5,733 5,075Interest income from loans to Group companies 71 98Interest and investment income 5 11Guarantee fee income from Group companies 268 280Other income 27 26Total income 6,104 5,490
ExpensesFinancial expenses (94) (22)Administration expenses (37) (31)Other expenses (33) (25)Total expenses (164) (78)
Profit for the year before taxes 5,940 5,412
Taxes (21) (27)
Net profit for the year 5,919 5,385

152 Roche Finance Report 2010 Roche Holding Ltd, Basel – Financial Statements
Balance sheet | in millions of CHF
31 December 2010 31 December 2009
Non-current assetsParticipations 7,470 4,683Long-term loans 2 2Long-term loans to Group companies 574 665Total non-current assets 8,046 5,350
Current assetsShort-term loans to Group companies 1,000 2,000Accounts receivable from Group companies 668 3,367Other accounts receivable 1 1Marketable securities 3,794 2,069Liquid funds – –Total current assets 5,463 7,437
Total assets 13,509 12,787
EquityShare capital 160 160Non-voting equity securities (Genussscheine) p.m. p.m.General legal reserve 300 300Free reserve 4,706 4,706Special reserve 2,152 2,152Available earnings:– Balance brought forward from previous year 211 1– Net profit for the year 5,919 5,385Total equity 13,448 12,704
Non-current liabilitiesProvisions 35 35Total non-current liabilities 35 35
Current liabilitiesAccounts payable to Group companies – 15Other liabilities 26 33Total current liabilities 26 48
Total liabilities 61 83
Total equity and liabilities 13,509 12,787
p.m. = pro memoria. Non-voting equity securities have no nominal value.
153 Roche Finance Report 2010Roche Holding Ltd, Basel – Notes to the Financial Statements
Notes to the Financial Statements
1. Summary of significant accounting policiesBasis of preparation of the financial statementsThe financial statements of Roche Holding Ltd, Basel, are prepared in accordance with the provisions of Swiss law.
ParticipationsThe major participations of the company are listed in Note 34 to the Roche Group Consolidated Financial Statements.
Valuation methods and translation of foreign currenciesMarketable securities are reported at the lower of cost or market value. All other assets, including participations, are reported at cost less appropriate write-downs. Assets and liabilities denominated in foreign currencies are translated into Swiss francs using year-end rates of exchange, except participations which are translated at historical rates. Transactions during the year which are denominated in foreign currencies are translated at the exchange rates effective at the relevant transaction dates. Resulting exchange gains and losses are recognised in the income statement with the exception of unrealised gains which are deferred.
TaxesThe tax charge includes corporate income and capital taxes.
2. EquityShare capitalAs in the previous year, share capital amounts to 160 million Swiss francs. The share capital consists of 160,000,000 bearer shares with a nominal value of 1 Swiss franc each. Included in equity are 702,562,700 non-voting equity securities (Genussscheine). They are not part of the share capital and confer no voting rights. However each non-voting equity security (Genussschein) confers the same rights as any of the shares to participate in the available earnings and in any remaining proceeds from liquidation following repayment of the nominal value of the share capital and, if any, participation certificates.
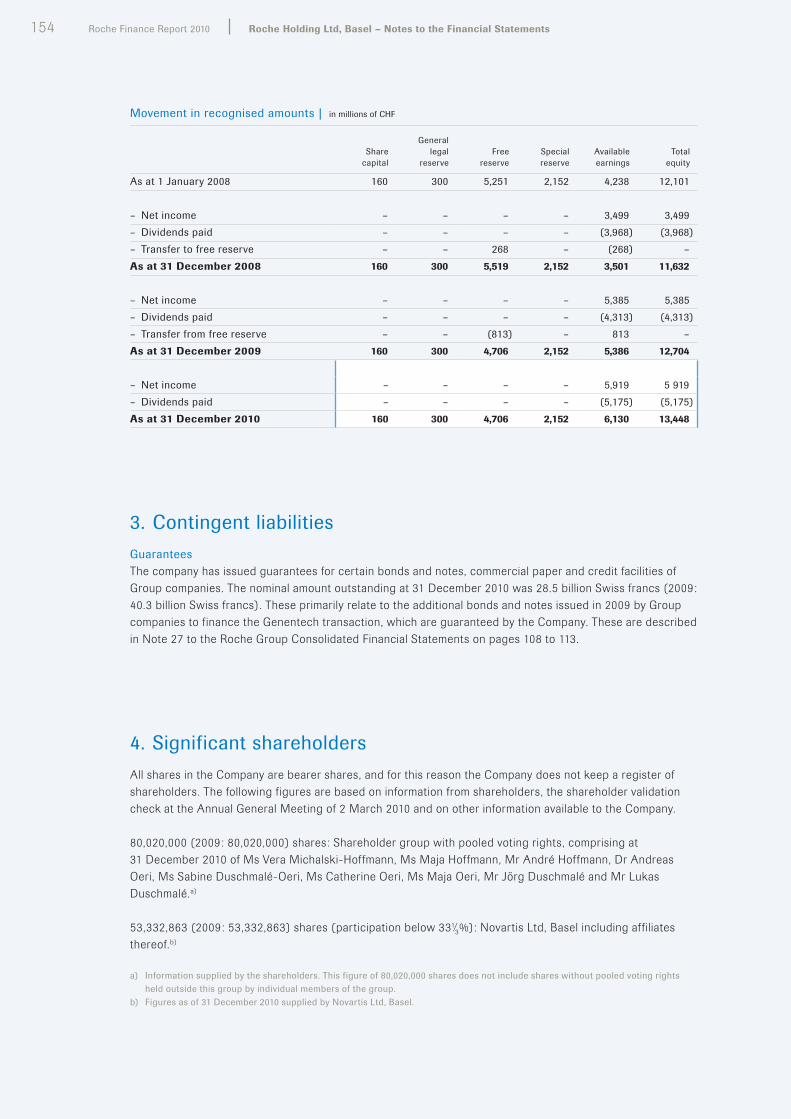
154 Roche Finance Report 2010 Roche Holding Ltd, Basel – Notes to the Financial Statements
Movement in recognised amounts | in millions of CHF
Share capital
General legal
reserveFree
reserveSpecial reserve
Available earnings
Total equity
As at 1 January 2008 160 300 5,251 2,152 4,238 12,101
– Net income – – – – 3,499 3,499– Dividends paid – – – – (3,968) (3,968)– Transfer to free reserve – – 268 – (268) –As at 31 December 2008 160 300 5,519 2,152 3,501 11,632
– Net income – – – – 5,385 5,385– Dividends paid – – – – (4,313) (4,313)– Transfer from free reserve – – (813) – 813 –As at 31 December 2009 160 300 4,706 2,152 5,386 12,704
– Net income – – – – 5,919 5 919– Dividends paid – – – – (5,175) (5,175)As at 31 December 2010 160 300 4,706 2,152 6,130 13,448
3. Contingent liabilitiesGuaranteesThe company has issued guarantees for certain bonds and notes, commercial paper and credit facilities of Group companies. The nominal amount outstanding at 31 December 2010 was 28.5 billion Swiss francs (2009: 40.3 billion Swiss francs). These primarily relate to the additional bonds and notes issued in 2009 by Group companies to finance the Genentech transaction, which are guaranteed by the Company. These are described in Note 27 to the Roche Group Consolidated Financial Statements on pages 108 to 113.
4. Significant shareholdersAll shares in the Company are bearer shares, and for this reason the Company does not keep a register of shareholders. The following figures are based on information from shareholders, the shareholder validation check at the Annual General Meeting of 2 March 2010 and on other information available to the Company.
80,020,000 (2009: 80,020,000) shares: Shareholder group with pooled voting rights, comprising at 31 December 2010 of Ms Vera Michalski-Hoffmann, Ms Maja Hoffmann, Mr André Hoffmann, Dr Andreas Oeri, Ms Sabine Duschmalé-Oeri, Ms Catherine Oeri, Ms Maja Oeri, Mr Jörg Duschmalé and Mr Lukas Duschmalé.a)
53,332,863 (2009: 53,332,863) shares (participation below 331⁄3%): Novartis Ltd, Basel including affiliates thereof.b)
a) Information supplied by the shareholders. This figure of 80,020,000 shares does not include shares without pooled voting rights held outside this group by individual members of the group.
b) Figures as of 31 December 2010 supplied by Novartis Ltd, Basel.

155
5. Risk managementThe detailed disclosures regarding risk management that are required by Swiss law are included in the Roche Group Consolidated Financial Statements on pages 121 to 129.
6. Board and Executive remunerationBoard of DirectorsMembers of the Board of Directors of Roche Holding Ltd receive an annual remuneration and payment for their time and expenses related to their membership of Board committees.
Remuneration of members of the Board of Directors | in thousands of CHF
2010 2009
B. Gehrig 400 400A. Hoffmann 400 400P. Baschera 330 330J. I. Bell 330 330P. Brabeck-Letmathe 50 300W.M. Burns 306 –L.J.R. de Vink 330 330W. Frey 360 360D.A. Julius 360 360A.R. Levinson 636 –A. Oeri 360 360W. Ruttenstorfer 330 330H. Teltschik 77 390B. Weder di Mauro 360 365Total remuneration of Board of Directors 4,629 4,255
The remuneration for Dr Levinson includes payments for his consulting work and for his Board membership of Genentech totalling 356 thousand Swiss francs. The Chairman of the Board of Directors, Dr Franz B. Humer, received remuneration as shown in the table below.
Remuneration of the Chairman of the Board of Directors | in thousands of CHF
2010 2009
Annual salary, including bonuses and expenses 6,707 8,230Special Stock Awards – 2,792Pensions and other post-employment benefits 2,996 2,995Equity compensation plans 75 75Other employee benefits 255 262Total remuneration received 10,033 14,354
Social security costs 566 763Total 10,599 15,117

156 Roche Finance Report 2010 Roche Holding Ltd, Basel – Notes to the Financial Statements
Corporate Executive CommitteeMembers of the Corporate Executive Committee (‘CEC’) of Roche Holding Ltd receive remuneration, indirect benefits and participate in certain equity compensation plans as shown in the table below. The Group’s CEO, Dr Severin Schwan, was the member of the Corporate Executive Committee with the highest total remuneration and his remuneration is also disclosed. New members of the Corporate Executive Committee (Mr O’Day in 2010 and Dr Soriot in 2009) are included for the full calendar year in which they joined the CEC.
Remuneration of the members of the Corporate Executive Committee | in thousands of CHF
Total CEC
2010 – of which S. Schwan Total CEC
2009 – of which S. Schwan
Annual salary, including bonuses and expenses 23,142 6,780 29,742 5,905Special Stock Awards – – 6,543 1,675Pensions and other post-employment benefits 3,210 456 2,495 457Equity compensation plans 12,272 4,152 16,033 4,039Other employee benefits 135 9 248 25Total remuneration received 38,759 11,397 55,061 12,101
Social security costs 1,200 351 1,909 386Total 39,959 11,748 56,970 12,487
Special Stock Awards | During 2009 the Chairman of the Board of Directors and members of the Corporate Executive Committee were granted a total of 96,750 Special Stock Awards. The Chairman of the Board of Directors received 34,084 awards and members of the CEC received a total of 62,666 awards, of which 20,450 awards were granted to Dr Schwan. The fair value of these awards for the employee is calculated based on the fair value of non-voting equity securities (Genussscheine) at the grant date (CHF 146.70 or CHF 169.40) discounted to take into account the period in which they are blocked (3 years: 83.962%, 10 years: 55.839%). There were no such awards in 2010.
Employer contribution to social security schemes and pension plans | The Group pays social insurance contributions in respect of the above remuneration and pays contributions to pension and other post-employment benefit plans for the Chairman of the Board of Directors and members of the Corporate Executive Committee.
Equity Compensation Plans | The Chairman of the Board of Directors and members of the Corporate Executive Committee also participate in certain equity compensation plans as described below. The terms and vesting conditions of these awards are disclosed in Note 11 to the Consolidated Financial Statements. The fair values used in the Consolidated Financial Statements represent the cost to the company at grant date and reflect amongst other matters the observed exercise behaviour and exit rate for the whole population that receive the awards and initial simulations of any performance conditions. For the purposes of these remuneration disclosures the values are calculated based on the fair value that the employee receives taking into account the preliminary assessment of any completed performance conditions.
The Chairman of the Board of Directors and members of the Corporate Executive Committee are eligible to participate in Roche Connect, a programme that enables employees to make regular deductions from their salaries to purchase non-voting equity securities. The Group contributes to the programme, which allows the employees to purchase non-voting equity securities at a discount (usually 20%).
During 2010 members of the Corporate Executive Committee were granted 451,755 Stock-settled Stock Appreciation Rights (S-SARs). The individual awards relating to 2010 are shown in the table below. The fair value of these awards for the employee is 23.05 Swiss francs, which is calculated using the Black-Scholes formula, assuming holding until maturity, and deducting 11% for the average two-year vesting period.

157
Members of the Corporate Executive Committee and other members of senior management participate in the Roche Performance Share Plan (PSP). The Group has three overlapping three-year PSPs. The target awards for the three-year cycle are defined at the beginning of the cycle and the awards are considered to form part of the employee’s remuneration in three equal annual amounts over the three-year cycle. Each award will result in between zero and two non-voting equity securities (Genussscheine), depending upon the achievement of the performance targets, and the discretion of the Board of Directors. The individual awards relating to 2010 are shown in the table below. The number of the awards is calculated as follows:
• PSP 2008–2010: At the end of the cycle the performance targets were not achieved and accordingly the participants received none of the originally targeted non-voting equity securities (Genussscheine).
• PSP 2009–2011: One non-voting equity security (Genussschein) per award.
• PSP 2010–2012: One non-voting equity security (Genussschein) per award.
• The resulting allocations are multiplied by the non-voting equity security (Genussschein) price at 31 December 2010 of 137.00 Swiss francs to give the fair value for the remuneration received by the employee.
Remuneration from equity compensation plans in 2010 | in thousands of CHF
Roche Connect S-SAR awards PSP awardsEmployer
contributionsS-SAR ’10(number)
S-SAR ’10fair value
PSP ’08–’10(number)
PSP ’09–’11(number)
PSP ’10–’12(number)
PSPfair value
Totalfair value
Total CEC 187 451,755 10,413 – 16,036 20,568 1,672 12,272– of which
S. Schwan 90 154,443 3,560 – 5,011 5,991 502 4,152
In 2009 the total remuneration of the Corporate Executive Committee from equity compensation plans was 16 million Swiss francs, of which 4 million Swiss francs were attributable to Dr Schwan, the member of the Corporate Executive Committee with the highest total remuneration.
Other employee benefits | This includes tax advisory costs and other incidental benefits. In 2009 this also includes remuneration of Dr Schwan, Dr Hunziker, Mr Burns and Prof. Knowles for serving on the Chugai Board of Directors and a special payment to Dr Keller of 50,000 Swiss francs for his 25 years’ service to the Group.
Transactions with former members of the Corporate Executive Committee | Pensions and tax consulting services totalling 2 million Swiss francs were paid by the Group in 2010 to four former Corporate Executive Committee members (2009: 2 million Swiss francs to two former members).
7. Board and Executive shareholdingsBoard of DirectorsDirectors Mr André Hoffmann and Dr Andreas Oeri and other members of the founder’s families who are closely associated with them belong to a shareholder group with pooled voting rights. At the end of 2010 this group held 80,020,000 shares (50.01% of issued shares). Detailed information about this group is given in Note 4. In addition at the end of the year the members of the Board of Directors and persons closely associated with them held shares and non-voting equity securities (Genussscheine) as shown in the table below.
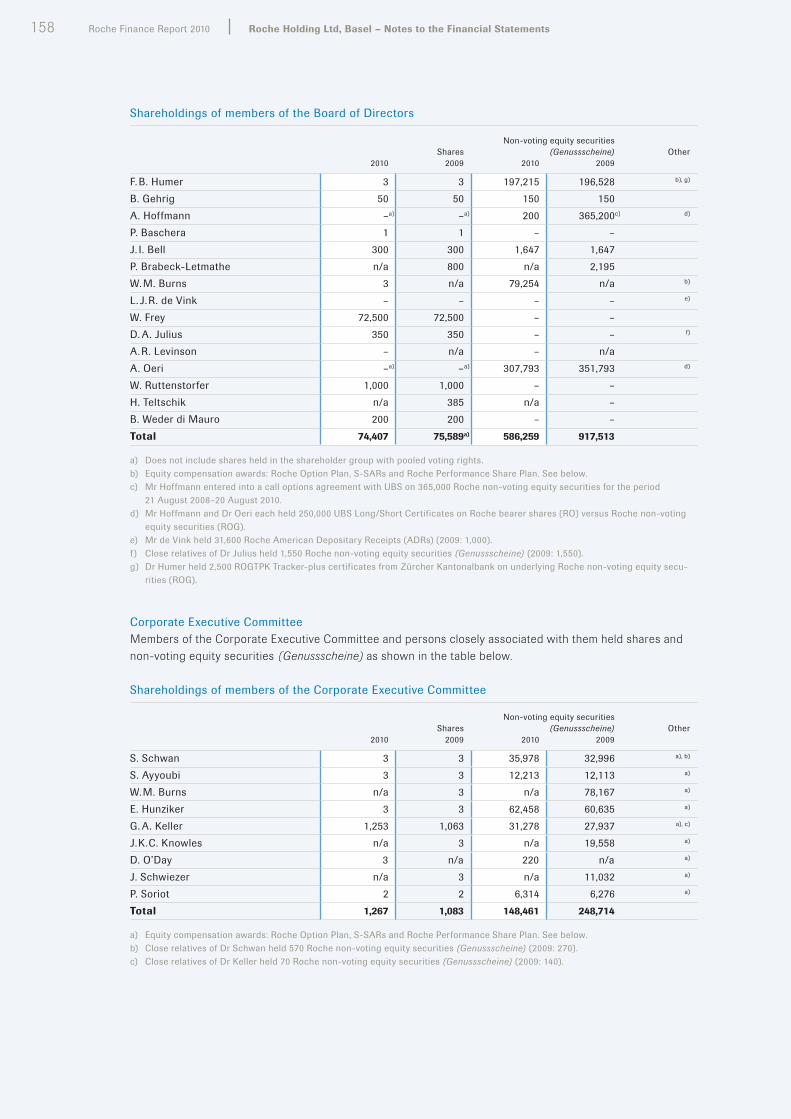
158 Roche Finance Report 2010 Roche Holding Ltd, Basel – Notes to the Financial Statements
Shareholdings of members of the Board of Directors
SharesNon-voting equity securities
(Genussscheine) Other2010 2009 2010 2009
F. B. Humer 3 3 197,215 196,528 b), g)
B. Gehrig 50 50 150 150A. Hoffmann –a) –a) 200 365,200c) d)
P. Baschera 1 1 – –J. I. Bell 300 300 1,647 1,647P. Brabeck-Letmathe n/a 800 n/a 2,195W. M. Burns 3 n/a 79,254 n/a b)
L. J.R. de Vink – – – – e)
W. Frey 72,500 72,500 – –D. A. Julius 350 350 – – f)
A.R. Levinson – n/a – n/aA. Oeri –a) –a) 307,793 351,793 d)
W. Ruttenstorfer 1,000 1,000 – –H. Teltschik n/a 385 n/a –B. Weder di Mauro 200 200 – –Total 74,407 75,589a) 586,259 917,513
a) Does not include shares held in the shareholder group with pooled voting rights.b) Equity compensation awards: Roche Option Plan, S-SARs and Roche Performance Share Plan. See below.c) Mr Hoffmann entered into a call options agreement with UBS on 365,000 Roche non-voting equity securities for the period
21 August 2008–20 August 2010. d) Mr Hoffmann and Dr Oeri each held 250,000 UBS Long/Short Certificates on Roche bearer shares (RO) versus Roche non-voting
equity securities (ROG).e) Mr de Vink held 31,600 Roche American Depositary Receipts (ADRs) (2009: 1,000). f) Close relatives of Dr Julius held 1,550 Roche non-voting equity securities (Genussscheine) (2009: 1,550).g) Dr Humer held 2,500 ROGTPK Tracker-plus certificates from Zürcher Kantonalbank on underlying Roche non-voting equity secu-
rities (ROG).
Corporate Executive CommitteeMembers of the Corporate Executive Committee and persons closely associated with them held shares and non-voting equity securities (Genussscheine) as shown in the table below.
Shareholdings of members of the Corporate Executive Committee
SharesNon-voting equity securities
(Genussscheine) Other2010 2009 2010 2009
S. Schwan 3 3 35,978 32,996 a), b)
S. Ayyoubi 3 3 12,213 12,113 a)
W.M. Burns n/a 3 n/a 78,167 a)
E. Hunziker 3 3 62,458 60,635 a)
G. A. Keller 1,253 1,063 31,278 27,937 a), c)
J.K.C. Knowles n/a 3 n/a 19,558 a)
D. O’Day 3 n/a 220 n/a a)
J. Schwiezer n/a 3 n/a 11,032 a)
P. Soriot 2 2 6,314 6,276 a)
Total 1,267 1,083 148,461 248,714
a) Equity compensation awards: Roche Option Plan, S-SARs and Roche Performance Share Plan. See below.b) Close relatives of Dr Schwan held 570 Roche non-voting equity securities (Genussscheine) (2009: 270).c) Close relatives of Dr Keller held 70 Roche non-voting equity securities (Genussscheine) (2009: 140).
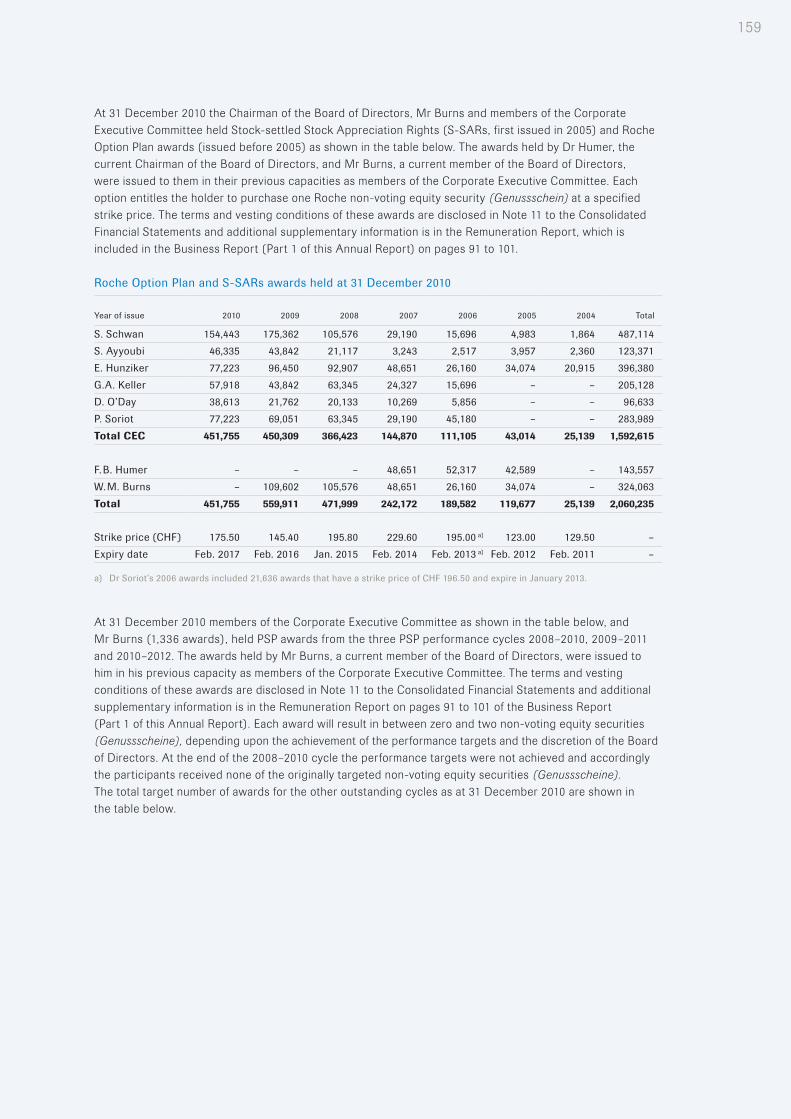
159
At 31 December 2010 the Chairman of the Board of Directors, Mr Burns and members of the Corporate Executive Committee held Stock-settled Stock Appreciation Rights (S-SARs, first issued in 2005) and Roche Option Plan awards (issued before 2005) as shown in the table below. The awards held by Dr Humer, the current Chairman of the Board of Directors, and Mr Burns, a current member of the Board of Directors, were issued to them in their previous capacities as members of the Corporate Executive Committee. Each option entitles the holder to purchase one Roche non-voting equity security (Genussschein) at a specified strike price. The terms and vesting conditions of these awards are disclosed in Note 11 to the Consolidated Financial Statements and additional supplementary information is in the Remuneration Report, which is included in the Business Report (Part 1 of this Annual Report) on pages 91 to 101.
Roche Option Plan and S-SARs awards held at 31 December 2010
Year of issue 2010 2009 2008 2007 2006 2005 2004 Total
S. Schwan 154,443 175,362 105,576 29,190 15,696 4,983 1,864 487,114S. Ayyoubi 46,335 43,842 21,117 3,243 2,517 3,957 2,360 123,371E. Hunziker 77,223 96,450 92,907 48,651 26,160 34,074 20,915 396,380G.A. Keller 57,918 43,842 63,345 24,327 15,696 – – 205,128D. O’Day 38,613 21,762 20,133 10,269 5,856 – – 96,633P. Soriot 77,223 69,051 63,345 29,190 45,180 – – 283,989Total CEC 451,755 450,309 366,423 144,870 111,105 43,014 25,139 1,592,615
F. B. Humer – – – 48,651 52,317 42,589 – 143,557W.M. Burns – 109,602 105,576 48,651 26,160 34,074 – 324,063Total 451,755 559,911 471,999 242,172 189,582 119,677 25,139 2,060,235
Strike price (CHF) 175.50 145.40 195.80 229.60 195.00 a) 123.00 129.50 –Expiry date Feb. 2017 Feb. 2016 Jan. 2015 Feb. 2014 Feb. 2013 a) Feb. 2012 Feb. 2011 –
a) Dr Soriot’s 2006 awards included 21,636 awards that have a strike price of CHF 196.50 and expire in January 2013.
At 31 December 2010 members of the Corporate Executive Committee as shown in the table below, and Mr Burns (1,336 awards), held PSP awards from the three PSP performance cycles 2008–2010, 2009–2011 and 2010–2012. The awards held by Mr Burns, a current member of the Board of Directors, were issued to him in his previous capacity as members of the Corporate Executive Committee. The terms and vesting conditions of these awards are disclosed in Note 11 to the Consolidated Financial Statements and additional supplementary information is in the Remuneration Report on pages 91 to 101 of the Business Report (Part 1 of this Annual Report). Each award will result in between zero and two non-voting equity securities (Genussscheine), depending upon the achievement of the performance targets and the discretion of the Board of Directors. At the end of the 2008–2010 cycle the performance targets were not achieved and accordingly the participants received none of the originally targeted non-voting equity securities (Genussscheine). The total target number of awards for the other outstanding cycles as at 31 December 2010 are shown in the table below.

160 Roche Finance Report 2010 Roche Holding Ltd, Basel – Notes to the Financial Statements
Roche Performance Share Plan awards held at 31 December 2010
PSP 2009–2011 PSP 2010–2012
S. Schwan 5,011 5,991S. Ayyoubi 1,002 1,597E. Hunziker 4,009 3,994G.A. Keller 3,006 2,995D. O’Day 904 1,997P. Soriot 2,104 3,994Total CEC 16,036 20,568
Allocation date Feb. 2012 Feb. 2013
At 31 December 2009 the Chairman of the Board of Directors and members of the Corporate Executive Committee at that time held a total of 1,979,474 Stock-settled Stock Appreciation Rights and Roche Option Plan awards, and had outstanding a total of 37,989 awards granted under the Roche Performance Share Plan.

161 Roche Finance Report 2010Roche Holding Ltd, Basel – Appropriation of Available Earnings
Appropriation of Available Earnings
Proposals to the Annual General Meeting | in CHF
2010 2009
Available earningsBalance brought forward from previous year 210,556,466 590,269Net profit for the year 5,919,098,384 5,385,342,397Transfer from free reserve – –Total available earnings 6,129,654,850 5,385,932,666
Appropriation of available earningsDistribution of an ordinary dividend of CHF 6.60 gross per share and non-voting equity security (Genussschein) as against CHF 6.00 last year (5,692,913,820) (5,175,376,200)Transfer to free reserve – –Total appropriation of available earnings (5,692,913,820) (5,175,376,200)
To be carried forward on this account 436,741,030 210,556,466

162 Roche Finance Report 2010 Roche Holding Ltd, Basel – Report of the Statutory Auditor on the Financial Statements
Report of the Statutory Auditor on the Financial Statements
Report of the Statutory Auditor on the Financial Statementsto the Annual General Meeting of Roche Holding Ltd, BaselAs statutory auditor, we have audited the accompanying financial statements of Roche Holding Ltd, which comprise the income statement, balance sheet and notes on pages 151 to 161 for the year ended 31 December 2010.
Board of Directors’ Responsibility | The Board of Directors is responsible for the preparation of the financial statements in accordance with the requirements of Swiss law and the company’s articles of incorporation. This responsibility includes designing, implementing and maintaining an internal control system relevant to the preparation of financial statements that are free from material misstatement, whether due to fraud or error. The Board of Directors is further responsible for selecting and applying appropriate accounting policies and making accounting estimates that are reasonable in the circumstances.
Auditor’s Responsibility | Our responsibility is to express an opinion on these financial statements based on our audit. We conducted our audit in accordance with Swiss law and Swiss Auditing Standards. Those standards require that we plan and perform the audit to obtain reasonable assurance whether the financial statements are free from material misstatement.
An audit involves performing procedures to obtain audit evidence about the amounts and disclosures in the financial statements. The procedures selected depend on the auditor’s judgment, including the assessment of the risks of material misstatement of the financial statements, whether due to fraud or error. In making those risk assessments, the auditor considers the internal control system relevant to the entity’s preparation of the financial statements in order to design audit procedures that are appropriate in the circumstances, but not for the purpose of expressing an opinion on the effectiveness of the entity’s internal control system. An audit also includes evaluating the appropriateness of the accounting policies used and the reasonableness of accounting estimates made, as well as evaluating the overall presentation of the financial statements. We believe that the audit evidence we have obtained is sufficient and appropriate to provide a basis for our audit opinion.
Opinion | In our opinion, the financial statements for the year ended 31 December 2010 comply with Swiss law and the company’s articles of incorporation.

163
Report on Other Legal RequirementsWe confirm that we meet the legal requirements on licensing according to the Auditor Oversight Act (AOA) and independence (article 728 CO and article 11 AOA) and that there are no circumstances incompatible with our independence.
In accordance with article 728a paragraph 1 item 3 CO and Swiss Auditing Standard 890, we confirm that an internal control system exists, which has been designed for the preparation of financial statements according to the instructions of the Board of Directors.
We further confirm that the proposed appropriation of available earnings complies with Swiss law and the company’s articles of incorporation. We recommend that the financial statements submitted to you be approved.
KPMG AG
John A. Morris François Rouiller Licensed Audit Expert Licensed Audit Expert Auditor in Charge
Basel, 27 January 2011

Published byF. Hoffmann-La Roche Ltd4070 Basel, SwitzerlandTel. +41 (0)61 688 11 11Fax +41 (0)61 691 93 91
Media OfficeGroup Communications4070 Basel, SwitzerlandTel. +41 (0)61 688 88 88Fax +41 (0)61 688 27 75
Investor Relations4070 Basel, SwitzerlandTel. +41 (0)61 688 88 80Fax +41 (0)61 691 00 14
World Wide Webwww.roche.com
To order publicationsTel. +41 (0)61 688 83 39Fax +41 (0)61 688 43 43E-mail: [email protected]
Next Annual General Meeting: 1 March 2011
Cautionary statement regarding forward-looking statementsThis Annual Report contains certain forward-looking statements. These forward-looking statements may be identi-fied by words such as ‘believes’, ‘expects’, ‘anticipates’, ‘projects’, ‘intends’, ‘should’, ‘seeks’, ‘estimates’, ‘future’ or similar expressions or by discussion of, among other things, strategy, goals, plans or intentions. Various factors may cause actual results to differ materially in the future from those reflected in forward-looking statements contained in this Annual Report, among others: (1) pricing and product initiatives of competitors; (2) legislative and regulatory devel-opments and economic conditions; (3) delay or inability in obtaining regulatory approvals or bringing products to market; (4) fluctuations in currency exchange rates and general financial market conditions; (5) uncertainties in the discovery, development or marketing of new products or new uses of existing products, including without limitation negative results of clinical trials or research projects, unexpected side effects of pipeline or marketed products; (6) increased government pricing pressures; (7) interruptions in production; (8) loss of or inability to obtain adequate protection for intellectual property rights; (9) litigation; (10) loss of key executives or other employees; and (11) adverse publicity and news coverage.
The statement regarding earnings per share growth is not a profit forecast and should not be interpreted to mean that Roche’s earnings or earnings per share for 2010 or any subsequent period will necessarily match or exceed the historical published earnings or earnings per share of Roche.
All trademarks mentioned enjoy legal protection.
The Roche Finance Report is published in German and English. In case of doubt or differences of interpretation, the English version shall prevail over the German text.
Printed on non-chlorine bleached, FSC-certified paper.
The Roche Annual Report is issued by F. Hoffmann-La Roche Ltd, Basel, Group Communications.

F. Hoffmann-La Roche Ltd4070 Basel, Switzerland
© 2011
All trademarks are legally protected.
www.roche.com
7 000 899

![The Bank of England and Financial Services Bill [HL]researchbriefings.files.parliament.uk/documents/CBP-74… · · 2016-01-29The Bank of England and Financial Services Bill [HL]](https://static.documents.pub/doc/80x56/5af991d27f8b9ae92b8c944d/the-bank-of-england-and-financial-services-bill-hl-2016-01-29the-bank-of-england.jpg)


