Int. J. Environ. Res., 6(1):1-18, Winter 2012 ISSN: 1735-6865 Received 15 Aug. 2011; Revised 27 Sep. 2011; Accepted 10 Oct. 2011 *Corresponding author E-mail: [email protected]1 Rock Magnetic Investigations of Surface and sub-surface soil Samples from five Lake Catchments in Tropical Southern India Sandeep, K. 1,2 * , Warrier, A.K. 1,3 , Harshavardhana, B.G . 1 and Shankar, R. 1 1 Department of Marine Geology, Mangalore University, Mangalagangotri 574199, INDIA 2 Present address: Geological Survey of India-Training Institute, Bandlaguda, Hyderabad 500068, INDIA 3 Present address: Antarctic Science Division, National Centre for Antarctic & Ocean Research, Headland Sada, Vasco-da-Gama, Goa 403 804, India ABSTRACT: Iron oxide minerals in soils provide valuable insights into pedogenic processes. A wealth of such information has been obtained by rock magnetic investigations on temperate soils but similar studies on tropical soils are rare. Here, we report rock magnetic data on pristine soil profiles and surficial soils from five catchments in the tropical southern India and throw light on the pedogenic processes. We ruled out contributions from greigite, bacterial magnetite and anthropogenic sources; hence, the magnetic signal is mainly from the catchment, principally pedogenic and, thus, has a climatic signature embedded in it. The Pookot profile from a high rainfall (~4000 mm/year) region does not exhibit any magnetic enhancement at the surface. In fact, there is hardly any difference between surface and sub-surface samples, which reflects on its deeply weathered nature as a result of the high rainfall. The Shantisagara profile exhibits lessivage of magnetic minerals, resulting in a thick magnetically enhanced zone. It shows the highest χ lf values among the five profiles studied. The Thimmannanayakanakere (TK) and Ayyanakere (AK) soil profiles do not exhibit any magnetic enhancement of top-soil. In fact, χ lf values increase towards the profile-bottom, suggesting top-soil erosion, besides contribution of magnetic minerals from parent rocks. In the TK profile, there is a clear distinction between surface and sub-surface samples, the former being magnetically coarser grained. The Kurburukere profile exhibits moderate to strong χ lf values and a mild magnetic enhancement at the surface.The data would be useful for establishing soil-sediment linkages for paleoclimatic studies of lake sediments. Key words: Rock magnetism, Magnetic enhancement, Tropical soils, Pedogenesis, Erosion, Lessivage INTRODUCTION Iron is one of the essential constituents of soils and an important plant nutrient. It exists in the form of iron oxide phases like magnetite, maghemite, hematite, goethite and limonite in soils depending upon the environmental conditions. Iron oxides are produced in soils as a result of chemical weathering/pedogenesis which, in turn, is influenced by climatic conditions prevalent in the area. Thus, fluctuations in climate may initiate changes in chemical weathering processes, leading to changes in the iron oxide concentration, magnetic grain size and/or mineralogy. Hence, the iron oxide minerals can be valuable pedogenic indicators (Cornell and Schwertmann, 2003; Schwertmann, 1988). Rock magnetic methods have the advantages of being simple, rapid, inexpensive, sensitive and non- destructive. Also, the changes in iron oxide mineralogy, grain size and concentration associated with pedogenesis may be appraised effectively using rock magnetic methods. Soil magnetic investigations are useful for the evaluation of pedo-environmental conditions and processes in soils (Jordanova et al., 2011). Rock magnetic methods have been successfully used in studies of loess-paleosol sequences (Orgeira et al., 2003; Bloemendal and Liu, 2005), lake sediments (Shankar et al., 2006; Warrier and Shankar, 2009; Foster et al., 2008) and archaeological sites to decipher the past climate (Warrier et al., 2011).Considerable work has been carried out on magnetic enhancement of top- soils and its relation to climate (Fine et al., 1989; Maher et al., 2003; Maher and Taylor, 1988). Soil magnetic properties may also be influenced by parent rock type (Shenggao, 2000), bacterial magnetite (Fassbinder et al., 1990) and anthropogenic activities (Gautam et al., 2004; Blaha et al., 2008). Most of the soil magnetic investigations concerned the temperate soils (Blundell et al., 2009), the Russian Steppe (Maher et al., 2003), the loess- paleosol sequence from China (Wang et al., 2006;
Transcript
Int. J. Environ. Res., 6(1):1-18, Winter 2012ISSN: 1735-6865
Received 15 Aug. 2011; Revised 27 Sep. 2011; Accepted 10 Oct. 2011
1 Department of Marine Geology, Mangalore University, Mangalagangotri 574199, INDIA2 Present address: Geological Survey of India-Training Institute, Bandlaguda, Hyderabad 500068, INDIA
3 Present address: Antarctic Science Division, National Centre for Antarctic & Ocean Research,Headland Sada, Vasco-da-Gama, Goa 403 804, India
ABSTRACT: Iron oxide minerals in soils provide valuable insights into pedogenic processes. A wealth of suchinformation has been obtained by rock magnetic investigations on temperate soils but similar studies ontropical soils are rare. Here, we report rock magnetic data on pristine soil profiles and surficial soils from fivecatchments in the tropical southern India and throw light on the pedogenic processes. We ruled out contributionsfrom greigite, bacterial magnetite and anthropogenic sources; hence, the magnetic signal is mainly from thecatchment, principally pedogenic and, thus, has a climatic signature embedded in it. The Pookot profile froma high rainfall (~4000 mm/year) region does not exhibit any magnetic enhancement at the surface. In fact, thereis hardly any difference between surface and sub-surface samples, which reflects on its deeply weatherednature as a result of the high rainfall. The Shantisagara profile exhibits lessivage of magnetic minerals, resultingin a thick magnetically enhanced zone. It shows the highest χlf values among the five profiles studied. TheThimmannanayakanakere (TK) and Ayyanakere (AK) soil profiles do not exhibit any magnetic enhancementof top-soil. In fact, χlf values increase towards the profile-bottom, suggesting top-soil erosion, besidescontribution of magnetic minerals from parent rocks. In the TK profile, there is a clear distinction betweensurface and sub-surface samples, the former being magnetically coarser grained. The Kurburukere profileexhibits moderate to strong χlf values and a mild magnetic enhancement at the surface.The data would be usefulfor establishing soil-sediment linkages for paleoclimatic studies of lake sediments.
Key words: Rock magnetism, Magnetic enhancement, Tropical soils, Pedogenesis, Erosion, Lessivage
INTRODUCTIONIron is one of the essential constituents of soils
and an important plant nutrient. It exists in the form ofiron oxide phases like magnetite, maghemite, hematite,goethite and limonite in soils depending upon theenvironmental conditions. Iron oxides are produced insoils as a result of chemical weathering/pedogenesiswhich, in turn, is influenced by climatic conditionsprevalent in the area. Thus, fluctuations in climate mayinitiate changes in chemical weathering processes,leading to changes in the iron oxide concentration,magnetic grain size and/or mineralogy. Hence, the ironoxide minerals can be valuable pedogenic indicators(Cornell and Schwertmann, 2003; Schwertmann, 1988).Rock magnetic methods have the advantages of beingsimple, rapid, inexpensive, sensitive and non-destructive. Also, the changes in iron oxide mineralogy,grain size and concentration associated withpedogenesis may be appraised effectively using rockmagnetic methods. Soil magnetic investigations are
useful for the evaluation of pedo-environmentalconditions and processes in soils (Jordanova et al.,2011). Rock magnetic methods have been successfullyused in studies of loess-paleosol sequences (Orgeiraet al., 2003; Bloemendal and Liu, 2005), lake sediments(Shankar et al., 2006; Warrier and Shankar, 2009; Fosteret al., 2008) and archaeological sites to decipher thepast climate (Warrier et al., 2011).Considerable workhas been carried out on magnetic enhancement of top-soils and its relation to climate (Fine et al., 1989; Maheret al., 2003; Maher and Taylor, 1988). Soil magneticproperties may also be influenced by parent rock type(Shenggao, 2000), bacterial magnetite (Fassbinder etal., 1990) and anthropogenic activities (Gautam et al.,2004; Blaha et al., 2008).
Most of the soil magnetic investigationsconcerned the temperate soils (Blundell et al., 2009),the Russian Steppe (Maher et al., 2003), the loess-paleosol sequence from China (Wang et al., 2006;
2
Sandeep, K. et al.
Maher and Thompson, 1995) and modern soils andpaleosols from the U.S.A. (Guyodo et al., 2006; Geisset al., 2008). Only limited studies dealt with soils fromthe tropics (Ortega–Guerrero et al., 2004; van Dam etal., 2005) where the variations in temperature areinsignificant whereas those of rainfall are profound. Inthe Indian context, there have been only a few soilmagnetic studies. Sangode et al. (2008) and Sangodeand Bloemendal (2004) studied the magnetic propertiesof loess-paleosols of the Himalayan region. Magneticmapping of urban soils from cities like Delhi (Maiti etal., 2005; Meena et al., 2011) and Pune (Sangode et al.,2010) was also carried out, but these studies mainlyfocused on pollution aspects. Priya (2009) carried outrock magnetic investigations of soils developed ondifferent lithologies and under different rainfall regimesof Karnataka region in Southern India.
In this study, rock magnetic investigations ofsurface and sub-surface soil samples from thecatchment areas of five lakes situated in differentrainfall regimes in the tropical Southern India were
studied. The main objectives of this work are: (a) todetermine the concentration, grain size and mineralogyof magnetic minerals in the soils; (b) to documentmagnetic enhancement in top-soils, if present; (c)explore soil-related processes, and (d) to magneticallycharacterize the soils. These objectives would, in turn,help in understanding pedogenesis in tropical regionsand in establishing soil-lake sediment linkages that willbe useful in paleoclimatic studies of lake sediments.
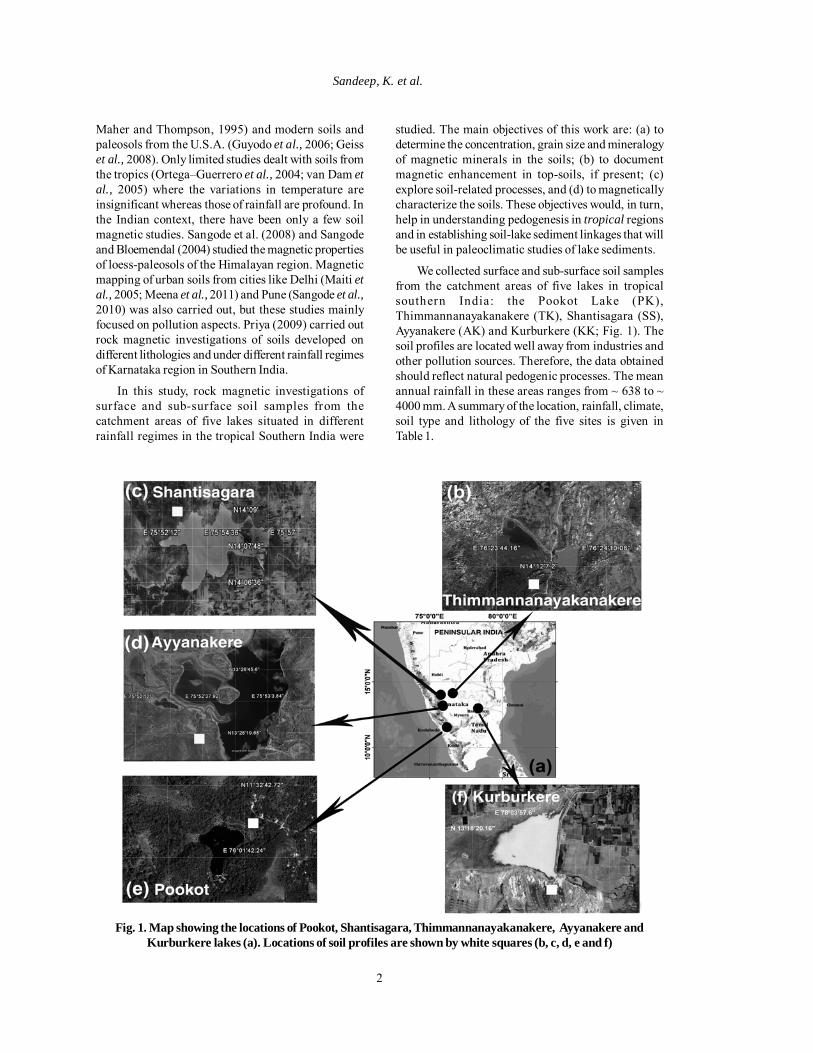
We collected surface and sub-surface soil samplesfrom the catchment areas of five lakes in tropicalsouthern India: the Pookot Lake (PK),Thimmannanayakanakere (TK), Shantisagara (SS),Ayyanakere (AK) and Kurburkere (KK; Fig. 1). Thesoil profiles are located well away from industries andother pollution sources. Therefore, the data obtainedshould reflect natural pedogenic processes. The meanannual rainfall in these areas ranges from ~ 638 to ~4000 mm. A summary of the location, rainfall, climate,soil type and lithology of the five sites is given inTable 1.
Fig. 1. Map showing the locations of Pookot, Shantisagara, Thimmannanayakanakere, Ayyanakere andKurburkere lakes (a). Locations of soil profiles are shown by white squares (b, c, d, e and f)
Int. J. Environ. Res., 6(1):1-18, Winter 2012
3
Sl.
No.
Na
me
of th
e la
ke
catc
hmen
t D
ate o
f sa
mpl
ing
Geo
grap
hic
coor
dina
tes
Loc
atio
n M
ean
annu
al
rain
fall
(mm
)
Mea
n an
nual
te
mpe
ratu
re
(0 C)
Soil
type
Pa
rent
mat
eria
l
1 Po
okot
Lak
e (P
K)
Nov
embe
r 20
07
11o 32
’35”
N 76
o 01’4
0”E
Vyt
hiri,
Way
anad
di
stric
t, K
eral
a ~
4000
M
in =
~21
M
ax =
~ 3
8 Fe
rrugi
nous
fo
rest
loam
y so
il
Hor
nble
nde-
biot
ite
gnei
ss
2
Shan
tisag
ara
(SS)
N
ovem
ber
2007
14
o 08’5
4”N
75o 53
’11”
E
Dav
anag
ere
distr
ict,
Kar
nata
ka
~ 79
5 M
in =
~22
.2
Max
= ~
35.
8 Re
ddish
br
own
clay
ey
loam
Chlo
rite s
chist
3 Th
imm
anna
naya
kana
kere
(T
K)
July
200
6 14
°12'2
7”N
76
°24'
40”E
Chitr
adur
ga d
istri
ct,
Kar
nata
ka
~ 63
8 M
in =
~ 1
6.6
Max
= ~
41
Red
loam
y an
d sa
ndy
soil
Gra
nitic
gne
iss
4 Ay
yana
kere
(AK
) Ju
ne 2
007
13o 26
’22”
N 75
o 52’3
4”E
Chik
mag
alur
dist
rict,
Kar
nata
ka
~ 19
25
Min
= ~
12
Max
= ~
35
Red
loam
y an
d sa
ndy
soil
Hor
nble
nde g
neiss
5 Ku
rbur
kere
(KK
) M
ay 2
007
13o 18
’22.
16”N
78
o 03’5
7.6”
E
Chik
kaba
llapu
r di
stric
t, K
arna
taka
~ 74
0 M
in =
~ 1
0 M
ax =
~ 4
0 Re
d lo
amy
and
sand
y so
il
Mig
mat
ite
Tabl
e 1. A
sum
mar
y of
the g
eogr
aphi
cal c
o-or
dina
tes,
rain
fall,
clim
ate,
soil
type
and
lith
olog
y of
the f
ive s
oil p
rofil
e loc
atio
ns. (
Indi
a M
eteo
rolo
gica
l Dep
artm
ent,
2005
, 200
8; K
eral
a Fo
rest
Dep
artm
ent,
2004
; Som
an, 1
997;
Rad
hakr
ishna
and
Vai
dyan
adha
n, 1
997;
Gaz
ette
er o
f Ind
ia, 1
965,
198
5)
4
Rock samples from five lake catchments
MATERIALS & METHODSSamples were collected from exposed soil profiles,
using wooden knives to avoid contamination from ironand rust. Prior to sampling, the outer weathered portionof the surface was gently scraped to expose the freshsurface. Samples were collected at close intervals (2cm) up to 20 cm depth, and at slightly sparser intervalsthereafter. Besides this, samples of surface soil fromadditional locations were also collected. The sampleswere tightly packed in neatly labeled polythene coversand transported to the laboratory.
Standard techniques were used for samplepreparation (Walden, 1999a). Soil samples were driedin a hot-air oven at 35 oC and gently disaggregatedusing an agate mortar and a pestle. They were filled inpolythene covers and tightly packed in 8-cm3 non-magnetic plastic bottles. A range of magneticparameters was determined on the samples (Dearing,1999, Walden et al., 1999; Thompson and Oldfield,1986).
Magnetic susceptibility at low (0.47 kHz; χlf) andhigh (4.7 kHz; χhf) frequencies was determined on aBartington Susceptibility Meter (Model MS2B) with adual-frequency sensor. The sensor was calibrated byusing the Fe3O4 (1%) standard supplied by themanufacturer. Frequency-dependent susceptibility (χfd-%) was calculated from the difference between low-and high-frequency susceptibilities (Dearing, 1999).
Anhysteretic remanent magnetisation (ARM) wasinduced in the samples using a Molspin AFdemagnetiser (with an ARM attachment) set with a peakalternating field of 100 mT and a DC biasing field of0.04 mT. The ARM induced was measured on a Molspinspinner fluxgate magnetometer. The susceptibility ofARM (χARM) was calculated by dividing the mass-specific ARM by the size of the biasing field (0.04 mT =31.84 Am-1; Walden, 1999b).
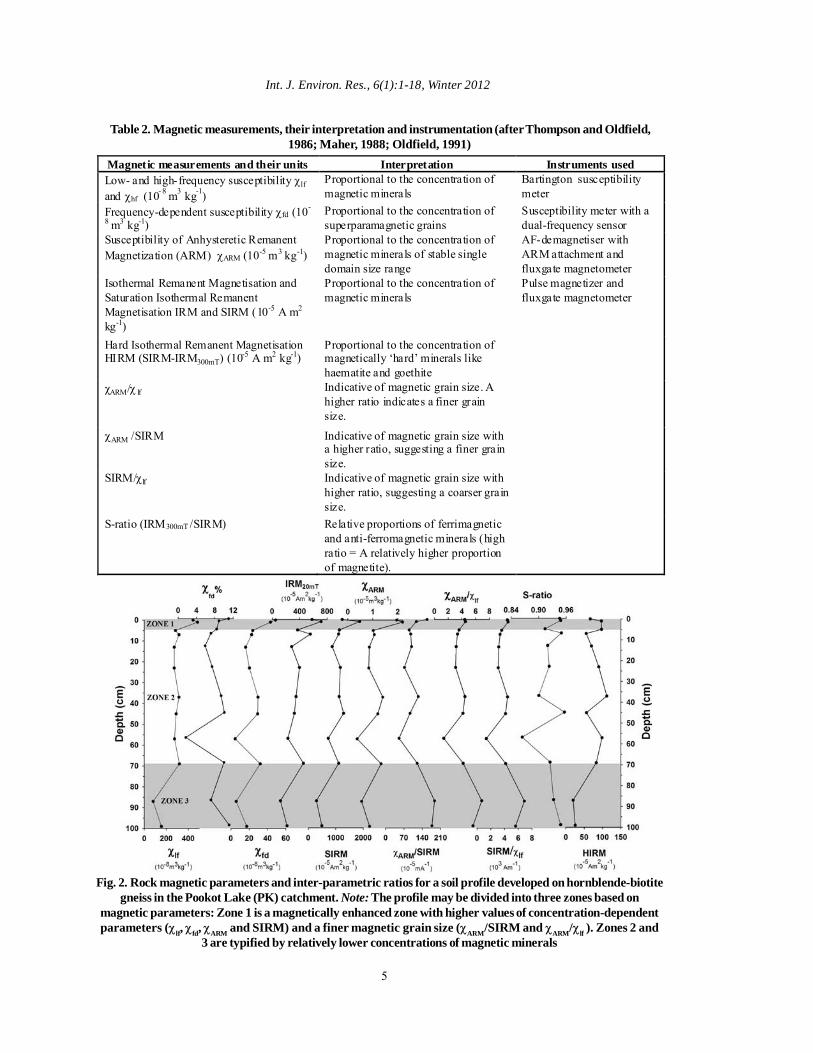
Isothermal remanent magnetisation (IRM) wasinduced in the samples at different field strengths (20,60, 100, 300, 500 and 1000 mT) using a Molspin pulsemagnetiser. The isothermal remanence induced at 1Tfield (the maximum field attainable in the EnvironmentalMagnetism Laboratory at Mangalore University) wasconsidered as the saturation isothermal remanentmagnetisation (SIRM). The remanence acquired wasmeasured using the Molspin spinner fluxgatemagnetometer. Inter-parametric ratios like S-ratio, χARM/χlf, χARM/SIRM and SIRM/χ lf were calculated todetermine the magnetic mineralogy and grain size(Walden, 1999b). The magnetic measurements, theirinterpretation and instrumentation are given in Table 2(after Thompson and Oldfield, 1986; Maher, 1988;Oldfield, 1991).
RESULTS & DISCUSSIONSurface and sub-surface soil samples from thecatchment area of Pookot Lake (PK)
The environmental magnetic parameters andinter-parametric ratios for the soil profile (n=24) fromthe catchment area of Pookot Lake are plotted in Fig .2. This profile may be divided into three zones basedon the values of concentration-dependent parameters,namely χlf, χARM and SIRM (Fig. 2). Zone 3 (100-69cm), the bottom most zone, has the lowest values forall the concentration-dependant parameters. In Zone2 (69-5 cm), the values are slightly higher and do notexhibit noticeable fluctuations. Zone 1 (5-0 cm) hasrelatively high values that peak abruptly at the profile-top. Frequency-dependent susceptibility, which isproportional to the concentration ofsuperparamagnetic grains (pedogenic component;Dearing et al., 1996), and χARM, which is proportionalto the concentration of stable single domain (SSD)grains (Walden, 1999a), also exhibit trends similar tothat of χlf (Fig. 2). Hence, it may be inferred that theconcentrations of SP and SSD grains are higher in theprofile-top sample compared to the sub-surface ones.
The top two samples exhibit an average χlf valueof 463.8 x 10⁻⁸ m3 kg-1 whereas the rest of the profileshows values in the range of 80.3 to 319.4 x 10⁻⁸ m3 kg-
1 (average = 257.8 x 10⁻⁸ m3 kg-1). Similarly, the averageχfd and χARM values for the top two samples are 45.9 x10⁻⁵ m3 kg-1 and 2.9 x 10⁻⁸ m3 kg-1 respectively, whereasthe remainder of the profile shows χfd values rangingfrom 4.6 to 31.9 x 10⁻⁸ m3 kg-1 (average = 20.1 x 10⁻⁸ m3 kg-
1) and χARM values ranging from 0.4 to 1.4 x 10⁻⁸ m3 kg-1
(average = 0.95 x 10⁻⁸ m3 kg-1). The relatively high χfdand χARM values for the top two samples are suggestiveof magnetic enhancement of the surface soil. Besides,these parameters (χARM and χfd) exhibit a statisticallysignificant correlation coefficient of 0.84 (p < 0.01,n=12) with χlf, indicating that magnetic susceptibilityis enhanced mainly by the ultra-fine pedogeniccomponent in the samples.
What is the cause for such magnetic enhancement?The high values of concentration-dependantparameters may result from pedogenesis, the effect offire, anthropogenic activities or the presence ofbacterial magnetite. Natural fires or crop-burning maycause thermal transformation of weakly magnetic ironoxides, hydroxides and carbonates to ferrimagneticmagnetite or maghemite in the presence of organicmatter (Le Borgne, 1955; Kletetschka and Banerjee,1995). Burnt surface soils exhibit noticeably sharppeaks in susceptibility values compared to sub-surfacesamples. But in the PK soil profile, the enhancement isnot remarkable (Fig. 2). The degree of magneticenhancement is reported to be highly variable,
5
Int. J. Environ. Res., 6(1):1-18, Winter 2012
Table 2. Magnetic measurements, their interpretation and instrumentation (after Thompson and Oldfield,1986; Maher, 1988; Oldfield, 1991)
Fig. 2. Rock magnetic parameters and inter-parametric ratios for a soil profile developed on hornblende-biotitegneiss in the Pookot Lake (PK) catchment. Note: The profile may be divided into three zones based on
magnetic parameters: Zone 1 is a magnetically enhanced zone with higher values of concentration-dependentparameters (χlf, χfd, χARM and SIRM) and a finer magnetic grain size (χARM/SIRM and χARM/χlf ). Zones 2 and
3 are typified by relatively lower concentrations of magnetic minerals
Magnetic measurements and their units Interpretation Instruments used Low- and high-frequency susceptibility χlf and χhf (10- 8 m3 kg-1)
Proportional to the concentration of magnetic minerals
Bartington susceptibility meter
Frequency-dependent susceptibility χfd (10-
8 m3 kg-1) Proportional to the concentration of superparamagnetic grains
Susceptibility meter with a dual-frequency sensor
Susceptibility of Anhysteretic Remanent Magnetization (ARM) χARM (10-5 m3 kg-1)
Proportional to the concentration of magnetic minerals of stable single domain size range
AF-demagnetiser with ARM attachment and fluxgate magnetometer
Isothermal Remanent Magnetisation and Saturation Isothermal Remanent Magnetisation IRM and SIRM (10-5 A m2 kg-1)
Proportional to the concentration of magnetic minerals
Pulse magnetizer and fluxgate magnetometer
Hard Isothermal Remanent Magnetisation HIRM (SIRM-IRM300mT) (10-5 A m2 kg-1)
Proportional to the concentration of magnetically ‘hard’ minerals like haematite and goethite
χARM/χ lf Indicative of magnetic grain size. A higher ratio indicates a finer grain size.
χARM /SIRM Indicative of magnetic grain size with a higher ratio, suggesting a finer grain size.
SIRM/χ lf Indicative of magnetic grain size with higher ratio, suggesting a coarser grain size.
S-ratio (IRM300mT /SIRM) Relative proportions of ferrimagnetic and anti-ferromagnetic minerals (high ratio = A relatively higher proportion of magnetite).
6
Sandeep, K. et al.
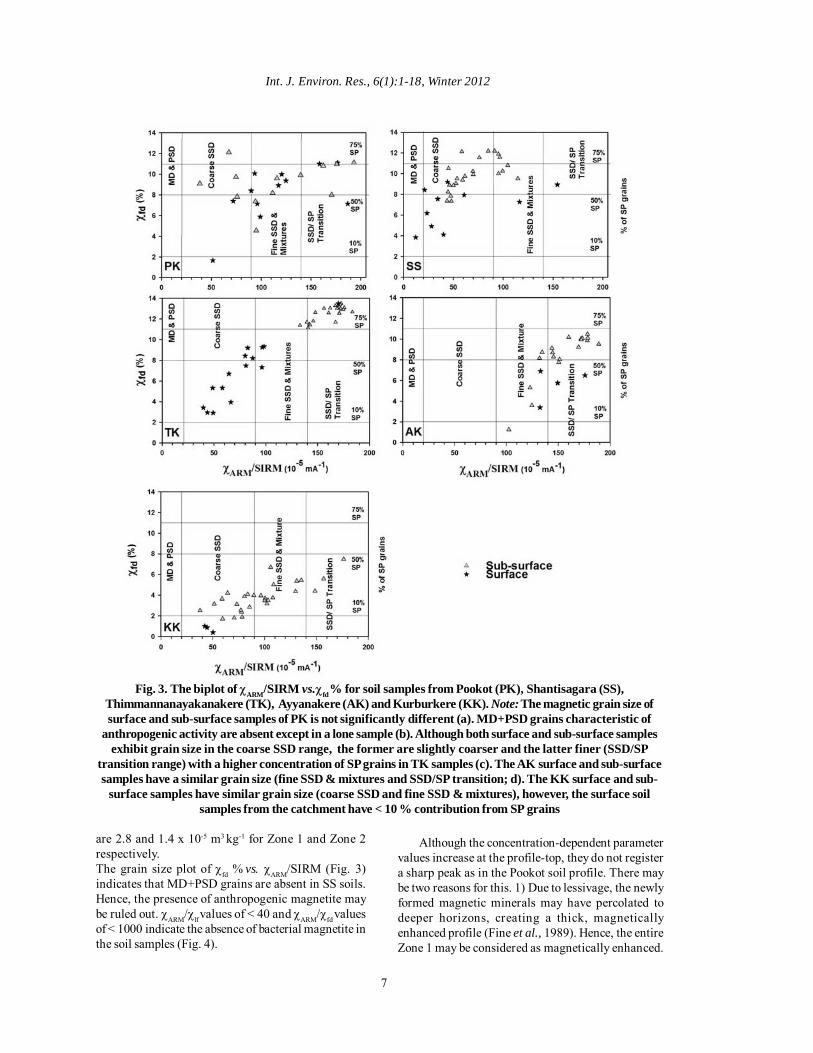
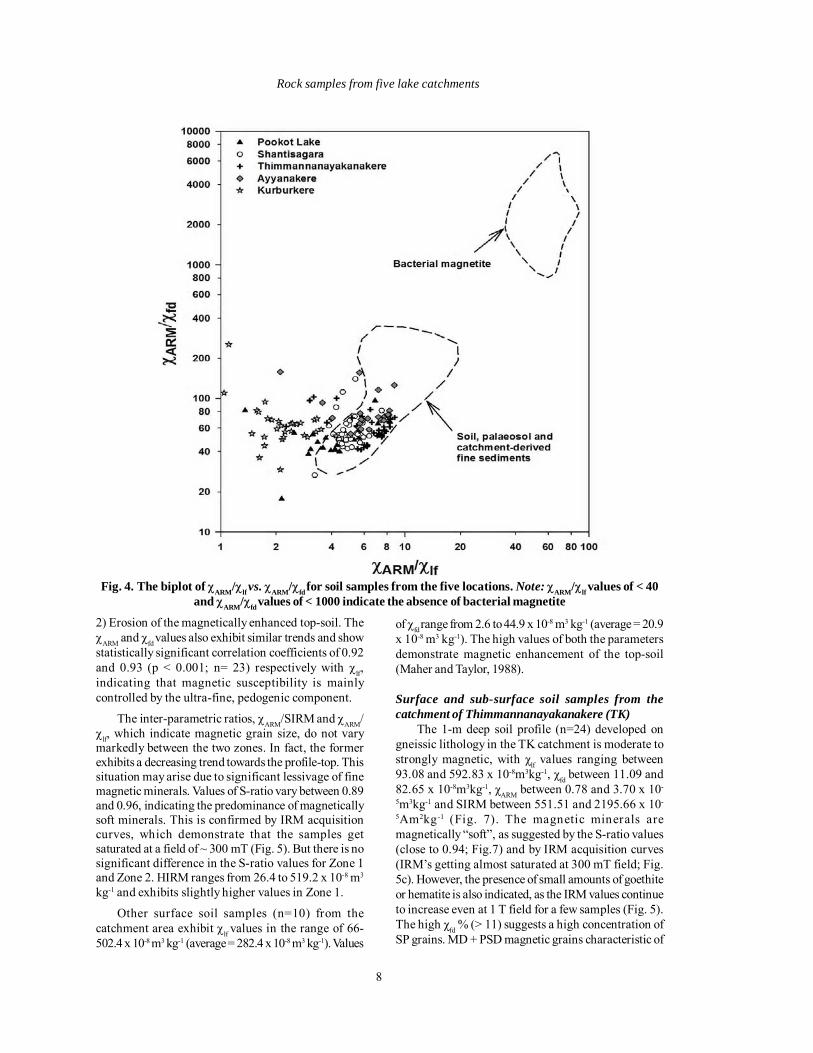
depending on the organic matter content, temperatureof burning, availability of pre-existing iron minerals andsoil porosity (Evans and Heller, 2003). Oldfield andCrowther (2007) documented a maximum susceptibilityrange of 1480-10700 x 10-8 SI units for burnt soils, whichis highly variable. Fig. 3 is a biplot of χARM/SIRMvs.χfd% (Dearing et al., 1997) that shows the magnetic grainsize distribution in soil samples from the fivecatchments. None of the PK soil samples plot in theMD/PSD envelope, indicating that the magneticminerals are not anthropogenic (Fig. 3). Bacterialmagnetite may influence the magnetic signal of soils.Its presence in natural materials may be detectedprincipally by high-resolution SEM/TEM studies onmagnetic mineral extracts. However, certain inter-parametric ratios like χARM/χlf and χARM/χfd have beenused to detect the presence of bacterial magnetite(Oldfield, 1994). If the χARM/χlf value is < 40 and theχARM/χfd value < 1000, bacterial magnetite is absent(Oldfield, 1994, 2007). Oldfield (1994) proposed a biplotof χARM/χlf vs. χARM/χfd to distinguish between avariety of sources of magnetic minerals present innatural materials (Fig. 4). Almost all the PK soil samplesfall in the envelope for “soil, paleosol and catchment-derived fine sediments” and none in the “bacterialmagnetite” field. Based on the afore-mentionedreasons, the magnetic enhancement documented in thePK soil samples may be attributed to pedogenesis.Asmentioned earlier, pedogenic enhancement of soils isgoverned principally by rainfall in the tropics. Thus,the climatic signal is imprinted in the pedogeniccomponent of the catchment soil samples (Vidic et al.,2000).The inter-parametric ratios, χARM/SIRM and χARM/χlf, are suggestive of magnetic grain size: higher valuesindicate finer magnetic grain size and vice versa (Fig.2; Dearing et al., 1997; King et al., 1982). The ratiovalues exhibit considerable fluctuations in the profile.They peak at the profile-top, indicating a finer magneticgrain size in the top-soil, substantiating theinterpretation based on concentration-dependentparameters.
The ratio of IRM300mT to SIRM, commonly referredto as the S-ratio, is indicative of the relative proportionsof the ferrimagnetic and antiferromagnetic componentsin a sample (Thompson and Oldfield, 1986; Heslop,2009). Ferrimagnetic minerals like magnetite have an S-ratio value close to unity because they acquire mostof the remanence at field strengths < 300mT.Antiferromagnetic minerals like hematite and goethiteexhibit lower values because they would not havesaturated at 300mT field strength. The S-ratio valuesof the PK soil profile vary between 0.86 and 0.95,indicating the predominance of magnetically “soft”minerals like magnetite. The top two samples exhibitthe highest value of 0.95, confirming the presence of
magnetically “soft” minerals like magnetite at theprofile-top. The parameter HIRM is proportional to theconcentration of magnetically “hard” minerals likehematite and goethite (Thompson and Oldfield, 1986;Walden, 1999b). Hence, the down-profile variations ofS-ratio and HIRM exhibit opposite trends (Fig. 2), withslightly lower HIRM values for the top samples. IRMacquisition curves (Fig. 5) show that the samples(except a few) saturate at a field of ~ 300 mT, againindicating the soft magnetic mineralogy.
Samples of surface soil (n=12) from the catchmentarea too exhibit χlf values in the range of 107 to 726 x 10-
8m3kg-1. Frequency-dependent susceptibility rangesfrom 5.3 to 59.4 x 10⁻⁸m3kg-1. The very high values ofthe two concentration-dependent parameters also beartestimony to the magnetic enhancement of top soil inthe lake catchment.The surface soil samples werecollected during November 2007, barely two monthsafter the southwest monsoon. Despite this, they stillbear the imprint of magnetic enhancement althoughconsiderable erosion (and subsequent deposition onthe lake bed) would have taken place because of heavyrainfall (~ 4000 mm / year) prior to sample collection.This shows that a short time is enough for the formationof pedogenic magnetite and magnetic enhancement ofsurface soil. Maher and Thompson (1995), from theirstudies of the Chinese loess and palaeosol sequence,reported that pedogenic susceptibility is a rapidlyformed soil property. Taylor et al. (1987) synthesizedfine and ultra-fine grained magnetite (of SP and SDsize) under pH and temperature conditions which areanalogous to the natural soil environment. Theyreported that the time taken for magnetite formationvaried from 36 to 2720 minutes depending upon pH,temperature, airflow and initial Fe2+ and Fe3+
concentrations. Our soil magnetic studies in the PookotLake catchment confirm that magnetic enhancementand formation of pedogenic magnetite are rapid.
Surface and sub-surface soil samples from thecatchment area of Shantisagara (SS)
The environmental magnetic data for the soil profile(n=23) from the Shatisagara catchment are plotted inFig. 6. The profile may be divided into two zones basedon the magnetic data: Zone 1 (0-35 cm) where theconcentration-dependent parameters (χlf, χARM andSIRM) exhibit relatively high values and Zone 2 (39-102 cm) where these parameters exhibit relatively lowvalues. Samples from Zone 1 exhibit χlf values varyingfrom 455 to 732 x 10-8m3kg-1 (average = 583.7 x 10⁻⁸m3kg-
1); Zone 2 has χlf values in the range of 92.5 to 452.4 x10⁻⁸m3kg-1 (average = 272.5 x 10⁻⁸m3kg-1). Similarly, theaverage χfd values for Zone 1 and Zone 2 are 56.2 and29.2 x 10-8m3kg-1 respectively. The average χARM values
7
Int. J. Environ. Res., 6(1):1-18, Winter 2012
Fig. 3. The biplot of χARM/SIRM vs.χfd % for soil samples from Pookot (PK), Shantisagara (SS),Thimmannanayakanakere (TK), Ayyanakere (AK) and Kurburkere (KK). Note: The magnetic grain size ofsurface and sub-surface samples of PK is not significantly different (a). MD+PSD grains characteristic of
anthropogenic activity are absent except in a lone sample (b). Although both surface and sub-surface samplesexhibit grain size in the coarse SSD range, the former are slightly coarser and the latter finer (SSD/SP
transition range) with a higher concentration of SP grains in TK samples (c). The AK surface and sub-surfacesamples have a similar grain size (fine SSD & mixtures and SSD/SP transition; d). The KK surface and sub-
surface samples have similar grain size (coarse SSD and fine SSD & mixtures), however, the surface soilsamples from the catchment have < 10 % contribution from SP grains
are 2.8 and 1.4 x 10⁻⁵ m3 kg-1 for Zone 1 and Zone 2respectively.The grain size plot of χfd % vs. χARM/SIRM (Fig. 3)indicates that MD+PSD grains are absent in SS soils.Hence, the presence of anthropogenic magnetite maybe ruled out. χARM/χlf values of < 40 and χARM/χfd valuesof < 1000 indicate the absence of bacterial magnetite inthe soil samples (Fig. 4).
Although the concentration-dependent parametervalues increase at the profile-top, they do not registera sharp peak as in the Pookot soil profile. There maybe two reasons for this. 1) Due to lessivage, the newlyformed magnetic minerals may have percolated todeeper horizons, creating a thick, magneticallyenhanced profile (Fine et al., 1989). Hence, the entireZone 1 may be considered as magnetically enhanced.
8
Rock samples from five lake catchments
Fig. 4. The biplot of χARM/χlf vs. χARM/χfd for soil samples from the five locations. Note: χARM/χlf values of < 40and χARM/χfd values of < 1000 indicate the absence of bacterial magnetite
2) Erosion of the magnetically enhanced top-soil. TheχARM and χfd values also exhibit similar trends and showstatistically significant correlation coefficients of 0.92and 0.93 (p < 0.001; n= 23) respectively with χlf,indicating that magnetic susceptibility is mainlycontrolled by the ultra-fine, pedogenic component.
The inter-parametric ratios, χARM/SIRM and χARM/χlf, which indicate magnetic grain size, do not varymarkedly between the two zones. In fact, the formerexhibits a decreasing trend towards the profile-top. Thissituation may arise due to significant lessivage of finemagnetic minerals. Values of S-ratio vary between 0.89and 0.96, indicating the predominance of magneticallysoft minerals. This is confirmed by IRM acquisitioncurves, which demonstrate that the samples getsaturated at a field of ~ 300 mT (Fig. 5). But there is nosignificant difference in the S-ratio values for Zone 1and Zone 2. HIRM ranges from 26.4 to 519.2 x 10⁻⁸ m3
kg-1 and exhibits slightly higher values in Zone 1.
Other surface soil samples (n=10) from thecatchment area exhibit χlf values in the range of 66-502.4 x 10⁻⁸ m3 kg-1 (average = 282.4 x 10⁻⁸ m3 kg-1). Values
of χfd range from 2.6 to 44.9 x 10⁻⁸ m3 kg-1 (average = 20.9x 10⁻⁸ m3 kg-1). The high values of both the parametersdemonstrate magnetic enhancement of the top-soil(Maher and Taylor, 1988).
Surface and sub-surface soil samples from thecatchment of Thimmannanayakanakere (TK)
The 1-m deep soil profile (n=24) developed ongneissic lithology in the TK catchment is moderate tostrongly magnetic, with χlf values ranging between93.08 and 592.83 x 10⁻⁸m3kg-1, χfd between 11.09 and82.65 x 10-8m3kg-1, χARM between 0.78 and 3.70 x 10-
5m3kg-1 and SIRM between 551.51 and 2195.66 x 10-
5Am2kg-1 (Fig. 7). The magnetic minerals aremagnetically “soft”, as suggested by the S-ratio values(close to 0.94; Fig.7) and by IRM acquisition curves(IRM’s getting almost saturated at 300 mT field; Fig.5c). However, the presence of small amounts of goethiteor hematite is also indicated, as the IRM values continueto increase even at 1 T field for a few samples (Fig. 5).The high χfd % (> 11) suggests a high concentration ofSP grains. MD + PSD magnetic grains characteristic of
9
Int. J. Environ. Res., 6(1):1-18, Winter 2012
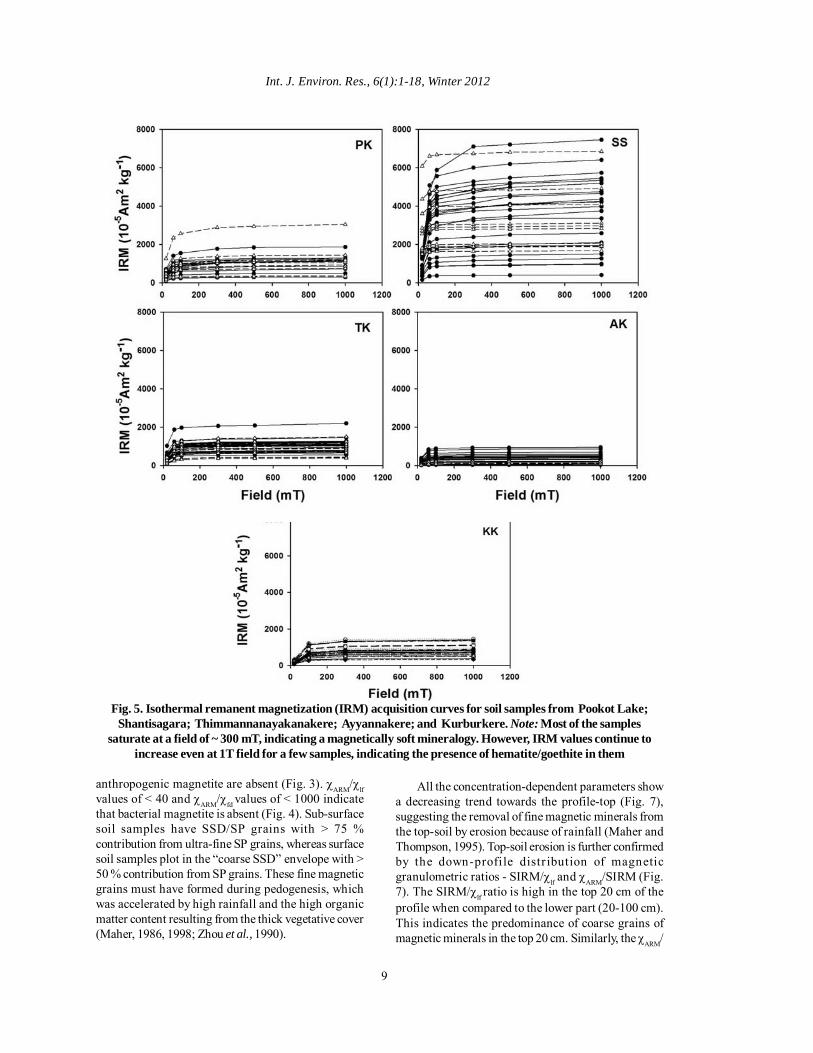
Fig. 5. Isothermal remanent magnetization (IRM) acquisition curves for soil samples from Pookot Lake;Shantisagara; Thimmannanayakanakere; Ayyannakere; and Kurburkere. Note: Most of the samples
saturate at a field of ~ 300 mT, indicating a magnetically soft mineralogy. However, IRM values continue toincrease even at 1T field for a few samples, indicating the presence of hematite/goethite in them
anthropogenic magnetite are absent (Fig. 3). χARM/χlfvalues of < 40 and χARM/χfd values of < 1000 indicatethat bacterial magnetite is absent (Fig. 4). Sub-surfacesoil samples have SSD/SP grains with > 75 %contribution from ultra-fine SP grains, whereas surfacesoil samples plot in the “coarse SSD” envelope with >50 % contribution from SP grains. These fine magneticgrains must have formed during pedogenesis, whichwas accelerated by high rainfall and the high organicmatter content resulting from the thick vegetative cover(Maher, 1986, 1998; Zhou et al., 1990).
All the concentration-dependent parameters showa decreasing trend towards the profile-top (Fig. 7),suggesting the removal of fine magnetic minerals fromthe top-soil by erosion because of rainfall (Maher andThompson, 1995). Top-soil erosion is further confirmedby the down-profile distr ibution of magneticgranulometric ratios - SIRM/χlf and χARM/SIRM (Fig.7). The SIRM/χlf ratio is high in the top 20 cm of theprofile when compared to the lower part (20-100 cm).This indicates the predominance of coarse grains ofmagnetic minerals in the top 20 cm. Similarly, the χARM/
10
Sandeep, K. et al.
Fig. 6. Rock magnetic parameters and inter-parametric ratios for a soil profile developed on chlorite schist inthe Shantisagara Lake (SS) catchment. Note: The profile may be divided into two zones based on magnetic
parameters. Zone 1 is typified by relatively higher values of concentration-dependent parameters (χlf, χfd, χARM
and SIRM) and Zone 2 by lower values
Fig. 7. Rock magnetic parameters and inter-parametric ratios for a soil profile developed on granite gneiss inthe Thimmannanayakanakere (TK) catchment. Note: The data do not indicate any magnetic enhancement at
the surface, which may be due to soil erosion. It appears that the increasing values of concentration dependentparameters towards the profile-bottom is an artifact of soil erosion
SIRM ratio is low in the top 20 cm, suggesting coarsermagnetic grains. During periods of high rainfall, finegrained magnetic minerals would have been washedaway, while the soil profile itself was enriched inmagnetic minerals of coarser grain size. The TK surfaceand sub-surface soil samples were collected in earlyJuly 2006, when the southwest monsoonal rainfall wasactive, which would have washed away the fine
magnetic minerals from the catchment to the lake-bed.The increase in susceptibility values at deeper horizonsof the soil profile may be due to two reasons: i) presenceof magnetite/maghemite which may have been inheritedfrom the weathered parent rock (Jordanova et al., 2011);ii) lessivage of fine-grained magnetic minerals formedduring pedogenesis. The first reason can be ruled outas the soil profile is hosted on a granitic gneiss rock
11
Int. J. Environ. Res., 6(1):1-18, Winter 2012
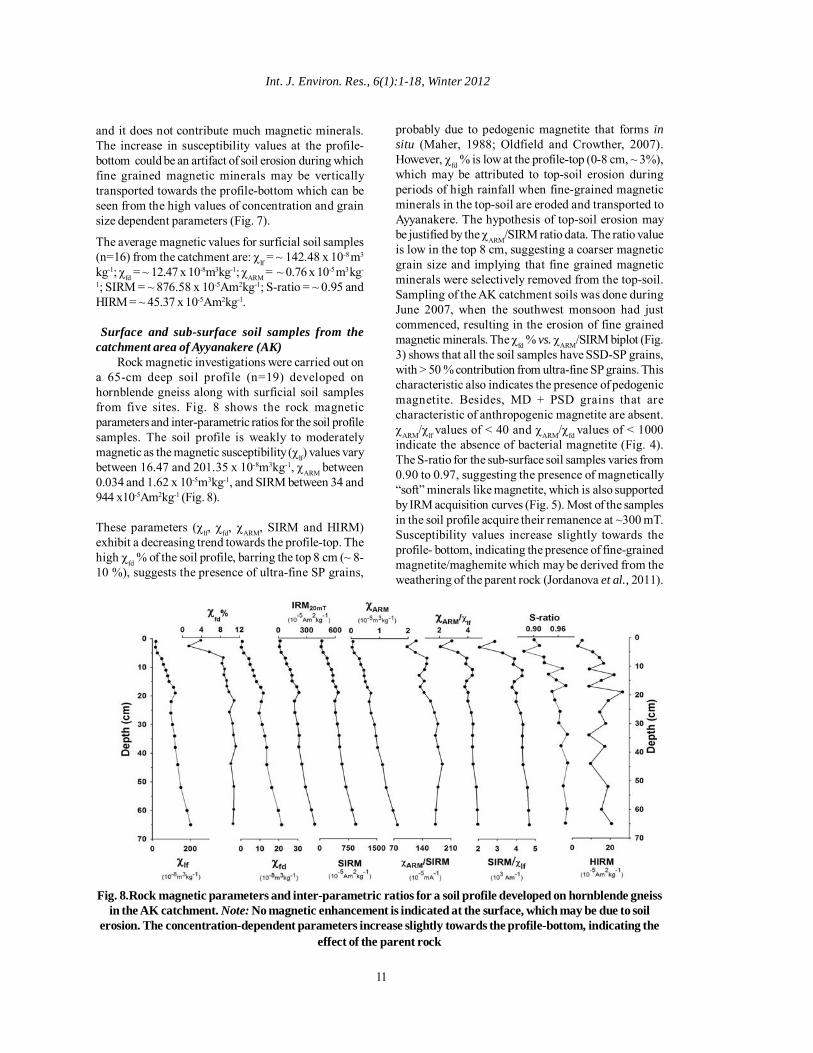
probably due to pedogenic magnetite that forms insitu (Maher, 1988; Oldfield and Crowther, 2007).However, χfd % is low at the profile-top (0-8 cm, ~ 3%),which may be attributed to top-soil erosion duringperiods of high rainfall when fine-grained magneticminerals in the top-soil are eroded and transported toAyyanakere. The hypothesis of top-soil erosion maybe justified by the χARM/SIRM ratio data. The ratio valueis low in the top 8 cm, suggesting a coarser magneticgrain size and implying that fine grained magneticminerals were selectively removed from the top-soil.Sampling of the AK catchment soils was done duringJune 2007, when the southwest monsoon had justcommenced, resulting in the erosion of fine grainedmagnetic minerals. The χfd % vs. χARM/SIRM biplot (Fig.3) shows that all the soil samples have SSD-SP grains,with > 50 % contribution from ultra-fine SP grains. Thischaracteristic also indicates the presence of pedogenicmagnetite. Besides, MD + PSD grains that arecharacteristic of anthropogenic magnetite are absent.χARM/χlf values of < 40 and χARM/χfd values of < 1000indicate the absence of bacterial magnetite (Fig. 4).The S-ratio for the sub-surface soil samples varies from0.90 to 0.97, suggesting the presence of magnetically“soft” minerals like magnetite, which is also supportedby IRM acquisition curves (Fig. 5). Most of the samplesin the soil profile acquire their remanence at ~300 mT.Susceptibility values increase slightly towards theprofile- bottom, indicating the presence of fine-grainedmagnetite/maghemite which may be derived from theweathering of the parent rock (Jordanova et al., 2011).
Fig. 8.Rock magnetic parameters and inter-parametric ratios for a soil profile developed on hornblende gneissin the AK catchment. Note: No magnetic enhancement is indicated at the surface, which may be due to soil
erosion. The concentration-dependent parameters increase slightly towards the profile-bottom, indicating theeffect of the parent rock
and it does not contribute much magnetic minerals.The increase in susceptibility values at the profile-bottom could be an artifact of soil erosion during whichfine grained magnetic minerals may be verticallytransported towards the profile-bottom which can beseen from the high values of concentration and grainsize dependent parameters (Fig. 7).
The average magnetic values for surficial soil samples(n=16) from the catchment are: χlf = ~ 142.48 x 10⁻⁸ m3
kg-1; χfd = ~ 12.47 x 10⁻⁸m3kg-1; χARM = ~ 0.76 x 10⁻⁵ m3 kg-
1; SIRM = ~ 876.58 x 10⁻⁵Am2kg-1; S-ratio = ~ 0.95 andHIRM = ~ 45.37 x 10⁻⁵Am2kg-1.
Surface and sub-surface soil samples from thecatchment area of Ayyanakere (AK)
Rock magnetic investigations were carried out ona 65-cm deep soil profile (n=19) developed onhornblende gneiss along with surficial soil samplesfrom five sites. Fig. 8 shows the rock magneticparameters and inter-parametric ratios for the soil profilesamples. The soil profile is weakly to moderatelymagnetic as the magnetic susceptibility (χlf) values varybetween 16.47 and 201.35 x 10⁻⁸m3kg-1, χARM between0.034 and 1.62 x 10⁻⁵m3kg-1, and SIRM between 34 and944 x10-5Am2kg-1 (Fig. 8).
These parameters (χlf, χfd, χARM, SIRM and HIRM)exhibit a decreasing trend towards the profile-top. Thehigh χfd % of the soil profile, barring the top 8 cm (~ 8-10 %), suggests the presence of ultra-fine SP grains,
12
As the parent rock is hornblende gneiss, it contributessome ferromagnesian minerals due to weatheringprocesses.
The average magnetic values for the surficial soilsamples (n=4) are: χlf = ~ 31 x 10-8m3kg-1; χfd % = ~ 6;χARM = ~ 0.22 x 10⁻⁵ m3kg-1; SIRM = ~ 148 x 10-5 Am2kg-
1; S-ratio = ~ 0.94 and HIRM = ~ 8.59 x 10⁻⁵ Am2kg-1.Unlike subsurface samples, the surficial samples donot saturate at 300 mT but show an increasing trend athigh magnetic fields as well (Fig. 5), indicating thepresence of magnetically “hard” minerals like hematiteand goethite. Besides, they exhibit low SIRM valuestoo as hematite and goethite are not as stronglymagnetic as magnetite (Walden et al., 1999).
Surface and sub-surface soil samples from thecatchment area of Kurburkere (KK)
Rock magnetic investigations were carried out ona 130-cm deep soil profile (n=28) developed onmigmatite, besides three samples of surficial soil fromthe lake catchment. Fig. 9 displays the down-profilevariations of rock magnetic parameters and inter-parametric ratios for the KK soil profile. The soil profileis moderately magnetic as the magnetic susceptibility(χlf) values vary between 62.12 and 285.68 x 10⁻⁸m3kg-1,χARM between 0.107 and 0.493 x 10⁻⁵m3kg-1, and SIRMbetween 332 and 1361 x10-5Am2kg-1 (Fig. 9).
Based on the magnetic data, the KK profile may bedivided into two zones. The lower zone (Zone 1; 130 to
50 cm) shows upwardly increasing values of χfd, χARM,IRM20mT and SIRM indicating a slight magneticenhancement. However, χlf does not show any notablevariations. Further, this zone exhibits a slightly higherχfd % (~ 4.6 %) compared to the upper zone (Zone 2; 50to 0 cm; χfd % ~ 3.8 %), suggesting a marginally highercontent of ultrafine SP grains. Similarly, the grain sizerelated ratios - χARM/SIRM and χARM/χlf also register anupward gradual increase, suggesting a fining of themagnetic grain size. The afore-said features of upwardlyincreasing magnetic mineral concentration anddecreasing magnetic grain size demonstrate the effectof pedogenesis.
The upper zone (50 to 0 cm) also shows upwardlyincreasing χlf, IRM20mT, SIRM and HIRM values,suggesting magnetic enhancement of top-soil.However, χfd and χARM values decrease towards thesurface. Therefore, it appears that the magneticenhancement here is because of coarse SD grains and“hard” magnetic minerals like haematite and goethite.Erosion of fine magnetic grains from the top-soil isindicated by upwardly decreasing values of χfd andχARM.The interpretations presented above arereinforced by Fig. 3. A majority of the subsurfacesamples have coarse and fine SSD grain size, with <50% contribution from ultra-fine SP grains. By contrast,the surface samples have a coarse SSD grain size, withonly <10 % contribution coming from SP grains, owingto erosion of fine magnetic grains from the catchment.MD + PSD grains that are character istic of
Fig. 9. Rock magnetic parameters and inter-parametric ratios for a soil profile developed on migmatite in theKK catchment. Note: The values of concentration-dependent parameters increase slightly towards the profile-
top, suggesting only a weak magnetic enhancement
Rock samples from five lake catchments
anthropogenic magnetite are absent in the KK soilsamples. χARM/χlf values of < 40 and χARM/χfd values of< 1000 indicate the absence of bacterial magnetite (Fig.4). The S-ratio for the sub-surface soil samples variesfrom 0.94 to 0.98, indicating a magnetically “soft”mineralogy, which is corroborated by IRM acquisitioncurves (Fig. 5). Almost all the samples in the soil profileas well as the surficial soil samples from the catchmentacquire their remanence at ~300 mT. The averagemagnetic values for the three surficial soil samplesare: χlf = ~ 313 x 10-8m3kg-1; χfd % = ~ 1; χARM = ~ 0.32 x10⁻⁵ m3kg-1; SIRM = ~ 1421 x 10-5 Am2kg-1; S-ratio = ~0.96 and HIRM = ~ 55.06 x 10⁻⁵ Am2kg-1.
A comparison of the magnetic properties of surfaceand sub-surface soil samples from the five catchments
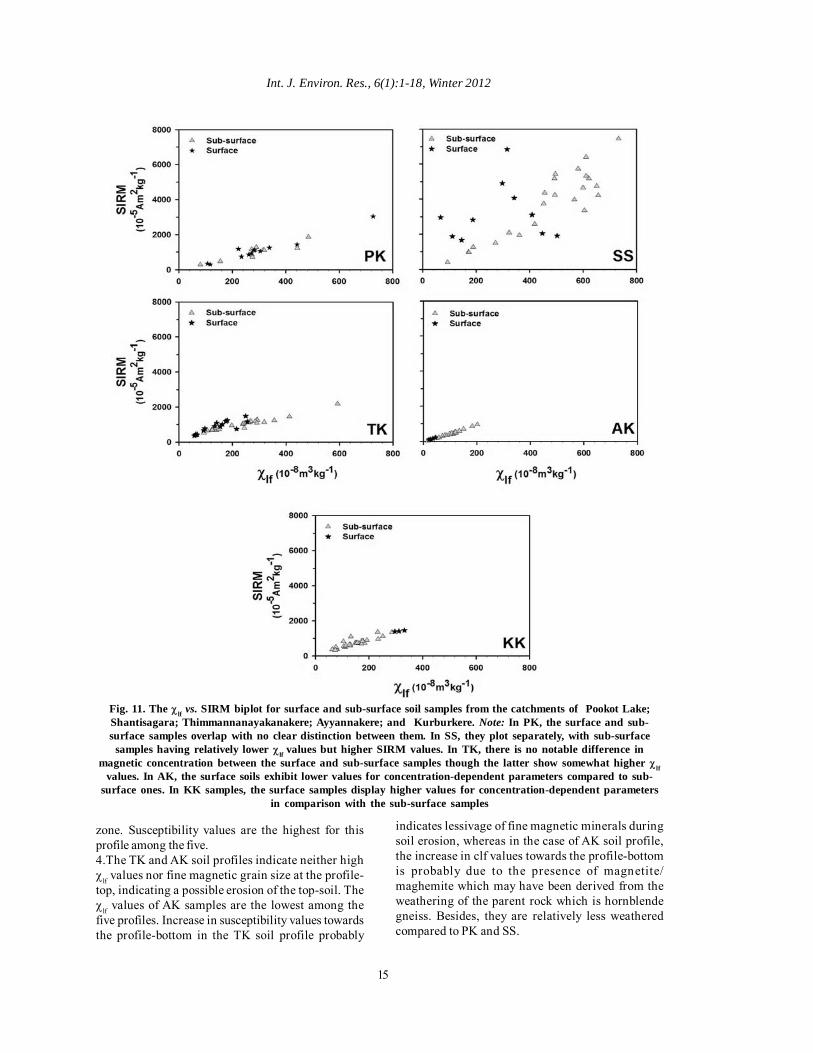
Fig. 10 is a plot of the magnetic susceptibility ofthe five soil profiles studied. The AK soil profile (parentrock: hornblende gneiss; mean annual rainfall: ~ 1925mm) has the lowest χlf values. The TK, PK and KKprofiles developed on granitic gneiss, hornblende-biotite gneiss and migmatite respectively have similarχlf values, except the top part where the PK soil profilehas slightly higher values. This is surprising becausePK catchment receives a much higher mean annualrainfall (~ 4000 mm) compared to TK (~ 638 mm) andKK (~ 770 mm). The SS profile from a rainfall regime of~ 795 mm exhibits the highest susceptibility valuesamong the five profiles. In the TK profile, and to alesser degree AK profile, the susceptibility valuesincrease towards the profile-bottom. As discussed inSections 3.3 and 3.4, this may be due to the derivationof magnetic minerals from the weathering of parentrocks.The concentration-dependent parameters like χlfand SIRM do not exhibit any remarkable differencebetween PK surface and sub-surface samples. Thebiplot of χlf vs. SIRM (Fig. 11) shows that the valuesfor surface and subsurface samples overlap. Similarly,there is no notable difference in the magnetic grainsize of surface and sub-surface samples of PK. Theyare mainly in the range of fine SSD & mixtures andSSD/SP transition (Fig. 3). Only a few samples havecoarse SSD grain size. This indicates the deeplyweathered nature of the PK soil profile, resulting in noappreciable difference in the magnetic grain sizebetween surface and sub-surface soils. The S-ratio vs.χlf biplot (Fig. 12) indicates that there is no profounddifference in terms of magnetic mineralogy as well. Butwhen samples from a single profile are considered, thetwo surface samples exhibit higher values forconcentration-dependent parameters and hence havea fine magnetic grain size and a soft magneticmineralogy as discussed in Section 3.1.
The SS surface soil samples plot separately incomparison with sub-surface ones, with relativelylower χlf, but higher SIRM values (Fig. 11). Both surfaceand sub-surface samples exhibit a grain size in thecoarse SSD range (Fig. 3), with the former displaying aslightly coarser magnetic grain size (with a lower χfd %,indicating a lower concentration of SP grains). As nosample plots in the SSD/SP transition, it may beassumed that the finer grains have been eroded awayor have percolated downwards due to lessivage asdiscussed in Section 3.2. Their magnetic mineralogy isalso distinct, with surface soil samples having a softermagnetic mineralogy (S-ratio > 0.96) and the sub-surface ones having a relatively higher contributionfrom magnetically hard minerals.
The TK surface and subsurface soil samples, cannot be distinguished on the basis of either the χlf vs.SIRM plot (Fig. 11) or down-profile variations ofmagnetic concentration (Fig. 10). But there is a cleardistinction in their magnetic grain size. The surfacesamples display a relatively coarse magnetic grain size(coarse SSD range) with a low concentration of SPgrains (low χfd %; Fig. 3). The sub-surface samples, onthe other hand, exhibit a finer magnetic grain size (SSD/SP transition range) with a higher concentration of SPgrains (higher χfd %). The presence of coarse magneticgrains may be indicative of top-soil erosion. Thesurface and sub-surface soil samples do not exhibitnotable differences in their magnetic mineralogy (Fig.12).
The AK surface soil samples exhibit lower valuesfor concentration-dependent parameters compared tothe sub-surface ones (Fig. 11). All the AK soil samplesare magnetically weak compared to those from the otherfour locations. The magnetic grain size of the surfaceand sub-surface soil samples is similar (fine SSD &mixtures and SSD/SP transition; Fig. 3). Also, there isno significant difference in magnetic mineralogy (Fig.12).
The KK soil samples are magnetically strong incomparison with those from AK, but weak incomparison with those from PK, SS and TK. The threeKK surface soil samples exhibit higher values forconcentration-dependent parameters compared to thesub-surface ones (Fig. 11). The magnetic grain size ofthe surface and sub-surface soil samples is similar(coarse SSD and fine SSD & mixtures; Fig. 3). However,the contribution of SP grains in the surface soilsamples is less than 10 %, which could be due to theerosion of the fine SP grains during periods of highrainfall. The magnetic mineralogy of the surface andsub-surface soil samples of KK is not different (Fig.12) and is similar to that of TK soil samples.
13
Int. J. Environ. Res., 6(1):1-18, Winter 2012
Fig. 10. A comparison of the down-profile variations of χlf values for the five soil profiles from PK, SS, TK, AKand KK catchments. Note: The number above each curve is the mean annual rainfall. TK and PK samples
exhibit similar χlf values, except for the top part where the latter shows slightly higher values. SS samplesgenerally exhibit the highest χlf values among the five profiles
CONCLUSIONSWe draw the following conclusions based on rockmagnetic investigations of surface and sub-surface soilsamples from the catchments of five lakes in SouthernIndia: Pookot (PK), Shantisagara (SS),Thimmannanayakanakere (TK), Ayyanakere (AK) andKurburkere (KK):
1.Soil samples from the five profiles do not have anycontributions from bacterial magnetite, greigite andanthropogenic sources. The magnetic minerals arecatchment-derived and hence bearing a climate-related
signal; they are mainly pedogenic and to a smallerextent lithogenic. In view of this, the soils showprospects of use in palaeoclimatic studies through soil-lake sediment linkages.2.The PK soil profile exhibits magnetic enhancementof the top-soil even though the samples were collectedin November 2007, hardly two months after the SWmonsoon, indicating that pedogenic magnetite can formrapidly.3.The SS soil profile indicates lessivage of magneticminerals, producing a thick magnetically enhanced
Sandeep, K. et al.
14
Fig. 11. The χlf vs. SIRM biplot for surface and sub-surface soil samples from the catchments of Pookot Lake;Shantisagara; Thimmannanayakanakere; Ayyannakere; and Kurburkere. Note: In PK, the surface and sub-surface samples overlap with no clear distinction between them. In SS, they plot separately, with sub-surface
samples having relatively lower χlf values but higher SIRM values. In TK, there is no notable difference inmagnetic concentration between the surface and sub-surface samples though the latter show somewhat higher χlf
values. In AK, the surface soils exhibit lower values for concentration-dependent parameters compared to sub-surface ones. In KK samples, the surface samples display higher values for concentration-dependent parameters
in comparison with the sub-surface samples
zone. Susceptibility values are the highest for thisprofile among the five.4.The TK and AK soil profiles indicate neither highχlf values nor fine magnetic grain size at the profile-top, indicating a possible erosion of the top-soil. Theχlf values of AK samples are the lowest among thefive profiles. Increase in susceptibility values towardsthe profile-bottom in the TK soil profile probably
indicates lessivage of fine magnetic minerals duringsoil erosion, whereas in the case of AK soil profile,the increase in clf values towards the profile-bottomis probably due to the presence of magnetite/maghemite which may have been derived from theweathering of the parent rock which is hornblendegneiss. Besides, they are relatively less weatheredcompared to PK and SS.
15
Int. J. Environ. Res., 6(1):1-18, Winter 2012
Fig. 12. S-ratio vs. χlf for soil samples from the catchments of Pookot Lake; Shantisagara;Thimmannanayakanakere; Ayyannakere; and Kurburkere. Samples from PK, TK, AK and KK do
not have profound differences in their magnetic mineralogy. In SS, the magnetic mineralogy isdistinct, with the surface soil samples having a soft magnetic mineralogy (S-ratio > 0.96), and the
sub-surface ones having a relatively higher contribution from hard magnetic minerals
5.There is no remarkable difference between surfaceand sub-surface soil samples of PK in terms ofmineralogy, grain size and concentration of magneticminerals, indicating the deeply weathered nature ofthe profile as a result of heavy rainfall.6.The TK and PK soil samples exhibit similar χlf valuesdespite differences in rainfall in the respectivecatchments.7.Like SS samples, the KK soil samples also showlessivage of magnetic minerals, albeit to a lesser extent.
ACKNOWLEDGEMENTSKS, AKW and BGH thank the University Grants
Commission (UGC), the Indian Space ResearchOrganization (ISRO), the Council of Scientific andIndustrial Research (CSIR) and the Department ofScience and Technology, Government of India,respectively for financial assistance in the form ofJunior / Senior Research Fellowships. The Departmentof Space and the Department of Science andTechnology, Government of India, supported this workthrough research projects to RS (“Paleoclimate of the
Rock samples from five lake catchments
16
past few centuries from lake- and tank-bed sedimentsof Southern India”; ISRO-GBP/WG-1 Sanction No. 9/5/2/2004-II) under the Geosphere-Biosphere Programand “Magnetic studies of soils from Southern India”;Sanction No. SR/S4/ES-48/2003 dated 29.01.2004).” Themagnetic instruments used in this study were procuredfrom grants made available by the erstwhile Departmentof Ocean Development (now Ministry of EarthSciences), Government of India, through a researchproject to RS. Avinash Kumar kindly helped inpreparing the location map. We thank the reviewer forhis suggestions to improve the manuscript.
REFERENCESBlaha, U., Sapkota, B., Appel, E., Stanjek, H. and Rosler,W. (2008). Micro-scale grain-size analysis and magneticproperties of coal-fired power plant fly ash and its relevancefor environmental magnetic pollution studies. Atmos.Environ., 42, 8359-8370.
Bloemendal, J. and Liu, X. (2005). Rock magnetism andgeochemistry of two Plio–Pleistocene Chinese loess–palaeosol sequences - implications for quantitativepalaeoprecipitation reconstruction. Palaeogeogr.Palaeoclimatol. Palaeoecol., 226, 149-166.
Blundell, A., Dearing, J.A., Boyle, J.F. and Hannam, J.A.(2009). Controlling factors for the spatial variability of soilmagnetic susceptibility across England and Wales. Earth Sci.Rev., 95, 158-188.
Cornell, R. and Schwertmann, U. (2003). The Iron Oxides:Structure, Properties, Reactions, Occurrence and Uses.Weinheim, New York, 703p.
Dearing, J. A. (1999). Magnetic susceptibility. In: Walden,J., Smith, J.P., Oldfield, F. (Eds.), Environmental Magnetism- a practical guide. Technical Guide, no. 6, QuaternaryResearch Association, London. 35-62.
Dearing, J.A., Bird, P.M., Dann, R.J.L. and Benjamin, S.F.(1997). Secondary ferromagnetic minerals in Welsh soils: acomparison of mineral magnetic detection methods andimplications for mineral formation. Geophys. J. Int., 130,727-736.
Dearing, J.A., Dann, R.J.L., Hay, K., Lees, J.A., Loveland,P.J., Maher, B.A. and O’Grady, K.O. (1996). Frequencydependent susceptibility measurements of environmentalmaterials. Geophys. J. Int.,124, 228-240.
Evans, M.E. and Heller, F. (2003). Environmentalmagnetism: Principles and applications of enviromagnetics.San Diego, USA: Academic Press, 299p.
Fassbinder, J., Stanjek, H. and Vali, H. (1990). Occurrenceof magnetic bacteria in soil. Nature, 343, 161-163.
Fine, P., Singer, M., La Ven, R., Verosub, K. and Southard,R. (1989). Role of pedogenesis in distribution of magneticsusceptibility in two California chronosequences. Geoderma,44, 287-306.
Foster, I.D.L., Oldfield, F., Flower, R.J. and Keatings, K.(2008). Mineral magnetic signatures in a long core from LakeQarun, Middle Egypt. J. Paleolim., 40, 835-849.
Gautam, P., Blaha, U., Appel, E. and Neupane, G. (2004).Environmental magnetic approach towards the quantificationof pollution in Kathmandu urban area, Nepal. Phys. Chem.Earth, 29, 973-984.
Gazetteer of India (1985). Karnataka State - ChitradurgaDistrict. Government of Karnataka, Bangalore, Director ofPrinting, Stationary and Publications at the GovernmentPress. 469p.
Gazetteer of India (1965). Karnataka State - ChikkamagalurDistrict. Government of Karnataka, Bangalore, Director ofPrinting, Stationary and Publications at the GovernmentPress. 486p.
Geiss, C.E., Egli, R. and Zanner, C.W. (2008). Directestimates of pedogenic magnetite as a tool to reconstructpast climates from buried soils. J. Geophys. Res., 113,B11102, doi: 10.1029/2008JB005669.
Guyodo, Y., LaPara, T.M., Anschutz, A.J., Lee Penn, R.,Banerjee, S.K., Geiss, C.E. and Zanner, W. (2006). Rockmagnetic, chemical and bacterial community analysis of amodern soil from Nebraska. Earth Planet. Sci. Lett., 251,168-178.
Heslop, D. (2009). On the statistical analysis of the rockmagnetic S-ratio. Geophys. J. Int., 178, 159-161.
India Meteorological Department (2008). Rainfall data forVythiri station. Government of India.
India Meteorological Department (2005). Rainfall data forChitradurga, Chikkamagalur, Chintamani and Davanagerestation. Government of India.
Jordanova, N., Jordanova, D. and Petrov, P. (2011). Magneticimprints of pedogenesis in Planosols and Stagnic Alisol fromBulgaria. Geoderma, 160, 477-489.
King, J.W., Banerjee, S.K., Marvin, J. and Õzdemir, Õ.(1982). A comparison of different magnetic methods fordetermining the relative grain size of magnetite in naturalmaterials: Some results from lake sediments. Earth Planet.Sci. Lett., 59, 404-419.
Kerala Forest Department (2004). Working plan report ofSouth Wayanad forest division. Department of Forests,Thiruvananthapuram, Government of Kerala.
Kletetschka, G. and Banerjee, S. K. (1995). Magneticstratigraphy of Chinese loess as a record of natural fires.Geophys. Res. Lett., 22, 1341-1343.
Le Borgne, E. (1955). Susceptibilite magnetique anormaledu sol superficial. Ann. Geophys., 11, 811–814.
Maher, B., Alekseev, A. and Alekseeva, T. (2003). Magneticmineralogy of soils across the Russian Steppe: climaticdependence of pedogenic magnetite formation. Palaeogeogr.Palaeoclimatol. Palaeoecol., 201, 321-341.
Maher, B.A. (1998). Magnetic properties of modern soilsand Quaternary loessic paleosols: paleoclimatic implications.Palaeogeogr. Palaeoclimatol. Palaeoecol., 137, 25-54.
Maher, B.A. (1986). Characterisation of soils by mineralmagnetic measurements. Phys. Earth and Planet. Int., 42,76-92.
17
Int. J. Environ. Res., 6(1):1-18, Winter 2012
Maher, B.A. (1988). Magnetic properties of some syntheticsubmicron magnetites. Geophys. J., 94, 83-96.Maher, B.A. and Taylor, R.M. (1988). Formation ofultrafine-grained magnetite in soils. Nature, 336, 368-370.
Maher, B.A. and Thompson, R. (1995). Palaeorainfallreconstruction from pedogenic magnetic susceptibilityvariations in the Chinese loess and paleosols. Quat. Res.,44, 383-391.
Maiti, S., Meena, N.K., Sangode, S.J. and Chakrapani, G.J.(2005). Magnetic susceptibility studies of soils in Delhi. J.Geol. Soc. India, 66, 667-672.
Meena, N.K., Maiti, S. and Shrivastava, A. (2011). Discriminationbetween anthropogenic (pollution) and lithogenic magnetic fractionin urban soils (Delhi, India) using environmental magnetism. J.Appl. Geophys., 73 (2), 121-129.
Oldfield, F. (1991). Environmental Magnetism - A personalperspective. Quat. Sci. Rev., 10, 73-85.
Oldfield, F. (1994). Toward the discrimination of fine grainedferrimagnets by magnetic measurements in lake and near-shore marine sediments. J. Geophys. Res., 99, 9045-9050.
Oldfield, F. (2007). Sources of fine grained magnetic mineralsin sediments: a problem revisited. The Holocene, 17(8),1265-1271.
Oldfield, F. and Crowther, J. (2007). Establishing fireincidence in temperate soils using magnetic measurements.Palaeogeogr. Palaeoclimatol. Palaeoecol., 249, 362-369.
Orgeira, M.J., Walther, A.M., Tofalo, R.O., Vasquez, C.,Berquo, T., Favier Dobois, C. and Bohnel, H. (2003).Environmental magnetism in fluvial and loessic Holocenesediments and paleosols from the Champean plain(Argentina). J. South Am. Earth Sci., 16, 259–274.
Ortega–Guerrero, B., Sedov, S., Solleiro–Rebolledo, E. andSoler, A. (2004). Magnetic mineralogy in the Barranca Tlalpanexposure paleosols, Tlaxcala, Mexico: Revista Mexicana deCiencias Geológicas, 21(1), 120-132.
Priya, K. (2009). Magnetic investigations of soils ofKarnataka. Unpublished Ph.D thesis, Mangalore University,Mangalore, India, 261p.
Radhakrishna, B.P. and Vaidyanadhan, R. (1997). Geologyof Karnataka. Geological Society of India, Bangalore, 353p.Sangode, S.J. and Bloemendal, J. (2004). Pedogenictransformation of magnetic minerals in Pliocene-Pleistocenepalaeosols of the Siwalik Group, NW Himalaya, India.Palaeogeogr. Palaeoclimatol. Palaeoecol., 212, 95-118.
Sangode, S.J., Kumaravel, V., Bloemendal, J. and Kumar, R.(2008). Effect of burial and compaction on soil magneticproperties: Results from soil-paleosol sequences in theHimalayan Foreland, India. Palaeogeogr. Palaeoclimatol.Palaeoecol., 267, 235-244.
Sangode, S.J., Vhatkar, K., Patil, S.K., Meshram, D.C.,Pawar, N.J., Gudadhe, S.S., Badekar, A.G. and Kumaravel,V. (2010). Magnetic susceptibility distribution in the soilsof Pune Metropolitan Region: implications to soilmagnetometry of anthropogenic loading. Curr. Sci., 98 (4),516-527.
Schwertmann, U. (1988). Occurrence and formation of ironoxides in various pedoenvironments. In: Stucki, J., Goodman,B., Schwertmann, U. (Eds.), “Iron in soils and clayminerals”, NATO ASI Series, Series C: Mathematical andPhysical Sciences, 217. Reidel Publ. Co., 267–308.
Shankar, R., Prabhu, C.N., Warrier, A.K., Vijaya Kumar,G.T. and Sekar, B. (2006). A multidecadal rock magneticrecord of monsoonal variations during the past 3700 yearsfrom a tropical Indian tank. J. Geol. Soc. India, 68, 447-459.
Shenggao, L. (2000). Lithological factors affecting magneticsusceptibility of subtropical soils, Zhejiang Province, China.Catena, 40, 359-373.
Soman, K. (1997). Geology of Kerala. Geological Societyof India, Bangalore. 280p.
Taylor, R.M., Maher, B.A. and Self, P.G. (1987). Magnetitein soils; I, The synthesis of single-domain andsuperparamagnetic magnetite. Clay Miner., 22, 411-422.
Thompson, R. and Oldfield, F. (1986). EnvironmentalMagnetism. Allen & Unwin, London, 227p.
van Dam, R. L., Harrison, B. J. and Hendrickx, J.M.H.(2005). Conceptual Model for Prediction of MagneticProperties in Tropical Soils. In: Detection and RemediationTechnologies for Mines and Mine-like Targets X, SPIEProceedings 5794, 177-187.
Vidic, N.J., Ten Pas, J.D., Verosub, K.L. and Singer, M.J.(2000). Separation of pedogenic and lithogenic componentsof magnetic susceptibility in the Chinese loess/palaeosolsequence as determined by the CBD procedure and a mixinganalysis. Geophys. J. Int., 142, 551-562.
Walden, J. F., Oldfield, F. and Smith, J. (1999). EnvironmentalMagnetism: A Practical Guide. No.6, Quaternary ResearchAssociation, London, 243p.
Walden, J. (1999a). Sample collection and preparation. In:Walden, J., Oldfield, F., Smith, J. (Eds.), Environmentalmagnetism: a practical guide. Technical Guide, no. 6,Quaternary Research Association, London, 26-34.
Wang, X., Yang, Z., Løvlie, R., Sun, Z. and Pei, J. (2006). Amagnetostratigraphic reassessment of correlation betweenChinese loess and marine oxygen isotope records over thelast 1.1 Ma. Phys. Earth and Planet. Inter., 159, 109-117.
Warrier, A. K. and Shankar, R. (2009). Geochemical evidencefor the use of magnetic susceptibility as a paleorainfall proxyin the tropics. Chem. Geol., 365 (3-4), 553-562.
Warrier, A.K., Sandeep, K., Harshavardhana, B.G., Shankar,R., Shanti Pappu, Kumar Akhilesh, Prabhu, C.N. andGunnell, Y. (2011). A rock magnetic record of Pleistocenerainfall variations at the Palaeolithic site of Attirampakkam,Southeastern India. J. Arch. Sci., 38, 3681-3693.
Zhou, L. P., Oldfield, F., Wintle, A. G., Robinson, S. G. andWang, J. T. (1990). Partly pedogenic origin of magneticvariations in Chinese loess. Nature, 346, 737-739.