ROCKY MOUNTAIN ARSENAL NATIONAL WILDLIFE REFUGE Sampling and Analysis Plan Analysis of Tissue and Tail Bulb Fat, 2014 Bison Necropsy Samples (SAP No. 2) Bison Tissue Contaminant Study Revision H – April 30, 2015 Prepared by: U.S. Fish and Wildlife Service Rocky Mountain Arsenal National Wildlife Refuge 6550 Gateway Road, Building 121 Commerce City, Colorado 80022
Transcript
ROCKY MOUNTAIN ARSENAL NATIONAL WILDLIFE REFUGE
Sampling and Analysis Plan Analysis of Tissue and Tail Bulb Fat, 2014 Bison Necropsy Samples
(SAP No. 2)
Bison Tissue Contaminant Study Revision H – April 30, 2015
Prepared by: U.S. Fish and Wildlife Service
Rocky Mountain Arsenal National Wildlife Refuge 6550 Gateway Road, Building 121 Commerce City, Colorado 80022
TABLE OF CONTENTS 1.0 INTRODUCTION ................................................................................................... 8
2.0 BACKGROUND ................................................................................................... 11 2.1 Origination of the Rocky Mountain Arsenal and the National Wildlife Refuge .. 11 2.2 Land Use Restrictions ...................................................................................... 11 2.3 RMANWR Habitat Development and Bison ..................................................... 12 2.4 Working Group ................................................................................................. 14
4.0 OBJECTIVES ..................................................................................................... 19 4.1 Data Quality Objectives and Criteria for Measurement Data ............................ 19 4.1.1 Part 1 of the DQOs: Quantification of increased cancer and non-cancer risk………. . 20 4.1.2 Part 2 of the DQOs: Tail bulb fat and tissue risk correlation ........................................26 4.2 Selection of COPCs for Analysis in Existing Bison Samples ............................ 29 4.3 Data Collection Plan ......................................................................................... 30
5.0 SAMPLE COLLECTION, PREPARATION, AND SUBMISSION ......................... 31 5.1 Sampling, Packaging, and Shipping ................................................................. 31 5.1.1 Necropsy Sampling Procedures .................................................................................31 5.1.2 Bulk Sample Storage ..................................................................................................31 5.1.3 Preparation of Subsamples for Shipment....................................................................32 5.1.4 Sample Labeling .........................................................................................................32 5.1.5 Sample Shipment .......................................................................................................32 5.2 Sample Control ................................................................................................ 33 5.2.1 Field Chain-of-Custody Procedures ............................................................................33 5.3 Quality Control of Sample Collection, Handling, and Shipment........................ 34 5.3.1 January 2014 Necropsy Samples ............................................................................. 314 5.3.2 December 2014 Necropsy Samples ......................................................................... 314
6.8 Data Package Deliverables .............................................................................. 43 6.9 Data Tracking and Control ............................................................................... 43
7.0 MEASUREMENT AND DATA ACQUISITION ..................................................... 43 7.1 Systems ........................................................................................................... 43 7.2 Laboratory Qualifications ................................................................................. 44
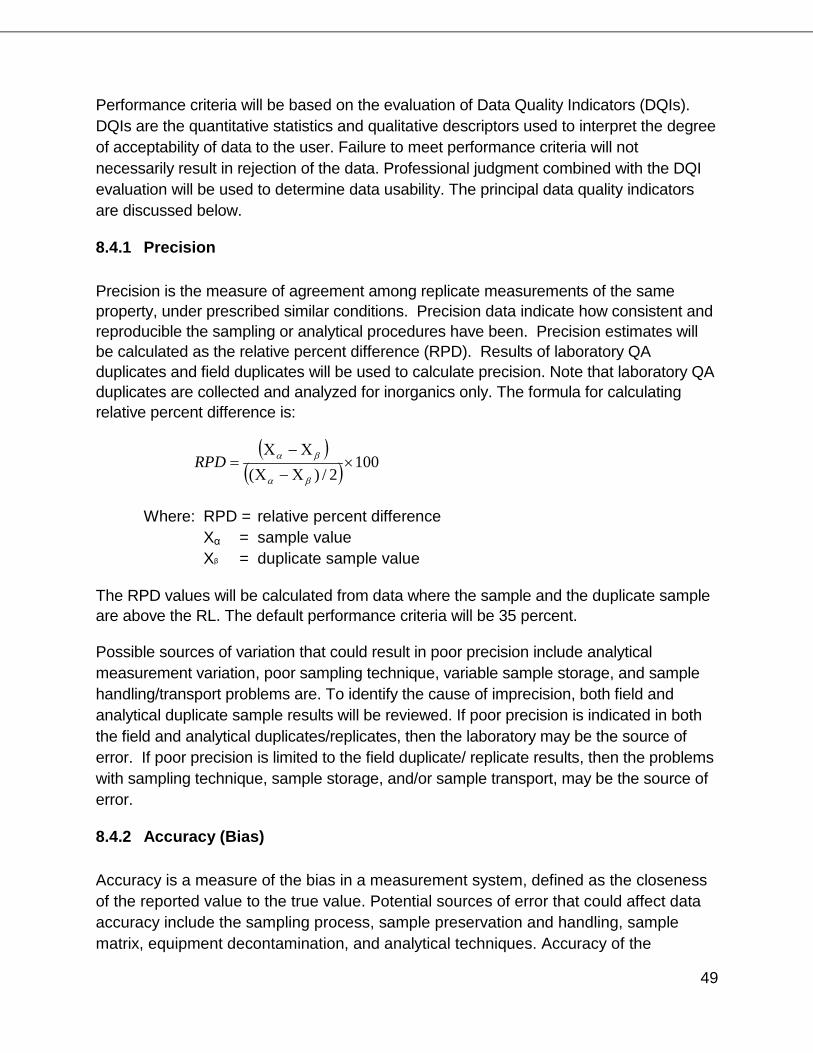
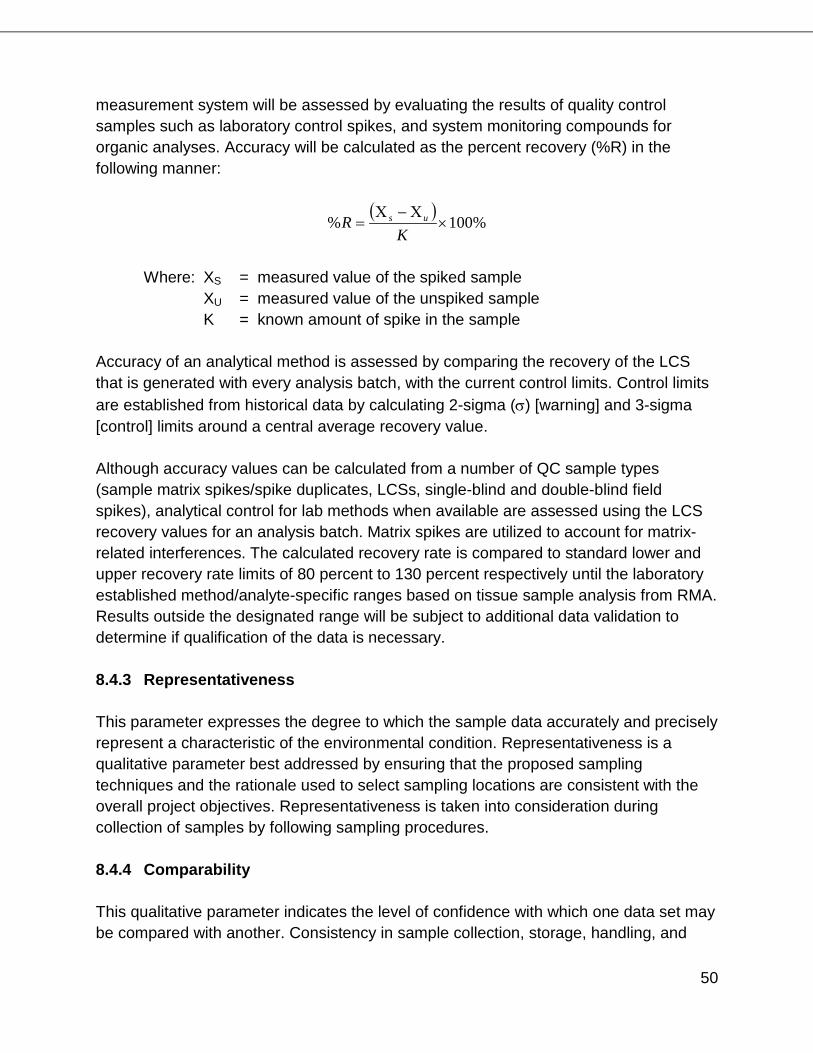
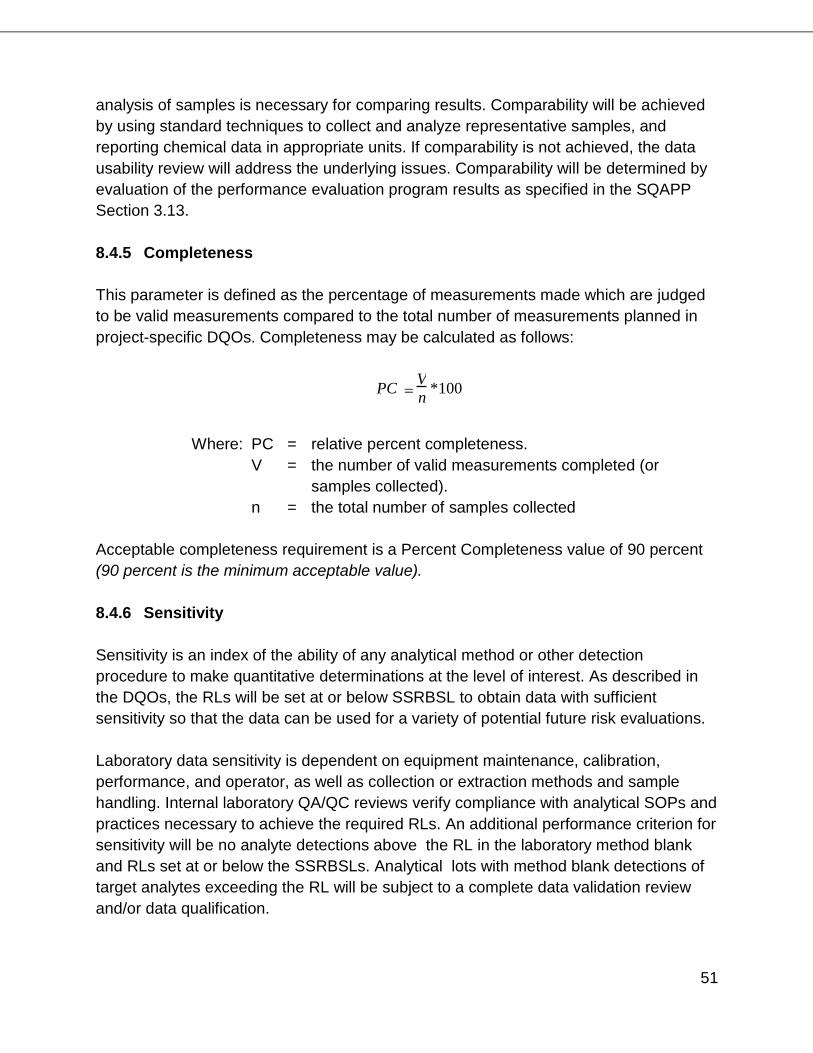
8.0 DATA REVIEW, VERIFICATION, AND USABILITY ............................................ 44 8.1 Data Review ..................................................................................................... 45 8.2 Data Verification ............................................................................................... 45 8.3 Data Validation ................................................................................................. 47 8.4 Data Usability ................................................................................................... 48 8.4.1 Precision .....................................................................................................................49 8.4.2 Accuracy (Bias) ...........................................................................................................49 8.2.3 Representativeness ....................................................................................................50 8.2.4 Comparability ..............................................................................................................50 8.2.5 Completeness .............................................................................................................51 8.2.6 Sensitivity ...................................................................................................................51
9.0 AUDITS, SURVEILLANCES, AND OVERSIGHT REQUIREMENTS .................. 52 9.1 Lab Audits ........................................................................................................ 52 9.2 Field Audit ........................................................................................................ 54 9.3 Assessment and Oversight .............................................................................. 54
10.0 DOCUMENTATION AND RECORDS ................................................................. 56 10.1 SAP-Related Documentation and Document Control ....................................... 56 10.2 Data Summary Report ..................................................................................... 57 10.3 Bison Tissue Necropsy and Tail Bulb Evaluation Report ................................. 58 10.4 Document Control ............................................................................................ 59
List of Tables Table 1. Bison population of the Rocky Mountain Arsenal NWR, 2007 to present Table 2. Table of key U.S. Army, USFWS, Navarro Inc., and Shell Oil staff Table 3. Elements of systematic planning process corresponding step in the DQO process Table 4. Exposure parameters Table 5. Toxicity factors for 11 of 14 COPCs Table 6. Final list of Contaminants of Potential Concern (COPCs), Rocky Mountain Arsenal National Wildlife Refuge, Bison Tissue Study Table 7. Input parameters for calculation of SSRBSLs Table 8. Site-Specific Risk-Based Screening Level for COPCs in bison tissue Table 9. Laboratory Method Detection Limits and Reporting Limits compared to the SSRBSLs Table 10. List of analytes for Method 01QH-OCP List of Figures Figure 1 – Organization Chart
Figure 2 – Site plan, Bison Pilot Area Range “North Pasture” (1,460 acres) Figure 3 – Site plan, Visitor Center Range “South Pasture” (772 acres) List of Attachments Attachment A – COPC selection details Attachment B – Tissue Sampling Plan – for reference of sampling procedures used by USFWS during the January 2014 necropsy.
ACRONYMS and ABBREVIATIONS
%R Percent Recovery APLES Analytical Performance Laboratory Evaluation System CERCLA Comprehensive Environmental Response, Compensation and
Liability Act C-O-C Chain-of-Custody COPC Contaminant of Potential Concern CQAP Chemical Quality Assurance Plan DBCP Dibromochloropropane DQCR Daily Quality Control Report DQI Data Quality Indicator DQO Data Quality Objective DQR Data Quality Requirement DSR Data Summary Report EPA U.S. Environmental Protection Agency ESD Explanation of Significant Differences FFA Federal Facility Agreement HI Hazard Index HQ Hazard Quotient LCS Laboratory Control Samples MDL Method Detection Limit OCP Organochlorine Pesticides OMC Operation and Maintenance Contractor oz ounce ppb parts per billion PBM Performance-Based Method PMRMA Program Manager for the Rocky Mountain Arsenal QA Quality Assurance QAPP Quality Assurance Project Plan QAR Quality Assurance Representative QC Quality Control SSRBSL Site-Specific Risk-Based Screening Level RMA Rocky Mountain Arsenal RMAED Rocky Mountain Arsenal Environmental Database RMANWR Rocky Mountain Arsenal National Wildlife Refuge ROD Record of Decision for the On-Post Operable Unit RPD Relative Percent Difference RTRAC Rocky Mountain Arsenal Transfer File Check Program SAP Sampling and Analysis Plan
SQAPP Sampling Quality Assurance Project Plan SSRBSL Site-Specific Risk-Based Screening Level TRER Terrestrial Residual Ecological Risk µg/g Micrograms per gram µg/L Micrograms per liter USDA United States Department of Agriculture USFWS United States Fish and Wildlife Service
8
PART I – Field Sampling Plan
1.0 INTRODUCTION
1.1 Purpose This Sampling and Analysis Plan (SAP) has two purposes. The first is to determine if Contaminant of Potential Concern (COPC) concentrations in tissues collected from bison in 2014 from the Rocky Mountain Arsenal National Wildlife Refuge (RMANWR) are below levels that would result in unacceptable risk to humans who ingest those tissues. The second is to determine if necropsy tail bulb fat collected during necropsies conducted in January and December 2014 of the 17 total bison is predictive of risk from ingestion of bison tissue. The tail-bulb fat obtained in the 2014 necropsies represents tail bulb fat that could be obtained with a nonlethal biopsy, a sampling method that is expected to be useful in the future. This SAP has been developed according to guidelines and requirements of the Rocky Mountain Arsenal Program Office. The following documents were also consulted in development of this plan: Guidance on Choosing a Sampling Design for Environmental Data Collection (EPA 2002b); Guidance for Quality Assurance Project Plans (EPA 2002a); Uniform Federal Policy for Quality Assurance Project Plans (Intergovernmental Data Quality Task Force 2005); Guidance on Systematic Planning Using the Data Quality Objectives Process (EPA 2006). The U.S. Fish and Wildlife Service (USFWS) and the U.S. Army will implement the requirements described in this SAP to analyze previously collected samples of bison tissue from the RMANWR. Data obtained from these investigations will be used in accordance with the Data Quality Objectives (DQOs) outlined in Section 4.1. 1.2 Scope This SAP is one part of a series of studies. This Bison Tissue Contaminant Study will be used to inform decisions by the Refuge Manager on disposition of excess bison and to develop a final study that will be used by the Regulatory Agencies to evaluate the feasibility of removing/modifying the current land use restriction on consumption of game (which includes bison) from the RMANWR (EPA et al. 1989, FWENC 1996). Removing/modifying the land use restrictions will require a Regulatory Agency approval of a ROD change which includes a public involvement component, as well as a modification to the FFA.
9
The Bison Tissue Contaminant Study consists of the following major components:
• Sampling and Analysis USDA Compliance Study Phase #11: This initial study effort was conducted by USFWS. The Rocky Mountain Arsenal National Wildlife Refuge Sampling and Analysis Plan, USDA Compliance Study (SAP #1) (USFWS 2013), dated December 16, 2013, was prepared by USFWS for implementation during the December 2013 bison roundup and was designed with two purposes:
o To obtain 0.5 gram samples of fat tissue from a bison’s posterior. Samples
were collected from all one and two-year old bison during the roundup. o To measure organochlorine pesticide levels in archived tissue samples
previously collected from animals that died since their arrival or birth on the RMANWR.
Both sets of samples were submitted for analysis and all results were reported as “non-detects” (i.e., less than the respective analytical reporting limits for each analyte). However, the existing data are too limited and often lack sufficient detection limits to draw firm conclusions about safety of consuming bison tissue. For this reason, the agencies have cooperated in a study that will provide more representative and reliable data.
• January 2014 Necropsy1: As a part of the December 2013 bison roundup, five
animals were relocated to other national wildlife refuges, two euthanized animals were provided to Colorado State University for educational purposes, and eleven bison were euthanized. To maximize the use of euthanized animals, the USFWS completed necropsies for animal health purposes and completed extensive sample collection (n=68 plus fetal tissues where applicable) for future contaminant studies (USFWS 2014).
• USDA Analysis1: In July 2014, bison meat samples from the eleven euthanized animals were analyzed by the USDA Food Inspection Service laboratory for pesticide residue. Analysis was conducted using standard Agricultural Marketing Service analytical methods used in the USDA contaminant surveillance program. The USDA pesticide analyte list includes both the organochlorine pesticides of concern for the RMANWR as well as an extensive list of other pesticides (USDA 2006). USDA reported no detections of any pesticides in any of the eleven bison meat samples (Yee 2014). Laboratory reporting limits were higher than screening levels that were developed for SAP #2 (aldrin – 5 ppb, dieldrin – 25 ppb,
1 It is noted that SAP #1, the January 2014 necropsy, and the USDA Analysis were conducted by the USFWS without concurrence by the Regulatory Agencies.
• Bison Tail Bulb Biopsy and Tissue Necropsy, December 2014. During the
December 2014 Bison Roundup, tail bulb fat biopsies were collected from 5 bison. In addition, 5 bison were euthanized and a necropsy was conducted. The biopsy and necropsy sampling was conducted in accordance with Bison Tail Bulb Biopsy and Tissue Necropsy Sampling and Analysis Plan (USFWS 2014b): This SAP was approved by the Regulatory Agencies prior to the December 2014 sampling event.
• Sampling and Analysis Phase #2: The current document (SAP #2) defines sampling and analysis requirements for this phase. This study effort also has multiple purposes. During this step, the working group (see section 2.4) refined the number and type of contaminants to be analyzed. In addition, the working group developed risk-based tissue screening levels for each contaminant to identify appropriate analytical methods and reporting limits.
o Part 1 of this plan will analyze tissues collected from the eleven
necropsied bison and calculate any increased carcinogenic and noncarcinogenic risks. This will provide representative data on any pesticide and total mercury within the edible tissues and organs of bison grazing the current pastures.
o Part 2 of this plan will test the ability of the live biopsy procedure to predict the OCP concentrations in edible tissues of RMA bison.
• Sampling and Analysis Phase #3: Informed by each of the previous studies, this
study will be designed to evaluate concentrations of COPCs in bison tissue as pasture areas are expanded. SAP #3 will also be designed to inform the modification of the game consumption restriction defined in the ROD to address bison. It is envisioned that this step will include opportunistic sampling of animals as they graze new areas on the RMANWR and that this step will include 100 percent live sampling of bison removed from the RMANWR provided the tail bulb fat biopsy technique proves to be an accurate predictor of risks associated with consumption of edible bison tissue. The duration of 100 percent live sampling will be determined based on the extent of pasture areas grazed, sample results, and the associated risk evaluations for consumption.
11
2.0 BACKGROUND
2.1 Origination of the Rocky Mountain Arsenal and the National Wildlife Refuge Located approximately ten miles from downtown Denver, portions of the land within the acquisition boundary of the Refuge (15,988 acres) have a well-documented history of significant environmental disturbance and contamination. The primary causes of contamination were the manufacture of chemical weapons by the U.S. Army from the World War II through Vietnam eras and the production of pesticides by Shell Oil Company from 1950-1980. Common industrial and waste disposal practices resulted in contamination of structures, soil, surface water, and groundwater. As a result of this contamination, in 1987 the Rocky Mountain Arsenal (RMA) was placed on the National Priorities List (NPL) for environmental cleanup under the Comprehensive Environmental Response Compensation, and Liability Act (CERCLA). The Rocky Mountain Arsenal National Wildlife Refuge (RMANWR) was authorized in 1992 and officially established in 2004 when the U.S. Environmental Protection Agency certified former U.S. Army lands to be transferred, through partial deletions from the NPL. In 2007, consistent with the purposes of the RMANWR, 16 bison were imported to emulate natural prairie processes and assist with habitat restoration. In order to effectively manage the bison herd, it is necessary to periodically remove animals. When appropriate and consistent with the Department of Interior’s Bison Conservation Initiative (U.S. Department of the Interior 2008), animals may be transferred to other national wildlife refuges. Animals may also be donated to Native American tribes or auctioned to the public. Whenever animals leave the RMANWR, it becomes possible that they could be consumed by the public at some point in the future. As indicated above, portions of RMA have been deleted from the NPL site as the CERCLA remedy was completed. Partial deletion from the NPL are based on the determination by EPA and the Colorado Department of Public Health and Environment (CDPHE), that all appropriate response actions under CERCLA were completed (other than operation, maintenance, and five-year reviews) and there are no known hazardous substances above health-based levels remaining in the partial deletion areas, with respect to anticipated uses of and access to the site which are identified in the Federal Facility Agreement (FFA) (EPA et al 1989), the Record of Decision for the On-Post Operable Unit (ROD) (FWENC 1996), and Public Law 102-402.
2.2 Land Use Restrictions Currently, over 14,700 acres have been transferred to the USFWS for establishment of the RMANWR with these land use restrictions in place.
12
The following restriction is currently found in the ROD:
The Rocky Mountain Arsenal National Wildlife Refuge Act of 1992 and the FFA restrict future land use, and prohibit certain activities such as agriculture, use of on-post groundwater as a drinking source, and consumption of fish and game taken at RMA (Foster Wheeler Environmental Corporation 1996).
Organochlorine pesticides were produced on the site and are the principal contaminants of concern on the RMANWR (USFWS 2013b). Because it was not known whether consumption of fish and game from the RMANWR might pose a human health risk, a land use restriction was included in the 1989 Federal Facility Agreement preventing consumption of fish and wildlife from the property (EPA et al. 1989). This restriction was carried forward into the 1996 Record of Decision for the site. In April 2013, the U.S. Fish and Wildlife Service initiated a formal process to remove/modify this restriction to allow the RMANWR to manage its bison herd similar to other bison herds across the country, which would include removing surplus bison from the site.
2.3 RMANWR Habitat Development and Bison Remediation activities mandated under CERCLA and subsequent restoration activities conducted by the USFWS are anticipated to return approximately 67 percent (10,739 acres) of Refuge lands to native short- and mixed-grass prairie. Other habitats that will be present on the Refuge include shrub lands, forested lands, riparian areas, and numerous manmade features (irrigation lakes, ditches, homesteads, etc.), many of which are of cultural or historic importance. The USFWS recently finalized a Habitat Management Plan for the RMANWR (USFWS 2013a). This plan identifies two high priorities for the Refuge, as follows: (1) to promote successful long-term establishment and maintenance of seeded restoration sites, existing native prairies and shrublands, and habitat for the resources of concern; and (2) maintain a bison (Bison bison) population that contributes to the Department of the Interior’s Bison Conservation Initiative (U.S. Department of the Interior 2008) and helps maintain the structure and composition of native and restored prairies necessary to support priority grassland bird species (USFWS 2013a). Based upon an analysis of available forage and the habitat needs of all wildlife species, the USFWS developed the following objective for the RMANWR bison herd:
Manage bison populations, in support of the Department of the Interior’s Bison Conservation Initiative, at or below the carrying capacity for the refuge. At present, bison populations would range between 25-40 animals and should not
13
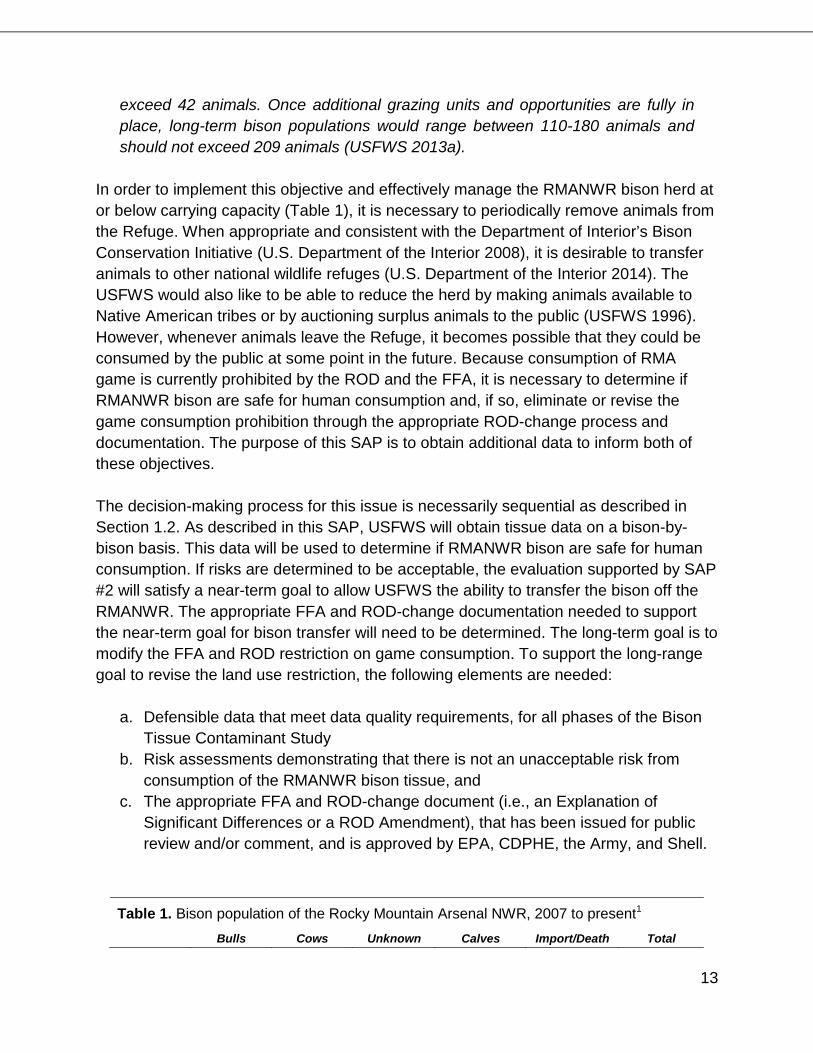
exceed 42 animals. Once additional grazing units and opportunities are fully in place, long-term bison populations would range between 110-180 animals and should not exceed 209 animals (USFWS 2013a).
In order to implement this objective and effectively manage the RMANWR bison herd at or below carrying capacity (Table 1), it is necessary to periodically remove animals from the Refuge. When appropriate and consistent with the Department of Interior’s Bison Conservation Initiative (U.S. Department of the Interior 2008), it is desirable to transfer animals to other national wildlife refuges (U.S. Department of the Interior 2014). The USFWS would also like to be able to reduce the herd by making animals available to Native American tribes or by auctioning surplus animals to the public (USFWS 1996). However, whenever animals leave the Refuge, it becomes possible that they could be consumed by the public at some point in the future. Because consumption of RMA game is currently prohibited by the ROD and the FFA, it is necessary to determine if RMANWR bison are safe for human consumption and, if so, eliminate or revise the game consumption prohibition through the appropriate ROD-change process and documentation. The purpose of this SAP is to obtain additional data to inform both of these objectives. The decision-making process for this issue is necessarily sequential as described in Section 1.2. As described in this SAP, USFWS will obtain tissue data on a bison-by-bison basis. This data will be used to determine if RMANWR bison are safe for human consumption. If risks are determined to be acceptable, the evaluation supported by SAP #2 will satisfy a near-term goal to allow USFWS the ability to transfer the bison off the RMANWR. The appropriate FFA and ROD-change documentation needed to support the near-term goal for bison transfer will need to be determined. The long-term goal is to modify the FFA and ROD restriction on game consumption. To support the long-range goal to revise the land use restriction, the following elements are needed:
a. Defensible data that meet data quality requirements, for all phases of the Bison Tissue Contaminant Study
b. Risk assessments demonstrating that there is not an unacceptable risk from consumption of the RMANWR bison tissue, and
c. The appropriate FFA and ROD-change document (i.e., an Explanation of Significant Differences or a ROD Amendment), that has been issued for public review and/or comment, and is approved by EPA, CDPHE, the Army, and Shell.
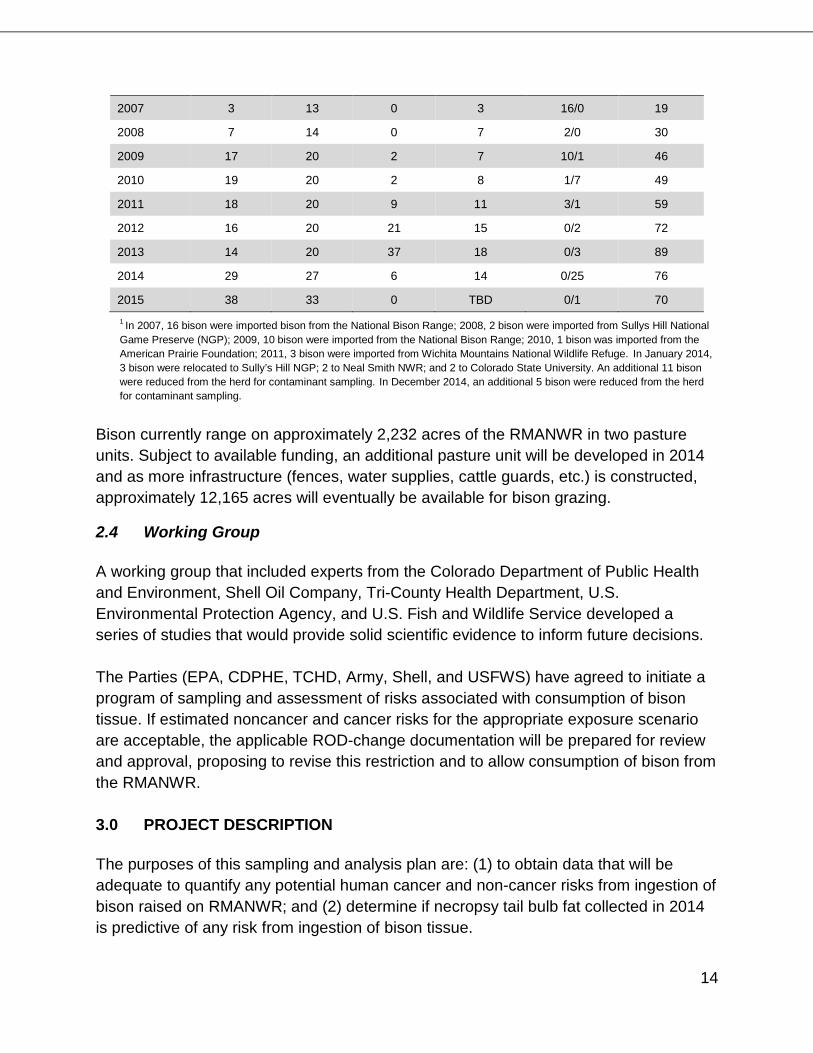
Table 1. Bison population of the Rocky Mountain Arsenal NWR, 2007 to present1
Bulls Cows Unknown Calves Import/Death Total
14
2007 3 13 0 3 16/0 19
2008 7 14 0 7 2/0 30
2009 17 20 2 7 10/1 46
2010 19 20 2 8 1/7 49
2011 18 20 9 11 3/1 59
2012 16 20 21 15 0/2 72
2013 14 20 37 18 0/3 89
2014 29 27 6 14 0/25 76
2015 38 33 0 TBD 0/1 70
1 In 2007, 16 bison were imported bison from the National Bison Range; 2008, 2 bison were imported from Sullys Hill National Game Preserve (NGP); 2009, 10 bison were imported from the National Bison Range; 2010, 1 bison was imported from the American Prairie Foundation; 2011, 3 bison were imported from Wichita Mountains National Wildlife Refuge. In January 2014, 3 bison were relocated to Sully’s Hill NGP; 2 to Neal Smith NWR; and 2 to Colorado State University. An additional 11 bison were reduced from the herd for contaminant sampling. In December 2014, an additional 5 bison were reduced from the herd for contaminant sampling.
Bison currently range on approximately 2,232 acres of the RMANWR in two pasture units. Subject to available funding, an additional pasture unit will be developed in 2014 and as more infrastructure (fences, water supplies, cattle guards, etc.) is constructed, approximately 12,165 acres will eventually be available for bison grazing.
2.4 Working Group A working group that included experts from the Colorado Department of Public Health and Environment, Shell Oil Company, Tri-County Health Department, U.S. Environmental Protection Agency, and U.S. Fish and Wildlife Service developed a series of studies that would provide solid scientific evidence to inform future decisions. The Parties (EPA, CDPHE, TCHD, Army, Shell, and USFWS) have agreed to initiate a program of sampling and assessment of risks associated with consumption of bison tissue. If estimated noncancer and cancer risks for the appropriate exposure scenario are acceptable, the applicable ROD-change documentation will be prepared for review and approval, proposing to revise this restriction and to allow consumption of bison from the RMANWR. 3.0 PROJECT DESCRIPTION The purposes of this sampling and analysis plan are: (1) to obtain data that will be adequate to quantify any potential human cancer and non-cancer risks from ingestion of bison raised on RMANWR; and (2) determine if necropsy tail bulb fat collected in 2014 is predictive of any risk from ingestion of bison tissue.
15
Part 1: Obtain measures of COPCs in bison tissues that will be adequate to allow reliable quantification of any cancer and non-cancer risk from ingestion of bison meat. This SAP will utilize samples collected under the following three events:
1. In January 2014, eleven 1-2-year old bison, representing approximately 44 percent of the 1-2 year old population, were euthanized in order to bring the RMANWR bison herd into better alignment with existing habitat. Necropsy samples were collected in accordance with a Bison Food Safety Program, Tissue Collection Plan (USFWS 2014a). Necropsies were conducted on these 11 bison to collect tissues that can be used for further evaluation of contaminants in different tissues not accessible by non-lethal sampling methods.
2. In November 2014, one ill bison was euthanized in the field and tissue samples collected during necropsy of this animal were submitted for analysis. Necropsy samples were collected in accordance with a Bison Food Safety Program, Tissue Collection Plan (USFWS 2014a). As this animal was ill, it was taken to Colorado State University for necropsy to determine the cause of illness. Fortuitous samples were collected, but a tail bulb sample was not taken prior to necropsy.
3. In December 2014, 5 bison were euthanized and sampled (1 four year-old bull, 1
yearling cow, and 3 yearling bulls). In accordance with the Bison Tail Bulb Biopsy and Tissue Necropsy Sampling and Analysis Plan, (USFWS 2014b), tail bulb samples were taken from each prior to necropsy.
Samples from events 1 were preserved by USFWS and will be analyzed in accordance with this SAP. Data from all three sampling events will be assessed in accordance with this SAP. Human health risks associated with the ingestion of the bison that were sampled during these three events will be computed based on agreed-to exposure scenarios (i.e., meal size, frequency) to determine if these specific bison would be safe for human consumption.
Part 2: Determine if concentrations of COPCs measured in tail bulb fat are predictive of human health risk from ingestion of bison tissues A goal for long-term management of bison populations is to develop a predictive procedure that uses samples obtained from live animals to provide sufficient evidence that animals may be removed from the RMANWR without any restrictions on consumption or tracking requirements (and therefore acceptance of the possibility of future human consumption).
16
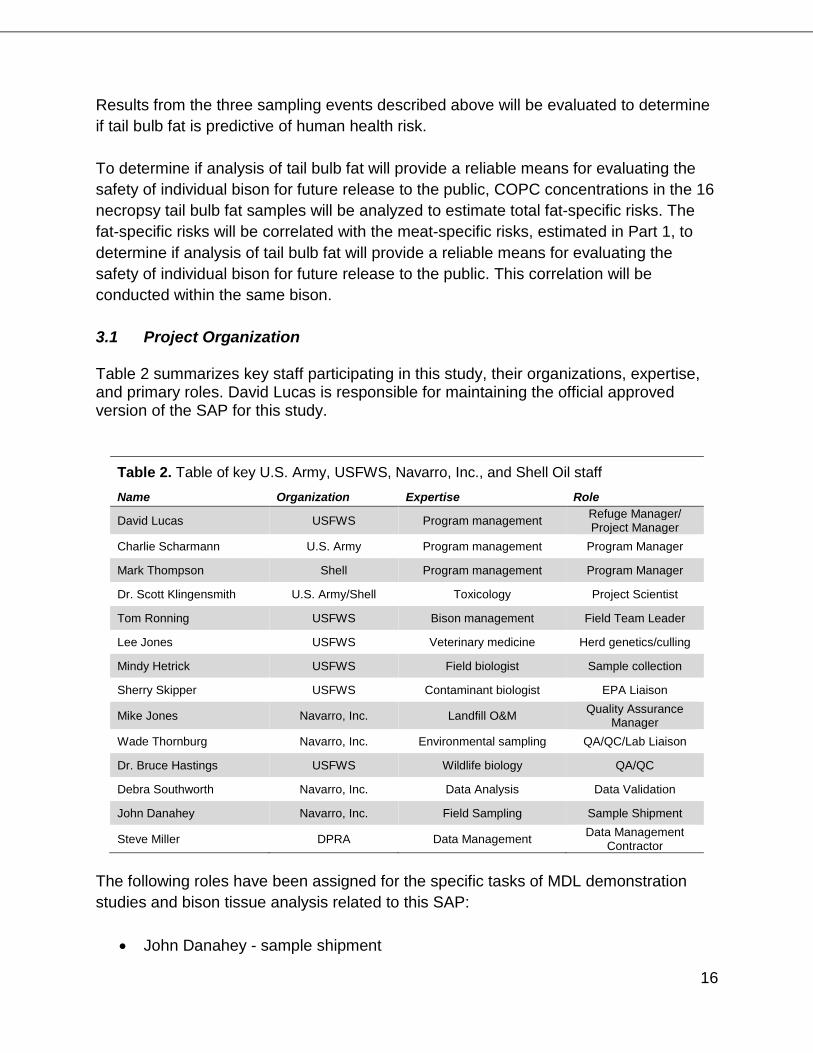
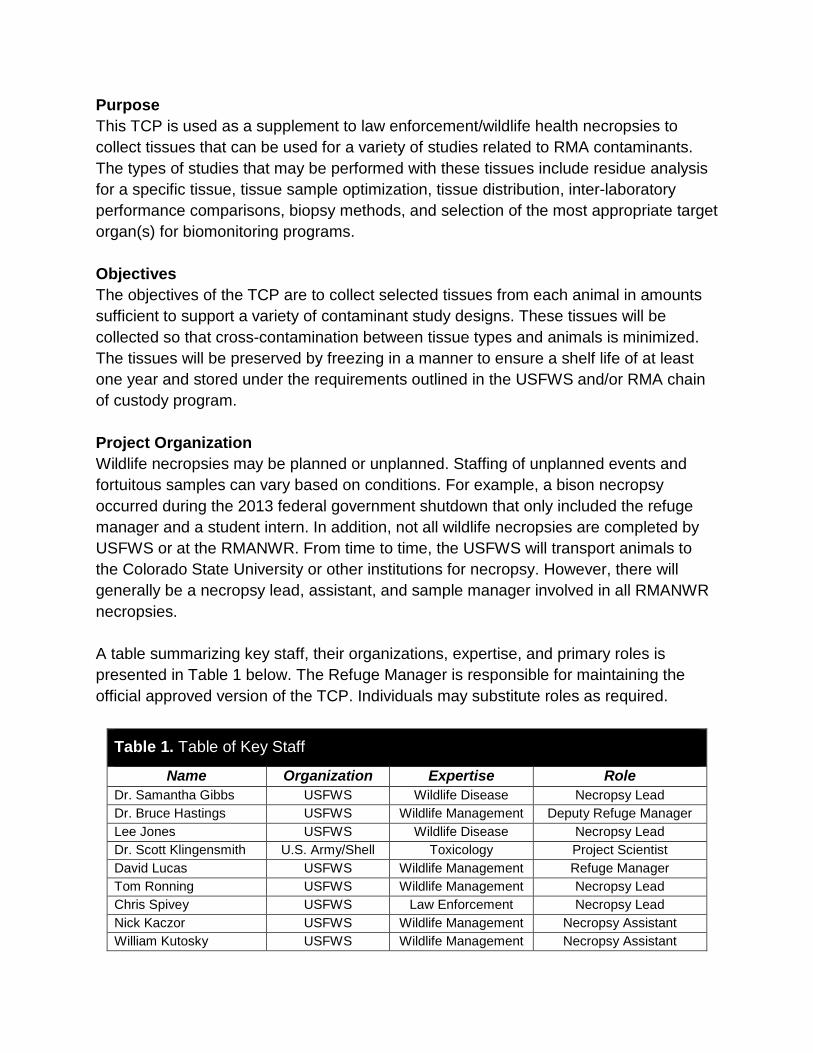
Results from the three sampling events described above will be evaluated to determine if tail bulb fat is predictive of human health risk. To determine if analysis of tail bulb fat will provide a reliable means for evaluating the safety of individual bison for future release to the public, COPC concentrations in the 16 necropsy tail bulb fat samples will be analyzed to estimate total fat-specific risks. The fat-specific risks will be correlated with the meat-specific risks, estimated in Part 1, to determine if analysis of tail bulb fat will provide a reliable means for evaluating the safety of individual bison for future release to the public. This correlation will be conducted within the same bison. 3.1 Project Organization Table 2 summarizes key staff participating in this study, their organizations, expertise, and primary roles. David Lucas is responsible for maintaining the official approved version of the SAP for this study.
Table 2. Table of key U.S. Army, USFWS, Navarro, Inc., and Shell Oil staff
Name Organization Expertise Role
David Lucas USFWS Program management Refuge Manager/ Project Manager
Charlie Scharmann U.S. Army Program management Program Manager
Mark Thompson Shell Program management Program Manager
Dr. Scott Klingensmith U.S. Army/Shell Toxicology Project Scientist
Tom Ronning USFWS Bison management Field Team Leader
Lee Jones USFWS Veterinary medicine Herd genetics/culling
Mindy Hetrick USFWS Field biologist Sample collection
Mike Jones Navarro, Inc. Landfill O&M Quality Assurance Manager
Wade Thornburg Navarro, Inc. Environmental sampling QA/QC/Lab Liaison
Dr. Bruce Hastings USFWS Wildlife biology QA/QC
Debra Southworth Navarro, Inc. Data Analysis Data Validation
John Danahey Navarro, Inc. Field Sampling Sample Shipment
Steve Miller DPRA Data Management Data Management Contractor
The following roles have been assigned for the specific tasks of MDL demonstration studies and bison tissue analysis related to this SAP:
• John Danahey - sample shipment
17
• Debra Southworth - evaluate MDL studies, obtain QC and PE samples, data verification/validation
• Wade Thornburg - review and implementation of this SAP, coordinating sample shipment and analysis with the laboratory, tracking data results and evaluating data quality
• Mike Jones - provide technical support and oversight as necessary to ensure compliance with all applicable project quality procedures
• Scott Klingensmith- prepare DSR report and risk assessment summary • David Lucas - project management and coordination • Steve Miller - the Data Management Contractor is contracted by the Army to
manage the Rocky Mountain Arsenal Environmental Database (RMAED). The Data Management Contractor is responsible for conducting quality control measures on analytical data received by the laboratory and ensuring inclusion of the data into the RMAED.
• Navarro Contract Laboratory - ARDL - the contract laboratory is responsible for the analysis of samples submitted for this project and must comply with the Rocky Mountain Arsenal Sampling Quality Assurance Project Plan (SQAPP) (Navarro 2014) and all method-specific analytical procedures.
18
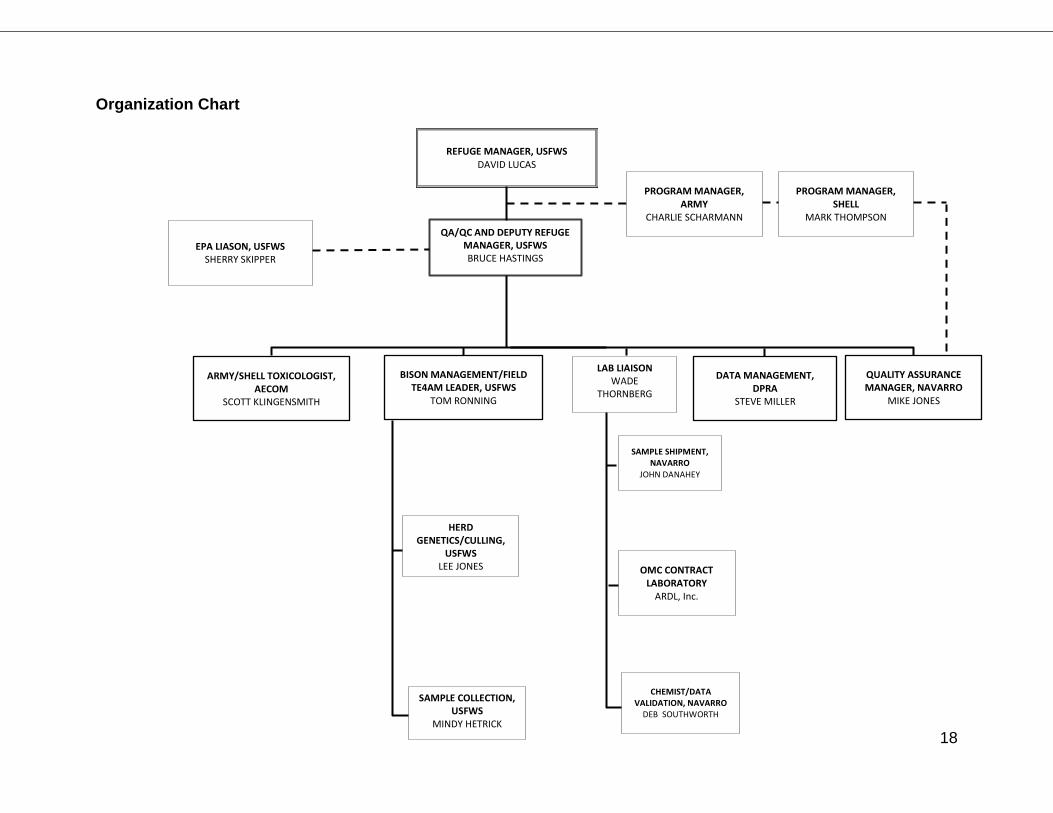
Organization Chart
QA/QC AND DEPUTY REFUGE MANAGER, USFWS BRUCE HASTINGS
ARMY/SHELL TOXICOLOGIST, AECOM
SCOTT KLINGENSMITH
BISON MANAGEMENT/FIELD TE4AM LEADER, USFWS
TOM RONNING
HERD GENETICS/CULLING,
USFWS LEE JONES
SAMPLE COLLECTION, USFWS
MINDY HETRICK
SAMPLE SHIPMENT, NAVARRO
JOHN DANAHEY
CHEMIST/DATA VALIDATION, NAVARRO
DEB SOUTHWORTH
DATA MANAGEMENT, DPRA
STEVE MILLER
QUALITY ASSURANCE MANAGER, NAVARRO
MIKE JONES
LAB LIAISON WADE
THORNBERG
REFUGE MANAGER, USFWS DAVID LUCAS
PROGRAM MANAGER, ARMY
CHARLIE SCHARMANN
EPA LIASON, USFWS SHERRY SKIPPER
OMC CONTRACT LABORATORY
ARDL, Inc.
PROGRAM MANAGER, SHELL
MARK THOMPSON
19
3.2 Training Personnel that conduct activities for this project must be properly trained and certified in sample collection, preservation, and storage techniques required by the SAP. The personnel involved in sampling activities for this project shall have education and experience necessary to conduct activities in this SAP. Training documentation will be maintained according to procedures specific to each organization. Specific training related to this SAP is described below. Personnel conducting shipment of samples to analytical laboratories will be trained on the current revision of the Remediation Venture Office (RVO) Remediation and Off-Site Waste Management Plan (ROWMP) (RVO 2009).
3.3 Project Schedule The following work schedule is proposed for implementation of this SAP:
• Sampling Events – December 17, 2013; January 14-15, 2014; December 9-10, 2014; and April 6, 2015
• Finalize SAP#2 – April 22, 2015 • Laboratory Selection – completed in 2014 • Lab Analysis – April 30, 2015 through May 30, 2015 • DSR Development – July 15, 2015 • Summary Risk Report – September, 2015
4.0 OBJECTIVES
The objectives of this SAP are to establish protocols to measure COPC concentrations in bison tissue samples collected during the three sampling events described in Section 3.0, present analytical methods and requirements, and to describe the data evaluation process for the project. The samples obtained as part of this program will be analyzed for a suite of OCP analytes as described in Section 4.2. In addition, total mercury concentrations will be measured in a kidney sample from each animal. OCP and total mercury data will be evaluated as described in the DQOs including risk characterization.
4.1 Data Quality Objectives and Criteria for Measurement Data There are two parts to this study and two sets of DQOs. The DQOs and criteria for measurement data for each are defined below using the seven-step process (Table 3) described in U.S. Environmental Protection Agency (EPA) Guidance for the Data
20
Quality Objectives Process (EPA 2000). This seven-step process clarifies the objectives, inputs, and decisions for the current project and helps define the data quality requirements. Below is a brief description of the outputs of each of the seven steps.
Table 3. Elements of systematic planning process corresponding step in the DQO process
Elements of the Systematic Planning Process Elements of Systematic Planning Process Corresponding Step in the DQO Process
Identifying and involving the project manager/decision maker, and project personnel Step 1. Define the problem
Identifying the project schedule, resources, milestones, and requirements Step 1. Define the problem
Describing the project goal(s) and objective(s) Step 2. Identify the goal(s) of the study
Identifying the type of data needed Step 3. Identify information needed for the decision
Identifying constraints to data collection Step 4. Define the boundaries of the study
Determining the quality of the data needed Step 5. Develop a decision rule Step 6. Specify limits on decision errors
Determining the quantity of the data needed Step 7. Optimize the design for obtaining data
Describing how, when, and where the data will be obtained Step 7. Optimize the design for obtaining data Specifying quality assurance and quality control activities to assess the quality performance criteria Part B of QA Project Plan
Describing methods for data analysis, evaluation, and assessment against the intended use of the data and the quality performance criteria
Part D of QA Project Plan; DQA Process
Table taken from Guidance for the Data Quality Objectives Process (EPA 2000).
4.1.1 Quantification of any increased cancer and non-cancer risk. PART 1: Obtain measures of COPCs in bison tissues that will be adequate to allow reliable quantification of any cancer and non-cancer risk from ingestion of bison meat Step 1. Define the problem In order to evaluate the risk associated with human consumption of bison, sampling is necessary to measure concentrations of COPCs in bison tissue at a level that is adequate to detect and quantify potential cancer and non-cancer risks to humans who may ingest meat from the bison. The Regulatory Agencies have determined that current data are not adequate for this purpose, so additional data are needed.
Step 2. Identify the goal(s) of the study
21
The goal of this study is to obtain reliable measures of COPC concentrations in tissues from 11 bison raised on RMANWR that were sacrificed and sampled by USFWS in January 2014. Step 3. Identify Information Needed For the Decision
The information needed for the decision include reliable and sensitive measurements of COPC concentration in bison muscle, fat, kidney and liver.
o Representative necropsy samples (20-30 g) collected from bison muscle, fat (1 g), kidney, and liver.2
o Laboratory analysis of the necropsy samples for COPCs that meets data quality requirements and that is reported to method detection limits (MDLs) that are sufficiently low for quantification of any potential human health risks. Analytes for bison muscle, fat, kidney and liver will include the following 13 OCP pesticides/metabolites: aldrin, chlordane, DDD, DDE, DDT, dieldrin, endrin, endrin ketone, heptachlor, heptachlor epoxide, hexachlorobenzene, isodrin, and oxychlordane. In addition, total mercury will be measured in kidney.
Step 4. Define the Boundaries of the Study
• Bison that were selected for the January 2014 sampling: o Spatial Boundaries are the pastures where bison have grazed. For this
study, all bison grazed both the north (Figure 1 – Bison Pilot Area Range) and south (Figure 2 – Visitor Center Range) pastures.
o Temporal Boundaries are the length of time that the bison lived at the RMANWR. For this study, all bison included in the necropsy sampling were born on the RMANWR and were between one and two years in age.
2 Collection of the January 2014 bison necropsy samples was conducted by USFWS according to their internal protocols. This sample collection was conducted without an EPA-approved QAPP. Therefore, this evaluation assumes that the necropsy sample collection and sample preservation techniques were suitable. Collection of the December 2014 bison necropsy samples was conducted with the EPA-approved Bison Tail-Bulb Biopsy and Tissue Necropsy Sampling and Analysis Plan (USFWS 2014b)
22
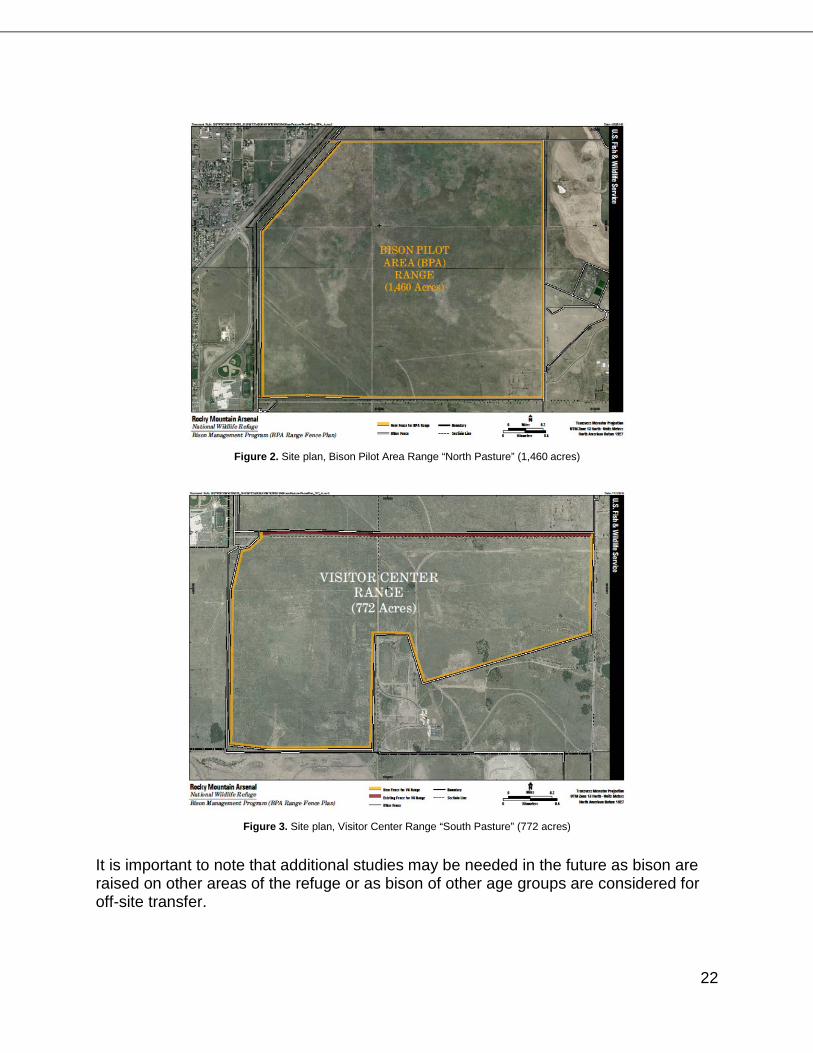
Figure 2. Site plan, Bison Pilot Area Range “North Pasture” (1,460 acres)
Figure 3. Site plan, Visitor Center Range “South Pasture” (772 acres)
It is important to note that additional studies may be needed in the future as bison are raised on other areas of the refuge or as bison of other age groups are considered for off-site transfer.
23
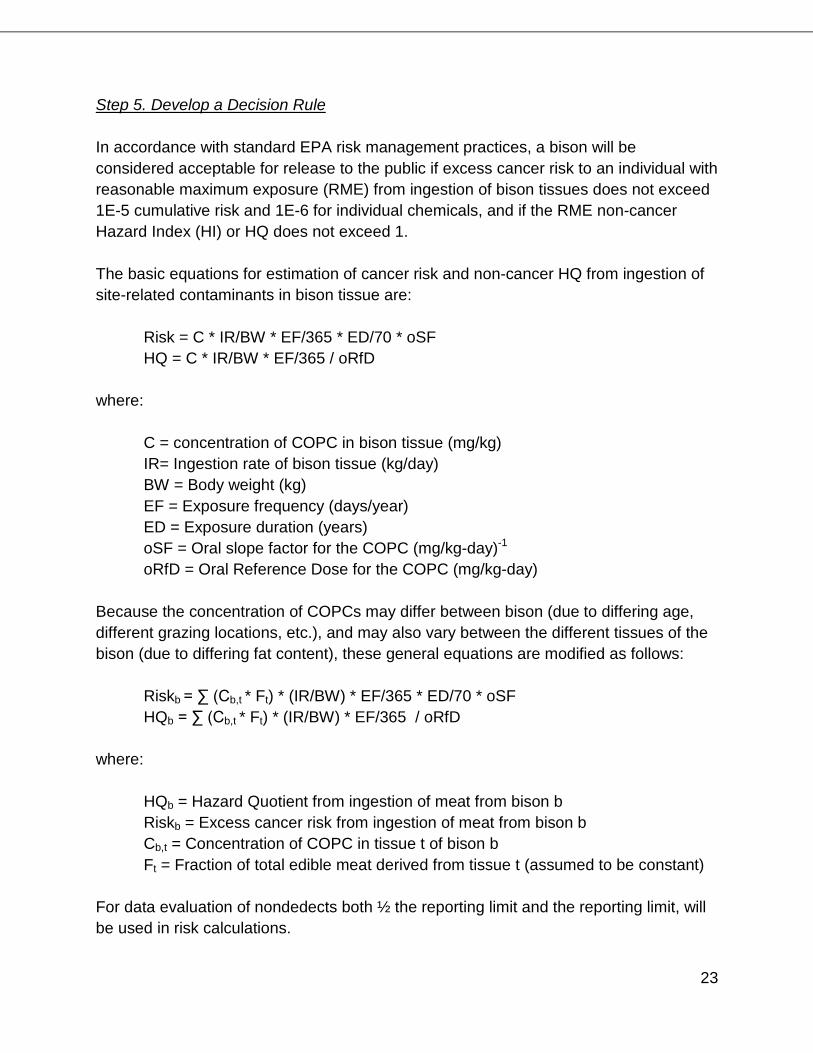
Step 5. Develop a Decision Rule In accordance with standard EPA risk management practices, a bison will be considered acceptable for release to the public if excess cancer risk to an individual with reasonable maximum exposure (RME) from ingestion of bison tissues does not exceed 1E-5 cumulative risk and 1E-6 for individual chemicals, and if the RME non-cancer Hazard Index (HI) or HQ does not exceed 1. The basic equations for estimation of cancer risk and non-cancer HQ from ingestion of site-related contaminants in bison tissue are: Risk = C * IR/BW * EF/365 * ED/70 * oSF
HQ = C * IR/BW * EF/365 / oRfD where: C = concentration of COPC in bison tissue (mg/kg) IR= Ingestion rate of bison tissue (kg/day) BW = Body weight (kg) EF = Exposure frequency (days/year) ED = Exposure duration (years) oSF = Oral slope factor for the COPC (mg/kg-day)-1 oRfD = Oral Reference Dose for the COPC (mg/kg-day) Because the concentration of COPCs may differ between bison (due to differing age, different grazing locations, etc.), and may also vary between the different tissues of the bison (due to differing fat content), these general equations are modified as follows: Riskb = ∑ (Cb,t * Ft) * (IR/BW) * EF/365 * ED/70 * oSF
HQb = ∑ (Cb,t * Ft) * (IR/BW) * EF/365 / oRfD where: HQb = Hazard Quotient from ingestion of meat from bison b Riskb = Excess cancer risk from ingestion of meat from bison b Cb,t = Concentration of COPC in tissue t of bison b Ft = Fraction of total edible meat derived from tissue t (assumed to be constant) For data evaluation of nondedects both ½ the reporting limit and the reporting limit, will be used in risk calculations.
24
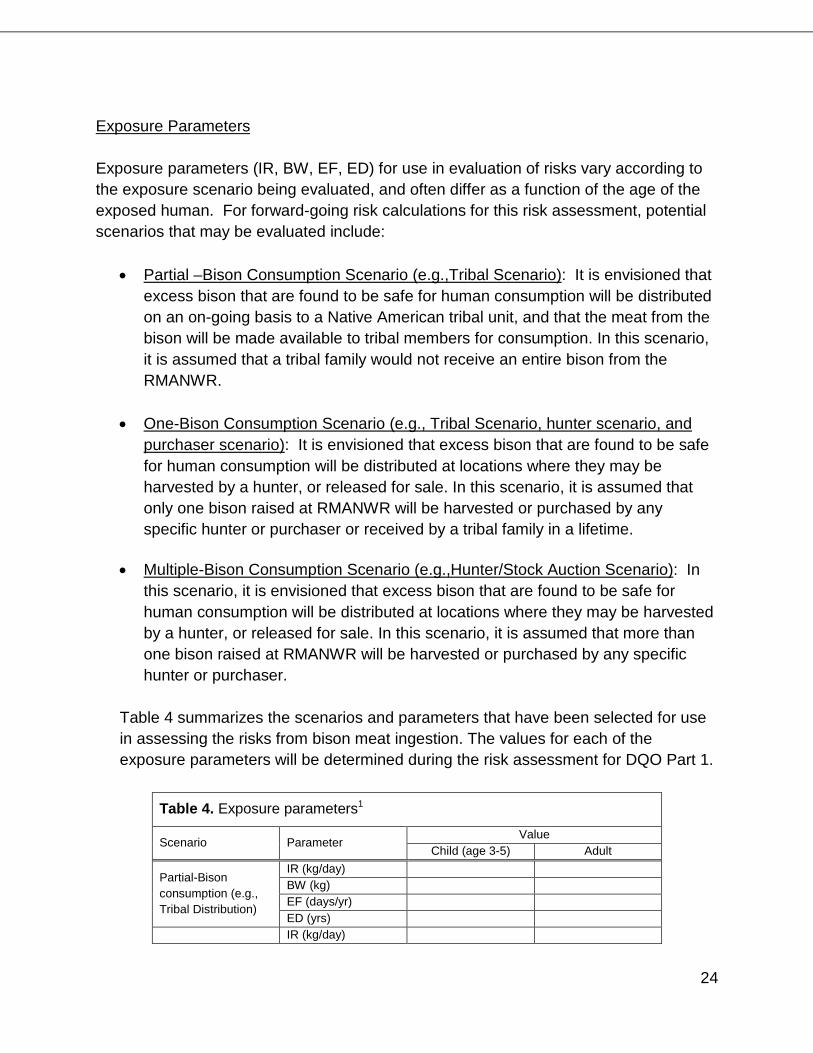
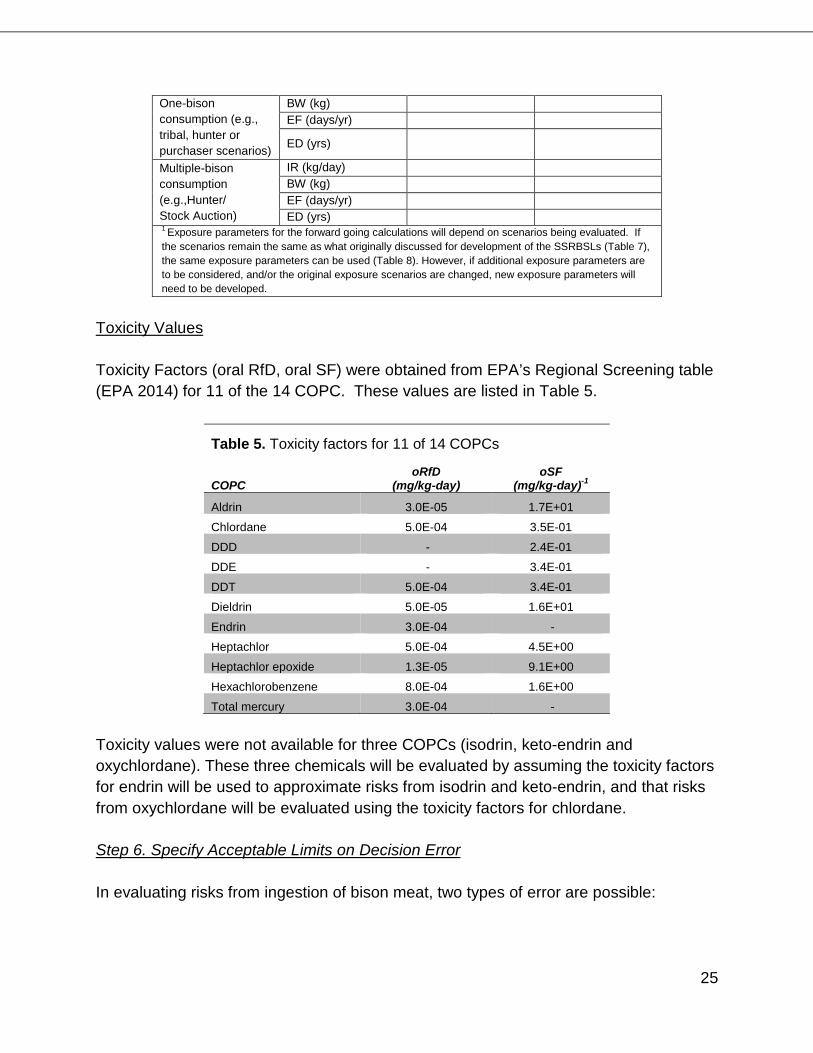
Exposure Parameters Exposure parameters (IR, BW, EF, ED) for use in evaluation of risks vary according to the exposure scenario being evaluated, and often differ as a function of the age of the exposed human. For forward-going risk calculations for this risk assessment, potential scenarios that may be evaluated include:
• Partial –Bison Consumption Scenario (e.g.,Tribal Scenario): It is envisioned that excess bison that are found to be safe for human consumption will be distributed on an on-going basis to a Native American tribal unit, and that the meat from the bison will be made available to tribal members for consumption. In this scenario, it is assumed that a tribal family would not receive an entire bison from the RMANWR.
• One-Bison Consumption Scenario (e.g., Tribal Scenario, hunter scenario, and purchaser scenario): It is envisioned that excess bison that are found to be safe for human consumption will be distributed at locations where they may be harvested by a hunter, or released for sale. In this scenario, it is assumed that only one bison raised at RMANWR will be harvested or purchased by any specific hunter or purchaser or received by a tribal family in a lifetime.
• Multiple-Bison Consumption Scenario (e.g.,Hunter/Stock Auction Scenario): In this scenario, it is envisioned that excess bison that are found to be safe for human consumption will be distributed at locations where they may be harvested by a hunter, or released for sale. In this scenario, it is assumed that more than one bison raised at RMANWR will be harvested or purchased by any specific hunter or purchaser.
Table 4 summarizes the scenarios and parameters that have been selected for use in assessing the risks from bison meat ingestion. The values for each of the exposure parameters will be determined during the risk assessment for DQO Part 1.
1 Exposure parameters for the forward going calculations will depend on scenarios being evaluated. If the scenarios remain the same as what originally discussed for development of the SSRBSLs (Table 7), the same exposure parameters can be used (Table 8). However, if additional exposure parameters are to be considered, and/or the original exposure scenarios are changed, new exposure parameters will need to be developed.
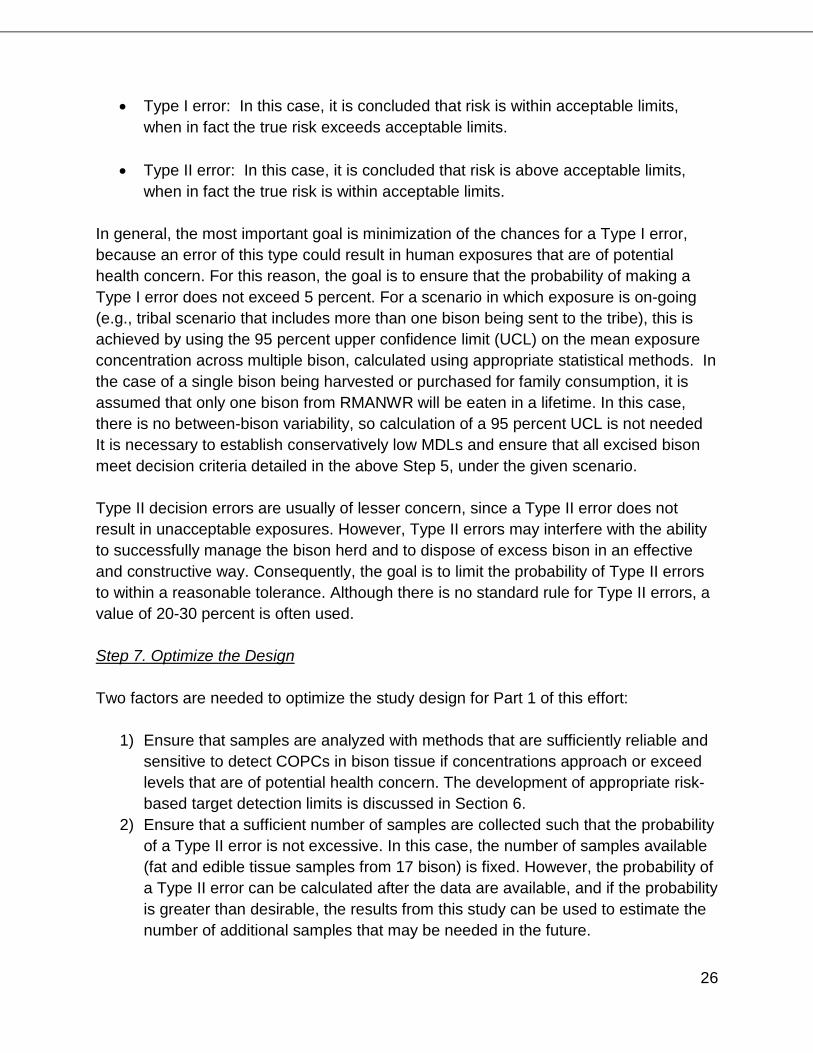
Toxicity Values Toxicity Factors (oral RfD, oral SF) were obtained from EPA’s Regional Screening table (EPA 2014) for 11 of the 14 COPC. These values are listed in Table 5.
Table 5. Toxicity factors for 11 of 14 COPCs
COPC oRfD
(mg/kg-day) oSF
(mg/kg-day)-1
Aldrin 3.0E-05 1.7E+01
Chlordane 5.0E-04 3.5E-01
DDD - 2.4E-01
DDE - 3.4E-01
DDT 5.0E-04 3.4E-01
Dieldrin 5.0E-05 1.6E+01
Endrin 3.0E-04 -
Heptachlor 5.0E-04 4.5E+00
Heptachlor epoxide 1.3E-05 9.1E+00
Hexachlorobenzene 8.0E-04 1.6E+00
Total mercury 3.0E-04 -
Toxicity values were not available for three COPCs (isodrin, keto-endrin and oxychlordane). These three chemicals will be evaluated by assuming the toxicity factors for endrin will be used to approximate risks from isodrin and keto-endrin, and that risks from oxychlordane will be evaluated using the toxicity factors for chlordane. Step 6. Specify Acceptable Limits on Decision Error
In evaluating risks from ingestion of bison meat, two types of error are possible:
26
• Type I error: In this case, it is concluded that risk is within acceptable limits, when in fact the true risk exceeds acceptable limits.
• Type II error: In this case, it is concluded that risk is above acceptable limits,
when in fact the true risk is within acceptable limits. In general, the most important goal is minimization of the chances for a Type I error, because an error of this type could result in human exposures that are of potential health concern. For this reason, the goal is to ensure that the probability of making a Type I error does not exceed 5 percent. For a scenario in which exposure is on-going (e.g., tribal scenario that includes more than one bison being sent to the tribe), this is achieved by using the 95 percent upper confidence limit (UCL) on the mean exposure concentration across multiple bison, calculated using appropriate statistical methods. In the case of a single bison being harvested or purchased for family consumption, it is assumed that only one bison from RMANWR will be eaten in a lifetime. In this case, there is no between-bison variability, so calculation of a 95 percent UCL is not needed It is necessary to establish conservatively low MDLs and ensure that all excised bison meet decision criteria detailed in the above Step 5, under the given scenario. Type II decision errors are usually of lesser concern, since a Type II error does not result in unacceptable exposures. However, Type II errors may interfere with the ability to successfully manage the bison herd and to dispose of excess bison in an effective and constructive way. Consequently, the goal is to limit the probability of Type II errors to within a reasonable tolerance. Although there is no standard rule for Type II errors, a value of 20-30 percent is often used. Step 7. Optimize the Design Two factors are needed to optimize the study design for Part 1 of this effort:
1) Ensure that samples are analyzed with methods that are sufficiently reliable and sensitive to detect COPCs in bison tissue if concentrations approach or exceed levels that are of potential health concern. The development of appropriate risk-based target detection limits is discussed in Section 6.
2) Ensure that a sufficient number of samples are collected such that the probability of a Type II error is not excessive. In this case, the number of samples available (fat and edible tissue samples from 17 bison) is fixed. However, the probability of a Type II error can be calculated after the data are available, and if the probability is greater than desirable, the results from this study can be used to estimate the number of additional samples that may be needed in the future.
27
4.1.2 Tail bulb fat and tissue risk correlation PART 2: Determine if the tail bulb fat is predictive of any human health risks from ingestion of bison tissues Step 1. Define the problem In order to manage the bison herd effectively, it is highly desirable to have a non-lethal method for evaluating the suitability of individual bison that are being considered for off-site release and potential consumption by the public. This would help ensure that any bison that are released to the public would be safe for human consumption. Step 2. Identify the goal(s) of the study
The goal of the study is to determine if risks to humans from consumption of tissues from an individual bison can be reliably predicted from a sample of tail bulb fat.
Step 3. Identify Information Needed For the Decision
The data needed for this objective consist of: reliable and sensitive measures of COPCs in tail bulb fat, paired with reliable estimates of any cancer risk and non-cancer HI for edible tissue in the same bison. This will be evaluated using data from the same bison evaluated in Part 1 (above).
Step 4. Define the Boundaries of the Study The following are boundaries for the bison that were included in the three sample events described in Section 3.0:
• Spatial Boundaries are the pastures where bison have grazed. For this study, all bison grazed both the north (Figure 1 – Bison Pilot Area Range) and south (Figure 2 – Visitor Center Range) pastures.
• Temporal Boundaries are the length of time that the bison lived at the RMANWR. For this study, all bison included in the necropsy sampling were born on the RMANWR and were between one and two years in age.
In the future, as bison are grazed on other areas or as bison of other age groups are considered for release, additional data may be needed.
28
Step 5. Develop a Decision Rule The data will be evaluated by determining the strength of correlation between any risk (cancer risk and HI) and the concentration of COPCs in tail bulb fat. If the correlation is sufficiently strong, it will be concluded that tail bulb fat can be used as a prediction method. The strength of the correlation will be evaluated by creating graphs that plot the cancer or non-cancer risk from each of the sampled bison on the y-axis, and plots the concentration of a selected COPC on the x-axis. This correlation will be done in of the following two ways:
Evaluation Approach # 1: Correlation between Total Risk and an Indicator COPC Create a graph that shows total HI or total cancer risk (summed across all tissues and all COPCs) on the y-axis, and the concentration of a selected COPC in tail bulb fat on the x-axis. If any one COPC shows a strong correlation, then measurement of that COPC in tail bulb fat could be used as a “marker” for total risk from that bison. Evaluation Approach # 2: Correlation on a COPC by COPC basis Create a graph that shows total HI or total cancer risk (summed across all tissues for that specific COPC) on the y-axis, and the concentration of that COPC in tail bulb fat on the x-axis. If there is a strong correlation, then tail bulb fat may be used to predict the risk from that COPC.
Because it is not known which approach is likely to yield the most reliable and useful results, both data reduction procedures will be used. For nondedect data, both ½ of the reporting limit and the reporting limit, will be used in the correlations described in Evaluation Approach #1 and #2
Evaluation Approach #3: Risk assessment for nondedect data Evaluation Approach #1 and #2 described above cannot be applied if all data for bison tissue and tail bulb fat are nondedect. In this case, forward-going risk calculations will be used to estimate any cancer and noncancer risks for all tissues using both ½ the reporting limit and the reporting limit to facilitate risk management decision-making.
29
A priori, it is not known what mathematical models will provide the best fit to the data, so a range of alternative models (linear, non-linear) may be evaluated, as suggested by the data. The strength of the relation for any given model and data set will be assessed using an appropriate statistical goodness of fit statistic, as well as visual inspection of the agreement between observed risk and model predictions. Step 6. Specify Acceptable Limits on Decision Error
As above, two types of decision errors may occur:
• Type I error: In this case, it is concluded that risk from a bison is within acceptable limits, when in fact the true risk exceeds acceptable limits.
• Type II error: In this case, it is concluded that risk from a bison is above
acceptable limits, when in fact the true risk is within acceptable limits. The probability of a Type I decision error will be minimized by basing the decision on the upper 95 percent confidence limit on the risk predicted from tail-bulb fat, rather than the best estimate of risk. This will automatically limit the probability of Type I errors to approximately 5 percent.
Step 7. Optimize the Design
As above, two factors are needed to optimize the study design for Part 2 of this effort:
1) Ensure that samples of tail bulb fat are analyzed with methods that are sufficiently reliable and sensitive to detect COPCs if concentrations in edible tissues approach or exceed levels that are of potential healthy concern.
2) Ensure that a sufficient number of samples are collected such that the probability of a Type II error is not excessive. In this case, the number of samples available (tissues from 11 bison) is fixed. However, the probability of a Type II error can be calculated after the data are available, and if the probability is greater than desirable, the results from this study can be used to estimate the number of additional samples that may be needed in the future
4.2 Selection of COPCs for Analysis in Existing Bison Samples Selection of analytes for the Bison Tissue Contaminant study was based on review of the RMA Remedial Investigation (RI) (EBASCO 1989), a USFWS study of tissue contaminants in deer that was conducted before the remedy was initiated (Creekmore
30
et al. 1999), a review of available soil contaminant data for the current bison pasture area, and an evaluation of bioconcentration potential and persistence conducted by the Regulatory Agencies. A two-stage review was conducted to select contaminants of potential concern (COPCs) for analysis of bison tissue samples. Based on the initial screen, 21 COPCs were proposed for evaluation of tissue consumption. The two major selection criteria were:
1. Historical presence at the RMA. 2. Bioaccumulation factor, as determined by the U.S. Environmental Protection
Agency’s (EPA’s) Persistent, Bioaccumulative and Toxic (PBT) Profiler.
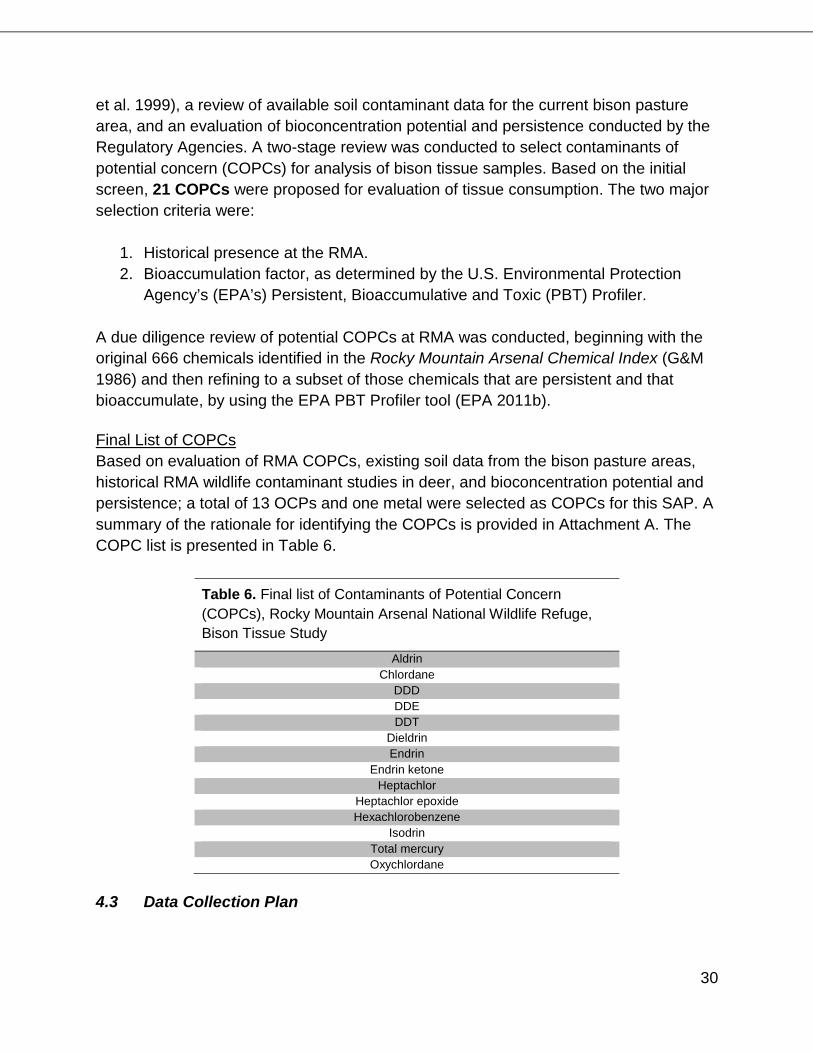
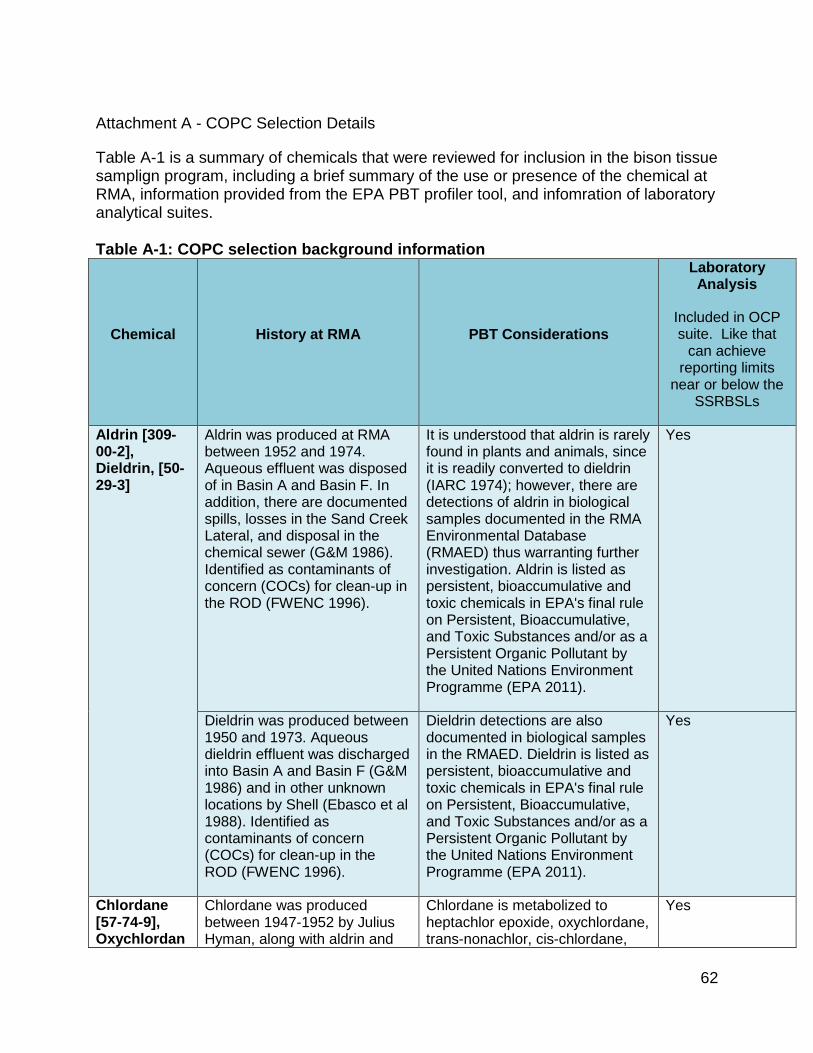
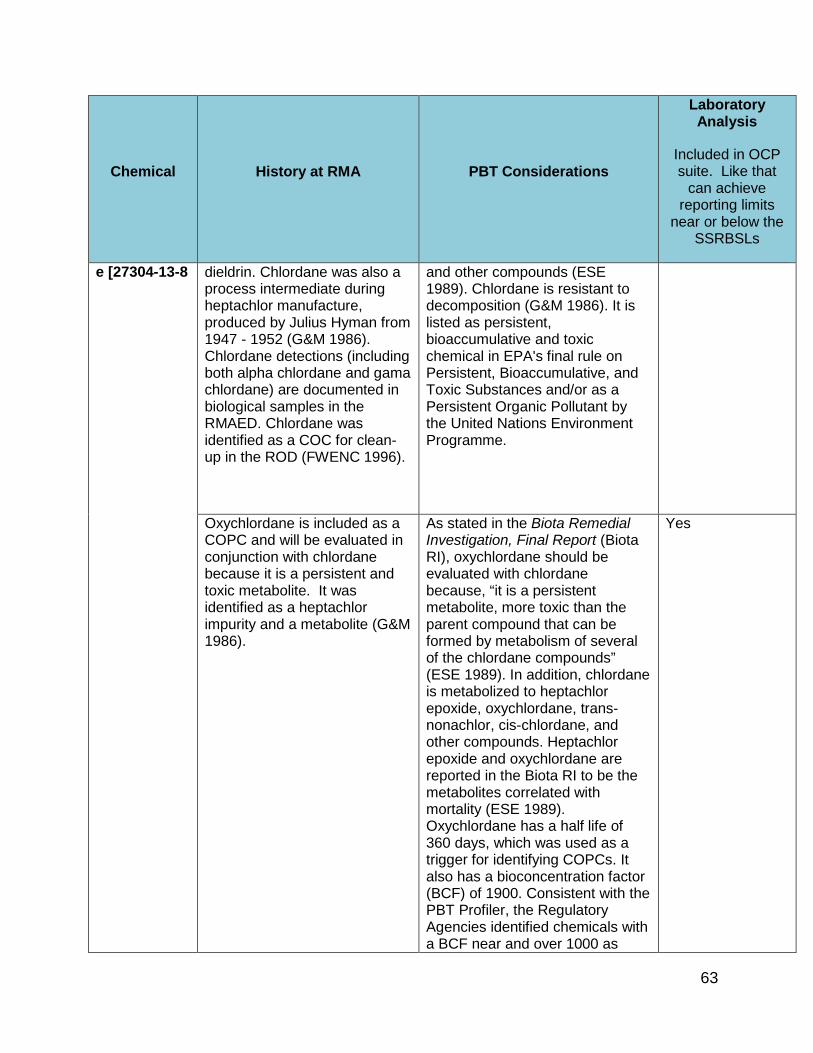
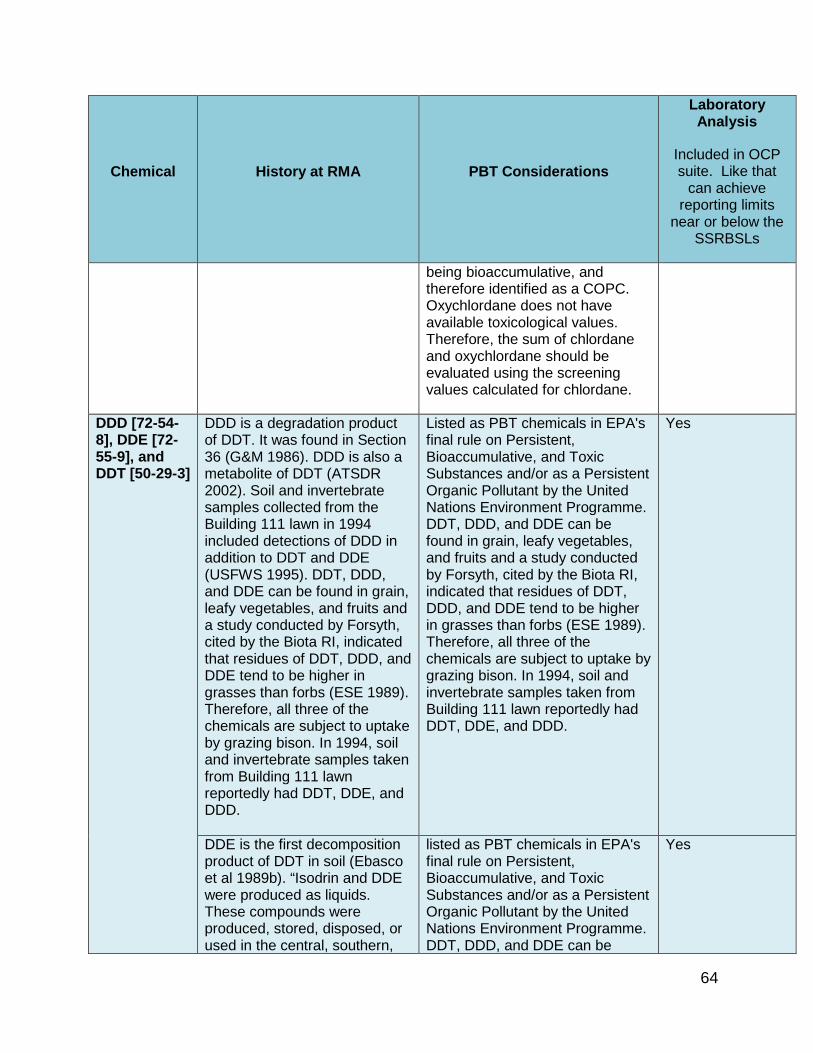
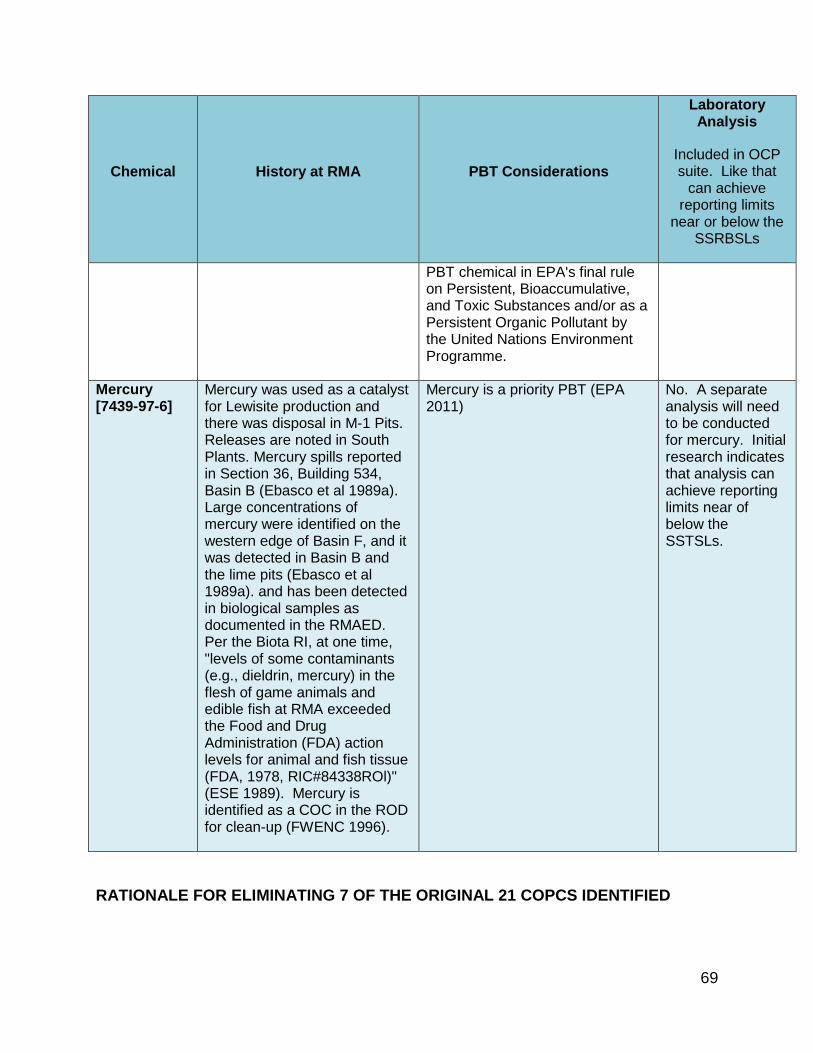
A due diligence review of potential COPCs at RMA was conducted, beginning with the original 666 chemicals identified in the Rocky Mountain Arsenal Chemical Index (G&M 1986) and then refining to a subset of those chemicals that are persistent and that bioaccumulate, by using the EPA PBT Profiler tool (EPA 2011b). Final List of COPCs Based on evaluation of RMA COPCs, existing soil data from the bison pasture areas, historical RMA wildlife contaminant studies in deer, and bioconcentration potential and persistence; a total of 13 OCPs and one metal were selected as COPCs for this SAP. A summary of the rationale for identifying the COPCs is provided in Attachment A. The COPC list is presented in Table 6.
Table 6. Final list of Contaminants of Potential Concern (COPCs), Rocky Mountain Arsenal National Wildlife Refuge, Bison Tissue Study
Aldrin Chlordane
DDD DDE DDT
Dieldrin Endrin
Endrin ketone Heptachlor
Heptachlor epoxide Hexachlorobenzene
Isodrin Total mercury Oxychlordane
4.3 Data Collection Plan
31
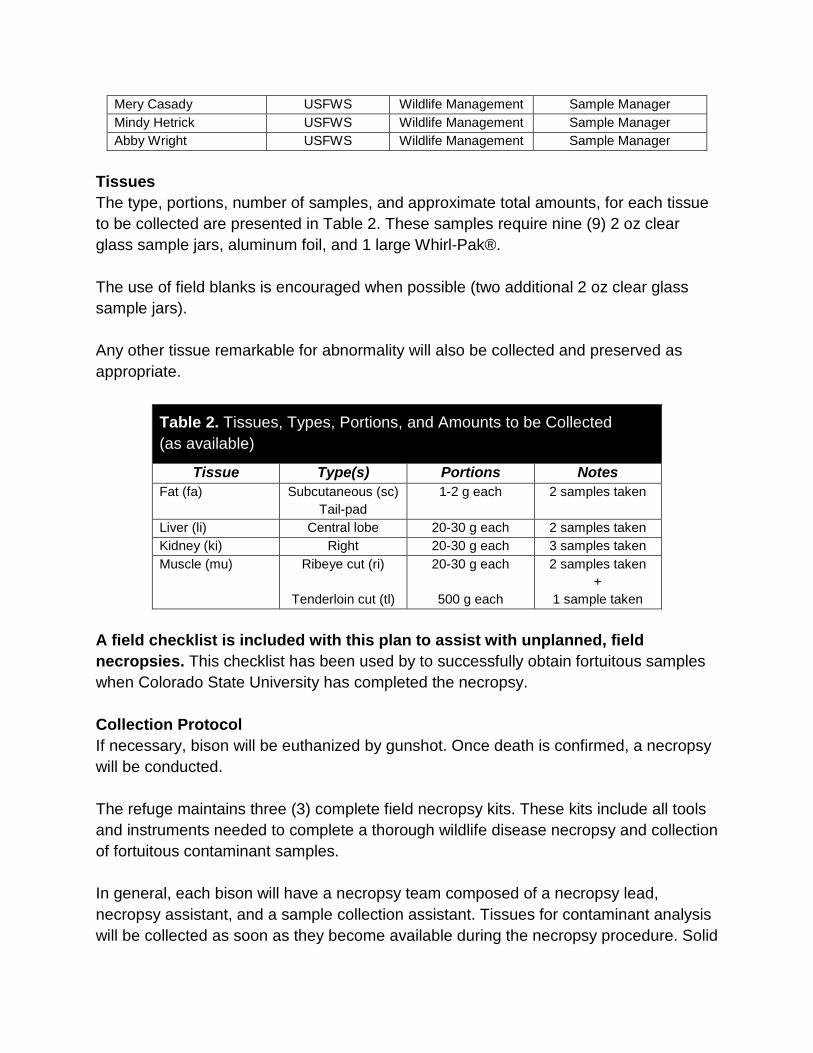
Tissues collected by USFWS will be analyzed in accordance with this SAP. Samples of tail bulb fat (1g), skeletal muscle, liver, and kidney (20-30g) will be submitted for OCP analysis. A separate kidney sample (20-30g) from each of the necropsied animals will be submitted for total mercury analysis. A total of 52 (4 x 13 animals) samples will be used for OCP analysis and 11 (1 x 11 animals) kidney samples will be used for total mercury. A total of 14 samples will be analyzed as duplicates.
5.0 SAMPLE COLLECTION, PREPARATION, AND SUBMISSION
5.1 Sampling, Packaging, and Shipping Procedures described in this section are designed to ensure sample integrity. Samples must be properly handled during packaging and shipping to the laboratory. 5.1.1 Necropsy Sampling Procedures Bison tissue necropsy samples were collected by USFWS during three events:
• January 2014, prior to preparation of this SAP. Sample collection details are contained in the Bison Food Safety Program, Tissue Collection Plan prepared for the January 2014 necropsy (USFWS 2014a; Attachment B).
• December 2014. These samples were collected in accordance with the Bison Tail Bulb Biopsy and Tissue Necropsy Sampling and Analysis Plan (USFWS 2014b).
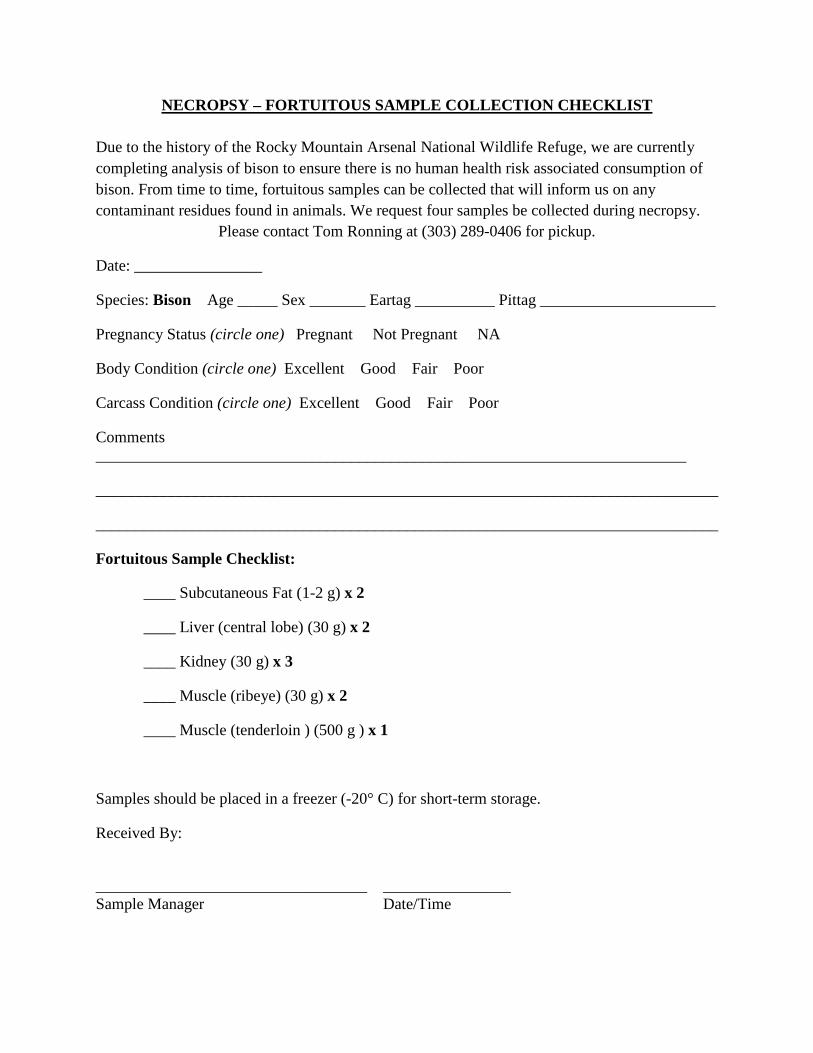
• April 2015. A bison was euthanized after being injured from by a vehicle. Samples were collected in accordance with the Fortuitous Sample Checklist found in the Bison Tail Bulb Biopsy and Tissue Necropsy Sampling and Analysis Plan (USFWS 2014b).
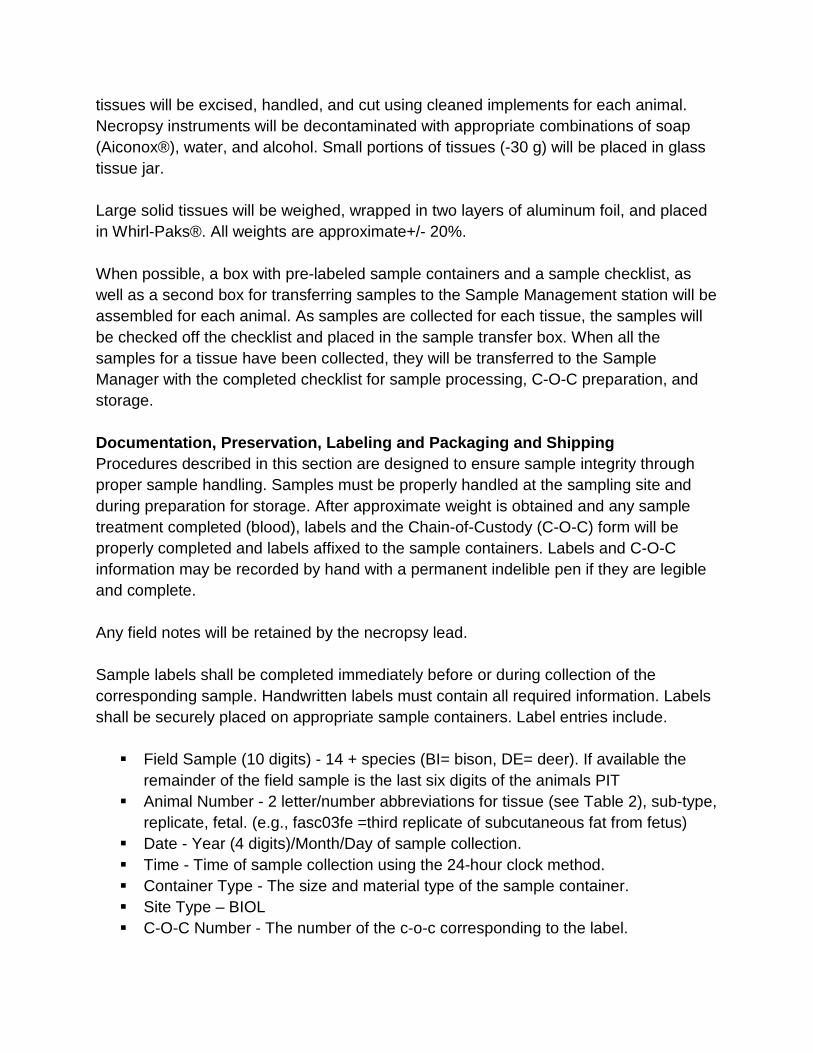
Bison were euthanized by gunshot and transported to the necropsy area. Tissues for contaminant analysis were collected as soon as available by a necropsy team. Solid tissues were excised, handled, and cut using cleaned implements for each animal. Necropsy instruments were decontaminated in soap solutions (Alconox® and water). Small portions of tissues (~1-30 g) were placed in glass tissue jars and approximate weight noted. Large solid tissues were weighed, wrapped in two layers of aluminum foil, and place in Whirl-Paks®. Two empty 2 oz. glass sample jars were opened during each round of necropsies and stored as trip blanks. Samples were stored without any preservatives in a cooler with ice and transferred to a freezer.
5.1.2 Bulk Sample Storage
32
Samples have been stored together in a dedicated freezer since necropsy. No preservation methods beyond freezing were used. The freezer is maintained at a temperature of approximately -20˚C (+/- 2˚C). The freezer is equipped with an alarm if power is interrupted. The samples will be placed in a secure freezer in Building 120.
5.1.3 Preparation of Subsamples for Shipment All samples were/will be placed in sample jars with correct sample size. Necropsy samples were cut and stored in appropriate sizes so that no thawing or sub-sampling will be required. For shipment, frozen sample containers were/will be placed in a cooler with sufficient ice to keep the samples frozen during shipment to the laboratory. The cooler will be packed to prevent sample breakage. Secure the cooler lid with shipping tape and affix signed and dated custody seals to the cooler box and lid. Information shall be recorded on labels and chain of custody (C-O-C) forms using the RMA C-O-C Entry computer program. Labels and C-O-C information may be recorded by hand with a permanent indelible pen if they are legible and complete.
5.1.4 Sample Labeling Sample labels shall be completed in accordance with the Tissue Collection Plan (Appendix C) immediately before or during collection of the corresponding sample. Handwritten labels must contain all required information. Labels shall be securely placed on appropriate sample containers. Custody seals will be used to ensure that sample container integrity is not compromised. Custody seals are placed on individual sample containers or on the outside shipping container in such a manner that the container cannot be opened without compromising the custody seal. C-O-C forms are submitted electronically to the laboratory. In addition, an original hardcopy of the C-O-C accompanies all shipments and deliveries. All samples sent to the laboratory by the USFWS are labeled with a freezer-proof printed Mylar label documenting sample chain of custody information.
5.1.5 Sample Shipment
33
Samples will be shipped to the contract laboratory using Federal Express (FedEx) Priority Overnight® service in order for samples to arrive at the laboratory as soon as possible following sample collection. Coolers will be returned to RMA using FedEx 2Day® delivery when possible. Samples to be used for the MDL studies will be obtained locally by the candidate laboratories. Bison necropsy tissue samples that are to be analyzed by the selected laboratory are expected to be shipped by April 30, 2015. The standard turnaround time (TAT) of 28 days will be requested for all samples. 5.2 Sample Control Information shall be recorded on labels and chain of custody forms. Labels and C-O-C information may be recorded by hand with a permanent indelible pen if they are legible and complete. Handwritten C-O-Cs and labels should be avoided, if possible.
C-O-C records will be used to document the security and control process for samples from the time of collection until delivery to the laboratory. Copies of C-O-Cs are included in analytical data packages from the laboratory.
Custody seals will be used to ensure that sample container integrity is not disturbed. Custody seals are placed on individual sample containers or on the outside shipping container in such a manner that the container cannot be opened without compromising the custody seal. Once in place, either the sampler or their designee, or the laboratory can break custody seals. In order to transfer custody of the samples, one of the individuals collecting the samples will sign the C-O-C in the first "Relinquished By" box, located under the “Other Notes” box. The date and time of relinquishment is indicated in the "Date" and "Time" boxes. The person receiving the samples shall sign in the adjacent "Received By" box. Note that FedEx does not sign custody forms. If the sample is placed in a locked storage location, such as a refrigerator, prior to shipment to the laboratory, the date and time of storage is entered in the first date and time boxes and the location is entered in the first "Received By" box. When the sample is removed from storage, the handler will initial the "Relinquished By" box indicating where the sample was received from, the time and date, and sign the "Received By" box following the date. C-O-Cs are submitted electronically to the laboratory. In addition, an original hardcopy
34
of the C-O-C accompanies all shipments and deliveries. C-O-C numbers will be recorded on appropriate field data sheet and/or field logbook. 5.2.1 Final Project Files Custody Procedures The final project files for the soil sampling project data will be maintained and will be under the custody of the Project Manager in a secured area. At a minimum, the project file will contain relevant records including:
• Field logbooks • Photographs • Original field sampling forms • Laboratory data deliverables • Data validation reports • Data assessment reports • Progress reports, QA reports, interim project reports • Custody documentation (chain-of-custody forms, waybills).
5.3 Quality Control of Sample Collection, Handling, and Shipment To obtain representative and consistent samples from each tissue, specific tissue locations are identified in Table 2 of the Tissue Collection Plan. Additional measures to obtain representative samples, sample control, and tissue packaging/storage are described in more detail in the following section. The following QC measurers were/will be implemented during sample collection, handling and shipment: 5.3.1 January 2014 Necropsy Samples Tissue and tail-bulb fat samples were collected in accordance with the Tissue Bison Food Safety Tissue Collection Protocol (USFWS 2014). These samples were collected by USFWS, prior to preparation of this SAP. The project Toxicologist oversaw the necropsy procedures. In addition, the USFWS necropsy trainer/expert in bison herd genetics and culling oversaw the necropsy and verified that the necropsy was conducted in accordance with the Bison Food Safety Tissue Collection Protocol (USFWS 2014; Attachment B). These individuals were responsible for initiation of any identified corrective actions immediately during the tissue collection process. No protocol deviations were noted. Quality control measures included the following:
• Solid tissues were excised, handled, and cut using cleaned implements for each animal. Necropsy instruments were decontaminated with appropriate combinations of soap (Alconox®), water, and alcohol to prevent potential cross contamination between animals.
35
• Two empty 2oz. sample jars were opened during each round of necropsies and
stored as trip blanks for the laboratory analyses.
• C-O-C procedures described in Sections 5.1.4 and 5.2 were followed during sample handling.
• Custody seals were used to ensure that sample container integrity was not compromised. Custody seals were placed on individual sample containers or on the outside shipping container in such a manner that the container cannot be opened without compromising the custody seal.
• Samples were flash frozen with dry ice, and selected tissues placed in lockable -20°C freezers for short-term storage; additional tissues may eventually be placed in a -80°C freezer for long-term storage based on schedule considerations.
• Field precision was addressed by the selection of similar collection locations for tissue samples from each organ.
• Whenever possible, duplicate tissue samples will be prepared and sent to the laboratory at a frequency of 1 in 10, for each type of tissue. When/if there is sufficient tail-bulb fat to prepare a duplicate sample, duplicates will be prepared for laboratory analysis. For the January 2014 necropsy, 3 of the 11 bison that underwent necropsies were analyzed to serve as QC for the sample collection, handling and shipment.
5.3.2 December 2014 Necropsy Samples Tissue and tail-bulb fat samples were collected in accordance with the Bison Tail Bulb Biopsy and Tissue Necropsy Sampling and Analysis Plan (USFWS 2014b). Procedures for sample collection are similar to those in section 5.3.1 and include a checklist for fortuitous sample collection.
36
PART II – Laboratory Plan
6.0 ANALYTICAL LABORATORY REQUIREMENTS
Analytical laboratory QA/Quality Control (QC) procedures are based on requirements specified in the RMA Sampling Quality Assurance Project Plan (SQAAP) (Navarro Research and Engineering Inc. 2014) and the analytical methods approved by the OMC Sampling Manager and OMC Chemist, and are addressed in laboratory-specific QA plans. The SQAAP describes the RMA management control systems that have been established to ensure the achievement of quality in a planned and systematic manner, and to ensure lab support compliance with applicable requirements of the RMA SQAPP.
6.1 Site-Specific Risk-Based Screening Levels and Target Detection Limits Site-specific risk-based screening levels were calculated for the bison study to identify laboratory detection/reporting limits. The equations for derivation of site-specific risk-based screening levels (SSRBSLs) are:
Cancer RBSL (mg/kg) = TR x 365 x LT x BW / EF x ED x CSFo x IRb x 10-6
Non-cancer RBSL (mg/kg) = THQ x 365 x ED x BW / EF x ED x (1/RfDo) x IRb x 10-6
where:
TR = target cancer risk (unitless)
THQ = target hazard quotient (unitless)
LT = lifetime (yr)
BW = body weight (kg)
EF = exposure frequency (d)
ED = exposure duration (yr)
CSFo = oral cancer slope factor (mg/kg d)-1
RfDo = oral reference dose (mg/kg d)
IRb = ingestion rate of bison (mg/d)
37
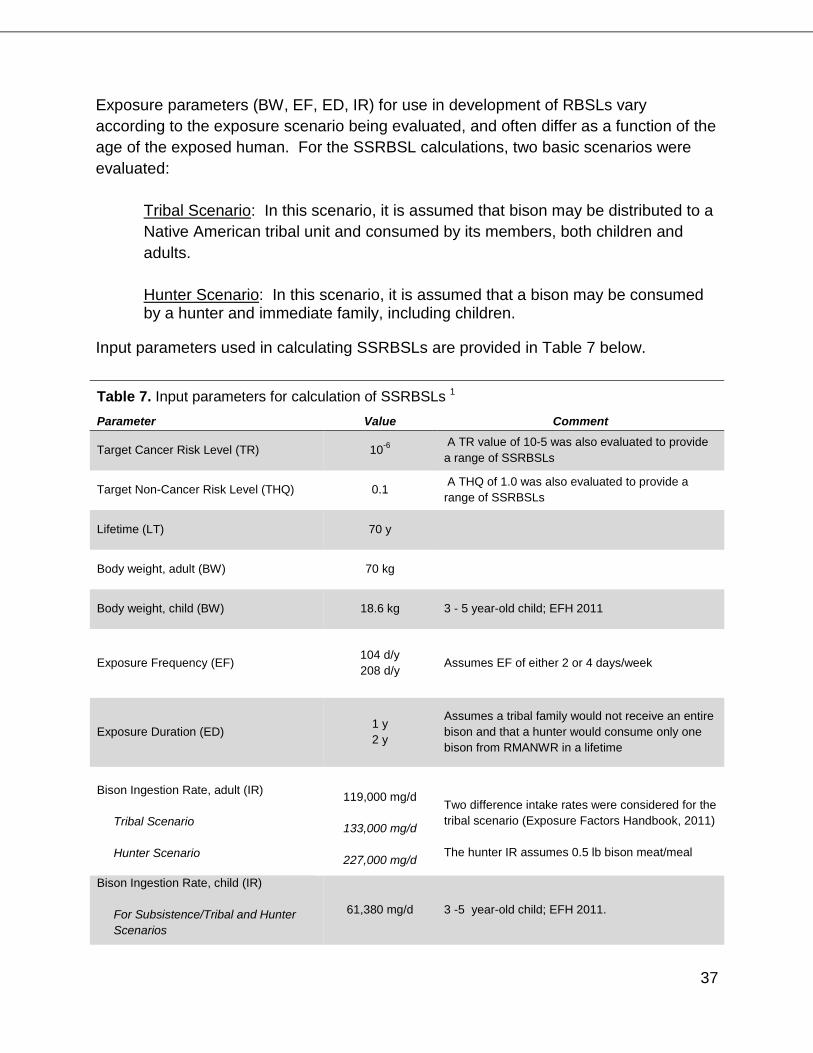
Exposure parameters (BW, EF, ED, IR) for use in development of RBSLs vary according to the exposure scenario being evaluated, and often differ as a function of the age of the exposed human. For the SSRBSL calculations, two basic scenarios were evaluated:
Tribal Scenario: In this scenario, it is assumed that bison may be distributed to a Native American tribal unit and consumed by its members, both children and adults. Hunter Scenario: In this scenario, it is assumed that a bison may be consumed by a hunter and immediate family, including children.
Input parameters used in calculating SSRBSLs are provided in Table 7 below.
Table 7. Input parameters for calculation of SSRBSLs 1
Parameter Value Comment
Target Cancer Risk Level (TR) 10-6 A TR value of 10-5 was also evaluated to provide a range of SSRBSLs
Target Non-Cancer Risk Level (THQ) 0.1 A THQ of 1.0 was also evaluated to provide a range of SSRBSLs
Lifetime (LT) 70 y
Body weight, adult (BW) 70 kg
Body weight, child (BW) 18.6 kg 3 - 5 year-old child; EFH 2011
Exposure Frequency (EF) 104 d/y 208 d/y Assumes EF of either 2 or 4 days/week
Exposure Duration (ED) 1 y 2 y
Assumes a tribal family would not receive an entire bison and that a hunter would consume only one bison from RMANWR in a lifetime
Two difference intake rates were considered for the tribal scenario (Exposure Factors Handbook, 2011) The hunter IR assumes 0.5 lb bison meat/meal
Bison Ingestion Rate, child (IR) For Subsistence/Tribal and Hunter Scenarios
61,380 mg/d 3 -5 year-old child; EFH 2011.
38
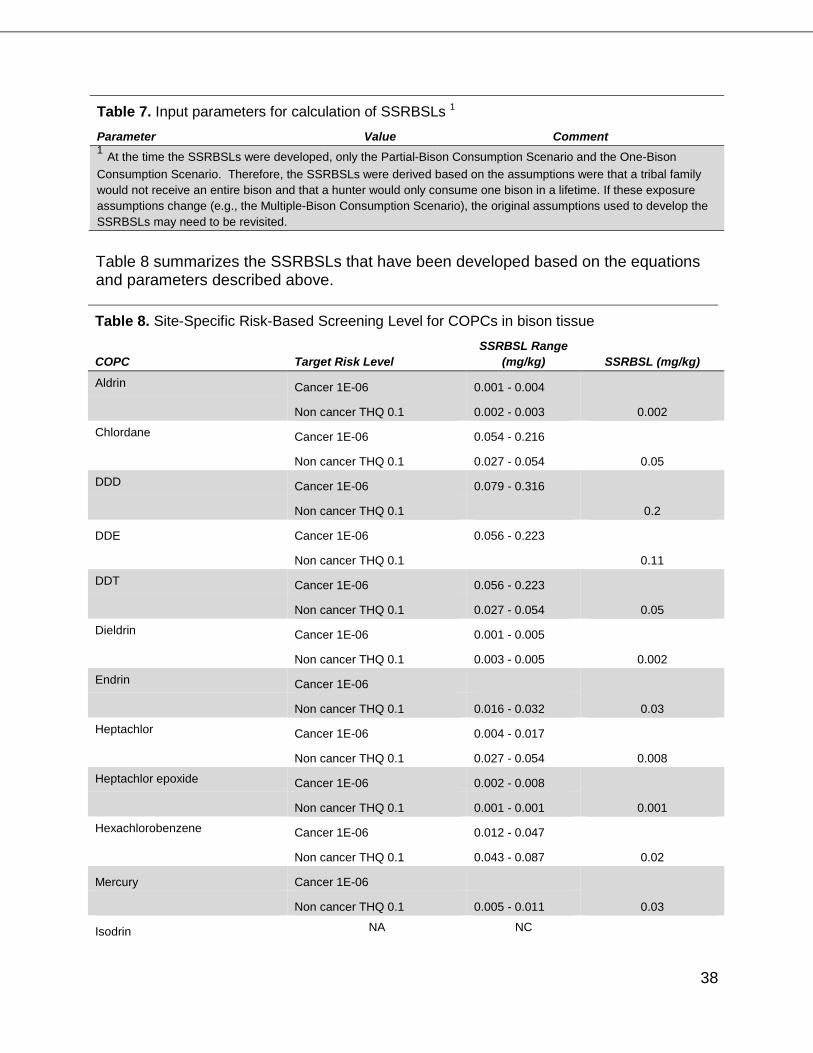
Table 7. Input parameters for calculation of SSRBSLs 1
Parameter Value Comment 1 At the time the SSRBSLs were developed, only the Partial-Bison Consumption Scenario and the One-Bison Consumption Scenario. Therefore, the SSRBSLs were derived based on the assumptions were that a tribal family would not receive an entire bison and that a hunter would only consume one bison in a lifetime. If these exposure assumptions change (e.g., the Multiple-Bison Consumption Scenario), the original assumptions used to develop the SSRBSLs may need to be revisited.
Table 8 summarizes the SSRBSLs that have been developed based on the equations and parameters described above.
Table 8. Site-Specific Risk-Based Screening Level for COPCs in bison tissue
COPC Target Risk Level
SSRBSL Range (mg/kg) SSRBSL (mg/kg)
Aldrin Cancer 1E-06 0.001 - 0.004
0.002 Non cancer THQ 0.1 0.002 - 0.003
Chlordane Cancer 1E-06 0.054 - 0.216
0.05 Non cancer THQ 0.1 0.027 - 0.054
DDD Cancer 1E-06 0.079 - 0.316
0.2 Non cancer THQ 0.1
DDE Cancer 1E-06 0.056 - 0.223
0.11 Non cancer THQ 0.1
DDT Cancer 1E-06 0.056 - 0.223
0.05 Non cancer THQ 0.1 0.027 - 0.054
Dieldrin Cancer 1E-06 0.001 - 0.005
0.002 Non cancer THQ 0.1 0.003 - 0.005
Endrin Cancer 1E-06
0.03 Non cancer THQ 0.1 0.016 - 0.032
Heptachlor Cancer 1E-06 0.004 - 0.017
0.008 Non cancer THQ 0.1 0.027 - 0.054
Heptachlor epoxide Cancer 1E-06 0.002 - 0.008
0.001 Non cancer THQ 0.1 0.001 - 0.001
Hexachlorobenzene Cancer 1E-06 0.012 - 0.047
0.02 Non cancer THQ 0.1 0.043 - 0.087
Mercury Cancer 1E-06
0.03 Non cancer THQ 0.1 0.005 - 0.011
Isodrin NA NC
39
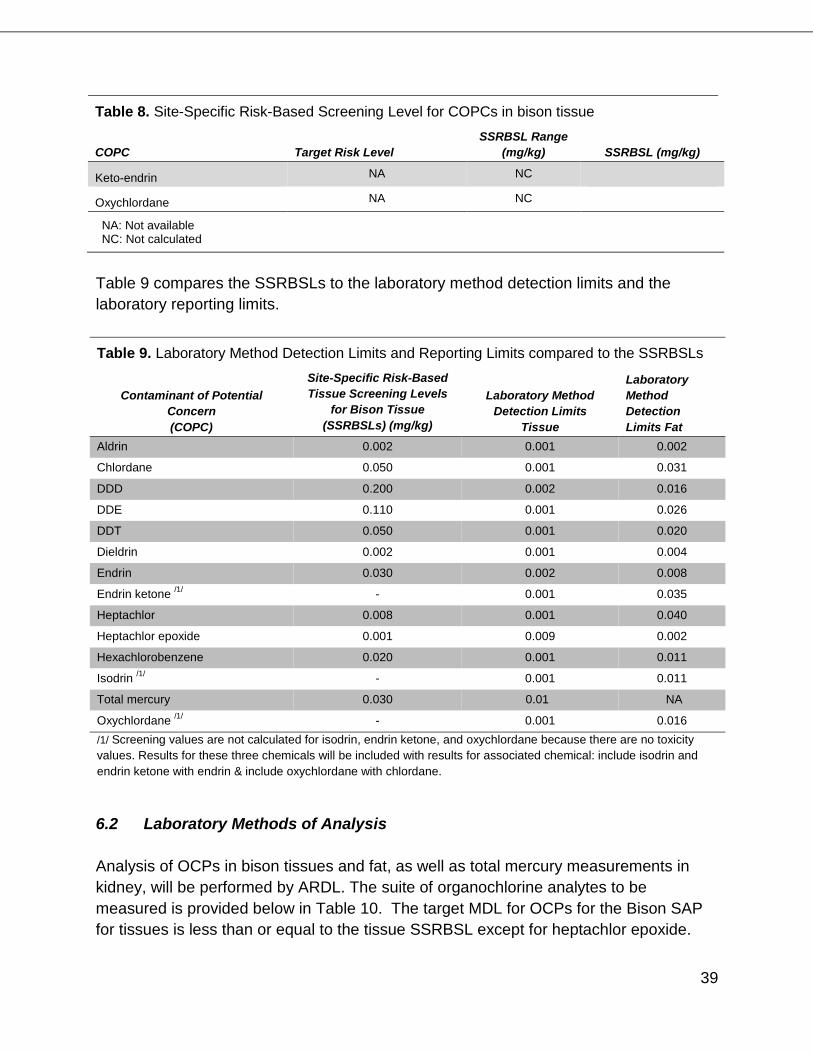
Table 8. Site-Specific Risk-Based Screening Level for COPCs in bison tissue
COPC Target Risk Level
SSRBSL Range (mg/kg) SSRBSL (mg/kg)
Keto-endrin NA NC
Oxychlordane NA NC
NA: Not available NC: Not calculated
Table 9 compares the SSRBSLs to the laboratory method detection limits and the laboratory reporting limits.
Table 9. Laboratory Method Detection Limits and Reporting Limits compared to the SSRBSLs
Contaminant of Potential
Concern (COPC)
Site-Specific Risk-Based Tissue Screening Levels
for Bison Tissue (SSRBSLs) (mg/kg)
Laboratory Method Detection Limits
Tissue
Laboratory Method Detection Limits Fat
Aldrin 0.002 0.001 0.002
Chlordane 0.050 0.001 0.031
DDD 0.200 0.002 0.016
DDE 0.110 0.001 0.026
DDT 0.050 0.001 0.020
Dieldrin 0.002 0.001 0.004
Endrin 0.030 0.002 0.008
Endrin ketone /1/ - 0.001 0.035
Heptachlor 0.008 0.001 0.040
Heptachlor epoxide 0.001 0.009 0.002
Hexachlorobenzene 0.020 0.001 0.011
Isodrin /1/ - 0.001 0.011
Total mercury 0.030 0.01 NA
Oxychlordane /1/ - 0.001 0.016 /1/ Screening values are not calculated for isodrin, endrin ketone, and oxychlordane because there are no toxicity values. Results for these three chemicals will be included with results for associated chemical: include isodrin and endrin ketone with endrin & include oxychlordane with chlordane.
6.2 Laboratory Methods of Analysis Analysis of OCPs in bison tissues and fat, as well as total mercury measurements in kidney, will be performed by ARDL. The suite of organochlorine analytes to be measured is provided below in Table 10. The target MDL for OCPs for the Bison SAP for tissues is less than or equal to the tissue SSRBSL except for heptachlor epoxide.
40
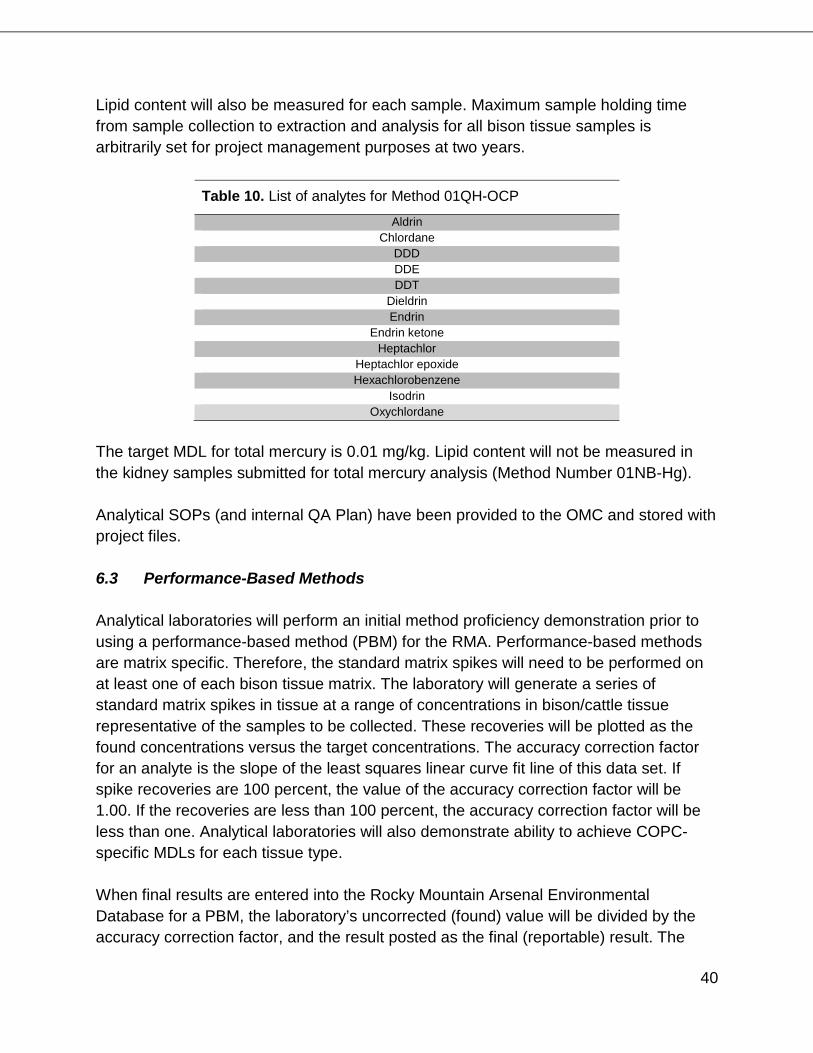
Lipid content will also be measured for each sample. Maximum sample holding time from sample collection to extraction and analysis for all bison tissue samples is arbitrarily set for project management purposes at two years.
Table 10. List of analytes for Method 01QH-OCP
Aldrin Chlordane
DDD DDE DDT
Dieldrin Endrin
Endrin ketone Heptachlor
Heptachlor epoxide Hexachlorobenzene
Isodrin Oxychlordane
The target MDL for total mercury is 0.01 mg/kg. Lipid content will not be measured in the kidney samples submitted for total mercury analysis (Method Number 01NB-Hg). Analytical SOPs (and internal QA Plan) have been provided to the OMC and stored with project files. 6.3 Performance-Based Methods Analytical laboratories will perform an initial method proficiency demonstration prior to using a performance-based method (PBM) for the RMA. Performance-based methods are matrix specific. Therefore, the standard matrix spikes will need to be performed on at least one of each bison tissue matrix. The laboratory will generate a series of standard matrix spikes in tissue at a range of concentrations in bison/cattle tissue representative of the samples to be collected. These recoveries will be plotted as the found concentrations versus the target concentrations. The accuracy correction factor for an analyte is the slope of the least squares linear curve fit line of this data set. If spike recoveries are 100 percent, the value of the accuracy correction factor will be 1.00. If the recoveries are less than 100 percent, the accuracy correction factor will be less than one. Analytical laboratories will also demonstrate ability to achieve COPC-specific MDLs for each tissue type. When final results are entered into the Rocky Mountain Arsenal Environmental Database for a PBM, the laboratory’s uncorrected (found) value will be divided by the accuracy correction factor, and the result posted as the final (reportable) result. The
41
same adjustment will be made for the MDLs. Accuracy factors outside of a range of 50-125 percent should be noted in all results packages. Performance Evaluation (PE) Samples The laboratory will measure OCPs in two PE samples prepared for each tissue type for a total of 8 PE samples. The laboratory will measure total mercury in one PE kidney sample. The PE samples will be prepared by the OMC or its subcontractor. Final sample concentration for the OCP PE sample will be targeted at approximately 25 percent above the MDL for dieldrin. Final sample concentration for the total mercury PE sample will targeted at approximately 25 percent above the MDL for total mercury. 6.4 Data Quality Requirements
Data quality evaluation methods and criteria are described in detail in Section 8.2, Data Usability. A MDL study was conducted to identify a laboratory and analytical methods that could achieve reporting limits at or below the SSRBSLs. MDLs were established in fat and muscle of the suite of specified organochlorine pesticides. Method 01QH-OCP was determined to be suitable for meeting data quality requirements. The detection limits and reporting limits are identified in Table 9. Method Number 01NB-Hg will be used for total mercury analysis in kidney tissue. Anticipated concentrations of OCPs are expected to be in the range of 0.001 to 0.1 ug/g. Mercury concentrations in kidney are expected to be in the range of 0.005-0.05 ug/g. Holding times for interval between sample collection and extraction have been arbitrarily set at 2 years based on the stability of OCPs and mercury in frozen tissue. 6.5 Analytical Equipment Calibration Calibration is a reproducible reference to which all sample measurements can be correlated. Accuracy of calibration standards is critical because all data will be in reference to these standards. A sound program for the laboratory includes documentation of calibration:
• Frequency • Procedures • Standards • Records that reflect the calibration history of a measurement system
42
Tools, gauges, instruments, and other sampling, measuring, and test equipment that affects quality used for measurement activities, shall be calibrated. At specified periods, recalibration shall be performed to ensure accuracy is within specified limits. Calibration shall be conducted using certified equipment or standards that have a known valid relationship to nationally recognized measurement standards. The laboratory will be responsible for operating and maintaining all testing equipment as specified in the appropriate test methods and as specified in the RMA SQAPP.
6.6 Analytical Equipment Maintenance, Testing, and Inspection The maintenance program for laboratory equipment shall provide documented long-term, in-depth maintenance on all measuring, sampling, and general laboratory equipment and support facilities. This program may include an in-house/on-site maintenance shop or full service maintenance agreement(s) with a commercial vendor(s). 6.7 Analytical Control Analytical QC is the systematic process of analytical protocols that controls the validity of analytical results by measuring the accuracy and precision for each method and matrix, developing expected control limits, using these Data Quality Indicators (DQIs) to identify anomalous events, and taking corrective action to prevent or minimize the recurrence of these events. QC checks are required for all laboratory measurement processes used to produce the final data package. Waivers to SQAPP requirements may be allowed if documented properly and approval is obtained prior to implementation. In-control QC sample results do NOT ensure that final data is suitable for its intended purpose. Documented results obtained from laboratory QC samples must be evaluated against acceptance criteria per the specific laboratory SOP. QC checks verify that:
• Sample collection and preservation operations were conducted. • Holding times were met. • Values obtained from all QC samples have met method acceptance criteria per
the analytical SOP.
Analytical laboratory QC samples may include method blanks, laboratory control samples, internal standards, calibration verifications, and matrix spike samples which will be analyzed in accordance with the RMA SQAPP and the approved analytical methods.
43
6.8 Data Package Deliverables The term "data package" refers to paperwork (either manually or electronically generated) that pertains to a specific analysis for an analytical lot or batch of samples. Data packages will be assembled as specified by the RMA SQAPP and/or the lab support contract, and are stand-alone documents. The lab support manager shall require data package submission, so that independent data review can be performed prior to data package transfer and storage at the RMA Technical Information Center (RTIC). 6.9 Data Tracking and Control When the laboratory receives sample shipments, the original C-O-C and air bill forms should be signed and placed in a permanent project record or data package. If copies of originals are placed in data packages, the location of the original forms should be annotated on the copies. Enclosed forms should be checked for completeness. Upon receipt of samples, the laboratory shall generate a sample condition form that will document the condition of samples as received. Any sample container breakage, documentation discrepancies, improper preservation, or other deficiencies will be noted on this form. This form must be signed and dated by the appropriate sample management personnel at the laboratory. Receipt of the samples should be logged into the laboratory information management/tracking system. C-O-C procedures shall be followed for all samples submitted. C-O-C documentation must show samples were secure at all times and tampering could not have occurred. Documentation must also show hand-to-hand custody of samples. Laboratory personnel are responsible for all samples and documentation in their possession. After the final data package is received and accepted, the laboratory will dispose of the RMA samples.
7.0 MEASUREMENT AND DATA ACQUISITION
7.1 Systems Measurement and data acquisition systems encompass the procedures by which environmental samples are collected and analyzed. The QC measures associated with the sampling process design and implementation are described in Sections 5, 6, and 7
44
of this SAP. The following discussion addresses procedures to be followed in the analytical laboratory. 7.2 Laboratory Qualifications The laboratory will perform the analyses required for determination of sample constituents. Analyses will be conducted in accordance with OMC-approved methods and demonstrated method proficiency requirements stated in the RMA SQAPP (Navarro Research and Engineering Inc. 2014). The laboratory has an internal QA plan. The laboratory will also be expected to provide an internal QA Plan to the OMC for approval if one is not already on file. All laboratories performing work in support of the Operations and Maintenance Contract at RMA must adhere to the requirements identified in the SQAPP. Any variance from SQAPP requirements must be requested in writing and approved by the OMC prior to the performance of associated analytical work. The OMC is responsible for ensuring that its subcontract laboratories perform the following:
• Participate in performance audits as required • Participate in on site quality system and data audits by an authorized Navarro
Research and Engineering audit team • Correct any deficiencies identified during audits and other reviews and provide
written reports of corrective actions to the OMC PM for approval • Satisfactorily perform Method Proficiency Demonstration (MPD) prior to
performing analytical work • Participate in the U.S. Army APLES as applicable • Ensure applicable SOPs are followed when performing all OMC work
The laboratory will be responsible for operating and maintaining all testing equipment as specified in the appropriate test methods. Only trained personnel will be allowed to operate, calibrate, and provide maintenance on the equipment or instruments, and only qualified laboratory personnel or service technicians will perform repairs. All maintenance and repair procedures will be documented in the instrument logs, which will be included in the laboratory project file. 8.0 DATA REVIEW, VERIFICATION, VALIDATION, AND USEABILITY
45
8.1 Data Review The OMC QA Validation Specialist will review sample data results. This process involves evaluating the analytical data to determine the certainty with which data may be used in making decisions. All data review and verification activities will be conducted in accordance with the RMA SQAPP (Navarro Research and Engineering Inc. 2014). The purpose of the data review is to evaluate data quality with respect to the established data quality objectives. Components of the data review process include data verification, data validation and data usability.
8.2 Data Verification Data verification is the process of evaluating the completeness, correctness, and conformance/ compliance of a specific data set against the method, procedural, or contractual requirements. When deficiencies in the data are identified, then those deficiencies should be documented for the data user’s review and, where possible, resolved by corrective action. Data verification applies to activities in the field as well as in the laboratory. The components of field data verification include the following:
• Quality Assurance Project Plan (SQAPP) is current and has been approved. • Field logbooks and documentation are complete. • Equipment calibration data has been correctly recorded. • Chain-of-Custody forms have been correctly completed. • Shipping airbills have been correctly completed. • Deviations from the SQAPP have been documented.
Verification of analytical data is performed by the contractor responsible for administration of the RMAED. Data verification is accomplished through the use of RTRAC; the RMA’s transfer file checking program. The primary function of the program is to perform record checks on transfer files (TRNs). The record check routine evaluates each record in the TRN, examining the data in each record’s numerous text fields for correct format. The routine also examines the data to ensure that all entries are acceptable when validated against the RTRAC tables. The RTRAC program automatically performs over 100 data quality control checks for all chemical data that is loaded into the RMAED. Currently, the vast majority of data loaded via the RTRAC program is groundwater and treatment plant water data. The program can also check soil, air, and biological (plant and animal tissue) data.
46
The RTRAC program performs Record Checks and COC checks on text files generated by a laboratory after it performs the chemical analysis. The program initially compares the original sample information entered on the chain of custody to the subsequent data on the text file that is generated by the laboratory. After passing the COC checks, file formats are analyzed for conformance to RMAED fields and compliance to the valid value tables in the RMAED. Record Checks validate information for the following fields: laboratory, lot, method numbers, method certification dates, method reporting limits, site IDs, field sample numbers, sample dates, preparation dates, analysis dates, sampling programs, sample depths, lab analysis numbers, flag codes, and many other data integrity checks. The RTRAC program automatically adds rejection flags for data that exceeds holding times. Laboratory technicians can add additional qualifying flag codes to the data based on their professional judgment for estimated values, bias based on QC results, analytes found in QC blanks, and unusual storage or preservation conditions. Results of the RTRAC review are submitted electronically to the OMC Sampling Manager as a text file. The files list the analytical lot, method number and the results of the record and group check. An example of a RTRAC review text file is included below:
[LOT] [METHOD] [Results of Record & Group Check] _______________________________________________
8.3 Data Validation Data validation is an analyte- and sample-specific process that extends the evaluation of data beyond data verification to determine the analytical quality of a specific data set. Data validation includes a determination, where possible, of the reasons for any failure to meet method, procedural, or contractual requirements, and an evaluation of the impact of such failure on the overall data set. Data validation requirements are based on the USEPA National Functional Guidelines for Organic Methods Data Review (2008) and the USEPA National Functional Guidelines for Inorganic Methods Data Review (2010). The OMC will review final data packages and assess the data from two aspects – accuracy and defensibility. The extent of this assessment will be commensurate with the intended use of the data. A complete validation of the data package will be performed, including recalculation of detections and standards verification. Data packages will be reviewed to accomplish the following:
• Detect and correct any problems early in the project • Verify approved methods have been followed • Ensure the data are technically valid • Ensure root cause analysis and effective corrective action have been performed • Verify audit findings/observations concerning data have been corrected • Ensure corrective action taken is working • Verify programmatic requirements have been followed
For maximum effectiveness, final data package reviews shall be performed after the laboratory has performed data verification and before data packages are archived in the RTIC. Typical data package components reviewed during final data assessment may include the following:
• Summary of the analysis in the case narrative • Corrective action reports associated with the generation of data • Chain-of-custody records • Sample receipt documentation • Holding times • Sample preparation and analysis records • Standard and spiking solution traceability records • Reporting limits • Instrument calibration records
48
• QC sample recovery data • Raw data (e.g., mass spectra, chromatographs) • Comparison of example calculation result with the reported result
The data package review will be conducted using checklists to show the results of all reviews as well as any corrections made as a result of the review. Individual review checklists for organic data, inorganic data, organic air data, inorganic air data, and wet chemistry data are included in Appendices B through F, respectively. An overall concise report will be provided to the laboratory of data packages reviewed. In this report the reviewer summarizes comments on data that had no problems, data recommended to be qualified due to minor problems, data recommended to be qualified due to major problems, unacceptable data, problems that did not affect data, action items and areas of concern. If problems are noted during any stage of the review that put the technical acceptability of the data in question, the laboratory and appropriate project personnel will be contacted immediately and an unscheduled audit may be required. In extreme cases the laboratory may be required to suspend work until the problem has been corrected. The laboratory will be required to respond in writing to this report as to the root cause analysis performed and corrective action taken. A copy of the report may be provided to the RMA data management contractor, so that acceptable data can be identified. The response will document the corrective actions implemented due to the data package review. Responses should be submitted in a timely manner to correct problems early in the project. 8.4 Data Usability The data usability process is the final assessment that will be performed to ensure that the implementation of the sampling and analysis program described in this SAP provides results that can be used to meet the data quality objectives. Components of the data review process include; evaluating the data against the data quality indicators of precision, accuracy/bias, representativeness, completeness, and comparability; review of field and laboratory QC results; data verification and validation results; and evaluating the data for suitability based on the intended use (Navarro 2014). Deficiencies identified during this assessment will be reported to the Project Manager, OMC Quality Assurance Manager, and the Project Scientist, along with an indication of how the assessment will impact the use of the data. Limitations on the data will be communicated to the data users and the Regulatory Agencies in Data Summary Reports and prior to any preliminary evaluation of data.
49
Performance criteria will be based on the evaluation of Data Quality Indicators (DQIs). DQIs are the quantitative statistics and qualitative descriptors used to interpret the degree of acceptability of data to the user. Failure to meet performance criteria will not necessarily result in rejection of the data. Professional judgment combined with the DQI evaluation will be used to determine data usability. The principal data quality indicators are discussed below.
8.4.1 Precision Precision is the measure of agreement among replicate measurements of the same property, under prescribed similar conditions. Precision data indicate how consistent and reproducible the sampling or analytical procedures have been. Precision estimates will be calculated as the relative percent difference (RPD). Results of laboratory QA duplicates and field duplicates will be used to calculate precision. Note that laboratory QA duplicates are collected and analyzed for inorganics only. The formula for calculating relative percent difference is:
( )
( ) 1002/)(×
Χ−Χ
Χ−Χ=
βα
βαRPD
Where: RPD = relative percent difference Xα = sample value Xᵝ = duplicate sample value
The RPD values will be calculated from data where the sample and the duplicate sample are above the RL. The default performance criteria will be 35 percent.
Possible sources of variation that could result in poor precision include analytical measurement variation, poor sampling technique, variable sample storage, and sample handling/transport problems are. To identify the cause of imprecision, both field and analytical duplicate sample results will be reviewed. If poor precision is indicated in both the field and analytical duplicates/replicates, then the laboratory may be the source of error. If poor precision is limited to the field duplicate/ replicate results, then the problems with sampling technique, sample storage, and/or sample transport, may be the source of error.
8.4.2 Accuracy (Bias) Accuracy is a measure of the bias in a measurement system, defined as the closeness of the reported value to the true value. Potential sources of error that could affect data accuracy include the sampling process, sample preservation and handling, sample matrix, equipment decontamination, and analytical techniques. Accuracy of the
50
measurement system will be assessed by evaluating the results of quality control samples such as laboratory control spikes, and system monitoring compounds for organic analyses. Accuracy will be calculated as the percent recovery (%R) in the following manner:
( )
%100% ×Χ−Χ
=K
R us
Where: XS = measured value of the spiked sample XU = measured value of the unspiked sample K = known amount of spike in the sample
Accuracy of an analytical method is assessed by comparing the recovery of the LCS that is generated with every analysis batch, with the current control limits. Control limits are established from historical data by calculating 2-sigma (σ) [warning] and 3-sigma [control] limits around a central average recovery value. Although accuracy values can be calculated from a number of QC sample types (sample matrix spikes/spike duplicates, LCSs, single-blind and double-blind field spikes), analytical control for lab methods when available are assessed using the LCS recovery values for an analysis batch. Matrix spikes are utilized to account for matrix-related interferences. The calculated recovery rate is compared to standard lower and upper recovery rate limits of 80 percent to 130 percent respectively until the laboratory established method/analyte-specific ranges based on tissue sample analysis from RMA. Results outside the designated range will be subject to additional data validation to determine if qualification of the data is necessary. 8.4.3 Representativeness This parameter expresses the degree to which the sample data accurately and precisely represent a characteristic of the environmental condition. Representativeness is a qualitative parameter best addressed by ensuring that the proposed sampling techniques and the rationale used to select sampling locations are consistent with the overall project objectives. Representativeness is taken into consideration during collection of samples by following sampling procedures. 8.4.4 Comparability This qualitative parameter indicates the level of confidence with which one data set may be compared with another. Consistency in sample collection, storage, handling, and
51
analysis of samples is necessary for comparing results. Comparability will be achieved by using standard techniques to collect and analyze representative samples, and reporting chemical data in appropriate units. If comparability is not achieved, the data usability review will address the underlying issues. Comparability will be determined by evaluation of the performance evaluation program results as specified in the SQAPP Section 3.13. 8.4.5 Completeness This parameter is defined as the percentage of measurements made which are judged to be valid measurements compared to the total number of measurements planned in project-specific DQOs. Completeness may be calculated as follows:
Where: PC = relative percent completeness. V = the number of valid measurements completed (or
samples collected). n = the total number of samples collected
Acceptable completeness requirement is a Percent Completeness value of 90 percent (90 percent is the minimum acceptable value). 8.4.6 Sensitivity Sensitivity is an index of the ability of any analytical method or other detection procedure to make quantitative determinations at the level of interest. As described in the DQOs, the RLs will be set at or below SSRBSL to obtain data with sufficient sensitivity so that the data can be used for a variety of potential future risk evaluations. Laboratory data sensitivity is dependent on equipment maintenance, calibration, performance, and operator, as well as collection or extraction methods and sample handling. Internal laboratory QA/QC reviews verify compliance with analytical SOPs and practices necessary to achieve the required RLs. An additional performance criterion for sensitivity will be no analyte detections above the RL in the laboratory method blank and RLs set at or below the SSRBSLs. Analytical lots with method blank detections of target analytes exceeding the RL will be subject to a complete data validation review and/or data qualification.
PC = V n * 100
52
Method sensitivity (detection limit) is the minimum concentration of an analyte that can be reliably distinguished from background “noise” for a specific analytical method. There are a number of detection limits for any given method: instrument detection limit, method detection limit (MDL), practical quantification limit, and the limit of quantification. Laboratories report their MDLs and provide qualifiers for certain results if the value is uncertain. 9.0 AUDITS, SURVEILLANCES, AND OVERSIGHT REQUIREMENTS Independent assessment and oversight of sampling and analysis activities will be conducted to evaluate the effectiveness of the implementation of this SAP. Assessment of sampling activities will be conducted in accordance with the RMA SQAPP, Section 4.0. Guidance pertaining to assessments or audits of laboratory operations is specified in the SQAPP, Section 3.4. Assessments will follow procedures specified in the Navarro Quality Assurance Plan (QAP) for the Rocky Mountain Arsenal Project (Navarro 2013b). Assessments may consist of audits or surveillances. Audits and surveillances are documented activities performed to determine the effectiveness of the sampling and analysis program implementation. The audit is performed by investigation, examination, or evaluation of objective evidence, to determine the degree of conformance with established procedures, contracts, and other applicable documents. Audits include investigation, examination, or evaluation of objective evidence, to determine the degree of conformance with established procedures, contracts, and other applicable documents. Audits are systematic and independent examination of activities to determine whether the project is being implemented effectively and achieving objectives. Surveillances are continual or regular monitoring and verification of the sampling and analysis activities and associated records to ensure that project-specific requirement are being met. Two audits are planned for this SAP: an audit of the shipping process and a laboratory audit of the tissue analysis. These audits will be scheduled at appropriate times. Representatives from the Regulatory Agencies will be invited to attend. 9.1 Lab Audits Laboratory Audits and Visits An audit is a planned or unplanned, independent, and documented assessment of laboratory operations. The OMC Quality Assurance Program requires that the documented results of QA assessments be evaluated to identify deviations; that these deviations be corrected or resolved; that the root cause of repetitive deviations is
53
identified; and that the QMPs and SOPs be revised to eliminate the root causes of these repetitive deviations. Capability, Capacity, and Readiness Visits may be performed at laboratories that have been identified as candidates or have subcontracted under the OMC. Representatives for the OMC and/or the OMC’s advisory QA group will generally perform these visits. The objectives of these visits will be as follows:
• Discuss OMC contractual requirements • Verify laboratory qualifications, training files, facilities and equipment, data
management system, SOPs, and analytical capabilities. • Recommend analytical methods and matrices the laboratory shall focus on that
are best suited for OMC analytical needs. • Verify readiness to receive samples from the OMC.
Quality System Audits and Components The OMC requires the performance of quality system laboratory audits to ensure compliance with SQAPP and contract requirements. Quality system audits shall be conducted at a minimum of annually unless otherwise approved by the OMC Program Manager. Components of the quality system audit are as follows:
• Identifying the Lead Auditor and designating the audit team • Notifying the responsible laboratory manager of the audit scope and the
scheduled time and date for the audit • Preparation of the audit team • Performing the following:
o Preaudit Meeting o Document and data review o Laboratory inspection o Audit team meetings o Contractor briefings o Administrative/contractual review meeting o Post-audit Meeting
• Providing a final report that contains a cover letter that includes the audited facility’s name, dates, and location of the audit, a summary of the report, instructions for responding to the report, and a distribution list
54
The main body of the final report shall include the following sections:
• Scope • Pre-audit Meeting Summary • Follow-on Items from the previous audit and reviews • Performance evaluation review • Laboratory Inspection • Document/Quality Systems Review • Data Package Review • Corrective Action Requests • Post-audit Meeting Summary • Conclusion • Enclosures that include all finding and/or observation forms generated that
contain the objective evidence with which they were determined, and audit meeting attendance records
9.2 Field Audit An audit of the shipment process will be conducted according to the following guidance taken from the SQAPP. 9.3 Assessment and Oversight Assessment and Response Actions The following guidance is applicable for assessments or audits of field sampling activities. Guidance pertaining to assessments or audits of laboratory operations is specified in Section 3. Assessments and/or audits will follow procedures specified in the Navarro Quality Assurance Plan for the Rocky Mountain Arsenal Project, Revision 0, December 2013. Planned Assessments or Audits Planned assessments or audits are a documented activity performed to determine the effectiveness of the quality program implementation. The audit is performed by investigation, examination, or evaluation of objective evidence, to determine the degree of conformance with established procedures, contracts, and other applicable documents.
The system of planning, scheduling, executing, and follow-up verification of internal audits, including the assignment of audit teams and team leader designation, is the
55
responsibility of the OMC Quality Manager or designee.
The audit team leader is responsible for all phases of the audit including the conduct of the audit and the audit report. The audit team leader has stop-work authority for the task that is the focus of the audit and any tasks associated with the issue identified that triggered the stop-work order. Audit team members are responsible for following the directions and supporting the audit team leader; collecting/analyzing relevant and sufficient evidence to determine any audit findings or observations; preparing working documents (i.e., checklists) under audit team leader direction; and assisting in writing the audit report. Audit personnel shall be qualified to perform audits based on experience or demonstrated competence, training, and examination. Personnel performing audits shall be independent of any direct responsibility for the items or activities being audited. Technical Representatives may participate in audits as needed. The Sampling Manager or designee responsibilities include cooperating with the lead auditor and audit team throughout all stages of the audit; ensuring personnel are available to assist the audit team during the audit; ensuring proper personnel are present for the pre- and post-audit conference; and ensuring that corrective action is developed and implemented for all audit findings and observations as required. Assessment Findings and Corrective Action Responses Findings will be documented in the audit report and will require a corrective action response from the Sampling Manager or designee. The Sampling Manager or designee is responsible for identifying corrective actions to address any nonconforming conditions established in the audit report and, if necessary, performing a separate root cause investigation. The audit report will be prepared by the audit team leader and submitted to the OMC Program Manager as well as the Army/Shell Program Level Quality Manager. The audit report will contain the following information:
• Report Number • Report Date • Person(s) Contacted/Organization • Audit Team • Required Documents • Activity Observed • Results • Positive Work Practices • Observations • Findings
56
• Suggestions for Improvement • Other Follow-Up Actions
Observations and findings identified during the audit shall be documented as part of the audit report. The Sampling Manager or designee should review and investigate each finding or observation in order to provide and schedule appropriate corrective action (to prevent recurrence). The corrective action response will include the results of such review and investigation as appropriate and indicate the date by which corrective action will be completed. The Sampling Manager or designee is required to submit a corrective action response. The Quality Manager or Audit Team Leader will review and approve each corrective action response. If the initial corrective action response is not approved, an amended corrective action response will be submitted. In the event that an agreement on the corrective action response cannot be reached between the Quality Manager and the Sampling manager or designee, the issue will be elevated to the OMC Program Manager and Army/Shell Program Level Quality Manager. The Quality Manager is responsible for responding in a timely and appropriate manner to all submitted corrective action responses. Extension to the corrective action response due date(s) shall be documented and should be on file on or before the due date. The Quality Manager or Audit Team Leader shall evaluate each request and respond accordingly. Verification that identifies acceptable implementation of corrective action(s) shall be documented and the audit finding or observation closed. Verification that identifies unacceptable implementation of corrective action(s) shall result in the audit remaining open and the status documented. Upon satisfactory verification of implementation of the corrective action to each finding or observation, the audit shall be documented as closed with notification to the audited organization. All findings and observations shall be noted as closed, or plans for additional pending follow-up noted, prior to the closure of the audit report.
10.0 DOCUMENTATION AND RECORDS
10.1 SAP-Related Documentation and Document Control The Army’s records management contractor will manage analytical data collected for the Bison Tissue Contaminant Study Phase 2. Field notes and data collection forms generated for this SAP will be maintained in Project Files throughout field activities and
57
laboratory analysis. At the conclusion of this study all project records except analytical data will be transferred to a Records Index where they will be scanned and archived electronically. Electronic back-up records will be prepared based on existing Army procedures. This SAP and any associated SAPs will be approved by the Project Manager, QA Officer, and, or qualified and suitable designees, and the Regulatory Agencies. SAPs will be approved by the EPA before any data collection and analysis begins. The completed checklist review will be included with the requests for EPA’s approval. The life of a SAP is for the duration of the specific project until it is closed out, providing the SAP is reviewed annually, the annual reviews are documented and reported, the SAP is updated to reflect changes noted by the annual reviews, and the specific project DQOs do not change. Reviews of the SAP will be documented in the project files and addressed in project status reports as appropriate. Any changes required as the result of these reviews will be incorporated in the record copies as revisions and obsolete materials are identified. All personnel will be advised of changes. The USFWS Project Manager is responsible for making sure that all staff who perform work on the Bison Tissue Contaminant Study use only current versions of the SAPs. Data management procedures will follow requirements outlined in Navarro’s SQAPP (Navarro, 2014). In addition, see Section 10.4. 10.2 Data Summary Report At the conclusion of this study, Data Summary Reports (DSRs) will be prepared to summarize the analytical results and to determine data usability. All project documents, records, and electronic files will be placed into a project file and stored in the RMA Document Tracking Center and retained in perpetuity. All analytical data will be placed in the RMAED and retained in perpetuity. Data Summary Reports (DSRs) will be prepared to summarize the analytical results and to determine data usability. All project documents, records, and electronic files will be placed into a project file and stored in the RMA Document Tracking Center and retained in perpetuity. All analytical data will be placed in the RMAED and retained in perpetuity. Data Summary Reports will include the following items:
• Introduction • Background
58
• Sample Collection and Analysis Summary • Sample Location Map/Information (e.g., information on bison pasture
represented by the samples) • Data Review • Project Summary
After DSRs have been reviewed by the Regulatory Agencies, comments will be addressed and the DSRs will be finalized. DSRs will identify recommendations and lessons learned for collection and analysis of future samples, as appropriate. . DSRs will include documentation of historical information about the bison that underwent biopsy sampling and fortuitous necropsy sampling including age, condition of the animal at death, cause of death, length of time at RMA, pasture area where they grazed, etc. This report will also describe as much information as possible regarding the Phase 1 sampling, including:
• how the existing muscle samples were collected, • sample custody information, • the preservation of the available bison tissue (e.g., the duration of time the
tissue has been frozen, preservation temperatures) These reports will evaluate each of the DQOs described in this SAP. 10.3 Bison Tissue Necropsy and Tail Bulb Evaluation Report After DSRs have been reviewed by the Regulatory Agencies and finalized, a report will be prepared that evaluates the data results against the DQOs and objectives of the SAP. In addition, the SAP 2 evaluation report should identify recommendations for implementing the subsequent stages of the Bison Tissue Contaminant Study and ultimately, in developing defensible data and technical rationale for supporting a potential change to the ROD restriction on the consumption of bison at RMA. This report will include documentation of historical information about the bison that underwent necropsy (and of any bison that died of natural causes that were also included in the study) including age, condition of the animal at death, cause of death, length of time at RMA, pasture area where they grazed, etc. This report will also describe as much information as possible regarding the Phase 1 sampling, including:
• how the existing muscle samples were collected, • sample custody information,
59
• the preservation of the available bison tissue (e.g., the duration of time the tissue has been frozen, preservation temperatures)
This report will evaluate each of the DQOs described in this SAP. For data evaluation of nondetects, both ½ the reporting limit and at the reporting limit, will be used in the risk calculations. 10.4 Document Control The USFWS Refuge Manager will be responsible for maintaining the most current version of the Phase 2 SAP and ensuring its distribution to Project Scientist, Sample Manager, and Quality Assurance Manager. Representatives for each of the Regulatory Agencies will also included on the distribution list.
11.0 REFERENCES
Creekmore, T. E., D. G. Whittaker, R. R. Roy, J. C. Franson, and D. L. Baker. 1999. Health status and relative exposure of mule deer and white-tailed deer to soil contaminants at the Rocky Mountain Arsenal. Environmental Toxicology and Chemistry 18:272-278.
EBASCO. 1989. Biota Remedial Investigation, Final Report, Version 3.2, Vol. 1-4, May 1989. EBASCO, Commerce City, Colo.
FAO/WHO. 1971. 1970 Evaluations of some pesticide residues in food. WHO Expert Group on Pesticide Residues, Rome (Italy).
_____. 2001. Pesticide residues in food - 2000. Report of the Joint Meeting of the FAO Panel of Experts on Pesticide Residues in Food and the Environment and the WHO Core Assessment Group, Geneva (Switzerland).
Flatirons Toxicology Inc. 2014. Draft : Data Summary Report. Pesticide Residue Program. Sampling and Analysis Plan #1 Bison Tissue Concentrations.
Foster Wheeler Environmental Corporation. 1996. Record of decision for the on-post operable unit : volume 1 : sections 1-11. U.S. Army Program Manager's Office for the Rocky Mountain Arsenal, Commerce City, Colo.
Gannon, N., R. Link, and G. Decker. 1959a. Insecticide residues in the milk of dairy cows fed insecticides in their daily ration. Journal of Agricultural and Food Chemistry 7:829-832.
Gannon, N., R. P. Link, and G. C. Decker. 1959b. Storage of dieldrin in tissues of steers, hogs, lambs, and poultry fed dieldrin in their diets. Journal of Agricultural and Food Chemistry 7:826-828.
Geraghty & Miller, Inc. (G&M). 1986. Rocky Mountain Arsenal Chemical Index. Volumes 1 and 2. Draft Final Report. April.
Intergovernmental Data Quality Task Force. 2005. Uniform federal policy for Quality Assurance Project Plans : Evaluating, assessing, and documenting environmental data collection and use programs. Version 1 edition., U.S. Environmental Protection Agency, Washington, D.C.
60
Marchello, M., W. Slanger, D. Milne, A. Fischer, and P. Berg. 1989. Nutrient composition of raw and cooked Bison bison. Journal of food composition and analysis 2:177-185.
Navarro Research and Engineering Inc. 2014. Sampling Quality Assurance Project Plan. Revision 1.
U.S. Department of Agriculture. 2006. 2006 FSIS National Residue Program scheduled sampling plans. United States Department of Agriculture, Food Safety and Inspection Service, Office of Public Health Science, Washington, D.C.
U.S. Department of the Interior. 2008. Department of the Interior bison conservation initiative. U.S. Deparment of the Interior, Assistant Secretary for Fish, Wildlife, and Parks, Washington, DC.
_____. 2014. DOI bison report : Looking forward. National Park Service, Biological Resource Management Division, Fort Collins, Colo.
U.S. Environmental Protection Agency (EPA). 1989. Federal Facility Agreement, in the Matter of: Rocky Mountain Arsenal, Colorado, Department of the Army, Shell Oil Company, Pursuant to Section 120 of the Comprehensive Environmental Response, Compensation and Liability Act of 1980, as Amended by Superfund Amendments and Reauthorization Act of 1986, 42 USC 9601-9675. Feb. 17.
_____. 2000. Guidance for the Data Quality Objectives process : EPA QA/G-4. U.S. Environmental Protection Agency, Office of Environmental Information, Washington, D.C.
_____. 2002a. Guidance for Quality Assurance Project Plans : EPA QA/G-5. U.S. Environmental Protection Agency, Office of Environmental Information, Washington, D.C.
_____. 2002b. Guidance on choosing a sampling design for environmental data collection for use in developing a Quality Assurance Project Plan : EPA QA/G-5S. U.S. Environmental Protection Agency, Office of Environmental Information, Washington, D.C.
_____. 2006. Guidance on systematic planning using the Data Quality Objectives process : EPA QA/G-4. U.S. Environmental Protection Agency, Office of Environmental Information, Washington, D.C.
_____. 2009. Guidance for Labeling Externally Validated Laboratory Analytical Data for Superfund Use. OSWER 9200.1-85. EPA 540-R-08-005. January 13.
_____. 2011a. Chapter 11 - Intake of meats, dairy products and fats. Pages 62 in Exposure Factors Handbook : 2011 Edition. U.S. Environmental Protection Agency, National Center for Environmental Assessment, Washington, D.C.
_____. 2011b. http://www.epa.gov/pbt/tools/toolbox.htm. April 18. Accessed January 2014.
_____. 2013a. National Functional Guidelines for Inorganic Superfund Data Review. OSWER 9200.2-133. USEPA-540-R-13-001. October.
_____. 2013b. National Functional Guidelines for Superfund Organic Methods Data Review. OSWER 920.1-134. USEPA-540-R-014-002. October.
U.S. Fish and Wildlife Service (USFWS). 1996. Population management at field stations : fenced animal management (701 FW 8). U.S. Fish and Wildlife Service, Division of Conservation Planning and Policy, Washington, DC.
_____. 2013a. Habitat Management Plan for the Rocky Mountain Arsenal National Wildife Refuge. U.S. Fish and Wildlife Service, Rocky Mountain Arsenal National Wildlife Refuge, Commerce City, Colo.
_____. 2013b. Sampling and Analysis Plan, USDA Compliance Study. U.S. Fish and Wildlife Service, Rocky Mountain Arsenal National Wildlife Refuge, Commerce City, Colo. December 16.
_____. 2014a. Bison food safety program: Tissue collection plan. U.S. Fish and Wildlife Service, Rocky Mountain Arsenal National Wildlife Refuge, Commerce City, Colo.
_____. 2014b. Bison Tail Bulb Biopsy and Tissue Necropsy Sampling and Analysis Plan. U.S. Fish and Wildlife Service, Rocky Mountain Arsenal National Wildlife Refuge, Commerce City, Colo. December 8.
Yee, C. 2014. Supervisory Chemist, USDA, FSIS, OPHS, Western Laboratory. Personal communication (email) to Dr. Scott Klingensmith.
62
Attachment A - COPC Selection Details
Table A-1 is a summary of chemicals that were reviewed for inclusion in the bison tissue samplign program, including a brief summary of the use or presence of the chemical at RMA, information provided from the EPA PBT profiler tool, and infomration of laboratory analytical suites. Table A-1: COPC selection background information
Chemical History at RMA PBT Considerations
Laboratory Analysis
Included in OCP suite. Like that
can achieve reporting limits
near or below the SSRBSLs
Aldrin [309-00-2], Dieldrin, [50-29-3]
Aldrin was produced at RMA between 1952 and 1974. Aqueous effluent was disposed of in Basin A and Basin F. In addition, there are documented spills, losses in the Sand Creek Lateral, and disposal in the chemical sewer (G&M 1986). Identified as contaminants of concern (COCs) for clean-up in the ROD (FWENC 1996).
It is understood that aldrin is rarely found in plants and animals, since it is readily converted to dieldrin (IARC 1974); however, there are detections of aldrin in biological samples documented in the RMA Environmental Database (RMAED) thus warranting further investigation. Aldrin is listed as persistent, bioaccumulative and toxic chemicals in EPA's final rule on Persistent, Bioaccumulative, and Toxic Substances and/or as a Persistent Organic Pollutant by the United Nations Environment Programme (EPA 2011).
Yes
Dieldrin was produced between 1950 and 1973. Aqueous dieldrin effluent was discharged into Basin A and Basin F (G&M 1986) and in other unknown locations by Shell (Ebasco et al 1988). Identified as contaminants of concern (COCs) for clean-up in the ROD (FWENC 1996).
Dieldrin detections are also documented in biological samples in the RMAED. Dieldrin is listed as persistent, bioaccumulative and toxic chemicals in EPA's final rule on Persistent, Bioaccumulative, and Toxic Substances and/or as a Persistent Organic Pollutant by the United Nations Environment Programme (EPA 2011).
Yes
Chlordane [57-74-9], Oxychlordan
Chlordane was produced between 1947-1952 by Julius Hyman, along with aldrin and
Chlordane is metabolized to heptachlor epoxide, oxychlordane, trans-nonachlor, cis-chlordane,
Yes
63
Chemical History at RMA PBT Considerations
Laboratory Analysis
Included in OCP suite. Like that
can achieve reporting limits
near or below the SSRBSLs
e [27304-13-8 dieldrin. Chlordane was also a process intermediate during heptachlor manufacture, produced by Julius Hyman from 1947 - 1952 (G&M 1986). Chlordane detections (including both alpha chlordane and gama chlordane) are documented in biological samples in the RMAED. Chlordane was identified as a COC for clean-up in the ROD (FWENC 1996).
and other compounds (ESE 1989). Chlordane is resistant to decomposition (G&M 1986). It is listed as persistent, bioaccumulative and toxic chemical in EPA's final rule on Persistent, Bioaccumulative, and Toxic Substances and/or as a Persistent Organic Pollutant by the United Nations Environment Programme.
Oxychlordane is included as a COPC and will be evaluated in conjunction with chlordane because it is a persistent and toxic metabolite. It was identified as a heptachlor impurity and a metabolite (G&M 1986).
As stated in the Biota Remedial Investigation, Final Report (Biota RI), oxychlordane should be evaluated with chlordane because, “it is a persistent metabolite, more toxic than the parent compound that can be formed by metabolism of several of the chlordane compounds” (ESE 1989). In addition, chlordane is metabolized to heptachlor epoxide, oxychlordane, trans-nonachlor, cis-chlordane, and other compounds. Heptachlor epoxide and oxychlordane are reported in the Biota RI to be the metabolites correlated with mortality (ESE 1989). Oxychlordane has a half life of 360 days, which was used as a trigger for identifying COPCs. It also has a bioconcentration factor (BCF) of 1900. Consistent with the PBT Profiler, the Regulatory Agencies identified chemicals with a BCF near and over 1000 as
Yes
64
Chemical History at RMA PBT Considerations
Laboratory Analysis
Included in OCP suite. Like that
can achieve reporting limits
near or below the SSRBSLs
being bioaccumulative, and therefore identified as a COPC. Oxychlordane does not have available toxicological values. Therefore, the sum of chlordane and oxychlordane should be evaluated using the screening values calculated for chlordane.
DDD [72-54-8], DDE [72-55-9], and DDT [50-29-3]
DDD is a degradation product of DDT. It was found in Section 36 (G&M 1986). DDD is also a metabolite of DDT (ATSDR 2002). Soil and invertebrate samples collected from the Building 111 lawn in 1994 included detections of DDD in addition to DDT and DDE (USFWS 1995). DDT, DDD, and DDE can be found in grain, leafy vegetables, and fruits and a study conducted by Forsyth, cited by the Biota RI, indicated that residues of DDT, DDD, and DDE tend to be higher in grasses than forbs (ESE 1989). Therefore, all three of the chemicals are subject to uptake by grazing bison. In 1994, soil and invertebrate samples taken from Building 111 lawn reportedly had DDT, DDE, and DDD.
Listed as PBT chemicals in EPA's final rule on Persistent, Bioaccumulative, and Toxic Substances and/or as a Persistent Organic Pollutant by the United Nations Environment Programme. DDT, DDD, and DDE can be found in grain, leafy vegetables, and fruits and a study conducted by Forsyth, cited by the Biota RI, indicated that residues of DDT, DDD, and DDE tend to be higher in grasses than forbs (ESE 1989). Therefore, all three of the chemicals are subject to uptake by grazing bison. In 1994, soil and invertebrate samples taken from Building 111 lawn reportedly had DDT, DDE, and DDD.
Yes
DDE is the first decomposition product of DDT in soil (Ebasco et al 1989b). “Isodrin and DDE were produced as liquids. These compounds were produced, stored, disposed, or used in the central, southern,
listed as PBT chemicals in EPA's final rule on Persistent, Bioaccumulative, and Toxic Substances and/or as a Persistent Organic Pollutant by the United Nations Environment Programme. DDT, DDD, and DDE can be
Yes
65
Chemical History at RMA PBT Considerations
Laboratory Analysis
Included in OCP suite. Like that
can achieve reporting limits
near or below the SSRBSLs
chlorine plant/steam plant subareas, and the sanitary landfill, in several of the 300 series warehouses in Section 2, and possibly in Buildings 544, 742, and 728” (Ebasco et al 1989a). DDE and DDT were detected in soil in the North Central Study Area during the RI (Ebasco et al 1989b). DDT has been identified in biological samples at RMA as documented in the RMAED. DDE was detected in samples of deer tissue and DDE was the second most common contaminant found in Kestrel samples (after dieldrin) in 1994 USFWS Study (USFWS 1995). In 1994, soil and invertebrate samples taken from Building 111 lawn reportedly had DDT, DDE, and DDD.
found in grain, leafy vegetables, and fruits and a study conducted by Forsyth, cited by the Biota RI, indicated that residues of DDT, DDD, and DDE tend to be higher in grasses than forbs (ESE 1989). Therefore, all three of the chemicals are subject to uptake by grazing bison. In 1994, soil and invertebrate samples taken from Building 111 lawn reportedly had DDT, DDE, and DDD.
DDT was produced by a Lessee prior to Shell and was found in Section 36 (Ebasco et al 1988). DDT was detected in many areas of RMA. For example, DDT and DDE were deemed non-target compounds and were identified in Basin A (Ebasco et al 1989b). DDT and DDE were identified as COCs in the ROD for clean-up (FWENC 1996). DDT has also been identified in biological samples at RMA as documented in the RMAED. For example DDT and DDE were both detected in soil and
listed as PBT chemicals in EPA's final rule on Persistent, Bioaccumulative, and Toxic Substances and/or as a Persistent Organic Pollutant by the United Nations Environment Programme.
Yes
66
Chemical History at RMA PBT Considerations
Laboratory Analysis
Included in OCP suite. Like that
can achieve reporting limits
near or below the SSRBSLs
invertebrate samples in 1994 and around 1992 (USFWS 1995). DDT, DDD, and DDE can be found in grain, leafy vegetables, and fruits and a study conducted by Forsyth, cited by the Biota RI, indicated that residues of DDT, DDD, and DDE tend to be higher in grasses than forbs (ESE 1989). Therefore, all three of the chemicals are subject to uptake by grazing bison. In 1994, soil and invertebrate samples taken from Building 111 lawn reportedly had DDT, DDE, and DDD.
Endrin was produced between 1952 and 1974 (Ebasco et al 1988). It was disposed of in Basin A, Basin F, and Shell Trenches. Endrin was also manufactured prior to 1952 by a lessee prior to Shell (G&M 1986). Endrin has been detected in biological samples at RMA, as documented in the RMAED. Historic records indicate that at one time, "levels of some contaminants (e.g., dieldrin, total mercury) in the flesh of game animals and edible fish at RMA exceeded the Food and Drug Administration (FDA) action levels for animal and fish tissue (FDA, 1978, RIC#84338ROl)" (ESE 1989).
Endrin is listed as a PBT chemical in EPA's final rule on Persistent, Bioaccumulative, and Toxic Substances and/or as a Persistent Organic Pollutant by the United Nations Environment Programme.
Yes
67
Chemical History at RMA PBT Considerations
Laboratory Analysis
Included in OCP suite. Like that
can achieve reporting limits
near or below the SSRBSLs
Isodrin was produced by a lessee prior to Shell, is a metabolite, and a heptachlor impurity. Heptachlor was produced prior to 1952 (G&M 1986). Isodrin has been detected in biological samples at RMA, as documented in the RMAED.
Isodrin is also listed as a PBT chemical in EPA's final rule on Persistent, Bioaccumulative, and Toxic Substances and/or as a Persistent Organic Pollutant by the United Nations Environment Programme. The Biota RI explains that isodrin is an analog of endrin and is converted metabolically to endrin (ESE 1989). Toxicological values are not available for isodrin, so the data should be evaluated additively with endrin and keto-endrin
Keto-endrin distribution was identified as being limited to the southwestern region of Section 36 (Ebasco et al 1988). Endrin ketones were also identified in Basin A, the lime settling basins area, a burn site, Basin F, and the deep disposal well area (Ebasco 1989b). Keto-endrin is a decomposition product associated with endrin (Ebasco 1988) (ESE 1989). Keto-endrin was detected in biological samples of deer mice during sampling in 1994 in Section 26 (USFWS 1995).
The Agency for Toxic Substances and Disease Registry (ATSDR) states the endrin aldehyde and endrin ketone occur as impurities or as degradation products of endrin (ATSDR 1996). Keto-endrin is also identified as a metabolite of endrin (WHO 2004).
Yes
Heptachlor [76-44-8] and Heptachlor epoxide [1024-57-3
Heptachlor was produced prior to 1952 and was detected in the soil (e.g., this compound was detected in five samples from Basin A and the lime settling basin area (Ebasco et al 1988). Heptachlor is also identified as both a breakdown product and a component of
Heptachlor is listed as a PBT chemical in EPA's final rule on Persistent, Bioaccumulative, and Toxic Substances and/or as a Persistent Organic Pollutant by the United Nations Environment Programme.
Yes
68
Chemical History at RMA PBT Considerations
Laboratory Analysis
Included in OCP suite. Like that
can achieve reporting limits
near or below the SSRBSLs
chlordane (ATSDR 2007).
Heptachlor epoxide is identified as a degradation product of heptachlor that biomagnifies in the terrestrial food chain (ASTDR 2007). Heptachlor epoxide is also identified as a decomposition product of endrin and monitoring identified heptachlor epoxide in the lime pits (Ebasco et al 1988). Heptachlor epoxide is also a metabolite of heptachlor (ESE 1989). The Biota RI explains that chlordane is metabolized in birds to heptachlor epoxide, oxychlordane and other compounds, and that heptachlor epoxide and oxychlordane appear to be the metabolites correlated with mortality in birds (ESE 1989). There are some historical biological analyses with detections of heptachlor epoxide, as documented in the RMAED.
Hexachlorobenzene [118-74-1].
The final RI Report for the South Plants Study Area reports that hexachlorobenzene was formerly a significant non-target compound and detected in the soil media in South Plants (Ebasco et al 1989a). It was also noted as a tentatively identified compound (TIC) and a significant form non-target compound (Ebasco et al 1992).
Hexachlorobenzene is one of the Semivolatile Halogenated Organics (SHOs) that was identified during the RI in the South Plants Area. The RI report explains that biomagnifications factors for the SHOs suggest that appreciable bioconcentration and biomagnifications may occur with uptake in both plants and animals (Ebasco et al 1989a). . Hexachlorobenzene is listed as a
Yes
69
Chemical History at RMA PBT Considerations
Laboratory Analysis
Included in OCP suite. Like that
can achieve reporting limits
near or below the SSRBSLs
PBT chemical in EPA's final rule on Persistent, Bioaccumulative, and Toxic Substances and/or as a Persistent Organic Pollutant by the United Nations Environment Programme.
Mercury [7439-97-6]
Mercury was used as a catalyst for Lewisite production and there was disposal in M-1 Pits. Releases are noted in South Plants. Mercury spills reported in Section 36, Building 534, Basin B (Ebasco et al 1989a). Large concentrations of mercury were identified on the western edge of Basin F, and it was detected in Basin B and the lime pits (Ebasco et al 1989a). and has been detected in biological samples as documented in the RMAED. Per the Biota RI, at one time, "levels of some contaminants (e.g., dieldrin, mercury) in the flesh of game animals and edible fish at RMA exceeded the Food and Drug Administration (FDA) action levels for animal and fish tissue (FDA, 1978, RIC#84338ROl)" (ESE 1989). Mercury is identified as a COC in the ROD for clean-up (FWENC 1996).
Mercury is a priority PBT (EPA 2011)
No. A separate analysis will need to be conducted for mercury. Initial research indicates that analysis can achieve reporting limits near of below the SSTSLs.
RATIONALE FOR ELIMINATING 7 OF THE ORIGINAL 21 COPCS IDENTIFIED
70
Each of the 7 chemicals listed below are semivolatiles, and therefore, are nto expected to be found in the surface soil, where there is direct exposure to grazing bison from ingestion. Additional information on the historical presence and characteristics of the chemical are provided below. 1,2,3,4,7,7-Hexachlorobicyclo(2.2.1)hepta-2,5-diene [3389-71-7]. HCNB was originally selected because it was associated with the manufacture of isodrin and endrin between 1952 – 1965, including disposal in sewers, Basin A, and Basin F (Ebasco 1988). HCNB is generally described as being stable with slow degradation (G&M 1986). The PBT profiler identified a bioconcentration factor of 1200 and a half-life in soil of 360 days. However, HCNB was further identified as a process intermediate during isodrin and endrin manufacture (Ebaso 1988) (40 CFR 721.4140). Discussion with two different laboratories (one large national lab and one lab specializing in tissue research) indicated that analysis of this intermediate chemical was difficult. Neither laboratory had analyzed this chemical historically, nor was it clear that standards were available for development of an analytical method in tissue. The COPC list includes the product chemicals of isodrin and endrin, and obtaining accurate and sensitive analysis of HCNB was not certain, so it was removed from the list of chemicals of interest.
4,5,6,7,8,8-Hexachloro-3a,4,7,7a-tetrahydro-4,7-methano-1H-indene, or chlordane [3734-48-3]. Chlordene is a process intermediate associated with chlordane. Chlordene, along with chlordane, were produced in Building 516 in South Plants (FWEC 1995). Chlordene was identified in many locations (e.g., as a as a TIC associated with the burning site in Section 36 (ESE 1988); a nontarget compound identified in chemical sewers (up to 700ppm) (EBASCO 1988); TIC at Site 1-10 (South Tank Farm) and Site 1-13); The history of occurrence included five samples from Basin A and the lime settling basin area reportedly contained OCPs in the target fraction including chlordene, which is a waste predating Shell (EBASCO 1989)). While the PBT profiler identified chlordane has having a bioconcentration factor of 2,200 and a half life of 360 days, the PBT profiled identified uncertainties because chlordane is an isomer mixture. The PBT Profiler selected a representative structure for this mixturethat may, or may not, correspond to the mixture intended to be profiled. Therefore, the Persistence, Bioaccumulation, and Toxicity of this mixture may not be accurately represented by the PBT Profiler. Chlordene is also a process intermediate and breakdown product of heptachlor (Cogley 1978). Discussion with two different laboratories indicated that analysis of this intermediate chemical could be difficult. Neither laboratory had analyzed this chemical in tissue. One laboratory did not have a method but explained that they could develop a specific method because some standards were available. Another laboratory indicated that they also would need to develop a method for analysis. Finally, toxicological values are not available for chlordene. The COPC list includes the product chemical (chlordane), and obtaining accurate and sensitive analysis of chlordene was not certain, so it was removed from the list of chemicals of interest. Hexachlorobutadiene [87-68-3]. Per the 1988 Chemical Index, hexachlorobutadiene was used as an analytical parameter in a groundwater study done by Shell and included in a synthetic waste study done by Calgon for RMA (Ebasco et al 1988). The final RI
71
Report for the South Plants Study Area reports that hexachlorobutadiene was formerly a significant non-target compound and detected in the soil media in South Plants (Ebasco et al 1992). It was also identified as a TIC and a significant form non-target compound (Ebasco et al 1992). During the RI, hexachlorobutadiene was identified as a semivolatile halogenated organic with biomagnification factors that suggest appreciable bioconcentration and biomagnifications may occur with uptake in both plants and animals (Ebasco et al 1989a). However, the PBT profiler indicates that the bioconcentration factor is 660, so bioaccumulation in bison tissue is not expected to be significant. Therefore, hexachlorobutadiene was removed from the COPC list because of reduced concerns with bioaccumulation.
Attachment A References Agency for Toxic Substances and Disease Registry (ATSDR). 1996. Toxicological
Profile for Endrin. August. ATSDR. 2002. Toxicological Profile for DDT, DDE, and DDD. September. ATSDR. 2007. Toxicological Profile for Heptachlor and Heptachlor Epoxide. November. Environmental Science & Engineering Inc. (ESE). 1989. Biota Remedial Investigation,
Final Report, Version 3.2. Volumes I and II. May. Ebasco Services, Inc.; R.L. Stollar and Associates; California Analytical Laboratories,
Inc.; DataChem, Inc., Technos, Inc.; Geraghty & Miller, Inc. (Ebasco et al). 1988. Rocky Mountain Arsenal Chemical Index, Volume I and Volume II. May.
Ebasco Services Incorporated; Applied Environmental, Inc.; CH2M Hill; Datachem, Inc.; R. L. Stoller and Associates (Ebasco et al). 1989a. Final Remedial Investigation Report Volume VIII, South Plants Study Area, Text, Version 3.3. July.
Ebasco Services Incorporated; Applied Environmental, Inc.; CH2M Hill; Datachem, Inc.; R. L. Stoller and Associates (Ebasco et al). 1989b. Final Remedial Investigation Report Volume XI, North Central Study Area, Section 2 Text, Version 3.3. July.
Ebasco Services Incorporated; Applied Environmental, Inc.; CH2M Hill; Datachem, Inc.; R. L. Stoller and Associates (Ebasco et al). 1990. Final Human Health Exposure Assessment for RMA Study Area Evaluations, Volume VI-D, Version 4.12. September.
Ebasco Services Incorporated; Applied Environmental, Inc.; CH2MHill; Datachem, Inc.; R.L. Stoller and Associates (Ebasco et al). 1992. Final Remedial Investigation Summary Report, Appendix A – Environmental Setting, RI Approach, Nature and Extent of Contamination – Text and Tables, Version 3.2. January.
Foster Wheeler Environmental Corporate (FWENC). 1995. Final Detailed Analysis of Alternative Report, Version IV, Structures DAA, Volume VI. October.
FWENC. 1996. Record of Decision for the On-Post Operable Unit. June. Geraghty & Miller, Inc. (G&M). 1986. Rocky Mountain Arsenal Chemical Index.
Volumes 1 and 2. Draft Final Report. April. International Agency for Research on Cancer (IARC). 1974. Summaries & Evaluations.
ALDRIN. Volume 5. Morrison Knudsen Engineering (MKE). 1989. Results Of Field Investigations
Conducted August and September 1989, Shell Section 36 Trenches. December. U.S. Environmental Protection Agency (EPA). 1989. Federal Facility Agreement, in the
Matter of: Rocky Mountain Arsenal, Colorado, Department of the Army, Shell Oil Company, Pursuant to Section 120 of the Comprehensive Environmental Response, Compensation and Liability Act of 1980, as Amended by Superfund Amendments and Reauthorization Act of 1986, 42 USC 9601-9675. February 17.
EPA. 2011. http://www.epa.gov/pbt/tools/toolbox.htm. April 18. Accessed January 2014.
EPA . 2014. http://www.epa.gov/reg3hwmd/risk/human/rb-concentration_table/Generic_Tables/. May 28.
U. S. Fish and Wildlife Service (USFWS). 1995. U.S. Fish and Wildlife Service, Rocky Mountain Arsenal National Wildlife Refuge Fiscal Year 1994 Annual Progress Report. February 15.
World Health Organization (WHO). 2004. Endrin in Drinking Water.
for contaminant analysis at the Rocky Mountain Arsenal NWR
Prepared by: U.S. Fish and Wildlife Service
Rocky Mountain Arsenal National Wildlife Refuge 6550 Gateway Road, Building 121 Commerce City, Colorado 80022
Purpose This TCP is used as a supplement to law enforcement/wildlife health necropsies to collect tissues that can be used for a variety of studies related to RMA contaminants. The types of studies that may be performed with these tissues include residue analysis for a specific tissue, tissue sample optimization, tissue distribution, inter-laboratory performance comparisons, biopsy methods, and selection of the most appropriate target organ(s) for biomonitoring programs. Objectives The objectives of the TCP are to collect selected tissues from each animal in amounts sufficient to support a variety of contaminant study designs. These tissues will be collected so that cross-contamination between tissue types and animals is minimized. The tissues will be preserved by freezing in a manner to ensure a shelf life of at least one year and stored under the requirements outlined in the USFWS and/or RMA chain of custody program. Project Organization Wildlife necropsies may be planned or unplanned. Staffing of unplanned events and fortuitous samples can vary based on conditions. For example, a bison necropsy occurred during the 2013 federal government shutdown that only included the refuge manager and a student intern. In addition, not all wildlife necropsies are completed by USFWS or at the RMANWR. From time to time, the USFWS will transport animals to the Colorado State University or other institutions for necropsy. However, there will generally be a necropsy lead, assistant, and sample manager involved in all RMANWR necropsies. A table summarizing key staff, their organizations, expertise, and primary roles is presented in Table 1 below. The Refuge Manager is responsible for maintaining the official approved version of the TCP. Individuals may substitute roles as required.
Table 1. Table of Key Staff
Name Organization Expertise Role Dr. Samantha Gibbs USFWS Wildlife Disease Necropsy Lead Dr. Bruce Hastings USFWS Wildlife Management Deputy Refuge Manager Lee Jones USFWS Wildlife Disease Necropsy Lead Dr. Scott Klingensmith U.S. Army/Shell Toxicology Project Scientist David Lucas USFWS Wildlife Management Refuge Manager Tom Ronning USFWS Wildlife Management Necropsy Lead Chris Spivey USFWS Law Enforcement Necropsy Lead Nick Kaczor USFWS Wildlife Management Necropsy Assistant William Kutosky USFWS Wildlife Management Necropsy Assistant
Tissues The type, portions, number of samples, and approximate total amounts, for each tissue to be collected are presented in Table 2. These samples require nine (9) 2 oz clear glass sample jars, aluminum foil, and 1 large Whirl-Pak®. The use of field blanks is encouraged when possible (two additional 2 oz clear glass sample jars). Any other tissue remarkable for abnormality will also be collected and preserved as appropriate.
Table 2. Tissues, Types, Portions, and Amounts to be Collected (as available)
Liver (li) Central lobe 20-30 g each 2 samples taken Kidney (ki) Right 20-30 g each 3 samples taken Muscle (mu) Ribeye cut (ri)
Tenderloin cut (tl)
20-30 g each
500 g each
2 samples taken +
1 sample taken A field checklist is included with this plan to assist with unplanned, field necropsies. This checklist has been used by to successfully obtain fortuitous samples when Colorado State University has completed the necropsy. Collection Protocol If necessary, bison will be euthanized by gunshot. Once death is confirmed, a necropsy will be conducted. The refuge maintains three (3) complete field necropsy kits. These kits include all tools and instruments needed to complete a thorough wildlife disease necropsy and collection of fortuitous contaminant samples. In general, each bison will have a necropsy team composed of a necropsy lead, necropsy assistant, and a sample collection assistant. Tissues for contaminant analysis will be collected as soon as they become available during the necropsy procedure. Solid
tissues will be excised, handled, and cut using cleaned implements for each animal. Necropsy instruments will be decontaminated with appropriate combinations of soap (Aiconox®), water, and alcohol. Small portions of tissues (-30 g) will be placed in glass tissue jar. Large solid tissues will be weighed, wrapped in two layers of aluminum foil, and placed in Whirl-Paks®. All weights are approximate+/- 20%. When possible, a box with pre-labeled sample containers and a sample checklist, as well as a second box for transferring samples to the Sample Management station will be assembled for each animal. As samples are collected for each tissue, the samples will be checked off the checklist and placed in the sample transfer box. When all the samples for a tissue have been collected, they will be transferred to the Sample Manager with the completed checklist for sample processing, C-O-C preparation, and storage. Documentation, Preservation, Labeling and Packaging and Shipping Procedures described in this section are designed to ensure sample integrity through proper sample handling. Samples must be properly handled at the sampling site and during preparation for storage. After approximate weight is obtained and any sample treatment completed (blood), labels and the Chain-of-Custody (C-O-C) form will be properly completed and labels affixed to the sample containers. Labels and C-O-C information may be recorded by hand with a permanent indelible pen if they are legible and complete. Any field notes will be retained by the necropsy lead. Sample labels shall be completed immediately before or during collection of the corresponding sample. Handwritten labels must contain all required information. Labels shall be securely placed on appropriate sample containers. Label entries include. Field Sample (10 digits) - 14 + species (BI= bison, DE= deer). If available the
remainder of the field sample is the last six digits of the animals PIT Animal Number - 2 letter/number abbreviations for tissue (see Table 2), sub-type,
replicate, fetal. (e.g., fasc03fe =third replicate of subcutaneous fat from fetus) Date - Year (4 digits)/Month/Day of sample collection. Time - Time of sample collection using the 24-hour clock method. Container Type - The size and material type of the sample container. Site Type – BIOL C-O-C Number - The number of the c-o-c corresponding to the label.
Remarks - Any miscellaneous comments related to sample collection or analysis. C-O-C records will be used to document the security and control process for samples from the time of collection until delivery to the laboratory. Custody seals will be used to ensure that sample container integrity is not compromised. Custody seals are placed on individual sample containers or on the outside shipping container in such a manner that the container cannot be opened without compromising the custody seal. Once in place, either the sampler or their designee, or the laboratory can break custody seals. In order to transfer custody of the samples, one of the individuals collecting the samples will sign the c-o-c in the first "Relinquished By" box, located under the "Other Notes" box. The date and time of relinquishment is indicated in the "Date" and "Time" boxes. The person receiving the samples shall sign in the adjacent "Received By" box. Note that Fed Ex does not sign custody forms. When the sample is placed in a freezer, the date and time of storage is entered in the first date and time boxes and the location is entered in the first "Received By" box. When the sample is removed from storage, the handler will initial the "Relinquished By" box indicating where the sample was received from, the time and date, and sign the "Received By" box following the date. Samples will be flash frozen with dry ice, and selected tissues placed in lockable -20°c freezers for short-term storage; additional tissues may eventually be placed in a -80°C freezer for long-term storage based on schedule considerations. Health and Safety Plan In accordance with 29 CFR § 1910.133, a USFWS Job Hazard Analysis has been completed for wildlife necropsies (see Ungulate necropsy and sampling JHA (11/12/2013)). The primary health and safety concerns are: (1) eliminating risks of disease transmission from wildlife to humans; and (2) severe cuts from sharp utensils. In addition, sharps disposal containers will be used to safely dispose of needles and other sharps. Reporting A summary report detailing the results of tissue collection efforts will be prepared within 90 days of sample collections.
NECROPSY – FORTUITOUS SAMPLE COLLECTION CHECKLIST
Due to the history of the Rocky Mountain Arsenal National Wildlife Refuge, we are currently completing analysis of bison to ensure there is no human health risk associated consumption of bison. From time to time, fortuitous samples can be collected that will inform us on any contaminant residues found in animals. We request four samples be collected during necropsy.
Please contact Tom Ronning at (303) 289-0406 for pickup.
Date: ________________
Species: Bison Age _____ Sex _______ Eartag __________ Pittag ______________________
Pregnancy Status (circle one) Pregnant Not Pregnant NA
Body Condition (circle one) Excellent Good Fair Poor
Carcass Condition (circle one) Excellent Good Fair Poor