Roger B. Hammer Assistant Professor Department of Sociology Oregon State University Conducting Social Research Conducting Social Research Statistical Statistical Principles and An Principles and An Overview of Overview of Regression Regression Analysis Analysis Univariate, Bivariate, Univariate, Bivariate, and Multivariate and Multivariate Statistics Statistics
Transcript
Roger B. HammerAssistant Professor
Department of SociologyOregon State University
Conducting Social ResearchConducting Social Research
Statistical Principles and Statistical Principles and An Overview of An Overview of
Regression AnalysisRegression AnalysisUnivariate, Bivariate, and Univariate, Bivariate, and
Multivariate StatisticsMultivariate Statistics
Conducting Social ResearchConducting Social Research
Basic Notation Basic Notation Y A random variable (data vector) that we want A random variable (data vector) that we want
to model.to model.
iY The The iithth observation in our data vector. observation in our data vector.
5
8,7,6,5,4
2
Y
Y
Notation Notation: It varies, so be flexible. Notation Notation: It varies, so be flexible.
Conducting Social ResearchConducting Social Research
Basic Notation Basic Notation
iY The observed value of The observed value of iithth observation. observation.
Y Y-Bar is the mean of Y.Y-Bar is the mean of Y.
iY Y-Hat is the estimated or predicted Y-Hat is the estimated or predicted
value of value of iithth observation. observation.
Random VariableRandom Variable• A variableA variable whose numerical value whose numerical value
is determined by chance, the is determined by chance, the outcome of a random phenomenon.outcome of a random phenomenon.• DiscreteDiscrete has a countable number has a countable number
of values. of values. • ContinuousContinuous can take on any value can take on any value
in an interval.in an interval.
Conducting Social ResearchConducting Social Research
Is “statistical anxiety” continuous or discrete?Is “statistical anxiety” continuous or discrete?
ProbabilityProbability• ProbabilityProbability is the likelihood or chance that is the likelihood or chance that
something (an event) is the case or will happen.* something (an event) is the case or will happen.* • The probability of an event is represented by a real The probability of an event is represented by a real
number in the range from 0 to 1.*number in the range from 0 to 1.*• An impossible event has a probability of 0, and a An impossible event has a probability of 0, and a
certain event has a probability of 1.*certain event has a probability of 1.*
Conducting Social ResearchConducting Social Research
*Wikipedia*Wikipedia **Studenmund**Studenmund
**
****P[X]
P(A), p(A) or Pr(A)
Probability DistributionProbability Distribution• Assigns probabilities to the possible Assigns probabilities to the possible
values of a discrete variable.values of a discrete variable.
Conducting Social ResearchConducting Social Research
P[X] + P[Not X] = 1
P[Not X] = 1 - P[X] In the Statistical Anxiety Survey data, what In the Statistical Anxiety Survey data, what
is the probability of having taken a is the probability of having taken a previous statistics course? previous statistics course?
Of not having taken one?Of not having taken one?
Conducting Social Research
Normal (Gaussian) DistributionNormal (Gaussian) DistributionThe Bell CurveThe Bell Curve
Conducting Social Research
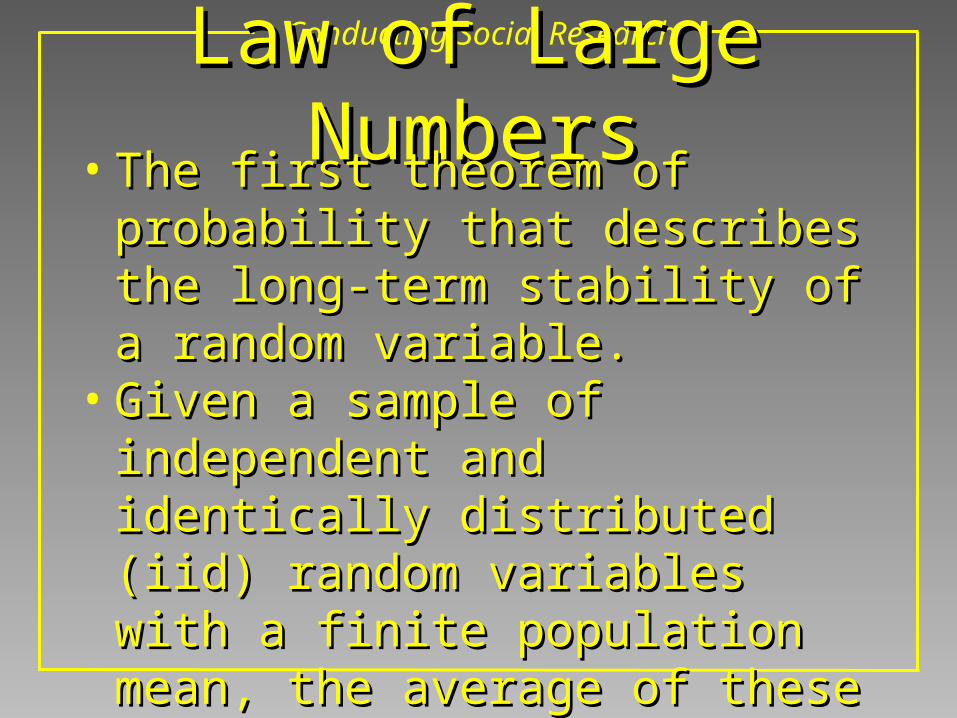
Law of Large NumbersLaw of Large Numbers• The first theorem of probability that The first theorem of probability that
describes the long-term stability of a describes the long-term stability of a random variable. random variable.
• Given a sample of independent and Given a sample of independent and identically distributed (iid) random identically distributed (iid) random variables with a finite population mean, variables with a finite population mean, the average of these observations will the average of these observations will eventually approach and stay close to eventually approach and stay close to the population mean.the population mean.
Conducting Social Research
The Central Limit TheoremThe Central Limit Theorem• The second theorem of probability that The second theorem of probability that
describes the distribution of a random describes the distribution of a random variable. variable.
• Given a sample of independent and Given a sample of independent and identically distributed (iid) random identically distributed (iid) random variables with a finite, nonzero standard variables with a finite, nonzero standard deviation, the probability distribution deviation, the probability distribution approaches the normal distribution as approaches the normal distribution as the sample size increases.the sample size increases.
SamplingSampling• PopulationPopulation is the entire is the entire
group of items of interest.group of items of interest.• SampleSample is the observed is the observed
part of the population.part of the population.
Conducting Social ResearchConducting Social Research
Is the Statistical Anxiety Survey data sample Is the Statistical Anxiety Survey data sample or population based?or population based?
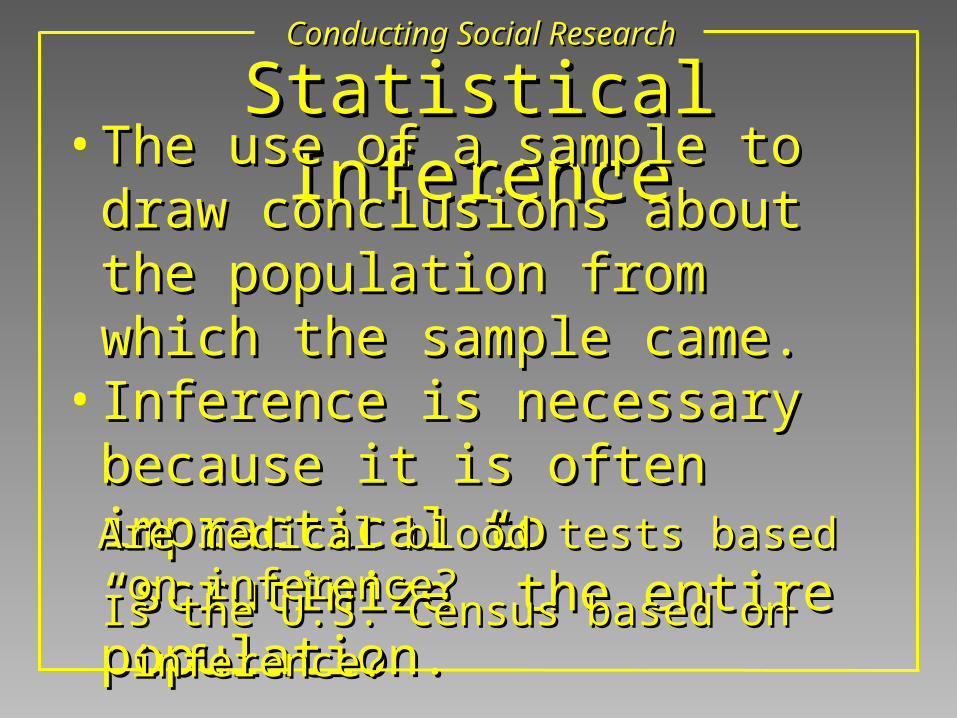
Statistical InferenceStatistical Inference• The use of a sample to draw The use of a sample to draw
conclusions about the population conclusions about the population from which the sample came.from which the sample came.
• Inference is necessary because it is Inference is necessary because it is often impractical to “scrutinize” the often impractical to “scrutinize” the entire population.entire population.
Conducting Social ResearchConducting Social Research
Are medical blood tests based on inference?Are medical blood tests based on inference?
Is the U.S. Census based on inference?Is the U.S. Census based on inference?
Random SamplingRandom Sampling• The use of a sample to draw The use of a sample to draw
conclusions about the population conclusions about the population from which the sample came.from which the sample came.
• Inference is necessary because it is Inference is necessary because it is often impractical to “scrutinize” the often impractical to “scrutinize” the entire population.entire population.
Conducting Social ResearchConducting Social Research
Are medical blood tests based on inference?Are medical blood tests based on inference?
Is the U.S. Census based on inference?Is the U.S. Census based on inference?
Selection BiasSelection Bias• The exclusion or under-The exclusion or under-
representation of certain types of representation of certain types of respondents/observations in a respondents/observations in a sample, resulting in a non-sample, resulting in a non-representative sample.representative sample.
Conducting Social ResearchConducting Social Research
Can you give an example of selection bias Can you give an example of selection bias highlighted recently in the media?highlighted recently in the media?
Is the Statistical Anxiety Survey data sample Is the Statistical Anxiety Survey data sample biased? Why or Why not?biased? Why or Why not?
The Expected Value of a The Expected Value of a Random VariableRandom Variable
Conducting Social Research
][PX
][E
i ii
X
X
• A weighted average of all the A weighted average of all the possible values of the random possible values of the random variable (population mean).variable (population mean).
Notation Notation: The italics don’t exactly conform to Studenmund. Remember to be flexible. Notation Notation: The italics don’t exactly conform to Studenmund. Remember to be flexible.
The Variance of a The Variance of a Random VariableRandom Variable
Conducting Social Research
][P)(
])[(E2
22
ii
iXX
X
• The extent to which the values may The extent to which the values may differ from the expected value.differ from the expected value.
• The expected value of the difference.The expected value of the difference.
Similarity of Mean and Similarity of Mean and Variance FormulasVariance Formulas
Conducting Social Research
• Substitution of the squared difference Substitution of the squared difference for the value.for the value.
][P)(
][P22
ii
i
ii
i
XX
XX
The Standard Deviation of The Standard Deviation of a Random Variablea Random Variable
Conducting Social Research
][P)(
])[(E2
2
ii
iXX
X
• The square root of the variance.The square root of the variance.• Absolute value of the difference.Absolute value of the difference.• Residuals.Residuals.
Population Parameters and Population Parameters and Sample StatisticsSample Statistics
ConceptConceptSample Statistic Population Parameter
Mean
Variance
Standard Deviation
Y2ys
ys
]Y[E]Y[2
y Var]Y[y Var
Conducting Social Research
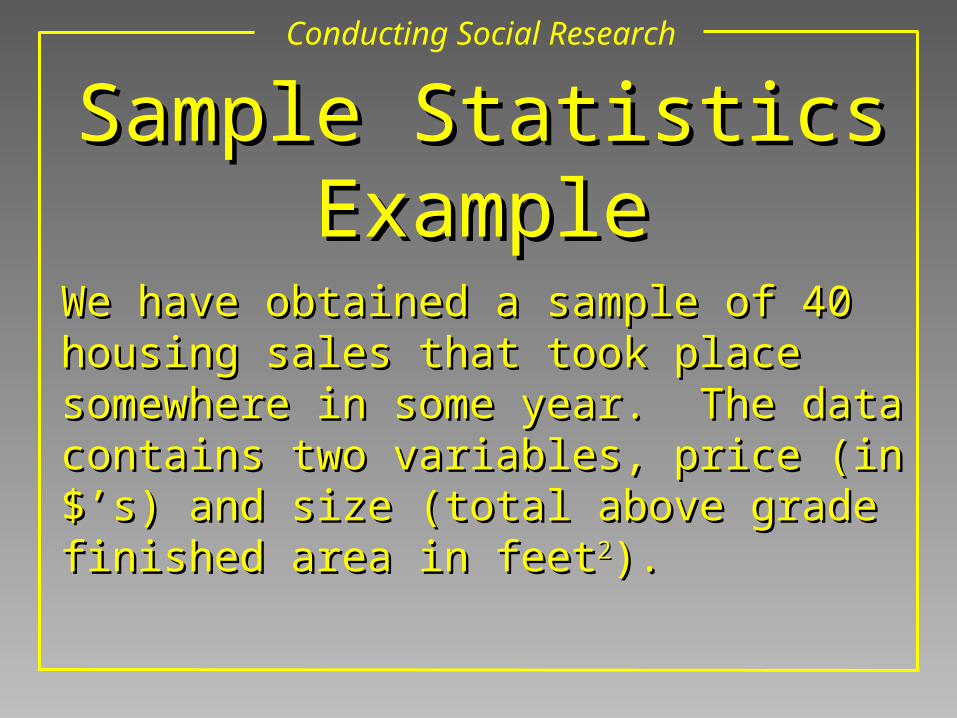
We have obtained a sample of 40 housing sales We have obtained a sample of 40 housing sales that took place somewhere in some year. The that took place somewhere in some year. The data contains two variables, price (in $’s) and size data contains two variables, price (in $’s) and size (total above grade finished area in feet(total above grade finished area in feet22).).
Conducting Social Research
Sample Statistics ExampleSample Statistics Example
Do you think that price and size would be Do you think that price and size would be related to each other?related to each other?
Would one “cause” the other?Would one “cause” the other?
Which variable would you consider to be Which variable would you consider to be independent (X) and which dependent (Y)? independent (X) and which dependent (Y)?
Why?Why?
Conducting Social Research
Price and SizePrice and Size
• X=X= Size and Size and Y =Y = Price Price • For a buyer the price that they are willing to For a buyer the price that they are willing to
pay is a function of the size of the house, along pay is a function of the size of the house, along with other factors. with other factors.
• X=X= Price and Price and Y =Y = Size Size• For a builder the price that they want to receive For a builder the price that they want to receive
for a home will determine its size, along with for a home will determine its size, along with other factors.other factors.
Conducting Social ResearchConducting Social Research
Independent and Independent and Dependent VariablesDependent Variables
Conducting Social ResearchConducting Social Research
Univariate StatisticsUnivariate Statistics
The Sample Mean of The Sample Mean of PricePriceConducting Social Research
n/Y...YYYY n321
030,87$
40/200,481,3$
n/YYn
1ii
If we drew a second sample of 40 housing sales If we drew a second sample of 40 housing sales would the mean be exactly the same as the would the mean be exactly the same as the mean of the first sample?mean of the first sample?
Is the sample mean exactly the same as the Is the sample mean exactly the same as the population mean?population mean?
Conducting Social Research
Population Mean and Population Mean and Sample MeansSample Means
Conducting Social Research
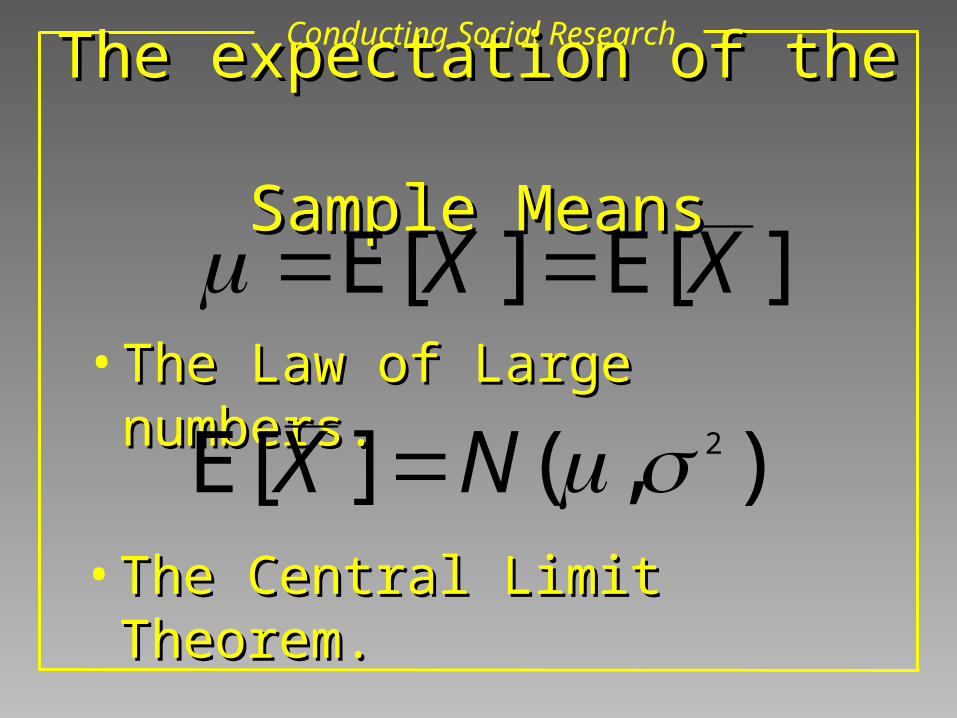
The expectation of the The expectation of the Sample MeansSample Means
• The Law of Large numbers.The Law of Large numbers.
][E][E XX
• The Central Limit Theorem.The Central Limit Theorem.
),(][E 2NX
The Sample Mean of The Sample Mean of SizeSize
n/X...XXXX n321
427,4
40/097,177
n/XXn
1ii
Conducting Social Research
The Sum of the DeviationsThe Sum of the DeviationsThe Zero-sum PropertyThe Zero-sum Property
0)XX()XX(E ii
0)YY()YY(E ii
Conducting Social Research
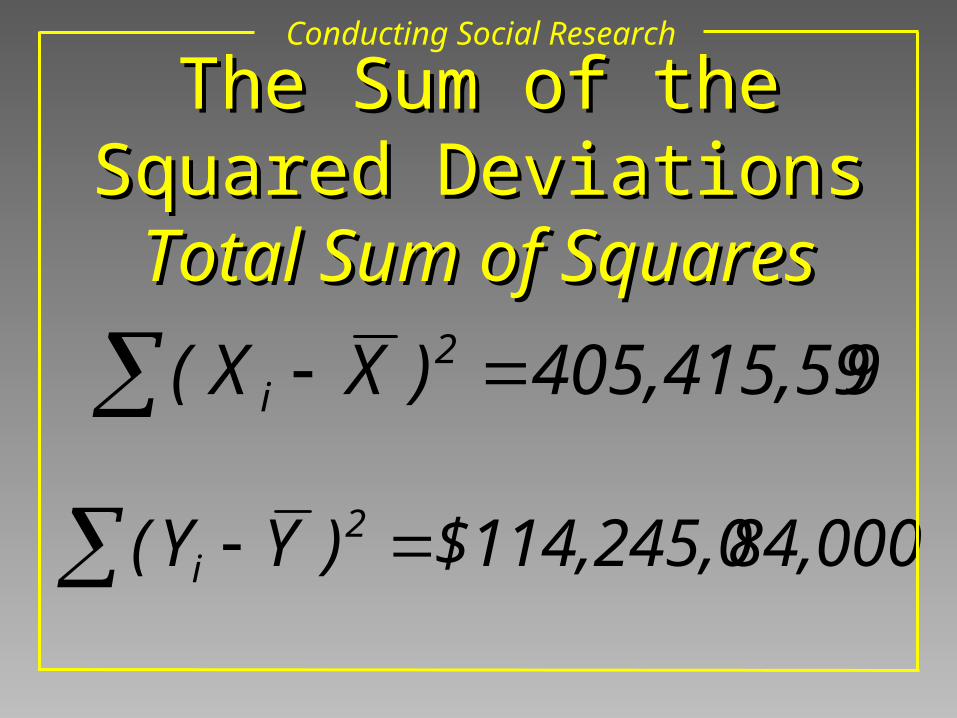
The Sum of the Squared The Sum of the Squared DeviationsDeviations
Total Sum of SquaresTotal Sum of Squares
9405,415,59)XX( 2i
84,000$114,245,0 )YY( 2i
Conducting Social Research
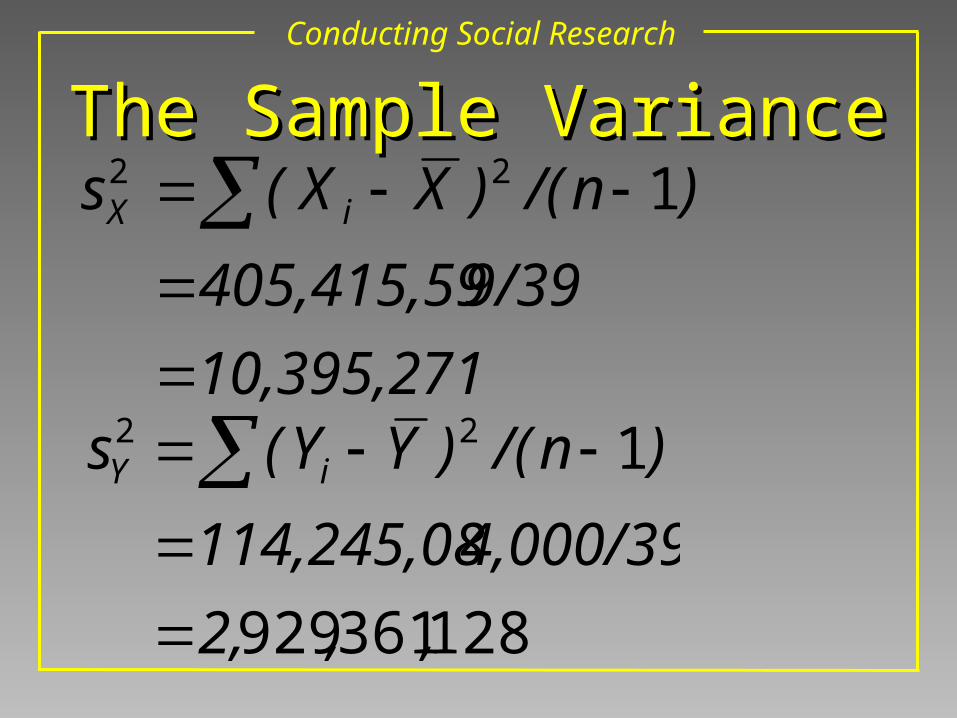
The Sample VarianceThe Sample Variance
10,395,271
9/39405,415,59
)n/()XX(s iX
122
128361929
122
,,2,
4,000/39114,245,08
)n/()YY(s iY
Conducting Social Research
Sample Standard DeviationSample Standard Deviation
3,224ss 2XX
123,54$ss 2YY
Conducting Social Research
Conducting Social ResearchConducting Social Research
Bivariate StatisticsBivariate Statistics(Skipping Ahead to Chapter 2)(Skipping Ahead to Chapter 2)
Covariance of Covariance of XX and and YY
972,356,731
/39922,921,7606,
)1n/()YY)(XX(s iXY
Conducting Social Research
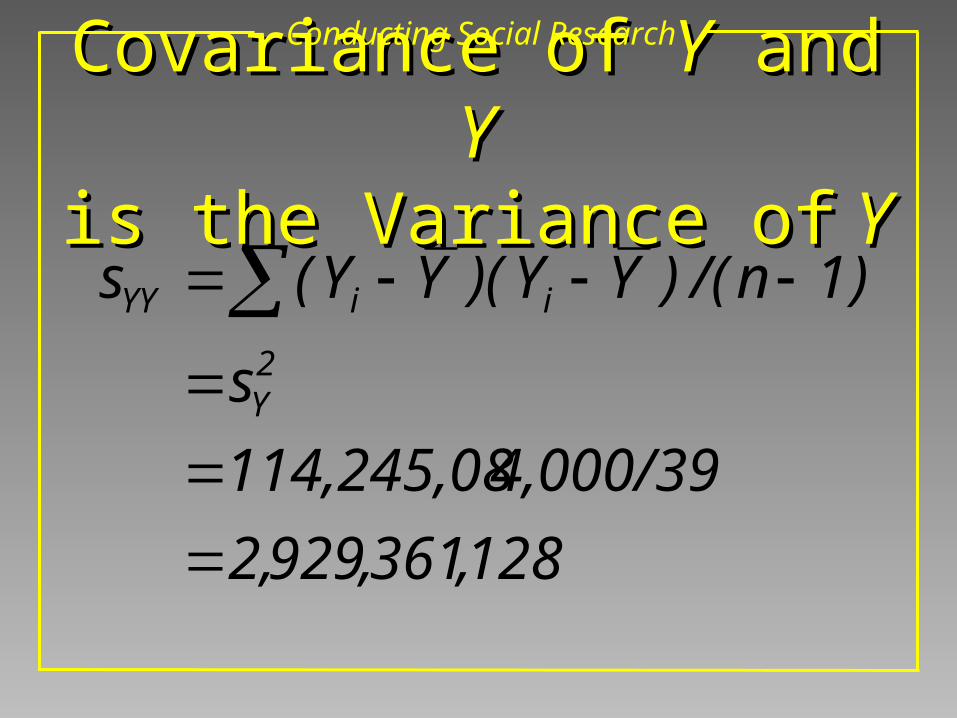
Covariance of Covariance of YY and and YYis the Variance ofis the Variance of Y Y
128,361,9292,
4,000/39114,245,08
s
)1n/()YY)(YY(s2Y
iiYY
Conducting Social Research
Correlation of Correlation of XX and and YY
9934.
4,1245*3,224
972,356,731
ss
sr
yx
xy
Conducting Social Research
Regression AnalysisRegression Analysis• Econometricians use regression analysis to make Econometricians use regression analysis to make
quantitative estimates of economic relationships quantitative estimates of economic relationships that previously have been completely theoretical in that previously have been completely theoretical in nature.nature.
• Sociologists use regression analysis to make Sociologists use regression analysis to make quantitative estimates of social relationships that quantitative estimates of social relationships that previously have been completely theoretical in previously have been completely theoretical in nature.nature.
• Political scientists use regression analysis to make Political scientists use regression analysis to make quantitative estimates of political relationships that quantitative estimates of political relationships that previously have been completely theoretical in previously have been completely theoretical in naturenature
Conducting Social ResearchConducting Social Research
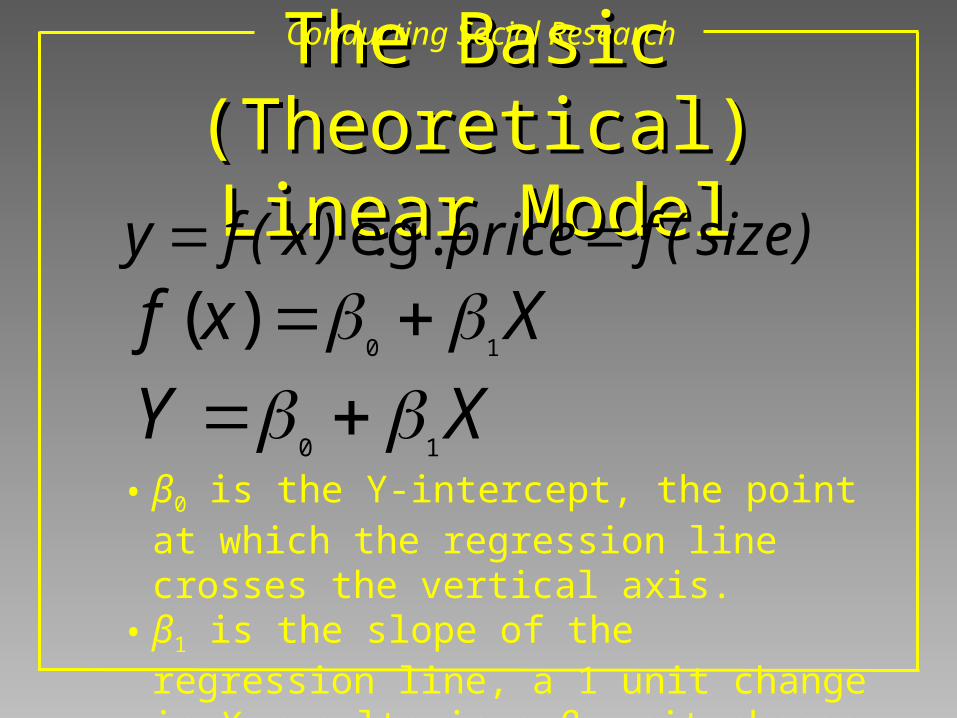
The Basic (Theoretical) The Basic (Theoretical) Linear ModelLinear Model
)size(fprice.)x(fy g.e
Xxf10
)( XY
10
• β0 is the Y-intercept, the point at which the regression line crosses the vertical axis.
• β1 is the slope of the regression line, a 1 unit change in Xi results in a β1 unit change in Yi.
Conducting Social Research
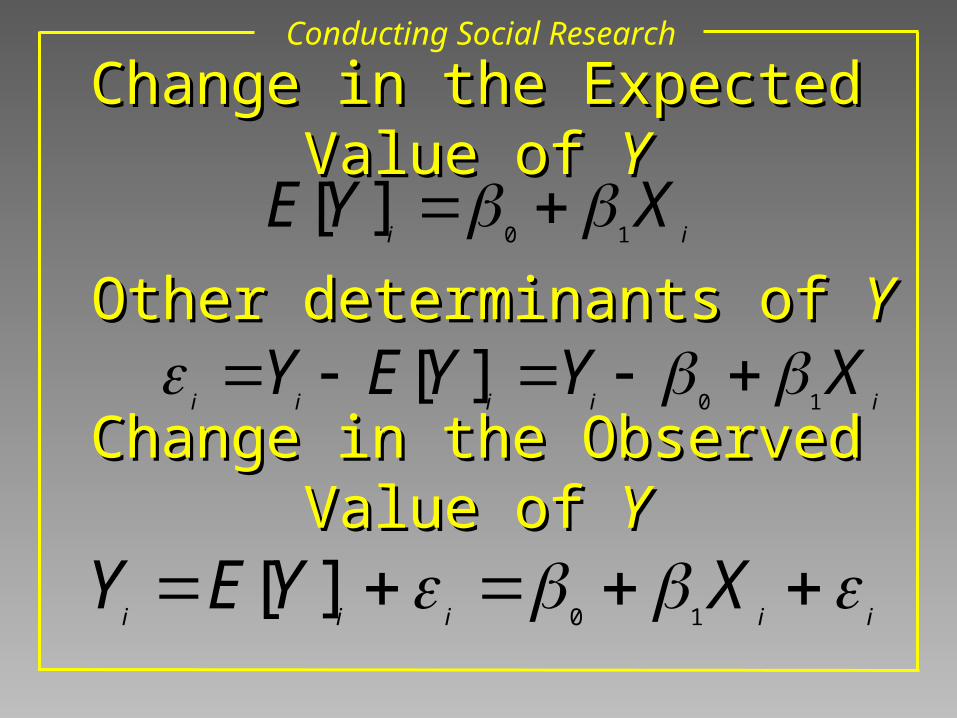
Change in the Expected Value of Change in the Expected Value of YY
iiXYE
10][
Other determinants of Other determinants of YY
iiiiiXYYEY
10][
Change in the Observed Value of Change in the Observed Value of YY