Role of contrast and fractality of laser speckle image in assessing flow velocity and scatterer concentration in phantom body fluids Cerine Lal Arnab Banerjee Narayanan Unni Sujatha Downloaded From: https://www.spiedigitallibrary.org/journals/Journal-of-Biomedical-Optics on 05 May 2020 Terms of Use: https://www.spiedigitallibrary.org/terms-of-use
Transcript
Role of contrast and fractality of laserspeckle image in assessing flowvelocity and scatterer concentration inphantom body fluids
Cerine LalArnab BanerjeeNarayanan Unni Sujatha
Downloaded From: https://www.spiedigitallibrary.org/journals/Journal-of-Biomedical-Optics on 05 May 2020Terms of Use: https://www.spiedigitallibrary.org/terms-of-use
Role of contrast and fractality of laser speckle imagein assessing flow velocity and scatterer concentrationin phantom body fluids
Cerine Lal, Arnab Banerjee, and Narayanan Unni SujathaIndian Institute of Technology Madras, Department of Applied Mechanics, Biophotonics Lab, Chennai 600036, India
Paper 130280SSPRR received Apr. 26, 2013; revised manuscript received Oct. 17, 2013; accepted for publication Oct. 18, 2013; pub-lished online Nov. 18, 2013.
1 IntroductionBlood supplies nutrients and oxygen to all the parts of our bodyand also plays a major role in thermal regulation. Monitoringblood flow is, therefore, important and helps clinicians assesstissue health. Various diseases like diabetes, peripheral vasculardisease, and Raynaud’s phenomenon impair the tissue bloodsupply and, therefore, measurement of the same can provideinformation for the diagnosis/assessment of similar diseases.Changes in microvascular perfusion (tissue blood flow) arefound to occur at the onset of a disease and hence, thesechanges, if detected, can provide early disease diagnosis,which in turn can increase the survival rates.
Laser speckle contrast imaging (LSCI) introduced in 1970s isa nonscanning, noninvasive wide field optical technique, which isbeing explored widely in microvascular perfusion assessment.1
The principle of LSCI can be found elsewhere.2,3 This techniquewas a breakthrough in the field of noninvasive monitoring ofblood flow. Since then, various researchers have demonstrateda qualitative relationship between motion of scatterers and theresulting spatial or temporal speckle contrast of the integratedspeckle pattern. LSCI offers good spatial and temporal resolutionand has found applications in real-time blood flow imaging ofretina and skin,4–8 cerebral blood flow imaging,9,10 monitoringof blood flow dynamics during neurosurgeries,11 and also in pho-todynamic therapy.12 Most of the discussed techniques rely on thevariations in the contrast of the obtained speckle image.5,13–15
Although LSCI has found tremendous applications in biomedical
imaging, the quantification of flow velocities in its absolute unitsstill remains a challenge and continues to be of increased researchinterest.16–19 Although flow quantification has been tried out pre-viously using alternate methods,1,20–29 LSCI, due to its inherentadvantage of whole field nature and noninvasiveness, holds apotential to be probed in quantitative studies.
It is imperative to keep the scatterer concentration uniform toensure the relationship between speckle contrast and flow veloc-ities while employing LSCI. As speckle image contrast is alsodependent on the concentration of scattering centers, it is alsopossible to extract concentration related information by analyz-ing the contrast changes.30 Hence, simultaneous variations offlow and scatterer concentration will be of great challengeto get assessed using LSCI. Extracting additional features ofspeckle pattern may enable the simultaneous extraction offlow and concentration details. Spatial and temporal specklestatistics, such as autocorrelation and power spectrum, havealso been widely used to find the velocity and concentrationof the moving scatterers, in addition to the texture analysis ofsurfaces and images.31–34 Recently, fractal nature of the specklepatterns has also been proposed for characterization of roughsurfaces, texture analysis, and spatial characterization of multi-scattering medium.35–37 The fractal analysis of LSCI data hasalso been carried out.38 Our group has worked previously onthe comparison of fractality of laser Doppler flow meter signalsand laser speckle images acquired from different parts of thebody in healthy subjects previously and has shown that the frac-tality of speckle images are found to be in agreement with thefractality Doppler signals in characterizing the flow changes.39
Journal of Biomedical Optics 111419-1 November 2013 • Vol. 18(11)
Journal of Biomedical Optics 18(11), 111419 (November 2013)
Downloaded From: https://www.spiedigitallibrary.org/journals/Journal-of-Biomedical-Optics on 05 May 2020Terms of Use: https://www.spiedigitallibrary.org/terms-of-use
pattern could be understood as an alternate tool in assess-ing flow or scatterer concentration–related parameters. In thepresent work, an experimental model is attempted analyzingthe contrast and fractality features of a captured speckle patternfor extracting the flow velocity as well as scatterer concentra-tion. The initially obtained results are found to be in agreement,suggesting the possible exploration for a more detailed and reli-able quantified approach toward the synchronous analysis ofmultiple parameters related to fluid flow.
2 Materials and Methods
2.1 Laser Speckle Imaging Experimental Setup
The schematic of the experimental setup used in this study isshown in Fig. 1. Intralipid 20% solution (Fresenius Kabi,Bad Homburg, Germany) mimicking the body fluid of differentconcentrations (1%, 2%, 3%, 4%, and 5% v/v) is prepared andpumped at different flow rates through a phantom flow channelranging from 10 to 190 ml∕h in steps of 20 ml∕h using asyringe pump (Model RH-SY10, Ravel Hiteks Pvt. Ltd, India).
The flow phantom was custom made by grooving channelsof 3-mm width and 5-mm depth in perspex sheet(120 × 40 mm2). The flow phantom was illuminated by diodepumped solid state laser (671 nm, 30-mW power) and speckleimages were captured by the CCD camera (DCU223M,Thorlabs, Newton, NJ) zoom lens system. In the red andnear-infrared region of light, most of the interactions in the tis-sue are scattering events rather than absorption events40–42 andhence the choice of intralipid solution mainly representing thescatterers was made for the experiments. The distance betweenthe CCD camera and the flow channel was maintained constant(40 cm) for all experiments. The laser source to sample distancewas 15 cm. The optical setup provided a magnification of 1∶1and f number of 2.5, thus producing speckles of ∼8.12 μm indiameter, which is approximately twice the pixel size of4.65 μm, hence being optimal for speckle contrast imaging.8
Exposure time of the CCD camera was set to 20 ms, andsubsequent image processing was done using MATLAB(Mathworks, Massachusetts).
2.2 Laser Speckle Imaging of the FlowChannel—Contrast Analysis
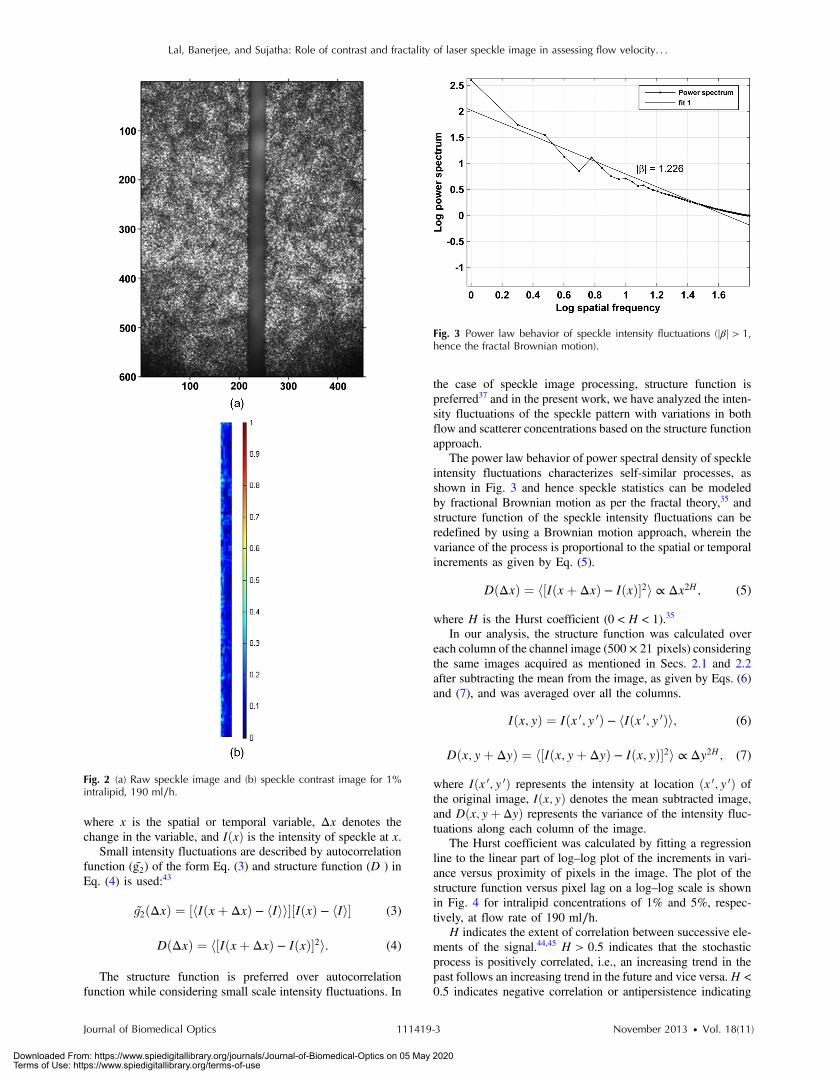
The acquired speckle image for the flow of intralipid 1% solu-tion at a rate of 190 ml∕h is shown in Fig. 2(a). For the spatialcontrast analysis, the flow channel of size 500 × 21 pixels wasselected and processed. The speckle contrast was calculatedusing Eq. (1) by taking 5 × 5 blocks of pixels over the entirechannel image, thus producing a false color contrast map,2 asshown in Fig. 2(b).
K ¼ σ
hIi ; (1)
where K is the speckle contrast, σ is the standard deviation, andhIi is the mean intensity. The average contrast of three mapscorresponding to images taken with an interval of 10 s betweenthem is calculated after enhancement procedures, which wereadopted uniformly for different flow conditions.
2.3 Laser Speckle Imaging of the Flow Channel:Fractal Analysis
First order and second order statistics of speckle pattern havebeen used to analyze properties of the scattering media. First-order statistics describe the properties of speckle fields ateach point. This includes intensity probability distribution func-tion and contrast. Statistics of second order show how fast theintensity changes from point to point in the speckle pattern.Second-order statistics are described by autocorrelation function(g2) of intensity fluctuations given by Eq. (2):43
g2ðxÞ ¼ hIðxþ ΔxÞIðxÞi; (2)
Fig. 1 Schematic of laser speckle imaging setup.
Journal of Biomedical Optics 111419-2 November 2013 • Vol. 18(11)
Lal, Banerjee, and Sujatha: Role of contrast and fractality of laser speckle image in assessing flow velocity. . .
Downloaded From: https://www.spiedigitallibrary.org/journals/Journal-of-Biomedical-Optics on 05 May 2020Terms of Use: https://www.spiedigitallibrary.org/terms-of-use
where x is the spatial or temporal variable, Δx denotes thechange in the variable, and IðxÞ is the intensity of speckle at x.
Small intensity fluctuations are described by autocorrelationfunction (g̃2) of the form Eq. (3) and structure function (D ) inEq. (4) is used:43
g̃2ðΔxÞ ¼ ½hIðxþ ΔxÞ − hIii�½IðxÞ − hIi� (3)
DðΔxÞ ¼ h½Iðxþ ΔxÞ − IðxÞ�2i. (4)
The structure function is preferred over autocorrelationfunction while considering small scale intensity fluctuations. In
the case of speckle image processing, structure function ispreferred37 and in the present work, we have analyzed the inten-sity fluctuations of the speckle pattern with variations in bothflow and scatterer concentrations based on the structure functionapproach.
The power law behavior of power spectral density of speckleintensity fluctuations characterizes self-similar processes, asshown in Fig. 3 and hence speckle statistics can be modeledby fractional Brownian motion as per the fractal theory,35 andstructure function of the speckle intensity fluctuations can beredefined by using a Brownian motion approach, wherein thevariance of the process is proportional to the spatial or temporalincrements as given by Eq. (5).
DðΔxÞ ¼ h½Iðxþ ΔxÞ − IðxÞ�2i ∝ Δx2H; (5)
where H is the Hurst coefficient (0 < H < 1).35
In our analysis, the structure function was calculated overeach column of the channel image (500 × 21 pixels) consideringthe same images acquired as mentioned in Secs. 2.1 and 2.2after subtracting the mean from the image, as given by Eqs. (6)and (7), and was averaged over all the columns.
where Iðx 0; y 0Þ represents the intensity at location ðx 0; y 0Þ ofthe original image, Iðx; yÞ denotes the mean subtracted image,and Dðx; yþ ΔyÞ represents the variance of the intensity fluc-tuations along each column of the image.
The Hurst coefficient was calculated by fitting a regressionline to the linear part of log–log plot of the increments in vari-ance versus proximity of pixels in the image. The plot of thestructure function versus pixel lag on a log–log scale is shownin Fig. 4 for intralipid concentrations of 1% and 5%, respec-tively, at flow rate of 190 ml∕h.
H indicates the extent of correlation between successive ele-ments of the signal.44,45 H > 0.5 indicates that the stochasticprocess is positively correlated, i.e., an increasing trend in thepast follows an increasing trend in the future and vice versa.H <0.5 indicates negative correlation or antipersistence indicating
Fig. 2 (a) Raw speckle image and (b) speckle contrast image for 1%intralipid, 190 ml∕h.
Fig. 3 Power law behavior of speckle intensity fluctuations (jβj > 1,hence the fractal Brownian motion).
Journal of Biomedical Optics 111419-3 November 2013 • Vol. 18(11)
Lal, Banerjee, and Sujatha: Role of contrast and fractality of laser speckle image in assessing flow velocity. . .
Downloaded From: https://www.spiedigitallibrary.org/journals/Journal-of-Biomedical-Optics on 05 May 2020Terms of Use: https://www.spiedigitallibrary.org/terms-of-use
successive elements in the data following alternating incrementsand decrements.
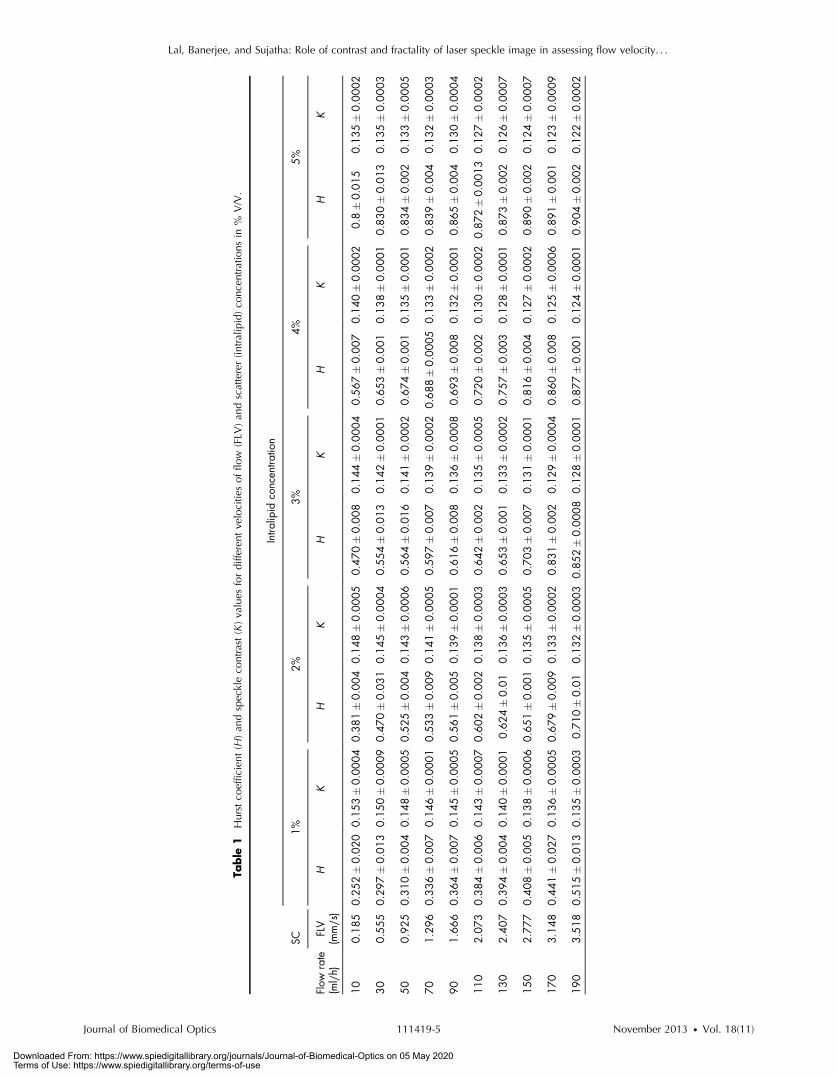
3 Results and DiscussionsThe speckle images obtained for different flows and concentra-tions of intralipid solution, as mentioned in Sec. 2, were ana-lyzed for the fractality and contrast. Table 1 shows the meanH and contrast values for different flow rates/flow velocitiesand intralipid concentrations along with the standard deviationmeasurements. The range of flow velocities is so chosen in orderto represent the normal and varied range of tissue perfusion.46
3.1 Variation of H with Flow Velocities
An increasing trend was observed for H with an increase in theflow velocity. The fractional Brownian motion analyzed spa-tially in the intralipid fluid speckle image is found to be morepositively correlated with increase in the flow velocity, as is evi-dent from the increased H. The fractional Brownian motion,which could also be considered as a diffusion process exhibitedin the speckle image spatial analysis, has previously been inves-tigated for blood.47 This could be seen as an effect to streamlineor positively correlate the existing fractional Brownian motionwith the effect of increased flow velocity. We hypothesize thatthe randomness in a fractional Brownian motion reduces withincreased flow and this may be attributed to the cause of positive
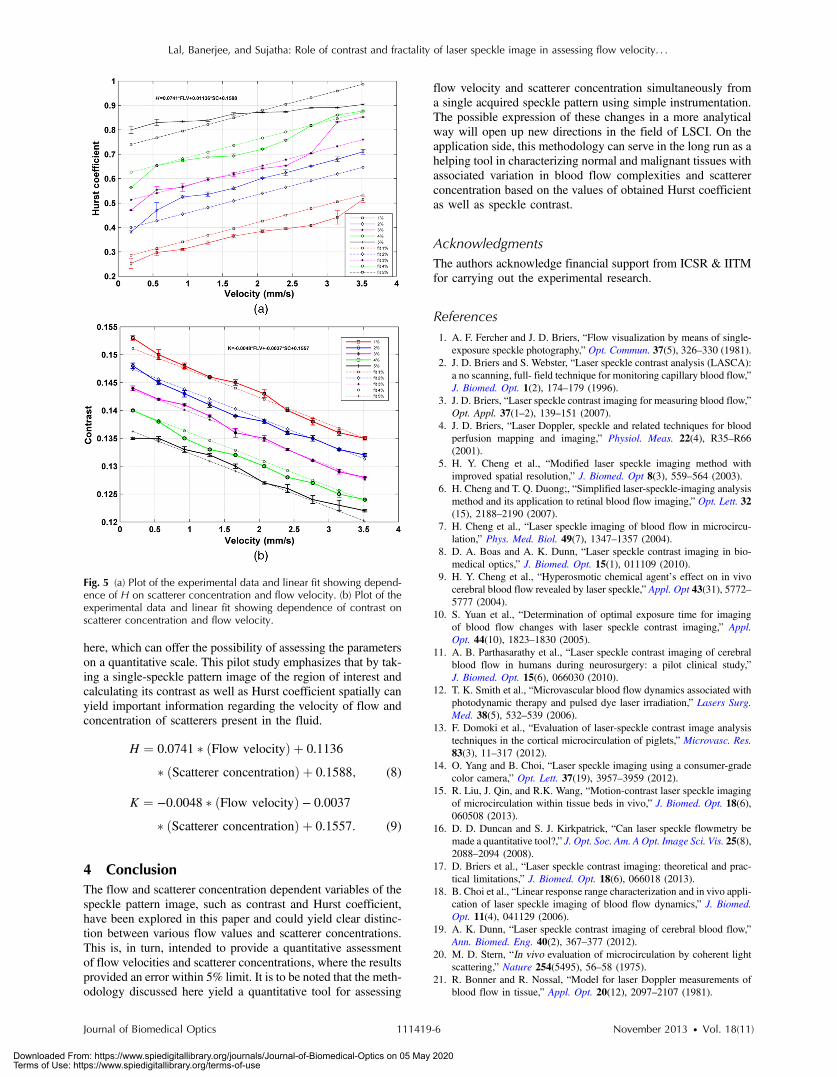
correlation seen with increased flow. An increase in H indicatesthat the variance of the intensity fluctuations as a function of thepixel location within the speckle images is increasing withincreasing flow rates. A plot showing the relationship of Hwith flow velocity is shown in Fig. 5(a).
3.2 Variation of H with Scatterer Concentration
An increasing trend for spatialH is observed with increase in theconcentration of the scatterers similar to that of the response forflow velocity. When the particle concentration is increased, thesingle particle chaotic movement may be restricted, facilitatingparticle agglomerations within the medium, which can be con-sidered as the cause of increasing positive correlation for thefractional Brownian movement represented by the increasedvalue of H corresponding to the spatial speckle image analysis.Also, as the scatterer concentration increases, the backscatteredimage intensity is increased as a result of more scattering centersin the medium leading to an increase in pixel intensity fluctua-tions, thereby increasing H. The relationship of H with scattererconcentration for constant flow velocities can be observed fromFig. 5(a).
3.3 Variation of Speckle Contrast with Flow Velocityand Scatterer Concentration
Analyzing average speckle contrast in the region of interest forflow analysis has been established by many researchers and isreferenced widely in Sec. 1 of this article. As flow velocityincreases, the image becomes blurred and the average contrastdecreases. A plot showing the relationship of speckle contrastand flow velocity is shown in Fig. 5(b). It has also been estab-lished previously that the average speckle image contrastincreases with increase in the scatterer concentration in staticfluids30 by our group. The dependence of speckle contrast onscatterer concentration and flow velocity can also be seen inreports.48 We have observed a similar trend for different flows,with measurements being taken for a specific flow at a time. Therelationship of scatterer concentration with speckle image con-trast can be observed from Fig. 5(b).
3.4 Dual Parametric Model for SimultaneousScatterer Concentration and Flow VelocityMeasurements
From Figs. 5(a) and 5(b), it is observed that H and contrastfollow an inverse relationship in the case of flow velocity. Fora given concentration of intralipid and for increasing flow rates,H is increasing while the speckle contrast decreases. On theother hand, for a given flow velocity, increased H and contrastwere observed with the increase in scatterer concentration. Also,it is observed that at higher scatterer concentrations, the changein H with varying flow velocities is less compared to that atlower concentrations.
As both Hurst coefficient and speckle contrast are found tobe dependent on scatterer concentration and flow velocity, wehave used multiple linear regression with our experimental datain order to model the dependence of scatterer concentration andflow rate on H and contrast. Below equations [Eqs. (8) and (9)]obtained represent the fitted plot, and corresponding plots aregiven along with the experimental results in Figs. 5(a) and 5(b). The parametric dependence (flow and scatterer concentra-tion) of H as well as contrast was approximated to a linear fit
Fig. 4 Plot of the structure function with different concentrations ofintralipid at flow rate 190 ml∕h. (a) 1% intralipid and (b) 5% intralipid.
Journal of Biomedical Optics 111419-4 November 2013 • Vol. 18(11)
Lal, Banerjee, and Sujatha: Role of contrast and fractality of laser speckle image in assessing flow velocity. . .
Downloaded From: https://www.spiedigitallibrary.org/journals/Journal-of-Biomedical-Optics on 05 May 2020Terms of Use: https://www.spiedigitallibrary.org/terms-of-use
Table
1Hurst
coeffic
ient
(H)an
dspec
kleco
ntrast
(K)values
fordiffe
rent
velocitie
sof
flow
(FLV
)an
dscatterer(in
tralip
id)co
ncen
tratio
nsin
%V/V.
Intra
lipid
concen
tratio
n
SC1%
2%3%
4%5%
Flow
rate
(ml∕h)
FLV
(mm∕s)
HK
HK
HK
HK
HK
100.18
50.252�0.020
0.153�0.0004
0.381�0.004
0.148�0.0005
0.470�0.008
0.144�0.0004
0.567�0.007
0.140�0.0002
0.8
�0.015
0.135�0.0002
300.55
50.297�0.013
0.150�0.0009
0.470�0.031
0.145�0.0004
0.554�0.013
0.142�0.0001
0.653�0.001
0.138�0.0001
0.830�0.013
0.135�0.0003
500.92
50.310�0.004
0.148�0.0005
0.525�0.004
0.143�0.0006
0.564�0.016
0.141�0.0002
0.674�0.001
0.135�0.0001
0.834�0.002
0.133�0.0005
701.29
60.336�0.007
0.146�0.0001
0.533�0.009
0.141�0.0005
0.597�0.007
0.139�0.0002
0.688�0.0005
0.133�0.0002
0.839�0.004
0.132�0.0003
901.66
60.364�0.007
0.145�0.0005
0.561�0.005
0.139�0.0001
0.616�0.008
0.136�0.0008
0.693�0.008
0.132�0.0001
0.865�0.004
0.130�0.0004
110
2.07
30.384�0.006
0.143�0.0007
0.602�0.002
0.138�0.0003
0.642�0.002
0.135�0.0005
0.720�0.002
0.130�0.0002
0.872�0.0013
0.127�0.0002
130
2.40
70.394�0.004
0.140�0.0001
0.624�0.01
0.136�0.0003
0.653�0.001
0.133�0.0002
0.757�0.003
0.128�0.0001
0.873�0.002
0.126�0.0007
150
2.77
70.408�0.005
0.138�0.0006
0.651�0.001
0.135�0.0005
0.703�0.007
0.131�0.0001
0.816�0.004
0.127�0.0002
0.890�0.002
0.124�0.0007
170
3.14
80.441�0.027
0.136�0.0005
0.679�0.009
0.133�0.0002
0.831�0.002
0.129�0.0004
0.860�0.008
0.125�0.0006
0.891�0.001
0.123�0.0009
190
3.51
80.515�0.013
0.135�0.0003
0.710�0.01
0.132�0.0003
0.852�0.0008
0.128�0.0001
0.877�0.001
0.124�0.0001
0.904�0.002
0.122�0.0002
Journal of Biomedical Optics 111419-5 November 2013 • Vol. 18(11)
Lal, Banerjee, and Sujatha: Role of contrast and fractality of laser speckle image in assessing flow velocity. . .
Downloaded From: https://www.spiedigitallibrary.org/journals/Journal-of-Biomedical-Optics on 05 May 2020Terms of Use: https://www.spiedigitallibrary.org/terms-of-use
here, which can offer the possibility of assessing the parameterson a quantitative scale. This pilot study emphasizes that by tak-ing a single-speckle pattern image of the region of interest andcalculating its contrast as well as Hurst coefficient spatially canyield important information regarding the velocity of flow andconcentration of scatterers present in the fluid.
H ¼ 0.0741 � ðFlow velocityÞ þ 0.1136
� ðScatterer concentrationÞ þ 0.1588; (8)
K ¼ −0.0048 � ðFlow velocityÞ − 0.0037
� ðScatterer concentrationÞ þ 0.1557: (9)
4 ConclusionThe flow and scatterer concentration dependent variables of thespeckle pattern image, such as contrast and Hurst coefficient,have been explored in this paper and could yield clear distinc-tion between various flow values and scatterer concentrations.This is, in turn, intended to provide a quantitative assessmentof flow velocities and scatterer concentrations, where the resultsprovided an error within 5% limit. It is to be noted that the meth-odology discussed here yield a quantitative tool for assessing
flow velocity and scatterer concentration simultaneously froma single acquired speckle pattern using simple instrumentation.The possible expression of these changes in a more analyticalway will open up new directions in the field of LSCI. On theapplication side, this methodology can serve in the long run as ahelping tool in characterizing normal and malignant tissues withassociated variation in blood flow complexities and scattererconcentration based on the values of obtained Hurst coefficientas well as speckle contrast.
AcknowledgmentsThe authors acknowledge financial support from ICSR & IITMfor carrying out the experimental research.
References1. A. F. Fercher and J. D. Briers, “Flow visualization by means of single-
exposure speckle photography,” Opt. Commun. 37(5), 326–330 (1981).2. J. D. Briers and S. Webster, “Laser speckle contrast analysis (LASCA):
a no scanning, full- field technique for monitoring capillary blood flow,”J. Biomed. Opt. 1(2), 174–179 (1996).
3. J. D. Briers, “Laser speckle contrast imaging for measuring blood flow,”Opt. Appl. 37(1–2), 139–151 (2007).
4. J. D. Briers, “Laser Doppler, speckle and related techniques for bloodperfusion mapping and imaging,” Physiol. Meas. 22(4), R35–R66(2001).
5. H. Y. Cheng et al., “Modified laser speckle imaging method withimproved spatial resolution,” J. Biomed. Opt 8(3), 559–564 (2003).
6. H. Cheng and T. Q. Duong;, “Simplified laser-speckle-imaging analysismethod and its application to retinal blood flow imaging,” Opt. Lett. 32(15), 2188–2190 (2007).
7. H. Cheng et al., “Laser speckle imaging of blood flow in microcircu-lation,” Phys. Med. Biol. 49(7), 1347–1357 (2004).
8. D. A. Boas and A. K. Dunn, “Laser speckle contrast imaging in bio-medical optics,” J. Biomed. Opt. 15(1), 011109 (2010).
9. H. Y. Cheng et al., “Hyperosmotic chemical agent’s effect on in vivocerebral blood flow revealed by laser speckle,” Appl. Opt 43(31), 5772–5777 (2004).
10. S. Yuan et al., “Determination of optimal exposure time for imagingof blood flow changes with laser speckle contrast imaging,” Appl.Opt. 44(10), 1823–1830 (2005).
11. A. B. Parthasarathy et al., “Laser speckle contrast imaging of cerebralblood flow in humans during neurosurgery: a pilot clinical study,”J. Biomed. Opt. 15(6), 066030 (2010).
12. T. K. Smith et al., “Microvascular blood flow dynamics associated withphotodynamic therapy and pulsed dye laser irradiation,” Lasers Surg.Med. 38(5), 532–539 (2006).
13. F. Domoki et al., “Evaluation of laser-speckle contrast image analysistechniques in the cortical microcirculation of piglets,” Microvasc. Res.83(3), 11–317 (2012).
14. O. Yang and B. Choi, “Laser speckle imaging using a consumer-gradecolor camera,” Opt. Lett. 37(19), 3957–3959 (2012).
15. R. Liu, J. Qin, and R.K. Wang, “Motion-contrast laser speckle imagingof microcirculation within tissue beds in vivo,” J. Biomed. Opt. 18(6),060508 (2013).
16. D. D. Duncan and S. J. Kirkpatrick, “Can laser speckle flowmetry bemade a quantitative tool?,” J. Opt. Soc. Am. A Opt. Image Sci. Vis. 25(8),2088–2094 (2008).
17. D. Briers et al., “Laser speckle contrast imaging: theoretical and prac-tical limitations,” J. Biomed. Opt. 18(6), 066018 (2013).
18. B. Choi et al., “Linear response range characterization and in vivo appli-cation of laser speckle imaging of blood flow dynamics,” J. Biomed.Opt. 11(4), 041129 (2006).
19. A. K. Dunn, “Laser speckle contrast imaging of cerebral blood flow,”Ann. Biomed. Eng. 40(2), 367–377 (2012).
20. M. D. Stern, “In vivo evaluation of microcirculation by coherent lightscattering,” Nature 254(5495), 56–58 (1975).
21. R. Bonner and R. Nossal, “Model for laser Doppler measurements ofblood flow in tissue,” Appl. Opt. 20(12), 2097–2107 (1981).
Fig. 5 (a) Plot of the experimental data and linear fit showing depend-ence of H on scatterer concentration and flow velocity. (b) Plot of theexperimental data and linear fit showing dependence of contrast onscatterer concentration and flow velocity.
Journal of Biomedical Optics 111419-6 November 2013 • Vol. 18(11)
Lal, Banerjee, and Sujatha: Role of contrast and fractality of laser speckle image in assessing flow velocity. . .
Downloaded From: https://www.spiedigitallibrary.org/journals/Journal-of-Biomedical-Optics on 05 May 2020Terms of Use: https://www.spiedigitallibrary.org/terms-of-use
22. A. Serov et al., “Laser Doppler perfusion imaging with a complimentarymetal oxide semiconductor image sensor,”Opt. Lett. 27(5), 300–302 (2002).
23. M. N. Kim et al., “Noninvasive measurement of cerebral blood flowand blood oxygenation using near-infrared and diffuse correlation spec-troscopies in critically brain-injured adults,” Neurocrit. Care 12(2),173–180 (2010).
24. J. Hagblad et al., “A technique based on laser Doppler flowmetry andphotoplethysmography for simultaneously monitoring blood flow at dif-ferent tissue depths,” Med. Biol. Eng. Comput. 48(5), 415–422 (2010).
25. S. Margareta et al., “Non-invasive monitoring of muscle blood perfusionby photoplethysmography: evaluation of a new application,” ActaPhysiol. Scand. 183(4), 335–343 (2005).
26. V. J. Srinivasan et al., “Optical coherence tomography for the quanti-tative study of cerebrovascular physiology,” J. Cereb. Blood FlowMetab. 31(6), 1339–1345 (2011).
27. J. D. Briers and S. Webster, “Laser speckle contrast analysis (LASCA):a no scanning, full- field technique for monitoring capillary blood flow,”J. Biomed. Opt. 1(2), 174–179 (1996).
28. D. Fixler and Z. Zalevsky, “Estimation of flow rate and direction ofmedium with low scattering coefficient via linear polarization measure-ment,” Opt. Lasers Eng. 51(2), 91–95 (2013).
29. D. Fixler et al., “Depolarization of light in biological tissues,”Opt. Lasers Eng. 50(6), 850–854 (2012).
30. A. K. Jayanthy, N. Sujatha, and M. Ramasubba Reddy, “Non-invasiveassessment of static scatterer concentration in phantom body fluidsusing laser speckle contrast analysis technique,” Opt. Lasers Eng.49(4), 553–556 (2011).
31. J. Churnside and H. Yura, “Velocity measurement using laser specklestatistics,” Appl. Opt. 20(2), 3539–3541 (1981).
32. N. Takai, T. Iwai, and T. Asakura, “Real-time velocity measurement fora diffuse object using zero-crossings of laser speckle,” J. Opt. Soc. Am.70(4), 450–455 (1980).
33. A. Ohtsubo and J. A. Asakura, “Velocity measurement of a diffuseobject by using time-varying speckles,” J. Opt. Quant. Electron.8(6), 523–529 (1976).
34. A. Oulamara, G. Tribillon, and J. Duvernoy, “Biological activity meas-urement on botanical specimen surfaces using a temporal decorrelationeffect of laser speckle,” J. Modern Opt. 36(2), 165–179 (1989).
35. S. Guyot, M. C. Péron, and E. Deléchelle, “Spatial speckle charac-terization by Brownian motion analysis,” Phys. Rev. E 70(4),046618 (2004).
36. O. Carvalho et al., “Statistical speckle study to characterize scatteringmedia: use of two complementary approaches,” Opt. Express 15(21),13817–13831 (2007).
37. O. Carvalho, M. Benderitter, and L. Roy, “Noninvasive radiation burndiagnosis using speckle phenomenon with a fractal approach to process-ing,” J. Biomed. Opt. 15(2), 027013–027013 (2010).
38. A. H. Heurtier et al., “Laser speckle contrast imaging: multifractalanalysis of data recorded in healthy subjects,” Med. Phys. 39(10),5847–5849 (2012).
39. N. Sujatha and L. Cerine, “Laser based signal and image fractal analysisfor assessment of blood flow,” Proc. SPIE 8427, 84272M (2012).
40. B. C. Wilson and S. L. Jacques, “Optical reflectance and transmittanceof tissues: principles and applications,” IEEE J. Quantum Electron.26(12), 2186–2199 (1990).
41. C. Simpson et al., “Near-infrared optical properties of ex vivo humanskin and subcutaneous tissues measured using the Monte Carlo inver-sion technique,” Phys. Med. Biol. 43(9), 2465–2478 (1998).
42. R. Graaff et al., “Optical properties of human dermis in vitro and invivo,” Appl. Opt. 32(4), 435–447 (1993).
43. V. V. Tuchin, Tissue Optics: Light Scattering Methods and Instrumentsfor Medical Diagnosis, SPIE Press, Bellingham, WA (2007).
44. J. J. Collins and C. J. De Luca, “Open-loop and closed-loop controlof posture: a random-walk analysis of center-of-pressure trajectories,”Exp. Brain Res. 95(2), 308–318 (1993).
45. A. Eke et al., “Physiological time series: distinguishing fractal noisesfrom motions,” Eur. J. Physiol. 439(4), 403–415 (2000).
46. M. Stücker et al., “Capillary blood cell velocity in human skincapillaries located perpendicularly to the skin surface: measured bya new laser Doppler anemometer,” Microvasc. Res. 52(2), 188–192(1996).
47. E. C. Eckstein, “Fractal Brownian motion and particle motions in bloodflow,” in Annual Int. Conf. IEEE Engineering in Medicine and BiologySociety, Vol. 13, pp. 2240–2241, IEEE (1991).
48. A. B. Parthasarathy et al., “Laser speckle contrast imaging of flow ina microfluidic device,” Proc. SPIE 6446, 644604 (2007).
Journal of Biomedical Optics 111419-7 November 2013 • Vol. 18(11)
Lal, Banerjee, and Sujatha: Role of contrast and fractality of laser speckle image in assessing flow velocity. . .
Downloaded From: https://www.spiedigitallibrary.org/journals/Journal-of-Biomedical-Optics on 05 May 2020Terms of Use: https://www.spiedigitallibrary.org/terms-of-use