ROLE OF FINANCIAL INSTITUTIONS IN FINANCING SMALL AND MEDIUM ENTREPRISES: A STUDY IN GARO HILLS OF MEGHALAYA J. U. Ahmed*, Md. Abdul Rashid** Abstract With the development of alternative sources of funds, the dependence of industry on commercial banks for meeting their credit supplies has been declined although the share of credit to industry in India has significantly increased over the years. The commercial banks have of late emerged as the major supplier of industrial credit for small and Medium Entreprises (SME). There have been several confusing features of credit flow to SME sector in recent years. Hence, an experiential study on efficacy of financial institution in financing small sector is relevant exercise. The present paper, therefore, is an attempt to examine the role of financial institutions in financing SME sector in Garo Hills of Meghalaya. Keyword: Financial Institutions, Small and Medium Entreprises, Garo Hills. The financial institutions play a very significant role in the economic development of any country. The commercial banks emerged as the purveyor of credit requirement of the small borrowers and played a positive role in institutionalizing the community savings. An excessive focus has been laid on quantitative achievement and social obligations. Apart from this, the reason of expansion of bank branches may be attributed to develop a strong banking base to serve the economy efficiently and meet the banking needs of various segments of the economy by developing specialized banks. However, with the development of alternative sources of funds, the dependence of industry on commercial banks for meeting their credit requirements has been declined although the share of credit to industry in India was significantly highest among all countries (Ahmed, 2010). The corporate sector of India is heavily dependent on the banking sector in comparison with other countries (Chavan and Lamba, 2007). The commercial banks have of late emerged as the major supplier of industrial credit for SME in the national and state levels as well as in the districts under study. A large variety of financial institutions including banks have emerged basically after independence to satisfy the financial requirements of both small and large scale industries at national, regional and state levels. There have been several confusing features of credit flow to the small sector in recent years. The overall availability of credit to micro and small enterprises (MSEs) as percentage of net bank credit (NBC) of the scheduled commercial banks (SCBs) has declined from 13.9 per cent in March, 1997 to 6.2 per cent in March, 2006 and thereafter it experienced a swelling trend and reached to 10 per cent of bank credit in March, 2009 (RBI, 2010). In the light of the above, an attempt has been made in the present paper to analyze the bank financing of SME sector in Garo Hills of Meghalaya. THE BACKGROUND The economic history of the developed nations shows that economic growth and growth of financial infrastructure moves together. The role of banks is a very crucial in the industrial development of any country or region. A sound and progressive banking system is prerequisite for industrial development. The loan/credit is the pillar to industrial development in any region. In India, commercial banks are granting short term and medium term loans to industries. Banks are the major apparatus of rapid industrializations of an economy. The commercial banks are a major source of financing SMEs. The industrial houses require credit for short period for working capital and for long periods for their fixed capital requirements. The commercial banks continue to be the major institutions meeting over 90 per cent of the institutional credit need of SME sector (SIDBI, 2010). Gomez (2008) observed that the commercial banks have maintained an attitude of superiority as regards the provision of long-term capital to industry. Shekher and Shekhar (2005) opined that even in the case of providing short term finance, banks granted loans only on the security of easily realizable *Professor & Head, Department of Management, North Eastern Hill University, Tura Campus, Tura, Meghalaya, India **Assistant Professor, Department of Commerce, Don Bosco College, Tura, Meghalaya, India
Transcript
Role of financial institutions in financing small and medium entRepRises: a study in gaRo
Hills of megHalayaJ. u. ahmed*, md. abdul Rashid**
Abstract With the development of alternative sources of funds, the dependence of industry on commercial banks for meeting their credit supplies has been declined although the share of credit to industry in India has significantly increased over the years. The commercial banks have of late emerged as the major supplier of industrial credit for small and Medium Entreprises (SME). There have been several confusing features of credit flow to SME sector in recent years. Hence, an experiential study on efficacy of financial institution in financing small sector is relevant exercise. The present paper, therefore, is an attempt to examine the role of financial institutions in financing SME sector in Garo Hills of Meghalaya.
Keyword: Financial Institutions, Small and Medium Entreprises, Garo Hills.
The financial institutions play a very significant role in the economic development of any country. The commercial banks emerged as the purveyor of credit requirement of the small borrowers and played a positive role in institutionalizing the community savings. An excessive focus has been laid on quantitative achievement and social obligations. Apart from this, the reason of expansion of bank branches may be attributed to develop a strong banking base to serve the economy efficiently and meet the banking needs of various segments of the economy by developing specialized banks. However, with the development of alternative sources of funds, the dependence of industry on commercial banks for meeting their credit requirements has been declined although the share of credit to industry in India was significantly highest among all countries (Ahmed, 2010). The corporate sector of India is heavily dependent on the banking sector in comparison with other countries (Chavan and Lamba, 2007).
The commercial banks have of late emerged as the major supplier of industrial credit for SME in the national and state levels as well as in the districts under study. A large variety of financial institutions including banks have emerged basically after independence to satisfy the financial requirements of both small and large scale industries at national, regional and state levels. There have been several confusing features of credit flow to the small sector in recent years. The overall availability of credit to micro and small enterprises (MSEs) as percentage of net bank credit (NBC) of the scheduled commercial banks (SCBs) has declined from 13.9 per cent
in March, 1997 to 6.2 per cent in March, 2006 and thereafter it experienced a swelling trend and reached to 10 per cent of bank credit in March, 2009 (RBI, 2010). In the light of the above, an attempt has been made in the present paper to analyze the bank financing of SME sector in Garo Hills of Meghalaya.
tHe BackgRound
The economic history of the developed nations shows that economic growth and growth of financial infrastructure moves together. The role of banks is a very crucial in the industrial development of any country or region. A sound and progressive banking system is prerequisite for industrial development. The loan/credit is the pillar to industrial development in any region. In India, commercial banks are granting short term and medium term loans to industries. Banks are the major apparatus of rapid industrializations of an economy. The commercial banks are a major source of financing SMEs. The industrial houses require credit for short period for working capital and for long periods for their fixed capital requirements. The commercial banks continue to be the major institutions meeting over 90 per cent of the institutional credit need of SME sector (SIDBI, 2010). Gomez (2008) observed that the commercial banks have maintained an attitude of superiority as regards the provision of long-term capital to industry. Shekher and Shekhar (2005) opined that even in the case of providing short term finance, banks granted loans only on the security of easily realizable
*Professor & Head, Department of Management, North Eastern Hill University, Tura Campus, Tura, Meghalaya, India**Assistant Professor, Department of Commerce, Don Bosco College, Tura, Meghalaya, India
8 Journal of Commerce & Accounting Research Volume 1 Issue 4 October 2012
assets and not on fixed assets and they insist a large margin even in the case of easily realizable assets, thereby making the system expensive. Further, most of the banks do not maintain adequate technical staff required for the proper valuation of assets and naturally, to be on the safer side, they undervalue the assets. The report of the Task Force chaired by (1974) stated that about 80 per cent of the commercial banks credit are available to the small industries is in the form of working capital and the balance is as term loans. The study group (1969) headed by Prof. D.R Gadgil recommended for the adoption of an “area approach” for development of credit and banking in the country on the basis of local conditions. All India Rural Credit Review Committee in 1969 endorsed the view that commercial banks should come forward to finance activities in rural areas. The lead bank scheme (LBS) underwent significant transformation in 1989 when “service area approach” was merged into the scheme. The service area restrictive provisions were removed in 2004, except for the government sponsored programme. As in March, 2009, there were 26 numbers of banks mostly in the public sector, which have been assigned lead responsibility in 622 districts of the country (RBI, 2009).
The State Bank of India (SBI) is to act as consortium leader of the districts under study. The lead bank prepares the District Credit Plan (DCP) and Annual Action Plan (AAP) with the help of bank officials, developmental agencies -DICs etc. The LBS was evolved as a framework to be more responsive to the need of rural and semi-urban economy. The objectives of the scheme cannot be achieved unless rural lending is properly tied to well design programmes of development. This requires an effective co-ordinations and co-operations not only between lead banks and other banks but also between banks in one side and the concerned government machineries and other development agencies on the other side.
The Garo hills DisTricTs
Garo Hills is the westernmost part of Meghalaya and south western corner of Assam state located between latitude 2509/ and 2601/ North and longitude 89049/ and 9102/ East covers an area of 8167 sq. km comprising 16 towns and 19
Community Rural Development Blocks in 6 sub-divisions of three districts (East Garo Hills, West Garo Hills, South Garo Hills) of Meghalaya state (GoM: 2006). The districts presents an attractive topography with a vast forested area grown from the foot hills and containing rich biological resources (Gassah, 1984).
The districts of Garo Hills are identified as one of the industrially backward districts. As per official records of the districts, total number of registered small enterprises 1388 in 2007-08 (GoM, 2008-09). The District Industries Centers (DICs) are imparting training to the rural artisans in trade, leatherwork, knitting, weaving, tailoring, bamboo work, carpentry etc. There is only one Industrial Training Institute (ITI) at Tura of West Garo Hills district catering specialized training to the entrepreneurs of the districts under study. Regional Vocational Training Institute (RVTI) at Tura is also offered the courses to the women in tailoring, computer training, beautician etc.
The adequacy of finance is essential for development of a dynamic industrial sector. The rate of growth of flow of institutional finance in the districts has not shown significant rise. For accelerating the pace of industrialization the Meghalaya Industrial Development Corporation (MIDC) which was incorporated in 1971 extended a branch office at Tura of West Garo Hills Districts in 2nd October, 1980 which is catering the requirements of the study area. The districts of Garo Hills have 25 per cent of bank offices of state Meghalaya (SLBC, 2010). At present, there are 48 number of branches of commercial banks, 2 number of branches of Meghalaya Rural Bank and 16 number of branches of Meghalaya Co-operative Apex Bank are operating in the districts. The following table 1 shows the banking network of the area under study.
It may be observed that the existing bank branches are inadequate to serve the population in the districts under study. Therefore, major areas are still remaining un-served by the banks and the rural masses are yet to access the banking services.
The area under study is economically backward and that could be observed from the presence of few numbers of
Table 1: Banking Network In Garo Hills Districts as on December, 2010
Types of Bank Number of Bank BranchesEast Garo Hills West Garo Hills South Garo Hills Total
Role of Financial Institutions in Financing Small and Medium Entreprises... 9
registered industries, untapped and under-utilization of resources, geographical isolation, poor communication network etc. In order to improve the economic condition of the people, attention for the development of industries particularly MSEs with appropriate developmental strategy may have to be taken.
objecTives of The sTuDy
The proposed study sets the following objectives- 1. To study the pattern of institutional financing of SMEs
over the years. 2. To study the interrelationship between institutional
finance and performance of small and medium enterprises.
hypoTheses frameD
The following hypotheses have been framed to meet the objectives of the proposed study- 1. Consequent upon change in structure of industrial
finance, the financial intermediaries have enlarged their assistance.
2. There exists a close relationship between institutional finance and performance of SMEs in the area under study.
banks performance in The DisTricTs
network of banks and financial institutions in Garo hills:
The institutional finance plays a decisive role in industrial financing of any country. So, a well developed banking and financial institutions are sin qua non for industrial development. There is a dearth of banks and financial institutions in Garo Hills. There is no branch of development financial institutions in Garo Hills except a branch of MIDC.
But SIDBI branch in Shillong and NEDFi in Guwahati expected to look after the financial requirements of industrial houses of Garo Hills. The MIDC, the only institution is processing, sanctioning and disbursing loan etc from its head office in Shillong through the branch office at Tura. A detail discussion of MIDC has been done in the later pages of this paper.
Apart from these, the commercial banks like State Bank of India (Lead bank in entire Garo Hills), United Bank of India (UBI) and Central Bank of India (CBI) are the nationalized banks; ICICI bank, AXIS bank and HDFC bank are the newly opened private sector banks; the only Regional Rural Banks - the Meghalaya Rural Bank (MRB); the only State Co-operative Bank - Meghalaya Co-operative Apex Bank (MCAB) operating in Garo Hills. The following table-2 shows the picture of banking network in the three districts of Garo Hills.
The rural areas of the districts are holding the lion’s share of bank branches as on March, 2010. The numbers of urban branches are only 6 out of 66. The west Garo hills districts are ventured with maximum number of bank branches, the figure being 40 in number. Out of the total bank branches, the commercial banks hold the majority share i.e., 48 number of branches. It is clear from the above that the three districts of Garo hills are under banked and there is a dearth of financial institutions in the districts under study.
expansion of bank branches
There has been a rapid expansion of bank branches in the country since the introduction of LBS, especially in the rural and backward areas. At the national level, the number of bank branches of all scheduled commercial banks grew from 65,543 on March, 1997 to 92,534 at the end of March, 2009 and to 98,694 at the end of March, 2010. In Meghalaya, total number of bank branches was 180 in March, 1997; the figure increased to 213 in March, 2012 showing an increase of 33 bank branches within 14 years. While assessing branch expansion in Garo Hills, it is observed that only 7 scheduled commercial banks with 48 numbers of branches
Table 2: Networks of Banks and Financial Institutions in Garo Hills
East Garo Hills 16 2 2 20 15 1 4 20West Garo Hills 26 11 3 40 29 1 10 40South Garo Hills 5 0 1 6 4 0 2 6Total of Garo Hills 47 13 6 66 48 2 16 66Meghalaya 142 45 71 258 158 56 44 258
Source: SLBC, Meghalaya
10 Journal of Commerce & Accounting Research Volume 1 Issue 4 October 2012
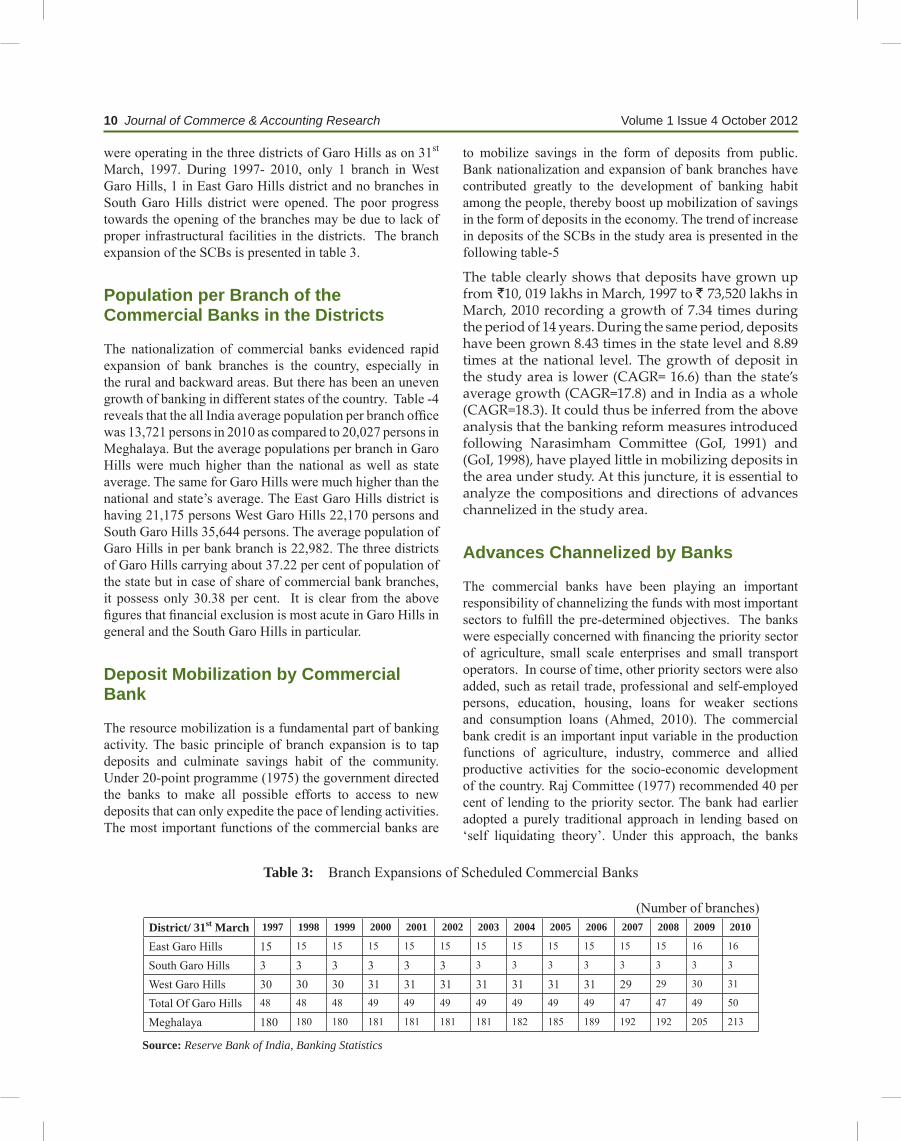
were operating in the three districts of Garo Hills as on 31st March, 1997. During 1997- 2010, only 1 branch in West Garo Hills, 1 in East Garo Hills district and no branches in South Garo Hills district were opened. The poor progress towards the opening of the branches may be due to lack of proper infrastructural facilities in the districts. The branch expansion of the SCBs is presented in table 3.
population per Branch of the commercial Banks in the districts
The nationalization of commercial banks evidenced rapid expansion of bank branches is the country, especially in the rural and backward areas. But there has been an uneven growth of banking in different states of the country. Table -4 reveals that the all India average population per branch office was 13,721 persons in 2010 as compared to 20,027 persons in Meghalaya. But the average populations per branch in Garo Hills were much higher than the national as well as state average. The same for Garo Hills were much higher than the national and state’s average. The East Garo Hills district is having 21,175 persons West Garo Hills 22,170 persons and South Garo Hills 35,644 persons. The average population of Garo Hills in per bank branch is 22,982. The three districts of Garo Hills carrying about 37.22 per cent of population of the state but in case of share of commercial bank branches, it possess only 30.38 per cent. It is clear from the above figures that financial exclusion is most acute in Garo Hills in general and the South Garo Hills in particular.
deposit mobilization by commercial Bank
The resource mobilization is a fundamental part of banking activity. The basic principle of branch expansion is to tap deposits and culminate savings habit of the community. Under 20-point programme (1975) the government directed the banks to make all possible efforts to access to new deposits that can only expedite the pace of lending activities. The most important functions of the commercial banks are
to mobilize savings in the form of deposits from public. Bank nationalization and expansion of bank branches have contributed greatly to the development of banking habit among the people, thereby boost up mobilization of savings in the form of deposits in the economy. The trend of increase in deposits of the SCBs in the study area is presented in the following table-5
The table clearly shows that deposits have grown up from `10, 019 lakhs in March, 1997 to ` 73,520 lakhs in March, 2010 recording a growth of 7.34 times during the period of 14 years. During the same period, deposits have been grown 8.43 times in the state level and 8.89 times at the national level. The growth of deposit in the study area is lower (CAGR= 16.6) than the state’s average growth (CAGR=17.8) and in India as a whole (CAGR=18.3). It could thus be inferred from the above analysis that the banking reform measures introduced following Narasimham Committee (GoI, 1991) and (GoI, 1998), have played little in mobilizing deposits in the area under study. At this juncture, it is essential to analyze the compositions and directions of advances channelized in the study area.
advances channelized by Banks
The commercial banks have been playing an important responsibility of channelizing the funds with most important sectors to fulfill the pre-determined objectives. The banks were especially concerned with financing the priority sector of agriculture, small scale enterprises and small transport operators. In course of time, other priority sectors were also added, such as retail trade, professional and self-employed persons, education, housing, loans for weaker sections and consumption loans (Ahmed, 2010). The commercial bank credit is an important input variable in the production functions of agriculture, industry, commerce and allied productive activities for the socio-economic development of the country. Raj Committee (1977) recommended 40 per cent of lending to the priority sector. The bank had earlier adopted a purely traditional approach in lending based on ‘self liquidating theory’. Under this approach, the banks
Table 3: Branch Expansions of Scheduled Commercial Banks
(Number of branches)District/ 31st March 1997 1998 1999 2000 2001 2002 2003 2004 2005 2006 2007 2008 2009 2010
East Garo Hills 15 15 15 15 15 15 15 15 15 15 15 15 16 16
South Garo Hills 3 3 3 3 3 3 3 3 3 3 3 3 3 3
West Garo Hills 30 30 30 31 31 31 31 31 31 31 29 29 30 31
Total Of Garo Hills 48 48 48 49 49 49 49 49 49 49 47 47 49 50
Role of Financial Institutions in Financing Small and Medium Entreprises... 11
Table 4: Average Populations per Branch of Commercial Banks
as on 31st March, 2010 (Population in Persons)District Population as per 2011 census Number SCBs Branches Average Population per Branch
East Garo Hills 3,17,618 15 21,175West Garo Hills 6,42,923 29 22,170South Garo Hills 1,42,574 4 35,644Total of Garo Hills 11,03,115 48 22,982Meghalaya 29,64,007 158 20,027India 121,01,93,422 88,203 13,721
Source: Statistical Tables Relating to Banks in India, RBI.
Table 5: Deposit Mobilizations by Bank in Garo Hills Districts
YearEnd March
Garo Hills (Amount ` lakhs)
Meghalaya (Amount ` lakhs)
India (Amount ` crores)
1997 10019 90680 5055991998 10732
(7.12)10399914.69)
605410(19.74)
1999 12632(17.70)
114758(10.35)
722203(19.29)
2000 14668(16.12)
140283(22.24)
851593(17.92)
2001 17332(18.16)
164624(17.35)
989141(16.15)
2002 20204(16.57)
195233(18.59)
1131187(14.36)
2003 21718(7.49)
214320(9.78)
1311761(15.96)
2004 23923(10.15)
275800(28.69)
1542284(17.57)
2005 29718(24.22)
306465(11.12)
1732858(12.36)
2006 33730(13.50)
324621((5.92)
2109049(21.71)
2007 41263(22.33)
389446(19.97)
2611933(23.84)
2008 43059(4.35)
451162(15.85)
3196939(22.40)
2009 59969(39.27)
620465(37.52)
3834110(19.93)
2010 73520(22.60)
764267(23.18)
4492826(17.18)
CAGR 16.57% 17.82% 18.3%
(Figures in parenthesis indicate percent change over previous year)
Source: Basic Statistical Return of SCBs, RBI
12 Journal of Commerce & Accounting Research Volume 1 Issue 4 October 2012
followed the ‘commercial loan theory’ i.e., the banks granted loans only against negotiable and tangible securities offered as well as on the basis of business reputation of borrowers. (Mithani, 1999) After nationalization, banks have attempted to steer the direction of change and strive towards achieving fundamental objectives of mitigation of regional disparities, dispersal of industries and reduction of concentration of economic wealth (Raul, 1997). As a result, implicit weightage was given to the socially desirable sectors in the credit policy with sizable increase in the sector wise advances. In order to review the efficacy of existing framework of money lending, a technical group, was constituted under the chairmanship of S.C. Gupta, who submitted its report on July, 2007 and recommended alternative avenues of credit dispensation such as micro finance institutions (RBI, 2007). During the past four decades, some noticeable positive changes have been taking place in the credit advances by the SCBs. Table-6 presents the bank advances channeled in the area under study.
The total advances (bank credit) by all SCBs in Garo Hills stood at ` 2,502 lakhs as on 31st March, 1997, increased to ` 2,93,27 lakhs as on March 31, 2010 which shows 11.72 times increase in advances over the period. The rate of growth of advances is higher in Meghalaya (CAGR=22.68) than that of the study area (CAGR=20.85). The scenario of advances growth is better than the deposit growth in the study area. This may be due to the reduction of priority sector lending norms from 40 per cent to 10 per cent on the basis of recommendation of the committee on financial system (GOI,
1991) as the repayment in non-priority sector is better than priority sector.
In order to assess the extent of credit channelization by the banks in the districts under study, we have calculated the correlation coefficients among the bank advances during 1997-2010.
Matrix of Correlation Coefficient of Bank Advances
Garo Hills Meghalaya IndiaGaro Hills 1Meghalaya 0.963
(12.378)**1
India 0.969(13.587)**
0.929(9.0702)**
1
Source: Self-calculated by the present researcher on the basis of table-6.6
t 0.05( 12 df ) =2.179, t 0.01( 12 df ) =3.055
** indicates significant both at 0.05 and 0.01 level of significance.
The analysis manifests that correlation coefficients (r ) in respect of advances of the districts under study in the context of national scenario is positive. The r values are however, statistically significant at 1 per cent and 5 per cent level of significance at their respective degree of freedom. This implies that the districts under study are maintaining the national tempo of credit channelization. In other words, banks are deploying credit for the economic growth of the area from which they have mobilized funds.
credit plans (district credit plan and annual action plan)
District Credit Plans (DCP) are prepared under lead bank scheme to increase production, productivity and job opportunity in different sectors of the economy especially in rural and semi-urban areas of the country, thereby removing the regional disparities in the country. DCPs are simply aggregation of the Block Credit Plans operating in the concerned district. To make credit plan successful, block, district, state, regional and national level forums are created. Annual Credit Plan (ACP)/Annual Action Plan (AAP) is prepared annually during the month of December (1st December and 31st December) and come into force by 1st April of next year. The following paragraphs highlighted the performance of DCP and ACP of three districts of Garo Hills.
Break up of Credit under ACP
The diversification of a large fraction of bank credit from the traditional sector to the priority sector is a remarkable
Role of Financial Institutions in Financing Small and Medium Entreprises... 13
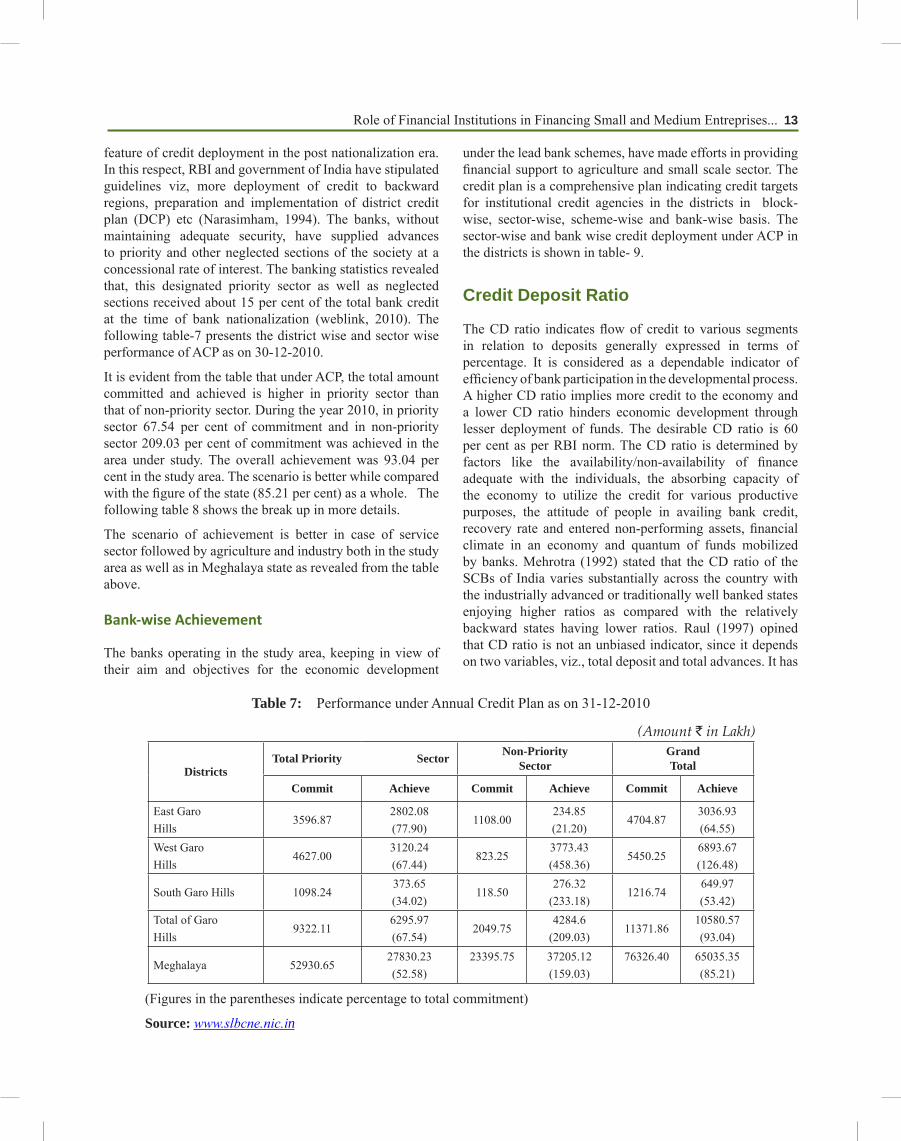
feature of credit deployment in the post nationalization era. In this respect, RBI and government of India have stipulated guidelines viz, more deployment of credit to backward regions, preparation and implementation of district credit plan (DCP) etc (Narasimham, 1994). The banks, without maintaining adequate security, have supplied advances to priority and other neglected sections of the society at a concessional rate of interest. The banking statistics revealed that, this designated priority sector as well as neglected sections received about 15 per cent of the total bank credit at the time of bank nationalization (weblink, 2010). The following table-7 presents the district wise and sector wise performance of ACP as on 30-12-2010.
It is evident from the table that under ACP, the total amount committed and achieved is higher in priority sector than that of non-priority sector. During the year 2010, in priority sector 67.54 per cent of commitment and in non-priority sector 209.03 per cent of commitment was achieved in the area under study. The overall achievement was 93.04 per cent in the study area. The scenario is better while compared with the figure of the state (85.21 per cent) as a whole. The following table 8 shows the break up in more details.
The scenario of achievement is better in case of service sector followed by agriculture and industry both in the study area as well as in Meghalaya state as revealed from the table above.
Bank-wise Achievement
The banks operating in the study area, keeping in view of their aim and objectives for the economic development
under the lead bank schemes, have made efforts in providing financial support to agriculture and small scale sector. The credit plan is a comprehensive plan indicating credit targets for institutional credit agencies in the districts in block-wise, sector-wise, scheme-wise and bank-wise basis. The sector-wise and bank wise credit deployment under ACP in the districts is shown in table- 9.
credit deposit Ratio
The CD ratio indicates flow of credit to various segments in relation to deposits generally expressed in terms of percentage. It is considered as a dependable indicator of efficiency of bank participation in the developmental process. A higher CD ratio implies more credit to the economy and a lower CD ratio hinders economic development through lesser deployment of funds. The desirable CD ratio is 60 per cent as per RBI norm. The CD ratio is determined by factors like the availability/non-availability of finance adequate with the individuals, the absorbing capacity of the economy to utilize the credit for various productive purposes, the attitude of people in availing bank credit, recovery rate and entered non-performing assets, financial climate in an economy and quantum of funds mobilized by banks. Mehrotra (1992) stated that the CD ratio of the SCBs of India varies substantially across the country with the industrially advanced or traditionally well banked states enjoying higher ratios as compared with the relatively backward states having lower ratios. Raul (1997) opined that CD ratio is not an unbiased indicator, since it depends on two variables, viz., total deposit and total advances. It has
Table 7: Performance under Annual Credit Plan as on 31-12-2010
(Amount ` in Lakh)
DistrictsTotal Priority Sector Non-Priority
SectorGrandTotal
Commit Achieve Commit Achieve Commit Achieve
East Garo Hills
3596.872802.08(77.90)
1108.00234.85(21.20)
4704.873036.93(64.55)
West GaroHills
4627.003120.24(67.44)
823.253773.43(458.36)
5450.256893.67(126.48)
South Garo Hills 1098.24373.65(34.02)
118.50276.32
(233.18)1216.74
649.97(53.42)
Total of GaroHills
9322.116295.97(67.54)
2049.754284.6
(209.03)11371.86
10580.57(93.04)
Meghalaya 52930.6527830.23(52.58)
23395.75 37205.12(159.03)
76326.40 65035.35(85.21)
(Figures in the parentheses indicate percentage to total commitment)
Source: www.slbcne.nic.in
14 Journal of Commerce & Accounting Research Volume 1 Issue 4 October 2012
Table 8: Sector Wise Break up Under Annual Credit Plan as on 31-12-2010
(Amount ` in Lakhs)
DistrictsAgriculture Industries Service Grand Total
Commit Achieve Commit Achieve Commit Achieve Commit AchieveEast Garo Hills
1718.01 356.23(20.74)
332.70 47.94(14.41)
1546.16 2397.91(155.09)
4704.87 3036.93(64.55)
West GaroHills
1903.50 1265.27(66.47)
701.00 183.02(26.11)
2022.50 1671.95(82.67)
5450.25 6893.67(126.48)
South GaroHills
426.48 134.46(31.53)
308.89 35.22(11.40)
362.87 203.97(56.21)
1216.74 649.97(53.42)
Total GaroHills
4047.99 1755.96(43.38)
1342.59 266.18(19.83)
3931.53 4273.83(108.71)
11371.86 10580.57(93.04)
Meghalaya 15114.15 5758.40(38.10)
12505.47 2875.59(22.99)
25311.03 19196.24(75.84)
76326.40 65035.35(85.21)
(Figures in the parentheses indicate percentage to total commitment)
Source: www.slbcne.nic.in
Table 9: Bank-wise Performance under ACP as on 31st December, 2010
A. East Garo Hills (Amount ` in Lakhs)Agriculture Industries Service Total Priority sector Non-
Role of Financial Institutions in Financing Small and Medium Entreprises... 15
been observed that the banks may have to grant advances to the beneficiaries through several government sponsored schemes. The table- 10 delineates the CD ratios in the area under study.
Table 10: CD Ratio in Garo Hills Vis-à-vis in Meghalaya
It is observed that the CD ratio of all SCBs in India by the end of March, 2010 was 72.2 per cent, which was 55.1 per cent in March, 1997. In Meghalaya, CD ratio was 15.15 per cent in the year 1997 which increased to 48.12 per cent in the year 2006. This has further declined to 25.62 per cent in the year 2010. The CD ratio for Garo Hills over the 13 years (1997-2010) is far behind than the national average.
A pictorial presentation of CD ratio of study area vis a vis Meghalaya state and national level is given in Fig.A.
Bank-wise cd ratio
The bank wise CD ratio for each of commercial banks, Meghalaya Rural Bank and Meghalaya Co-operative Apex Bank can be observed from the table -11. The table manifests that Meghalaya Rural Bank and Meghalaya Co-operative Apex Bank in East Garo Hills district and West Garo Hills district, and Meghalaya Co-operative Apex Bank in South Garo Hills district have above the national target (60 per cent) of CD ratio. The CD ratio of the newly opened private sector banks viz. ICICI, AXIS and HDFC is very poor.
sectoRal cRedit deployment of commeRcial Banks
During the past four decades, some noticeable changes have been taken place in the credit portfolio of the scheduled
5 AXIS 51.25 1.63(3.18)
44 ------ 95 13.37(14.07)
190.25 15.00(7.88)
40 -----(00)
6 HDFC ------- ------- ----- 4.31(100.00)
------ ------ ------- 4.31 ------ ------
CB To-tal
1350.50 122391(90.63)
502.00 166.82(33.23)
1548.00 1345.15(86.90)
3400.50 2735.88(80.46)
611.00 3727.53(610.07)
7 MRB 38.00 ------ 24.00 6.61(27.54)
133.00 44.40(33.38)
195.00 51.01(26.16)
30.25 44(146.48)
8 MACB 515.00 41.36(8.03)
175.00 9.59(5.48)
341.50 282.40(82.69)
1031.50 333.35(32.32)
182.00 1.58(0.87)
9 G r a n d Total
1903.50 1265.27(66.47)
701.00 183.02(26.11)
2022.50 1671.95(82.67)
4627.00 3120.24(67.44)
823.25 3773.43(458.36)
C. South Garo Hills
Agriculture Industries Service Total Priority sector Non-Priority sectorSL No Banks Commit Achieve Commit Achieve Commit Achieve Commit Achieve Commit Achieve
1 SBI 246.00 108.24(44.00)
186.50 35.22(18.88)
257.87 133.14(51.63)
690.37 276.60(40.07)
88.00 276.32(314.00)
2 MCAB 180.48 26.22(14.53)
122.39 -------(0.00)
105.00 70.83(67.46)
407.87 97.05(23.79)
30.50 ------(0.00)
3 G r a n d Total
426.48 134.46(31.53)
308.89 35.22(11.40)
362.87 203.97(56.21)
1098.24 373.65(34.02)
118.50 276.32(233.18)
Source: www.slbcne.nic.in
16 Journal of Commerce & Accounting Research Volume 1 Issue 4 October 2012
commercial banks. To improve the productive use of bank credit the RBI from time to time adopted various measures
including augmentation of credit fl ow to priority sector, simplifi cation of systems and procedures of bank credit,
Figure A: CD Rati o of Garo Hills, Meghalaya and India
Table 11: Bank wise CD Ratio of Garo Hills (As on 31.3.10)
(Amount ` in Lakhs and ratios in percentage)
Districts Name of banks Deposit Advance C/D RatioWest Garo Hills SBI 46260.00 18679.00 40.38
18 Journal of Commerce & Accounting Research Volume 1 Issue 4 October 2012
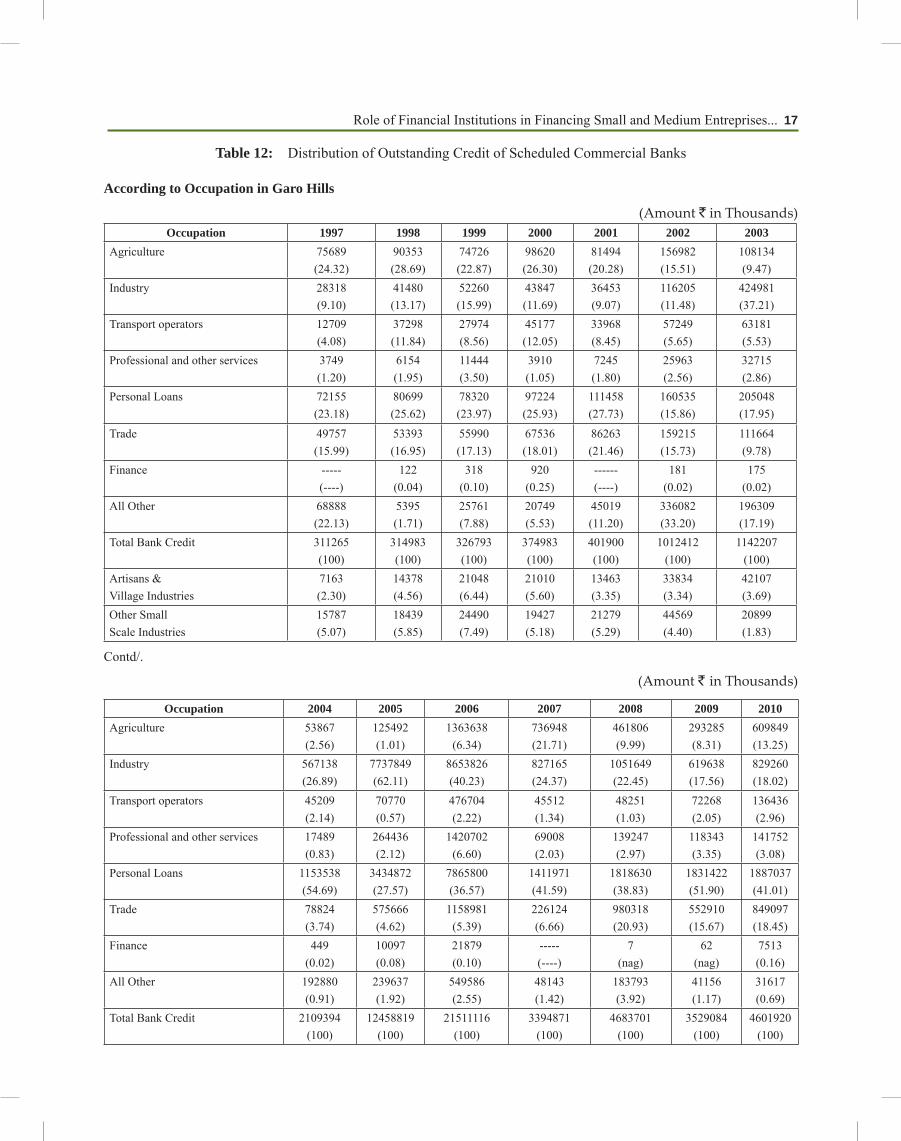
permitting use of banking correspondents etc. The sectoral flow of advances out of the net bank credit in Garo Hills from 1997 to 2010 is given in table 12.
The flow had been increasing steadily in absolute term (except in 2004-2005 and 2005-2006). The total credit deployment of SCBs in Garo Hills has increased from ` 3,11,265 thousand in 31st March, 1997 to ` 46,01,920 thousand in 31st March,
2010 which shows 14.78 fold increase in outstanding credit during 13 years. The credit flow towards agriculture sector was very much volatile. During 1997 to 2001, share of agriculture sector was high, the percentage flow was in the range of 20.28 per cent to 28.69 per cent. Since 2002, the decline had started and had come down and reached to a low level of 2.56 per cent in 2004 and further deteriorated to 1.01
Artisans &Village Industries
50373(2.39)
464427(3.73)
308705(1.44)
94421(2.78)
NA NA NA
Other SmallScale Industries
3316(0.16)
301211(2.42)
1012014(4.70)
123365(3.63)
NA NA NA
(Figures in parenthesis indicate percent to total bank credit)
Source: Basic Statistical Return of SCBs, RBI
Table 13: Bank Financing to Industries in Garo Hills Vis-à-vis in India
Year31st March
Garo Hills ( ` in thousands) All India ( ` in lakhs) Total Bank
creditCredit to Industries
Credit to SSIs
Artisans &Village Industries
Total Bank Credit
Credit to Industries
Credit to SSIs
Artisans & Village Industries
1997 311265(100)
28318(9.10)
15787(5.07)
7163(2.30)
28437330(100)
14031360(49.3)
2679332(9.4)
182465(0.6)
1998 314983(100)
41480(13.17)
18439(5.85)
14378(4.56)
32994444(100)
16109594(48.8)
2862829(8.7)
194214(0.6)
1999 326793(100)
52260(15.99)
24490(7.49)
21048(6.44)
38242503(100)
18794688(49.2)
3142843(8.2)
251874(0.7)
2000 374983(100)
43847(11.69)
24490(7.49)
21010(5.60)
46008068(100)
21377882(46.5)
3506987(7.62)
267688(0.58)
2001 401900(100)
36453(9.07)
21279(5.29)
13463(3.35)
53843379(100)
23643041(43.9)
3690487(6.85)
207205(0.38)
2002 1012412(100)
116205(11.48)
44569(4.40)
33834(3.34)
65599308(100)
27162550(41.4)
3197030(4.87)
560042(0.85)
2003 1142207(100)
424981(37.21)
20899(1.83)
42107(3.69)
75596882(100)
30982757(41.0)
3794034(5.02)
522556(0.69)
2004 2109394(100)
567138(26.89)
3316(0.16)
50373(2.39)
88031203(100)
33480348(38.0)
3843255(4.37)
491212(4.9)
2005 12458819(100)
7737849(62.11)
301211(2.42)
464427(3.73)
115246793(100)
44682498(38.8)
4707642(4.08)
614894(4.6)
2006 21511116(100)
8653826(40.23)
1012014(4.70)
308705(1.44)
151384213(100)
56621595(37.4)
5516398(2.83)
729012(4.1)
2007 3394871(100)
827165(24.37)
123365(3.63)
94421(2.78)
194709962(100)
74189713(38.1)
6831207(3.51)
853120(3.9)
2008 4683701(100)
1051649(22.45)
NA NA 241700652(100)
92853578(38.4)
NA NA
2009 3529084(100)
619638(17.56)
NA NA 284771312(100)
113444298(39.8)
NA NA
2010 4601920(100)
829260(18.02)
NA NA 334516932(100)
135523235(40.51)
NA NA
Source: Basic Statistical Return of SCBs, RBI
Role of Financial Institutions in Financing Small and Medium Entreprises... 19
per cent in 2005. Again in 2006 onwards, flow towards this sector had picked up. In case of industrial sector from 1997 to 2002, the percentage flow was in the range of mere 9.07 per cent to 15.99 percent only. In 2003, the flow has gone up and reached a maximum of 62.11 per cent in 2005. Since 2006, the decline had started and had come to a low level of 17.56 per cent in March, 2009. Personal loans grew faster than any other segment. The percentage of credit to SSI was 5.07 per cent in 1997 and increased to a maximum of 7.49 per cent in 1999. Since 2000, the decline had started and had come to a lower level of 0.16 per cent in March, 2004 and again it increased to 2.42 per cent in 2005, 4.70 per cent in 2006. During 2007 the flow was 3.63 per cent only.
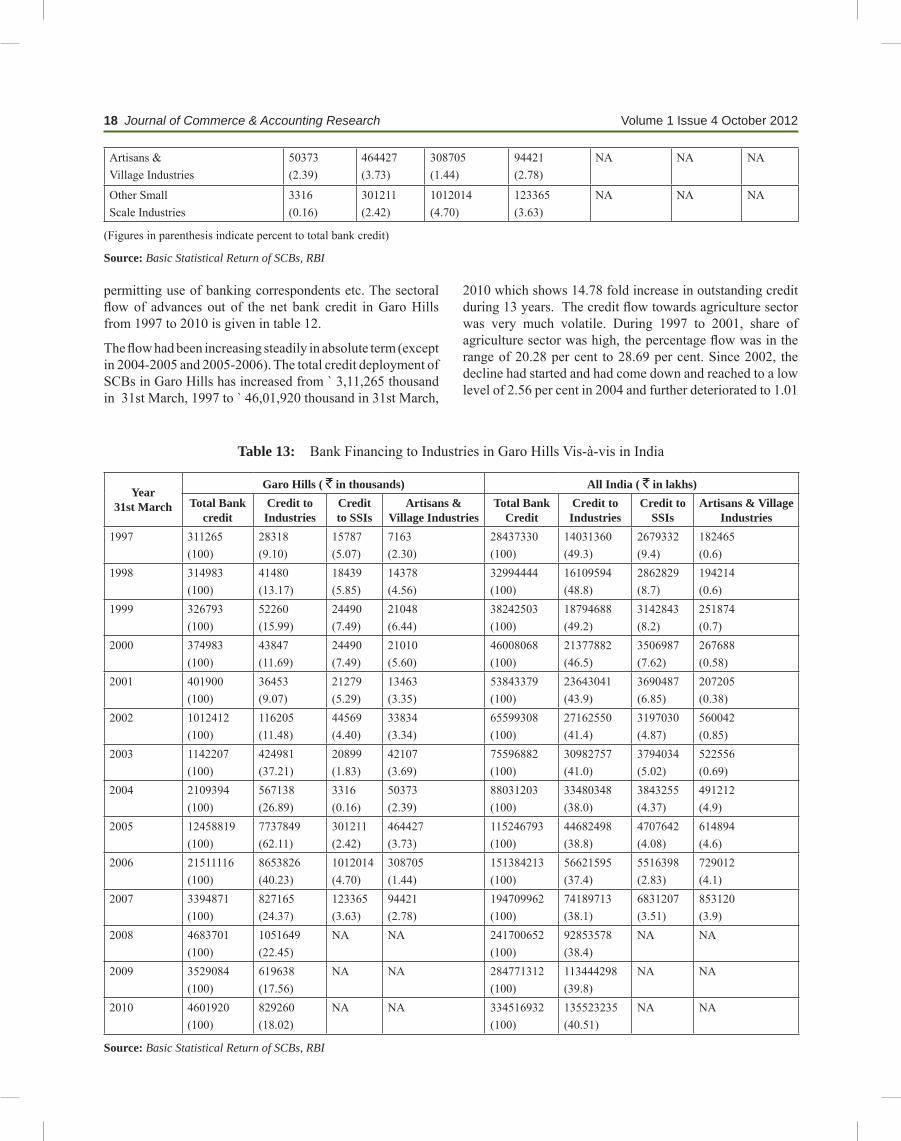
Bank finance to tHe sme units:
The table-13 shows comparative position of total credit, credit to industries, credit to SSIs and credit to artisan and village industries advanced by the SCBs in Garo Hills and India during 1996-97 to 2009-10. It is clear from the table that the share of industrial credit to total bank credit in Garo Hills is far below than all India level. The average share of industrial credit to total credit for Garo Hills is 37.44 per cent as against all India shares of 40.14 per cent. The average share of SSIs credit to total bank credit in Garo Hills is only 2.87 per cent as against all India shares of 4.92 per cent during 1997-2007. The share of cottage and village industries to total bank credit in Garo Hills is 2.47 per cent as against all India share of 0.55 per cent during 1997-2007. Thus, it is clear that the SSI sector of the study area is getting a lesser amount of credit while compared with the all India level.
RelationsHip Between institutional finance and gRowtH of small enteRpRises
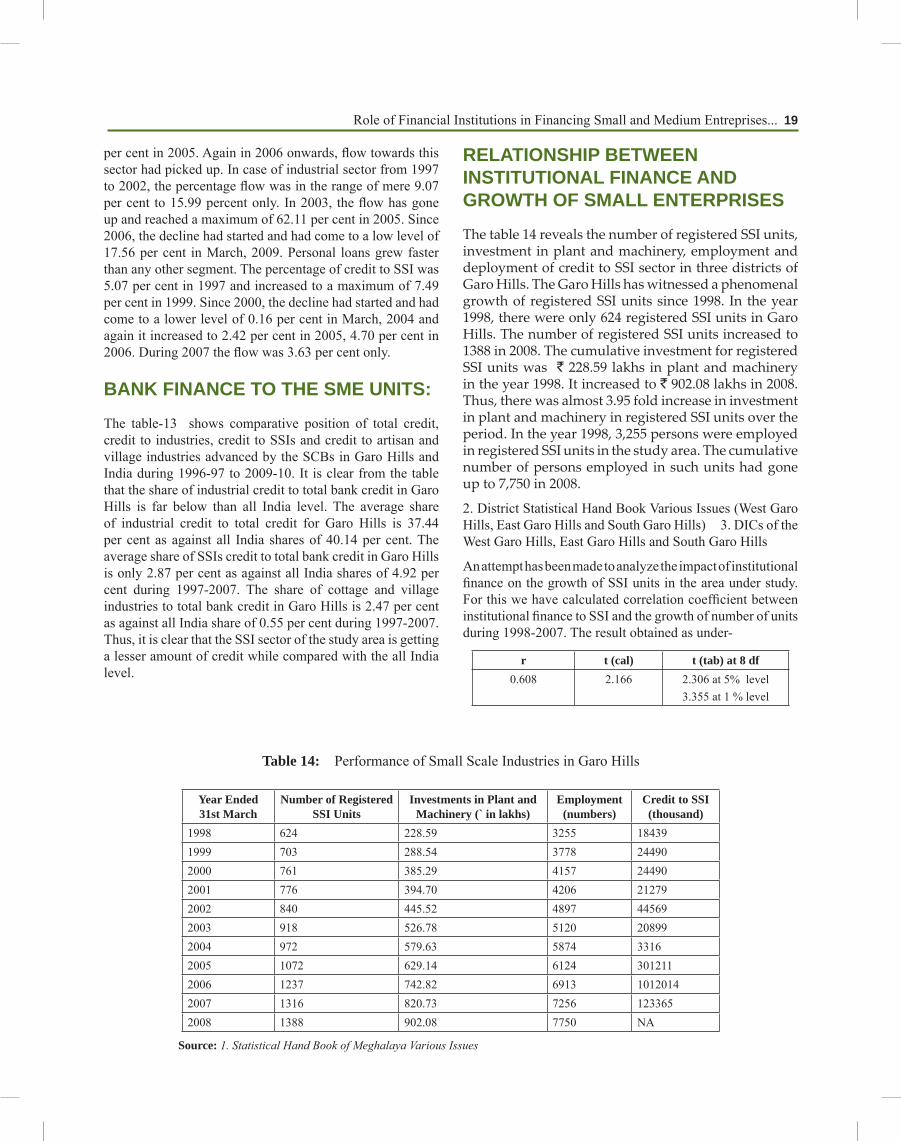
The table 14 reveals the number of registered SSI units, investment in plant and machinery, employment and deployment of credit to SSI sector in three districts of Garo Hills. The Garo Hills has witnessed a phenomenal growth of registered SSI units since 1998. In the year 1998, there were only 624 registered SSI units in Garo Hills. The number of registered SSI units increased to 1388 in 2008. The cumulative investment for registered SSI units was ` 228.59 lakhs in plant and machinery in the year 1998. It increased to ` 902.08 lakhs in 2008. Thus, there was almost 3.95 fold increase in investment in plant and machinery in registered SSI units over the period. In the year 1998, 3,255 persons were employed in registered SSI units in the study area. The cumulative number of persons employed in such units had gone up to 7,750 in 2008.
2. District Statistical Hand Book Various Issues (West Garo Hills, East Garo Hills and South Garo Hills) 3. DICs of the West Garo Hills, East Garo Hills and South Garo Hills
An attempt has been made to analyze the impact of institutional finance on the growth of SSI units in the area under study. For this we have calculated correlation coefficient between institutional finance to SSI and the growth of number of units during 1998-2007. The result obtained as under-
r t (cal) t (tab) at 8 df0.608 2.166 2.306 at 5% level
3.355 at 1 % level
Table 14: Performance of Small Scale Industries in Garo Hills
Source: 1. Statistical Hand Book of Meghalaya Various Issues
20 Journal of Commerce & Accounting Research Volume 1 Issue 4 October 2012
The positive r value (0.608) is statically not significant at both 5 per cent and at 1 per cent levels of significance which indicates that the hypothesis “there exist a close relationship between institutional finance and growth of small enterprises” is not true. The growth of institutional finance does not have much impact on the growth of industries in the study area.
Further, in order to examine whether the growth of investment in plant and machinery of small sector resulted in the growth of institutional finance, we have employed correlation analysis between investment in plant and machinery of the units operating in the study area and credit deployed to SSI sector during 1998-2007. The result of correlation and t value are as follows-
r t (cal) t (tab) at 8 df0.557 1.898 2.306 at 5% level
3.355 at 1 % level
The positive r value (0.557) is not statistically significant at 5 per cent and 1 per cent level of significance. This indicates that with the increase in investment in plant and machinery of SSI sector, the institutional finance to SSI units are not increasing in the study area. Hence, the hypothesis “With the change of investment structure of small sector, financial intermediaries have enlarged their assistance” found to be incorrect.
This has again confirmed with the district-wise analysis of correlations between bank finance available for manufacturing industries and growth of SSI units during 1998-2009. For this purpose, we have used the data presented in table-15
Districts Correlations
t value at 10 df
CalculatedTabulated
1 per cent level
5 per cent level
East Garo Hills 0.038 0.12024 3.169 2.228
West Garo Hills 0.254 0.83045 3.169 2.228
South Garo Hills 0.682 2.94886 3.169 2.228
From the correlations result presented below, it is observed that r values between bank finance and growth of units in both East Garo Hills and West Garo Hills are insignificant but correlation in South Garo Hills is significant at 5 per cent level but not at 1 per cent level. This indicates an inter-district disparity in extending the financial assistance by banks and thereby growth of SME units.
peRfoRmance of megHalaya industRial development coRpoRation (midc):
The MIDC was incorporated under the Companies Act 1956 on 6th April, 1971 to promote and develop industries in the state. The corporation is operating financial assistance schemes under the refinance assistance schemes of SIDBI. The limit of finance assistance provided to entrepreneurs by way of term loan is to the tune of ` 90 lakhs. The corporation can collaborate with other financial institutions for consortium finance to finance a large project.
Table 15: District-wise Data relating to Small Scale Industries
Year 31st March
Bank Finance to Manufacturing and Processing Industries ( ` in thousands)
Number of Small Scale Industries
East Garo Hills West Garo Hills South Garo Hills East Garo Hills West Garo Hills South Garo Hills1998 1,43,56 1,91,19 60,46 260 317 471999 1,40,04 2,90,87 84,77 292 350 612000 1,32,99 2,38,53 59,30 314 375 722001 1,13,13 2,06,91 34,05 320 382 742002 1,13,82 7,56,01 1,36,18 370 391 792003 1,18,98 7,08,25 3,53,73 405 414 992004 51,75,20 3,66,17 90,45 437 428 1072005 2,46,94 271,87,53 79,16 501 456 1152006 3,40,31 520,83,61 2,25,18 617 490 1302007 2,64,46 17,44,47 4,30,39 645 525 1462008 2,45,53 10,63,44 49,28,67 676 549 1632009 2,64,51 12,80,81 24,24,77 683 563 164
Source: Statistical Hand Book, Meghalaya, Various issues and Basic Statistical Returns of Scheduled Commercial Banks, Various issues, RBI
Role of Financial Institutions in Financing Small and Medium Entreprises... 21
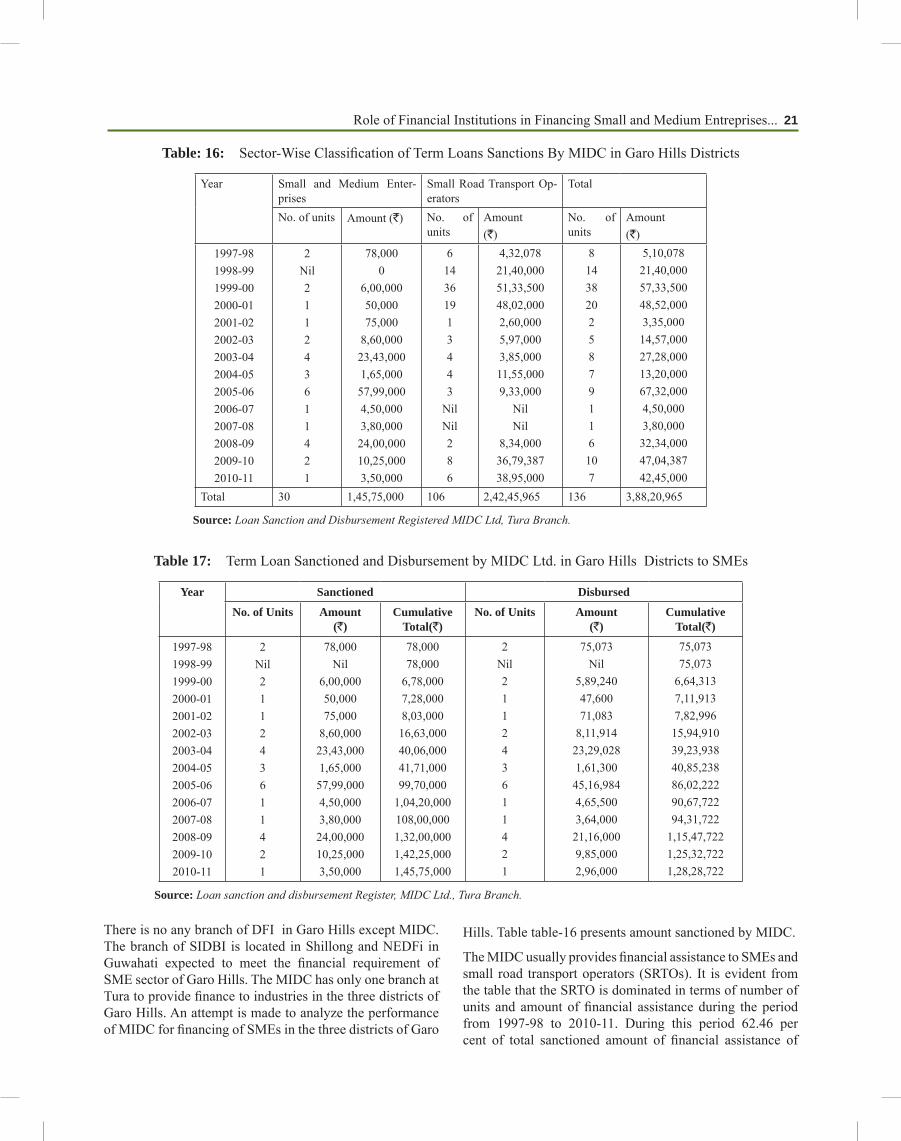
Table: 16: Sector-Wise Classification of Term Loans Sanctions By MIDC in Garo Hills Districts
Source: Loan sanction and disbursement Register, MIDC Ltd., Tura Branch.
There is no any branch of DFI in Garo Hills except MIDC. The branch of SIDBI is located in Shillong and NEDFi in Guwahati expected to meet the financial requirement of SME sector of Garo Hills. The MIDC has only one branch at Tura to provide finance to industries in the three districts of Garo Hills. An attempt is made to analyze the performance of MIDC for financing of SMEs in the three districts of Garo
Hills. Table table-16 presents amount sanctioned by MIDC.
The MIDC usually provides financial assistance to SMEs and small road transport operators (SRTOs). It is evident from the table that the SRTO is dominated in terms of number of units and amount of financial assistance during the period from 1997-98 to 2010-11. During this period 62.46 per cent of total sanctioned amount of financial assistance of
22 Journal of Commerce & Accounting Research Volume 1 Issue 4 October 2012
the MIDC has gone in favour of SRTO and only 37.54 per cent in favour of SMEs. The MIDC sanctioned the highest amount of ` 57, 99,000 for 6 number of SME units in 2005-06 while the SRTO received the highest amount of ` 51, 33,500 in respect of 36 number of units in 1999-00. However, sanctioned to both the sector has witnessed a fluctuating trend. On an average, the MIDC sanctioned about 2 units only per annum in the three districts and average sanctioned in each units during the period was only ` 4,85,833. During the period it advanced term loans only to new projects. No financial assistance has been sanctioned to existing units for rehabilitation, expansion, and/or modernization.
The sanctioned amount of financial assistance to SMEs as ratio of total sanction varies between the lowest 0 per cent in 1998-99 and the highest of 100 per cent in 2006-07 and 2007-08. But in terms of amount and units, SMEs received highest financial assistance of ` 57, 99,000 for 6 number of SMEs units in 2005-06. The overall financial assistance sanctioned by the MIDC in Garo Hills District is not satisfactory at all. The table-17 reveals the total sanction and disbursement of loans made by the MIDC from 1997-98 to 2010-11.
The table shows that the corporation has sanctioned ` 1, 45, 75,000 in aggregate to 30 units, thus giving an average amount of ` 4, 85,833 per unit during the period. The MIDC has assisted more number of units during 2005-06, the average amount sanctioned per unit has ` 9, 66,500 which has been appreciably higher than the overall average of the period. So far as the disbursement of loan is concerned, the aggregate amount stood at ` 1, 28, 28,722 in respect of 30 units giving ` 4, 27,624 per unit during the period.
The correlation coefficient (r) is calculated between loan sanctioned and disbursement. The ‘r’ value found (0.994) positive. The high positive correlation signifies that MIDC has disbursed the sanctioned loan as early as possible. In this context, the hypothesis, “There exist a close association between loan sanctioned and loan disbursement of MIDC” found to be correct. It indicates that MIDC disbursed the loan whatever they sanctioned meant for the purpose. Another positive aspect of disbursement is that the MIDC disbursed loan to all the units every year whatever they sanctioned. Such attitude of institution definitely helps the entrepreneurs to implement their ventures as early as possible.
conclusion
The availability of credit is one of the critical weaknesses in the industrial development of Garo Hills. The various financing indicators showed that despite banking facilities, the level of financial outreach is low in Garo Hills. The credit deposit ratio of Garo Hills as well as the state is far below than the national average which is a matter of concern. The sectoral share of total credit indicates that significant
discrepancy from the national level. The trend clearly shows the low level of commercialization of agriculture and low level of industrialization which leads to less absorption capacity of credit in the districts. The poor recovery of loans acts as a disincentive for granting fresh loans. The land tenure system prevalent in the Garo Hills restricting transfer of land together with absence of individual ownership rights makes it difficult for the banks to lend in the districts under study. There is need for conscious effort in financial sector development to ensure free credit flow for enhancing the development efforts of the government.
RefeRences
Ahmed, J. U. (2010). Priority Sector Lending by Commercial Banks in India: A Case of Barak Valley. Asian Journal of Finance & Accounting, December, 2(1:E5), pp. 92 - 110.
Ahmed, J. U. (2010). The Growth Performance of Micro and Small Enterprises in the Global Era: Evidence from Indian Industrial Sector. International Journal of Economics, December, 4(2), pp. 295 - 310.
Basu, C.R. (1977). The Role of the Commercial Banking in the Planned Economy of India. Ph.D. Thesis. Burdwan: Burdwan University.
Chavan, M. & Lamba, A. S. (2007). An International Perspective on Internal Controls in Small and Medium Enterprises. The Business Review, 8(1).
Gassah, L. S. (1984). Garo Hills and Land and The People. Guwahati, Assam: Western Book Depot.
Gomez, C. (2008). Financial Markets, Institutions and Financing Services. (pp. 357). New Delhi: Prentice Hall of India.
Govt. of India. (1991). Report of the Committee on Financial System. (Narasimham Committee-1), Ministry of Finance.
Govt. of India. (1998). Report of the Committee on Financial System (Narasimham Committee-11), Ministry of Finance.
Govt. of Meghalaya. (2006). Statistical Hand Book. Directorate of Economics and Statistics, Meghalaya.
Govt. of Meghalaya. (2008-09). Statistical Hand Book. Directorate of Economics and Statistics.
Mehrotra, R. (1992). Credit Deposit Ratio, Current Status and Future Corrections. RBI Staff Studies, Department of Economic Analysis and Policy, Reserve Bank of India.
Mithani. D. M. (1991). Money, Banking, International Trade and Finance. New Delhi: Himalaya Publishing House.
Narasimham, M. (1994). Financial Sector Reform: The Unfinished Agenda. Platinum Jubilee Conference Volume, Indian Economic Association. Bombay: Indira Gandhi Institute of Development Research.
Role of Financial Institutions in Financing Small and Medium Entreprises... 23
Pandey, K. L. (1968). Development of Banking in India since 1949. (pp. 80). Calcutta Scientific Book Agency.
RBI. (2007). Report of the Technical Group to Review Efficacy of Existing Legislative Framework Governing Money Lending and its Enforcement Machinery.
RBI. (2009). Report of the High Level Committee to Review Lead Bank Scheme, RBI.
RBI. (2010). Reserve Bank of India. Report on Currency and Finance.
Report of 1974 Task Force on Access to Finance, Raw Materials and Marketing, National Commissions for Enterprises in Unorganized Sector. Financing of Enterprises in Unorganized Sector.
Reserve Bank of India. (1977). Committee’s Report on fi-nancing of Public Sector Banks. RBI.
Rual, R. K. (1997). Industrial Finance in India. New Delhi: Anmol Publication Pvt Ltd.
Sharma, B. P. (1974). The Role of Commercial Banks in India’s Developing Economy. New Delhi: S. Chand & Company Pvt. Ltd.
Shekhar, K. C. & Shekhar, L. (2005). Banking Theory and Practice. (14, pp. 86) New Delhi: Vikash Publishing House Pvt. Ltd.
SIDBI. (2010). Report on MSME Sector. pp. 14.SLBC. (2010). State Level Bankers Committee.
Meghalaya.Weblink. (2010). Retrieved September 10, 2010 from http://