105
Moving to Clean Energy Platform: Fast, Popular, Profitable and Global OECD Green Bank Workshop May 20, 2015
| Date post: | 13-Feb-2017 |
| Category: |
Documents |
| Upload: | phungnguyet |
| View: | 214 times |
| Download: | 0 times |

Moving to Clean Energy Platform: Fast, Popular, Profitable and Global OECD Green Bank Workshop May 20, 2015

Situation
• The 4 A’s of Energy Supply: Abundant, Affordable, Available to All
• The 3 C’s for Energy Consumers: Clean, Cheap, Convenient • Remove market barriers to investment in clean energy
solutions • Build political support for clean energy solutions • Clean Energy Solutions Investment Increase Global GDP • Public-Private Partnerships Necessary To Build Investment
2 *Green Bank Focus
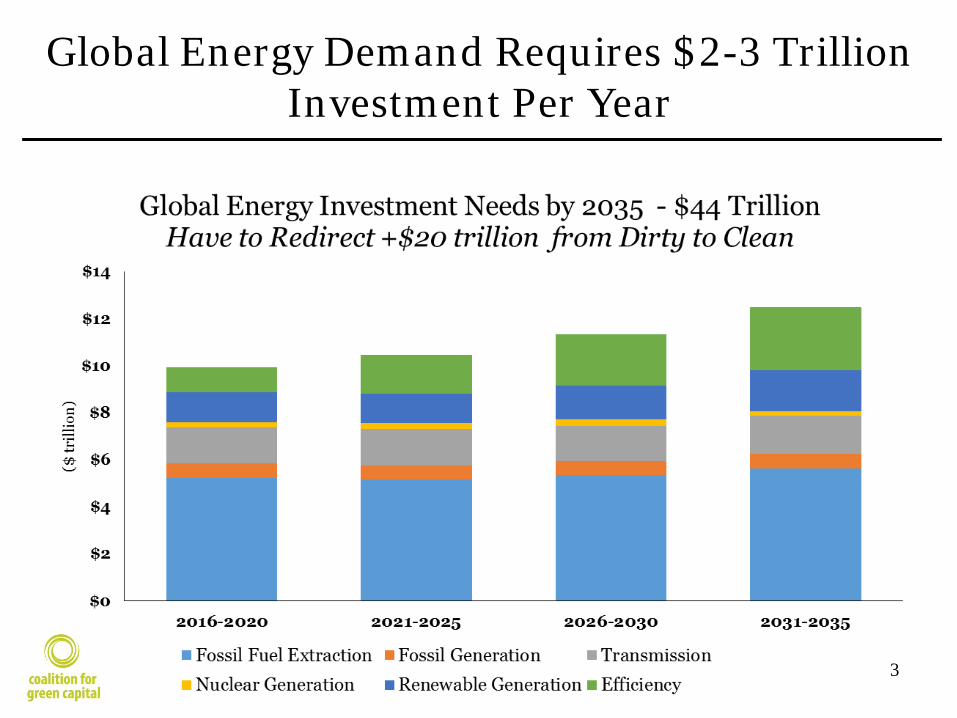
Global Energy Demand Requires $2-3 Trillion Investment Per Year
Source: IEA World Energy Investment Outlook, 2014. 3 3

Progress
• Technology lowering cost of renewables
• Global savings available for productive investment
• Global awareness of climate change soaring
• Clean energy finance institutions being created
• $400B in annual global low-carbon investment
4

5

6
Zero Hour: New Principles
• Don’t wait for international treaty or cash grants
• Don’t wait for “better” technology
• Clean energy price is what matters to consumers
• Different countries will choose among regulation, taxation, subsidies to promote clean energy
• But everyone needs public-private investing
• Align private sector with public goals
7
Green Bank Paradigm
• Make clean energy solutions affordable
• Government financing at cost of capital; private sector financing to be profitable
• Maximize size, growth of clean energy solutions markets
• Maximize private/public investment ratio
• Clean energy solutions out-compete carbon
8

Clean Energy Finance Obstacles
• Global capital unfamiliar with clean energy solutions
• Clean energy finance institutions few in number
• P3 forms not broadly known
• Consumer demand unformed, disaggregated, blocked by bottlenecks
• Centralized vs. distributed unresolved tension
• Incumbents pricing downwards to thwart clean energy entry
9

Green Banks Re-invent Public Private Partnership Investing
• Define, Prioritize National Clean Energy Markets
• Invigorate Supply Chain
• Use Big Data, Social Media to Create Demand
• Aggregate projects to build scale
• Bring Private Sector Lending to Scale
10

11

Rapid growth in mobile
12 Source: Evans, Benedict, “Mobile is Eating the World,” Andreessen Horowitz.

Efficiency+ Mobile
13

Solar + Mobile
14

Green Bank Mission
• Create Institutions
• Enrich Ecosystem: E-Commerce, Social Networks, Green Bonds, Governance Improvement, Measurement
• Popular Opinion (Science Winning; Divestment; Corporate Responsibility; Green Funds)
• New capital suppliers: Corporate investments, local/state funds, pension funds, endowments, foundations, social impact investors
15
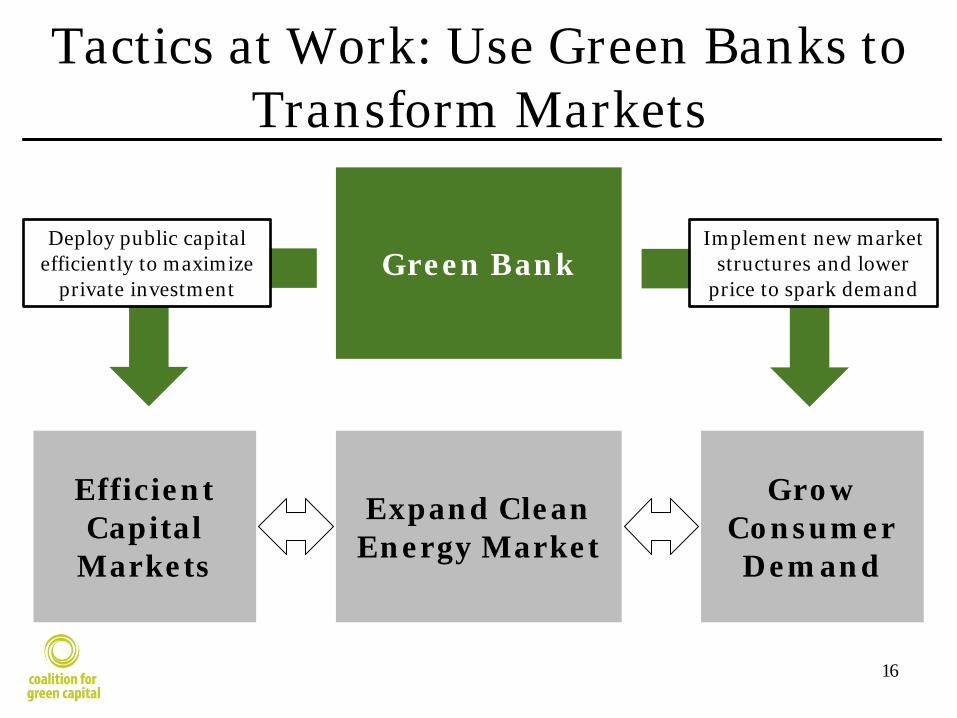
Tactics at Work: Use Green Banks to Transform Markets
16
Green Bank
Efficient Capital
Markets
Grow Consumer Demand
Expand Clean Energy Market
Deploy public capital efficiently to maximize
private investment
Implement new market structures and lower
price to spark demand

Green Bank Model
17
Government
Green Bank Private Investors
Low Carbon Projects
Creation & Public Capitalization
Public Investment Payback Private
Investment Payback
1
2
Consumer Savings, Job Creation, Taxpayers Protected,
GHG Reductions
3
Public $’s capitalize green bank 1
2 P3 attracts private capital
3 Private investors fill market gaps
Create New Public Institution to Channel Public & Private Investment

Green Banks Lower Price of Clean Energy
18
0% 10% 20% 30%
$4.5 21.0 18.7 16.3 14.0
$4.0 17.4 15.4 13.3 11.2
$3.5 13.9 12.1 10.3 8.5
$3.0 10.3 8.8 7.2 5.7
% of GB Capital in Solar Project
Sola
r In
stal
l Cos
t ($
/Wat
t)
Source: Rooftop Solar PV “Green Bank” Financing Model, Sponsored by The Connecticut Green Bank and the Coalition for Green Capital, Developed by the Brattle Group. Available for download from: http://www.coalitionforgreencapital.com/the-model.html Assumptions: Developer Equity Return is 15%, Tax Equity Return is 12%, total leverage is 40%, Commercial Debt is 6% for 6 years, Green Bank Debt is 2% for 15 years, 15-Year REC price of $0.03/kwh, 6-year state incentive of $0.225/kwh. Structure is 20% Green Bank Debt, 20% Commercial Debt, 48% Tax Equity and 12% Developer Equity
Price of Solar Generated Electricity in Connecticut (cents/kwh)
More Green Bank Capital Lowers Price!

Case Study: CT Green Bank
19
• Bipartisan legislation in ‘11 to create new Institution – Quasi-state corporation; separate board – Goals linked to state energy plan – ~$40M in annual public capital (SBC & RGI) + borrowing authority
• Uses P3 finance structures to pull in private investors
– Loans, leases, credit enhancements, PACE, securitizations – Products can achieve $10:$1 private: public leverage ratio
• Rapidly expanding distributed power & efficiency investing
– Private capital already flooding into new markets (solar loan, commercial efficiency), CTGB can pull back
1
2
3

Case Study: Efficiency Investment
20
Green Bank
Tax Collector
Commercial Building PACE
Assessment
Loan Payment Loan
Private Investors
Portfolio Securitization + Credit Support
Cash Purchase
1
2
3
4
Centralized State-wide Green Bank Administration

Successful P3 Investment
21
CT Grant Authority FY 2000 – 2011
CT Green Bank FY 2012 – 2014
Years in Operation 11 3
Total Investment $349 Million $350 Million
Public/Private $168/$181 Million $100/$250 Million
Renewable Energy Installed 43.1 MW 65.3 MW
Green Bank Accelerated Annual Deployment 5X!
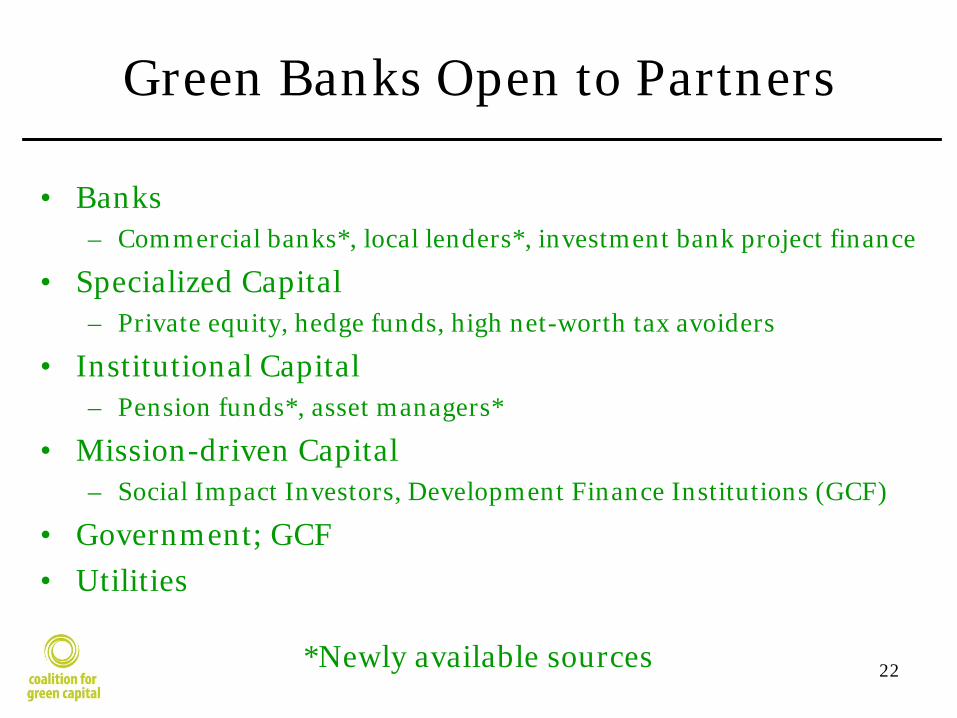
Green Banks Open to Partners
• Banks – Commercial banks*, local lenders*, investment bank project finance
• Specialized Capital – Private equity, hedge funds, high net-worth tax avoiders
• Institutional Capital – Pension funds*, asset managers*
• Mission-driven Capital – Social Impact Investors, Development Finance Institutions (GCF)
• Government; GCF • Utilities
22 *Newly available sources
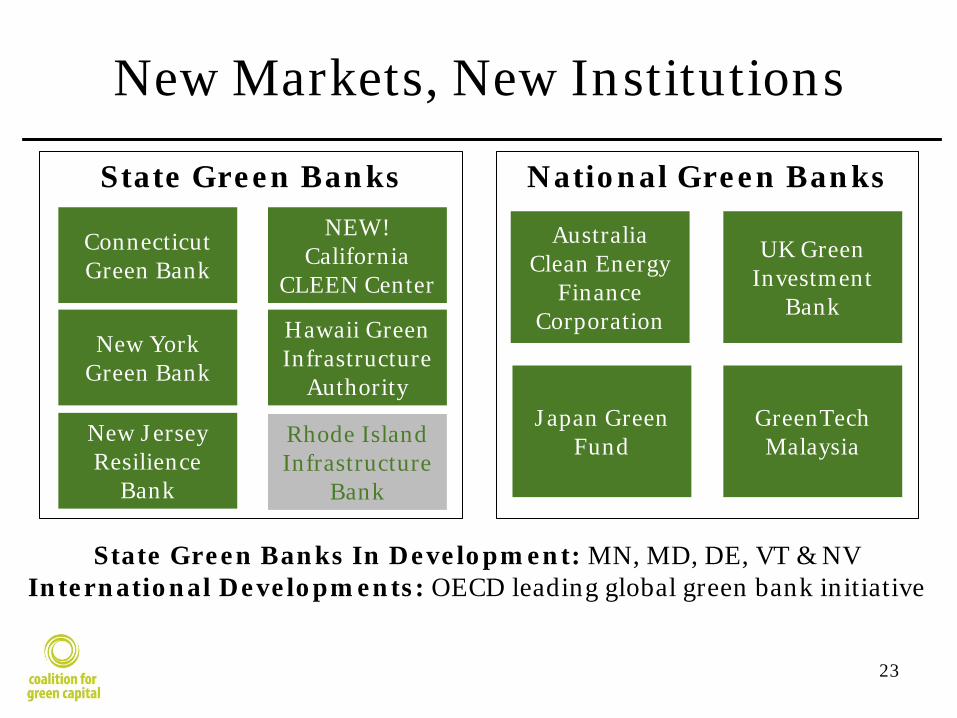
National Green Banks State Green Banks
New Markets, New Institutions
23
Connecticut Green Bank
New York Green Bank
Hawaii Green Infrastructure
Authority
NEW! California
CLEEN Center UK Green
Investment Bank
Australia Clean Energy
Finance Corporation
Japan Green Fund
GreenTech Malaysia
State Green Banks In Development: MN, MD, DE, VT & NV International Developments: OECD leading global green bank initiative
New Jersey Resilience
Bank
Rhode Island Infrastructure
Bank

Critical Roles for Finance Philanthropy
• Capability Building
• Institution Creation
• Social Networking; Information Exchange
• Seed Capital; Demonstration Projects
• Catalyst for Other Financing Sources
• State, Regional, Nation-State, International
24

Thank You Reed Hundt, CGC, Chief Executive Officer www.coalitionforgreencapital.com

Federal Department of the Environment, Transport, Energy and Communications DETEC Federal Office for the Environment FOEN
Presentation title
Swiss Technology Fund 20.05.2015
Federal Office for the Environment FOEN

2 Swiss Technology Fund | 20.05.2015 Silvia Ruprecht, FOEN, Switzerland
Swiss climate policy
Target CO2-Act 2013-2020: -20% GHG-Emissions Reduction
until 2020 compared to 1990
Reduction measures:
Emissions trading especially for
large CO2-intense companies
CO2 levy: incentive fee on fossil thermal
fuels
CO2 emissions compensation
CO2 emissions regulations for passenger cars

3 Swiss Technology Fund | 20.05.2015 Silvia Ruprecht, FOEN, Switzerland
• Notable contribution to strengthen Switzerland as a center for innovation in clean technologies Mobilizing private investment with limited public funding
• Optimal utilization of funds capital
Mission
• Considerable reduction of greenhouse gas emissions in the long run (directly or indirectly)
Reduction of greenhouse gas emissions
Efficient utilization of electrical energy
Promotion of renewable energies
Conservation of natural resources

4 Swiss Technology Fund | 20.05.2015 Silvia Ruprecht, FOEN, Switzerland
• Politicians: Less state intervention • Start-Up Firms: Corporate lending without track record • Established companies: Lower lending costs • Investors: Lower risk perception • Government: leverage fund deposit (risk structure), capital
flow to companies exceeds contribution to fund
Why loan guarantees
Innovation life cycle Technology Fund for Commercialization Phase
Existing public support programs

5 Swiss Technology Fund | 20.05.2015 Silvia Ruprecht, FOEN, Switzerland
Conditions and Organisation
Conditions • Joint guarantees: CHF 50’000 to CHF 3 million • Maximum term: 10 years • Fund size: CHF 150 million (can be increased to max. CHF
500 million) • Coverage: max. 60% of project total financing
Specialist Service FOEN
Investment Commitee public/private External Management Agency
Private
Steering Committee FOEN/SFOE (public)
Organisation
6 Swiss Technology Fund | 20.05.2015 Silvia Ruprecht, FOEN, Switzerland
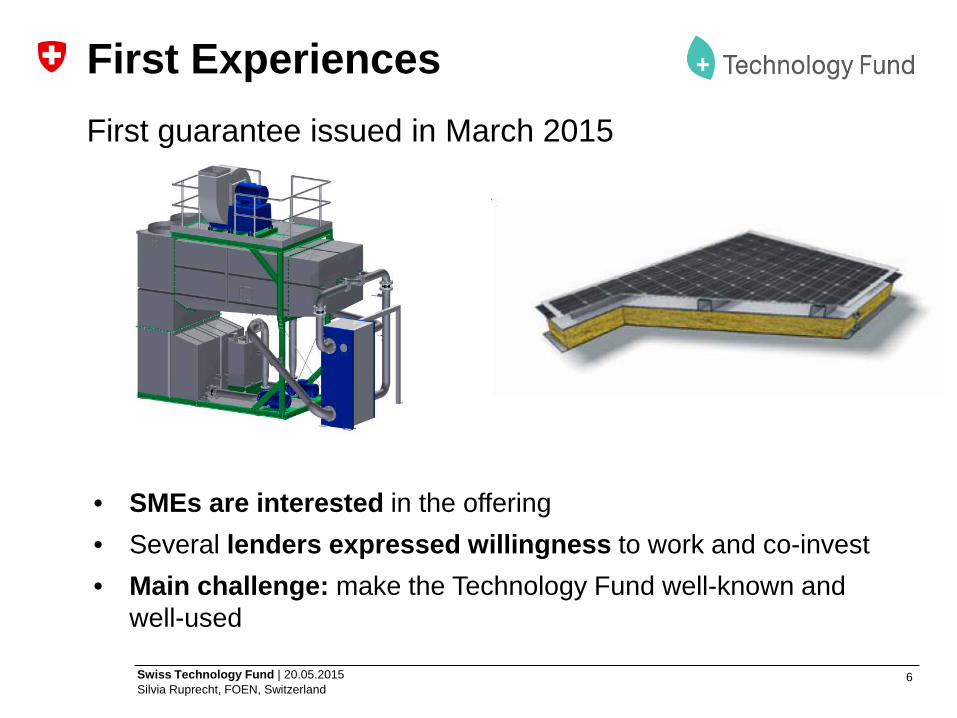
First guarantee issued in March 2015
First Experiences
• SMEs are interested in the offering • Several lenders expressed willingness to work and co-invest • Main challenge: make the Technology Fund well-known and
well-used

7 Swiss Technology Fund | 20.05.2015 Silvia Ruprecht, FOEN, Switzerland
Many thanks
Questions? More detailed information on www.technologyfund.ch Silvia Ruprecht, FOEN, Switzerland [email protected]

California Economy
• California is the largest, richest, and most diverse economy in the U.S.
• 7th largest economy in the world; GSP $2.2 trillion
• No. 1 state for Manufacturing and Technology • Nation’s most Fortune 500 companies • Global leader in agriculture output and export

California Economy by the Numbers
• 2014: added 498,000 jobs • Economy has grown 4.1% annually since 2011 • July 2015 projected State budget surplus: $5
billion • California-based technology companies have
produced $692 billion in the past 12 months • Manufacturing: $239 billion in revenue in 2013 • Agriculture produced $21 billion in revenue in
2013

California Energy Production and Efficiency Goals
• Aggressive but Achievable • Multi Pronged Approach
– State Treasurers Office – California Energy Commission – California Infrastructure Bank – California Water Resources Board

Economic Development Bank
California Infrastructure

About IBank
• IBank was created in 1994 to finance public infrastructure and private development that creates good jobs, a strong economy, and a clean environment to improve the quality of life for the people of California.
• Infrastructure and Economic Development

IBank Programs
Revolving Fund Loans
California Lending for Energy and Environmental Needs Center (CLEEN)
Bond Program
Small Business Finance Center
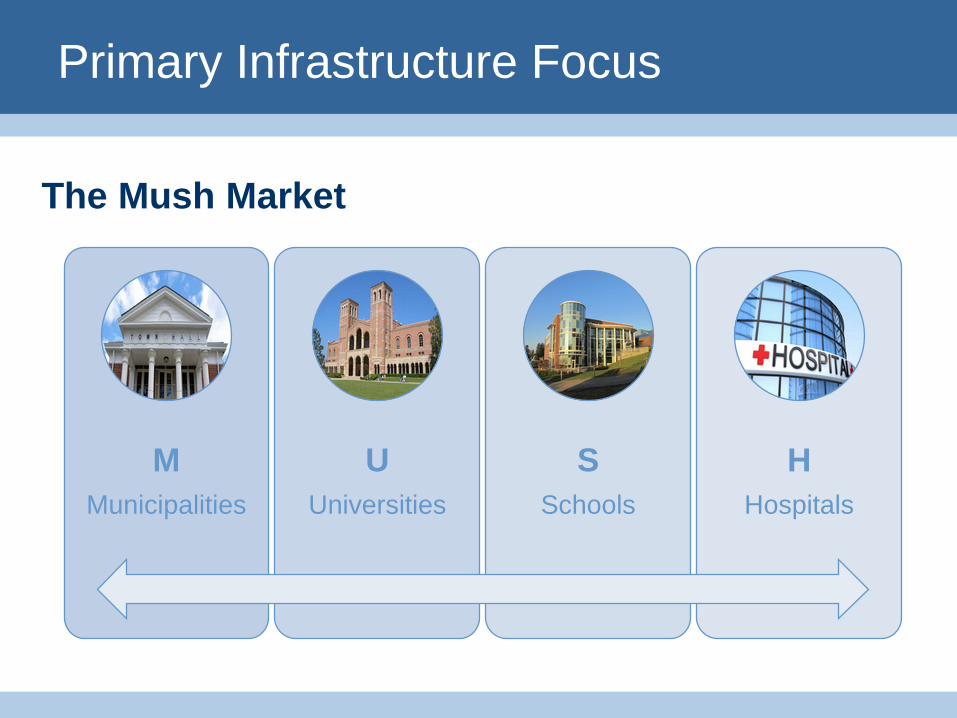
Primary Infrastructure Focus
M Municipalities
U Universities
S Schools
H Hospitals
The Mush Market
Direct Loan
Infrastructure State Revolving Fund (SRF) • Provides financing to public agencies and
non-profit corporations for a wide variety of infrastructure and economic development projects.
• ISRF Program funding is available in amounts ranging from $50,000 to $25,000,000 (or more with Board approval), with loan terms up to 30 years.

Infrastructure State Revolving Fund Program (SRF)
Types of eligible projects: • Power • Public transit • Streets & highways • Water

CLEEN & SWEEP
In 2014 IBank established: • California Lending for Energy and
Environmental Needs Center (CLEEN Center) • Statewide Energy Efficiency Program
(SWEEP)

SWEEP
Generation • Solar, Wind, Biomass, Hydroelectric
Conservation • EE Retrofits, LED lights, Building automation and
controls
Other • Energy storage, transmission, and distribution; EV
charging stations

SWEEP
Variety of Financing Mechanisms: • Direct Loans • Tax Exempt Bonds • Green Bonds • Loan Guarantee

California Drought

Actions Taken
Project funding for: • Mandated Reductions • Desalinization Plants • Synthetic Turf
This represents new projects which will require financing

Water Savings
Variety of Financing Mechanisms:
• Natural grass lawns require 55 gallons of water per sf annually
• 50-70% of household water consumption is used for irrigation
• In 2013 synthetic lawns will save over 2.5 billion gallons of water

1
G20-IPEEC ENERGY EFFICIENCY FINANCE TASK
GROUP (EEFTG)
Presented by: IPEEC and Peter Sweatman, Climate Strategy (on behalf of TG Secretariat)
Date: 20th May 2015
Green Investment Bank Workshop OECD GIFF, Paris 20th May 2015
Kindly hosted by:
2
1. CREATION OF THE G20.IPEEC EEFTG
• The G20 Energy Efficiency Action Plan specifies that participating countries will work under IPEEC to create an Energy Efficiency Finance Task Group (EEFTG), to facilitate a high-level dialogue with representatives of the international finance community
• With solicited support from: UNEP FI, the OECD, the Clean Energy Ministerial, the World Bank, EBRD, the Energy Efficiency Financial Institutions Group and others

3
1. STRUCTURE OF THE G20.IPEEC EEFTG

4
• According to IEA studies, increasing energy efficiency finance by a factor of 8x is required for countries to remain on a 2 degree scenario.
• Concrete, short-term outcomes are important. The EEFTG can bring to the G20 meeting November in Turkey and to COP21 specific, tangible contributions to its “positive agenda”, in the form of policy and markets principles that can be endorsed and supported by G20 Leaders.
• These may include suggestions to explore possible sectorial actions, partnerships with large industries, sources of financing (both public and private) and proposals for financial tools.
2. EE FINANCE WHY? + ROLE OF EEFTG
5
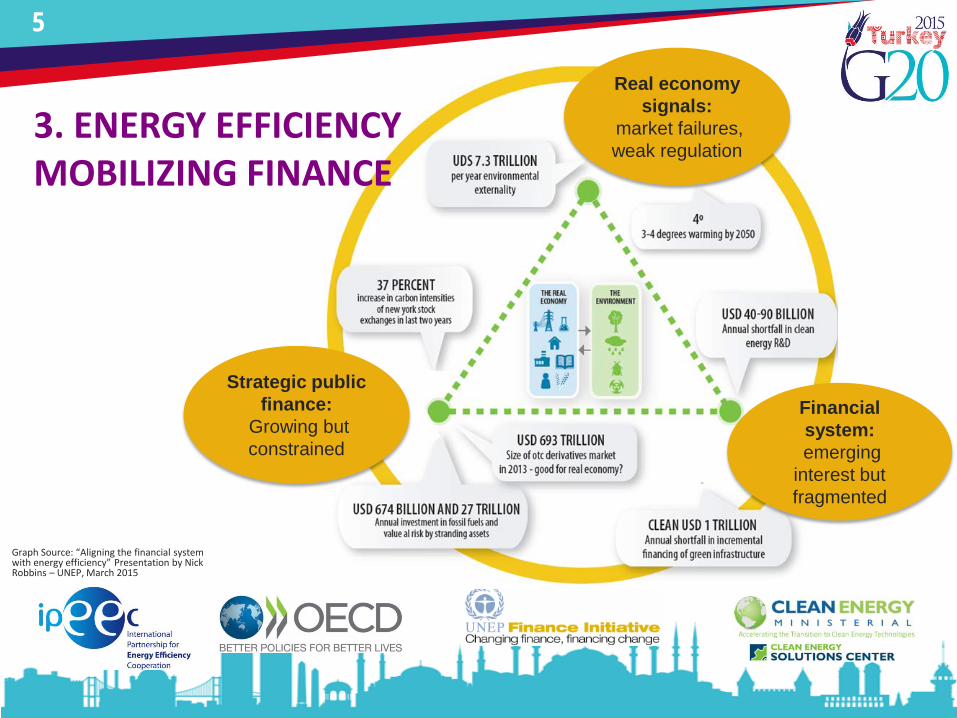
3. ENERGY EFFICIENCY MOBILIZING FINANCE
Strategic public finance:
Growing but constrained
Real economy signals:
market failures, weak regulation
Financial system:
emerging interest but fragmented
Graph Source: “Aligning the financial system with energy efficiency” Presentation by Nick Robbins – UNEP, March 2015

6
Energy Efficiency has been described as the EU’s largest energy source:
1. One of the most cost effective ways to enhance the security of its energy supply
2. One of the most cost effective ways decrease the emissions of greenhouse gases and other pollutants
3. EE investment is the most cost effective manner to reduce the EU’s reliance, and expenditure, on energy imports costing over €400 billion a year
4. INCREASING EE INVESTMENT FLOWS IN THE EU

7
To help protect your privacy, PowerPoint has blocked automatic download of this picture.
Lower emissions
Increased energy security and reduced dependence on foreign
imports
Improvements to a country’s fiscal balance
Increased employment
Energy Efficiency Investments
Direct energy returns
Additional value streams to private owners and asset
operators
Significant Public Benefits
Characterized by their MULTIPLE BENEFITS
4. INCREASING EE INVESTMENT FLOWS IN THE EU

8
EEFIG’s work has benefited from:
2 Who would be the right party to address them?
3 What should the European Commission/ EU do?
What are the most imminent challenges that must be overcome? 1
EEFIG’s Mandate Active input of some 120 expert
participants (8,000 hours)
40% of the EEFIG participants either work for, or represent the views of, financial institutions. Participation from financial institutions, policy makers, finance users (buildings,
industry or SME) and energy efficiency experts
5. SCOPE OF EU EEFIG WORK

9
Buildings 40% share in final energy consumption in EU-28
Graph Source: Eurostat
75% of Standing EU Buildings Built with no, or minimal, energy-related building codes
75%-90% of today’s buildings still in use in 2050
Low Demolition Rates +
Low Renovation rates +
Low Highly Energy Efficient New-build
Europe’s EE challenge in buildings mainly concerns the energy efficient renovation and
investments in its existing buildings stock.
6. EE INVESTMENTS IN EU BUILDINGS

10
EEFIG Participants Identified 16x EE Financial Instruments
7x “Mature” Instruments
9x “Emerging” Instruments
• Widely used to fund energy efficiency investments directly or indirectly
• Are newer but have a varying potential to increase energy efficiency investing in EU buildings
1. Dedicated credit lines have the widest applicability in all buildings segments
2. Energy Performance Contracting is growing in commercial and public buildings
3. Risk-sharing facilities are proving very useful
4. EE investing through direct and equity investments in real estate and infrastructure is important
5. Subordinated loans and leasing are presently “niche” instruments for buildings EE
6. Good potential for on-bill repayment and on-tax finance (PACE)
7. EE funds and Energy Service Agreements show good potential only in commercial and public buildings
Highlights from EEFIG’s Survey, Working Group & Discussions
7. EE INVESTMENTS IN EU BUILDINGS, EEFIG ASSESSMENT

11
• Existing Buildings Regulations to be fully implemented, harmonised and consistently enforced across EU Member States
• Future Regulatory Pathways for EU Buildings should provide concerted and consistent regulatory pressure to improve the EE of buildings
• High quality decisions and low transaction costs can only be delivered by easily accessible data and standard procedures
• Reporting, accounting and procurement procedures must facilitate, and not hinder, appropriate energy efficiency investments in public buildings
• Reach “at-scale” energy efficiency upgrade of residential buildings by addressing specific investment demand & supply drivers of this segment plus the engagement and alignment of retail distribution channels
• To address of EE investment supply and technical assistance through the smart deployment of ESIFs 2014-2020 and Horizon 2020 into risk sharing mechanisms and project development assistance, working with partners with an successful track-record
To Policy Makers
• Engage key decision makers with a clear business case that raises their awareness of the multiple benefits of buildings’ EE refurbishments with evidence
• Make it easy to get the right data to the right decision makers
• Improve the Processes and Standards for Buildings Labels, Energy Performance Certificates and Energy Codes
• Standards should be developed for each element in the energy efficiency investment process
• Leverage of private sector finance through appropriate use of ESIFs and Member States funds
To Market Participants
8. EE INVESTMENTS IN EU BUILDINGS, EEFIG RECOMMENDATIONS

12
Substantial savings are available
Energy Efficiency Index (ODEX) in EU Manufacturing Industries calculated by ODYSSEE-MURE project and published November 2014, using industry data rebased from year 2000.
EU Industry: • Responsible for (26%) of European final
energy consumption
• World leader in EE
EU Industrial Energy Efficiency: • Improved on average by 1.3% per annum
over the last 15 years
• Speed of progress has been reduced since the financial crisis
Yet Potential additional savings with a 2030-2050 horizon are
substantial
9. EE INVESTMENTS IN EU INDUSTRY & SMES
13
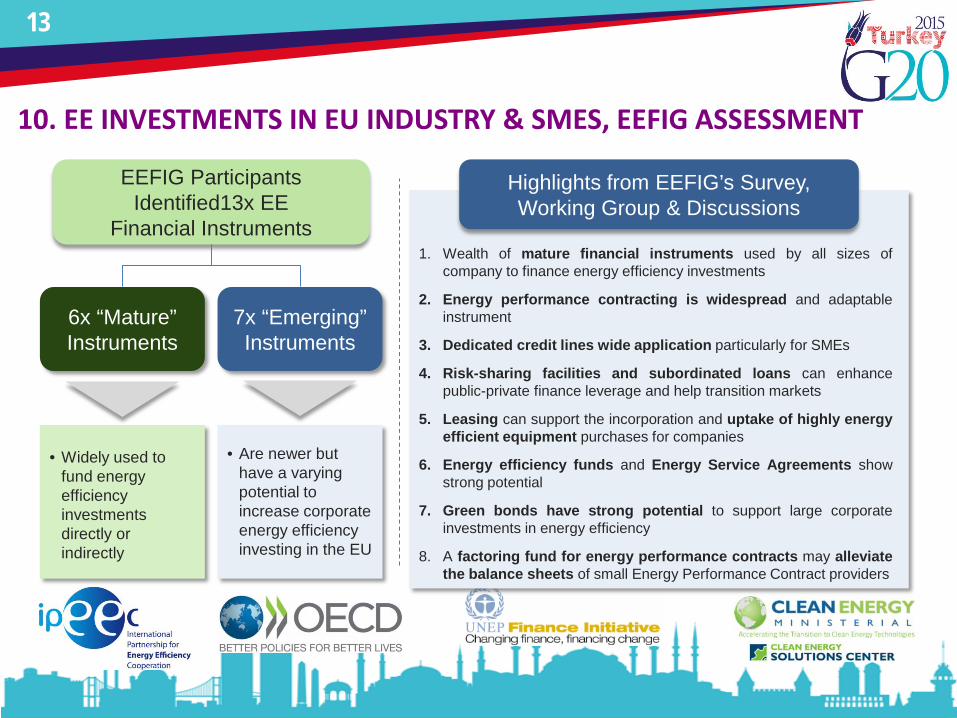
1. Wealth of mature financial instruments used by all sizes of company to finance energy efficiency investments
2. Energy performance contracting is widespread and adaptable instrument
3. Dedicated credit lines wide application particularly for SMEs
4. Risk-sharing facilities and subordinated loans can enhance public-private finance leverage and help transition markets
5. Leasing can support the incorporation and uptake of highly energy efficient equipment purchases for companies
6. Energy efficiency funds and Energy Service Agreements show strong potential
7. Green bonds have strong potential to support large corporate investments in energy efficiency
8. A factoring fund for energy performance contracts may alleviate the balance sheets of small Energy Performance Contract providers
Highlights from EEFIG’s Survey, Working Group & Discussions
EEFIG Participants Identified13x EE
Financial Instruments
6x “Mature” Instruments
7x “Emerging” Instruments
• Widely used to fund energy efficiency investments directly or indirectly
• Are newer but have a varying potential to increase corporate energy efficiency investing in the EU
10. EE INVESTMENTS IN EU INDUSTRY & SMES, EEFIG ASSESSMENT

14
• Policy framework should positively support strong corporate energy efficiency investment choices at key points in their investment cycle, using a “carrot and stick” approach
• Public resources and facilitation should be engaged to establish dynamic and effective systems for sharing information and technical experience
• Ensure EU and national policies and resources are working effectively together to drive R&D and optimal energy efficiency outcomes
• Support the clarification of the regulatory, fiscal and accounting treatment and standardisation of Energy Performance Contracts
• Energy efficiency opportunity identification and investible project pipelines should be supported with Project Development Assistance facilities for SMEs
To Policy Makers
• Raise energy efficiency opportunities at board-level and implement appropriate strategic resource investments to capture their multiple benefits within the natural company investment cycle
• Financial institutions should more widely adopt existing “best practice” models to stimulate client energy efficiency investments
• Encourage and support collaborative processes and consider R&D whose objective is to reduce the cost of and improve the up-take of energy efficiency investments
• Standards should be developed for the legal terms in and process to negotiate energy performance contracts
To Market Participants
11. EE INVESTMENTS IN EU INDUSTRY & SMES, EEFIG RECOMMENDATIONS

15
• Ensure effective transposition and local enforcement of EU Directives and increase Commission’s buildings EE resources
• Regulatory stability for EE investments via coherent, long-term EE regulatory pathway and internally consistent 2020, 2030 and 2050 targets
• Address need for high quality buildings performance data and standards
• Initiate review and benchmarking process on decision making frameworks for public buildings to remove accounting, reporting and procurement hurdles and create standard procurement procedures
• Benchmark and compare the relative successes of retail residential energy efficiency investment programmes in the Member States
• Ensure Member States adequately identify funding for their National Buildings Renovation Strategies (Art. 4 of Energy Efficiency Directive).
Buildings • Ensure effective transposition of existing EU
Directives ensuring increased visibility and financial rigor of energy audits
• Support regulatory stability and visibility for long-term EE, eg. negotiated voluntary industry agreements with cost effective fiscal and accounting incentives
• Address need for information and experience sharing, substantiate corporate energy efficiency metrics and procedures and consider role in process energy intensity and EE investment performance databases
• Initiate review to better understand and develop the energy performance contracting market
• Support Project Development Assistance facilities to build SME capacity and the networks which serve them.
Companies
12. EEFIG RECOMMENDATIONS TO THE EU COMMISSION
16
Thank you

C-PACE Financing: Developments in Commercial PACE CT Commercial PACE Program
April 30th, 2015
IMN Sunshine Backed Bonds
Agenda
1.Background 2.Drivers of Success in CT 3.Program Progress 4.Lessons Learned from 1st C-PACE portfolio sale 5.What’s Next for the Program?
a. Origination b. Capital Raise (RFP)
2
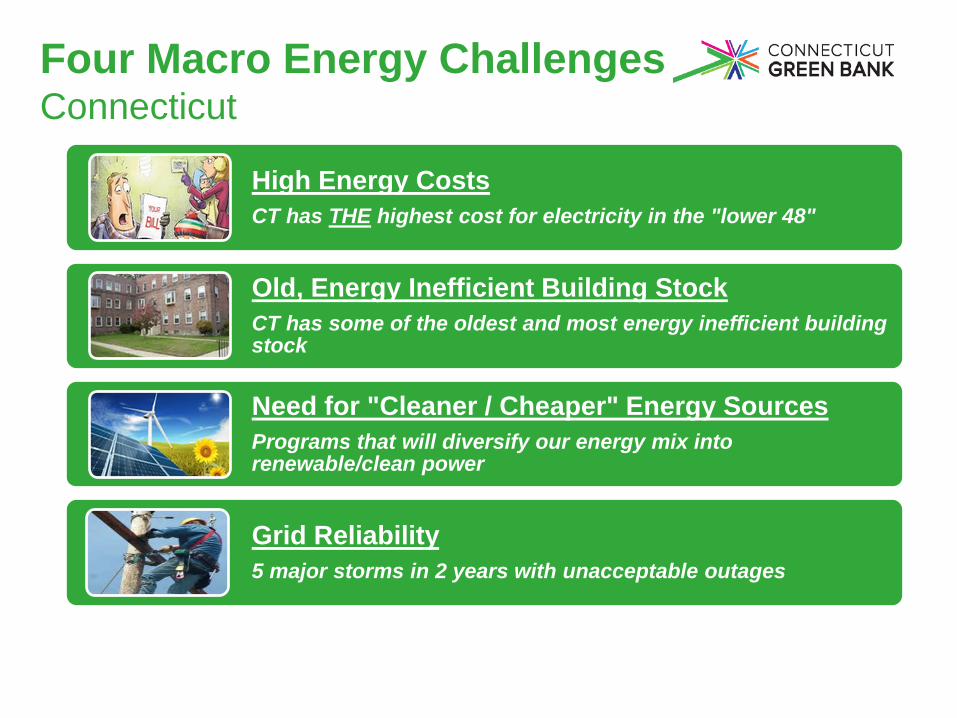
Four Macro Energy Challenges Connecticut
High Energy Costs CT has THE highest cost for electricity in the "lower 48"
Old, Energy Inefficient Building Stock CT has some of the oldest and most energy inefficient building stock
Need for "Cleaner / Cheaper" Energy Sources Programs that will diversify our energy mix into renewable/clean power
Grid Reliability 5 major storms in 2 years with unacceptable outages
3

Comparative Energy Costs (2014)
4

A Green Bank in Action
5
▪ Bridgeport Fuel Cell Park ▪ $125 million 15-MW project ▪ Created ~140 jobs – construction, manufacturing and O&M
▪ C-PACE ▪ $40 million "warehouse" – $65 million across >80 deals (to date) ▪ Saving between 30-50% energy consumption ▪ Sold $30 million – first securitization of commercial PACE projects
▪ CT Solar Loan - Funding from "the Crowd" ▪ Green Bank $10 million aggregation facility / 20% sub debt ▪ First affordable solar loan product not tied to OEM or home equity
▪ Smart-E Loans - $30 Million Public-Private Partnership ▪ "2nd Loss" LLR - Supported by $2.5 million ARRA funds ▪ 9 Credit Unions & Community Banks

Connecticut Special Session Public Act 12-2 (June 2012)
▪ Commercial, industrial & multi-family property
▪ Requires the consent of the existing mortgage lender
▪ Requires SIR>1; permanently affixed
▪ Single Statewide Program – municipalities “opt-in”
▪ Energy Efficiency / Renewables / Microgrids / Shared Energy Situations (District Energy)
6

CEFIA’s Role in C-PACE
7
• Design guidelines, bring on technical team • Onboard municipalities • Market the program
Determine Project & Building Eligibility
• SIR > 1 • Financial due diligence • Secure lender consent
Design Program
• Qualify Capital Providers • Provide capital (as needed) • Sell-down portfolio
Attract Private Capital

Commercial PACE (C-PACE) Progress to Date
8
▪ 105 cities and towns and opted into the program – over 85% of the market
▪ Over 100 companies trained – 34 with approved projects
▪ 30+ mortgage lenders have provided consent
▪ Over $70 million (#100+) in projects approved–including first fuel cell
▪ Deploying over 10 MW of renewable energy and saving between 30-40% of energy consumption
▪ First securitization of commercial energy efficiency projects (private placement / not rated)
▪ Raising $50-$100 million private warehouse through RFP

9
Commercial PACE (C-PACE) Next Steps
$-
$5.0
$10.0
$15.0
$20.0
$25.0
$30.0
$35.0
$40.0
0-6 months 7-12 months 13-18 months 19-25 months
CT C-PACE Approved/Closed

Commercial PACE (C-PACE) paceSETTERs

Connecticut Green Bank C-PACE Warehouse ($40 MM)
Commercial PACE (C-PACE) Catalyst for Private Investment
11
Connecticut Green Bank
Class B Bonds (10%)
Class C Bonds (10%)
Clean Fund
Class A Bonds (80%)
$30 Million in Funding Private Placements &
Ultimately Public Markets C-PACE Benefit
Assessment
C-PACE Benefit
Assessment
13
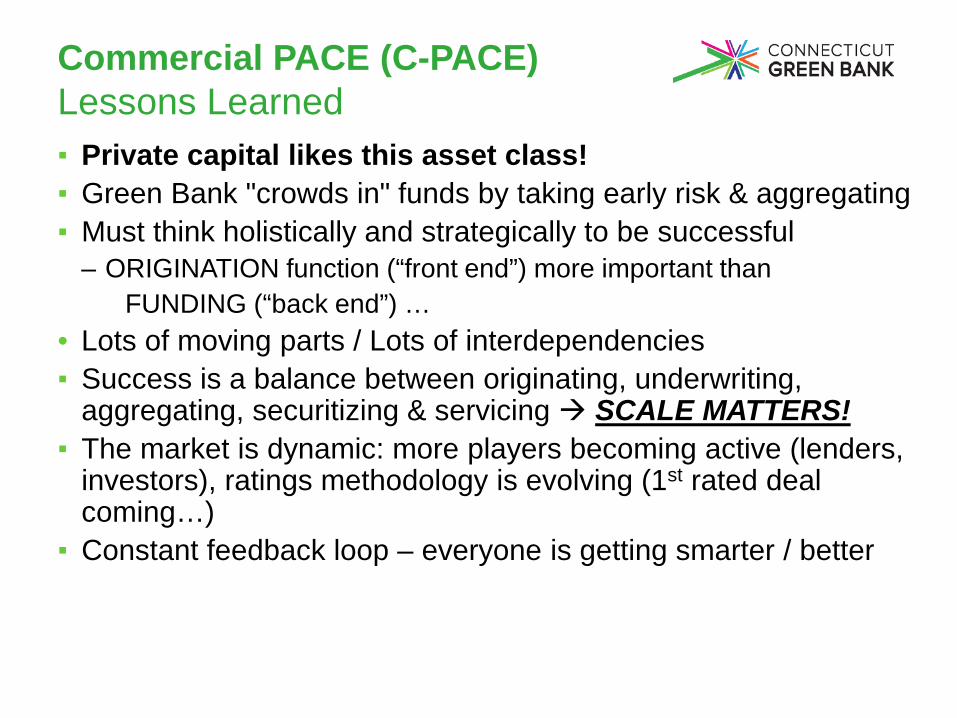
Commercial PACE (C-PACE) Lessons Learned ▪ Private capital likes this asset class! ▪ Green Bank "crowds in" funds by taking early risk & aggregating ▪ Must think holistically and strategically to be successful
– ORIGINATION function (“front end”) more important than FUNDING (“back end”) …
• Lots of moving parts / Lots of interdependencies ▪ Success is a balance between originating, underwriting,
aggregating, securitizing & servicing SCALE MATTERS! ▪ The market is dynamic: more players becoming active (lenders,
investors), ratings methodology is evolving (1st rated deal coming…)
▪ Constant feedback loop – everyone is getting smarter / better

Commercial PACE (C-PACE) Next Steps / Standard Offer / Origination
14
STANDARD OFFER AVAILABLE NOW!

Commercial PACE (C-PACE) Next Steps / Standard Offer / Origination
Expanding access to private capital originators and financiers – an “Open Market” for C-PACE financing Draft Term Sheet • Outline key material terms of the originating and funding relationship
between the Program Administrator (Connecticut Green Bank) and the Capital Provider
• Enable private capital providers to fund transactions through C-PACE mechanism
For more information, go to the “About Us” section at www.cpace.com
15

Commercial PACE (C-PACE) Next Steps / Capital Raise
Summary of Needs for Additional Private Capital
Volume • The Green Bank able to finance $40M of C-PACE assessments on balance sheet • Pre-sold $30M portfolio of projects in 2014 • $70M+ deals approved, currently rate $5M per month (50% <$400,000)
Market • External lender of record / SPV structure • Supporting private origination models / less Green Bank capital
Economic • Recapture economics to fund Green Bank origination and administration activities
Partnership potential • Ability to drive demand • Ability to take on some Green Bank functions will be evaluated during RFP and
taken into account

Commercial PACE (C-PACE) Next Steps / Capital Raise
STATUS ▪ Received several proposals to fulfill our needs and objectives ▪ Proposals from the best financial services firms, including:
– 4 Global banking/investment banking firms ($125 Bn to >$1 Tn) – 2 “broker dealers” with mortgage-backed / ABS experience – A Billion $ “Yieldco/REIT”
▪ $50M - $200M in facilities ($50M minimum per RFP) ▪ Structured from “whole loan” purchase to a “warehouse” / securitization option ▪ All offered an ability to scale ▪ Selection “soon” ▪ Facility in place mid-summer

Thank you!
Bert Hunter EVP & Chief Investment Officer Connecticut Green Bank T 860-257-2174 | C 203-918-0013 | F 860-563-4877 845 Brook Street, Rocky Hill, CT 06067 300 Main Street, Suite 400, Stamford, CT 06901 [email protected] ctgreenbank.com

NY Green Bank Overview
Alfred Griffin, President, NY Green Bank
OECD Green Investment Bank Workshop | May 20, 2015

Background Introduction New York’s Energy Landscape The Opportunity Market Gaps & Barriers About & Approach Mission Investment Criteria Product Offerings In Scope & Out of Scope
Partnering with Us Open Solicitation Announced Transactions
1
Agenda

Background
2

Reforming the Energy Vision (REV) is New York’s comprehensive strategy to create an efficient, reliable and affordable clean
energy system
New York’s Energy Landscape
3
Groundbreaking Regulatory Reform REV Regulatory Proceeding
Leading by Example
Using the State’s Energy Assets (Ex. NYPA Build Smart; NYSERDA NY-Sun)
Evolution of State Programs
Clean Energy Fund NY Green Bank
Pillars of REV

4
The Opportunity
NYGB operates at the near-frontier of current commercial markets, facilitating the evolution and expansion of those
markets. With greater private sector investments in one area, NYGB moves to the next near frontier.
Enormous potential: Recent Booz & Co. study estimates market opportunities for New York-based clean energy projects over the
next ten years ~ $85B

Unfamiliar structures
Multiple risk exposures
New counterparty
credits
Small transaction
sizes
Minimal standardization
Uncertainty as to scale
Lack of industry and product
coverage clarity
Lack of sponsorship
Common clean energy transaction issues for
private sector financiers
New York’s clean energy marketplace is constrained by current market gaps & barriers
Market Gaps & Barriers
5

About & Approach
6
Mission
7
To accelerate clean energy deployment in New York State by working in partnership with the private sector to transform
financing markets
Key Elements and Objectives
$1 billion state-sponsored specialized finance entity (not a bank) Stimulate faster, more extensive deployment of clean energy assets Ultimately reduce need for government participation

Investment Criteria
8
Credit quality is paramount in the evaluation, structuring and negotiation of NY Green Bank’s investments
Minimum Requirements
NYGB capital will be repaid and will earn appropriate market rate
Transactions will lead to reduced greenhouse gas emissions
Investments result in greater private sector capital deployed into the market
Involve one or more private sector financial parties
Wholesale (not retail) markets Economically/technically
feasible Unique NYGB role Financial returns comparable to
market expectations Involve sufficient client and
partner “skin in the game”
Additional Considerations

Product Offerings
9
Broad Categories of Capital Solutions
Credit Enhancement
Warehousing/Aggregation
Asset Loans & Investments
Composite Products
Rates reflect the following:
Risk positions in capital structure
Pricing for comparable transactions
Commercial expectations of rates when market is more liquid
We balance various factors in pricing our products, serving as both prudent stewards of ratepayer funds and agent for greater private investment
Product Pricing

Facilitate development of new asset classes and market liquidity
Be creative in supporting technically and economically feasible/creditworthy transactions
Develop and incubate new structures
Support standardization and aggregation
Priority Activities × Support transactions without
private capital involvement × Accept credit and/or project
risks unacceptable to the private market
× Take unproven technology risk × Provide grants or subsidized
capital × Pursue one-off transactions
Outside NY Green Bank Mandate
NY Green Bank supports transactions that with scale and experience can ultimately be financed by the private sector
In Scope & Out of Scope
10

Partnering With Us
11
Open solicitation invites proposals for financing arrangements and/or transactions meeting our mandate and investment criteria
Proposals are evaluated on a rolling basis as they are received
NY Green Bank team is available to discuss potential investment ideas
12
Open Solicitation
Visit www.greenbank.ny.gov to view the open solicitation and instructions for online submission

Announced Transactions
13
Transaction Partners Clean Energy Deployment NYGB Product
Ameresco Energy Service Company (ESCO) Project Deployment
Secured Line of Credit
Bank of America Merrill Lynch Energy Equipment Financing for Energy Service Companies (ESCOs)
Lease Tenor Extension
Deutsche Bank Using Energy Savings Agreements (ESAs) to Grow Commercial Property Efficiency Markets
Senior Debt
First Niagara Bank, M&T Bank, BQ Energy
Template for Mid-Sized Commercial Solar Projects with New Sources of Capital
Construction / Tax Equity Guarantees
Renewable Funding, Citi Scaling up Residential Energy Efficiency Securitization Credit Enhancement
Sustainable Development Capital, First Eastern Investment Group
Building Marketable Portfolios of Energy Efficiency and Distributed Generation Assets for Commercial and Industrial (“C&I”) and Public Buildings
Senior Debt Warehouse / Aggregation Facility
GreenCity Power, Tulum Management
Expanding Capital Availability for Scale Commercial Cogeneration Projects
Senior Debt Warehouse / Aggregation Facility
Capital Amount ($mm)
NYGB 200
Third Party 600
Total 800
Private:Public Dollars 3:1
3:1 private:public dollars does not fully take into account the recycling of capital

End-Use Customer Segment Distribution
Large Commercial & Industrial Mid-Sized Commercial
Residential
Utility-Scale
Small Commercial & Industrial Multifamily
MUSH
Proposals Received
14
Diverse by geography, technology and end-use customer segments
Technology Distribution
Energy Efficiency
Solar
Wind
Biomass
Biogas
Other
Geography Distribution
Capital District
Central New York
Mid Hudson
New York City
Southern Tier
Statewide
Finger Lakes
Not Specified
2

Appendix Sample Transaction Structures (Illustrative Only)
15
Senior Tenor Extension Tax Equity Guaranty Senior Aggregation Facility Project Subordinated Debt Securitization Credit Enhancement
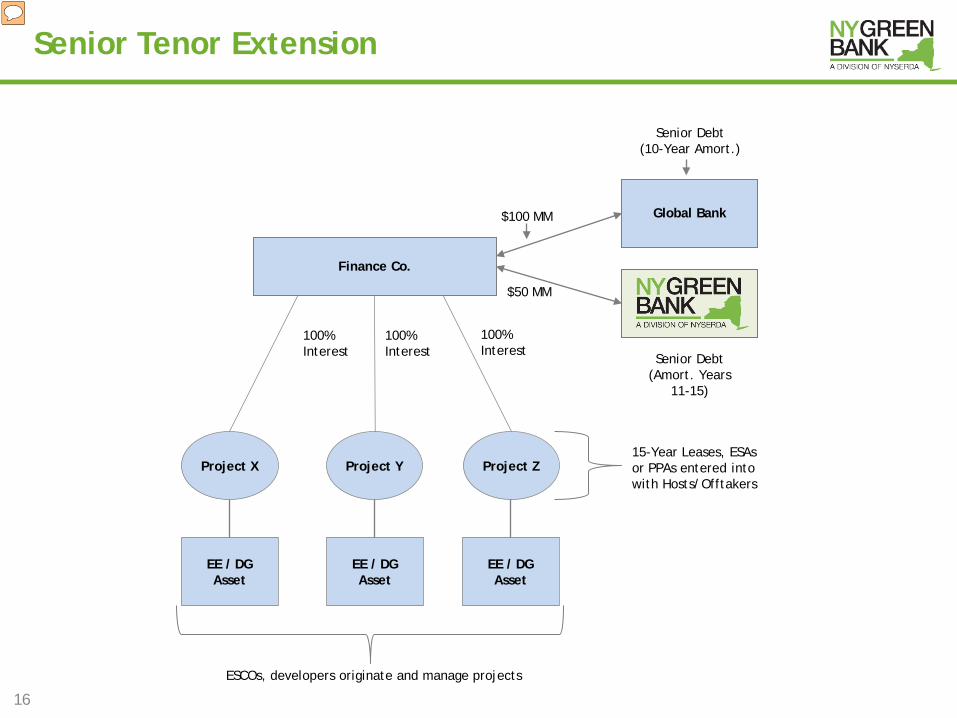
Senior Tenor Extension
16
$100 MM Global Bank
Finance Co.
Senior Debt (10-Year Amort.)
$50 MM
Senior Debt (Amort. Years
11-15)
EE / DG Asset
EE / DG Asset
EE / DG Asset
Project X Project Y Project Z
100% Interest
100% Interest
100% Interest
ESCOs, developers originate and manage projects
15-Year Leases, ESAs or PPAs entered into with Hosts/Offtakers

Tax Equity Guaranty (Small Scale Solar Project)
17
Partial Gty of Lease Pmts
Tax Equity Investor
Developer
On-going lease payments
$10 MM to buy Project
Project
Construction Lender
Gty Fee
Gty Fee Partial Gty of Debt
Service
Construction Financing
Take-out via Tax Equity funding
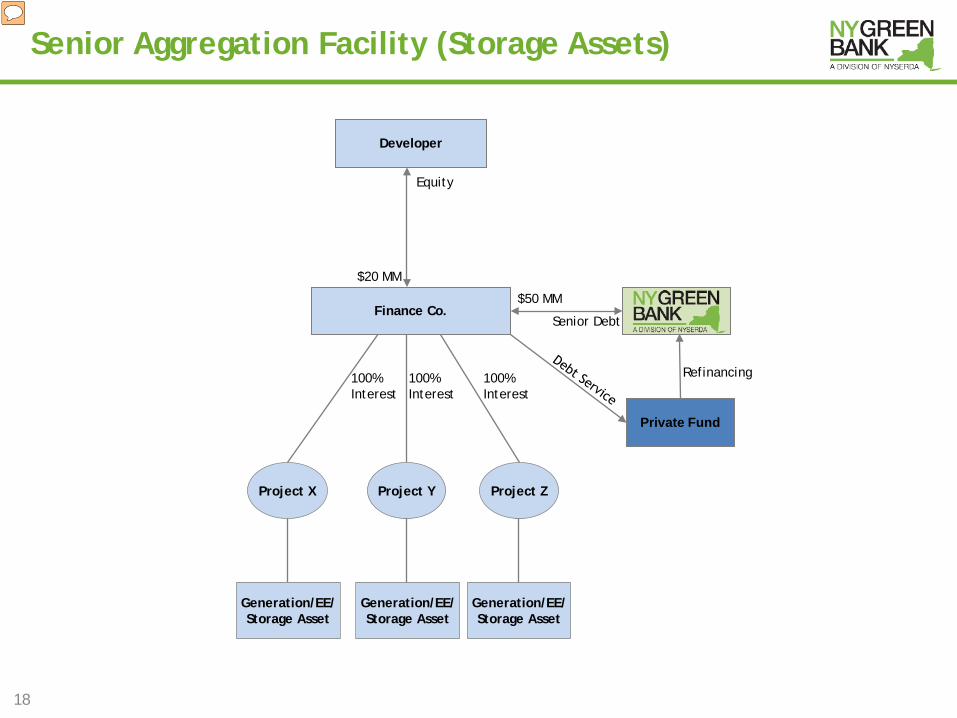
Private Fund
$50 MM
Developer
Finance Co.
Project Y Project Z
Equity
Project X
NY Green Bank Senior Debt
100% Interest
100% Interest
100% Interest
Refinancing
$20 MM
Generation/EE/ Storage Asset
Senior Aggregation Facility (Storage Assets)
18
Generation/EE/ Storage Asset
Generation/EE/ Storage Asset

Project Subordinated Debt (Biomass Feedstock)
19
NY Green Bank
$35 MM
Developer
Project Co.
Equity
Institutional Investors
Senior Debt $50 MM
Generation Assets
Rating Agencies
Investment Bank Advisor
Placement Agent
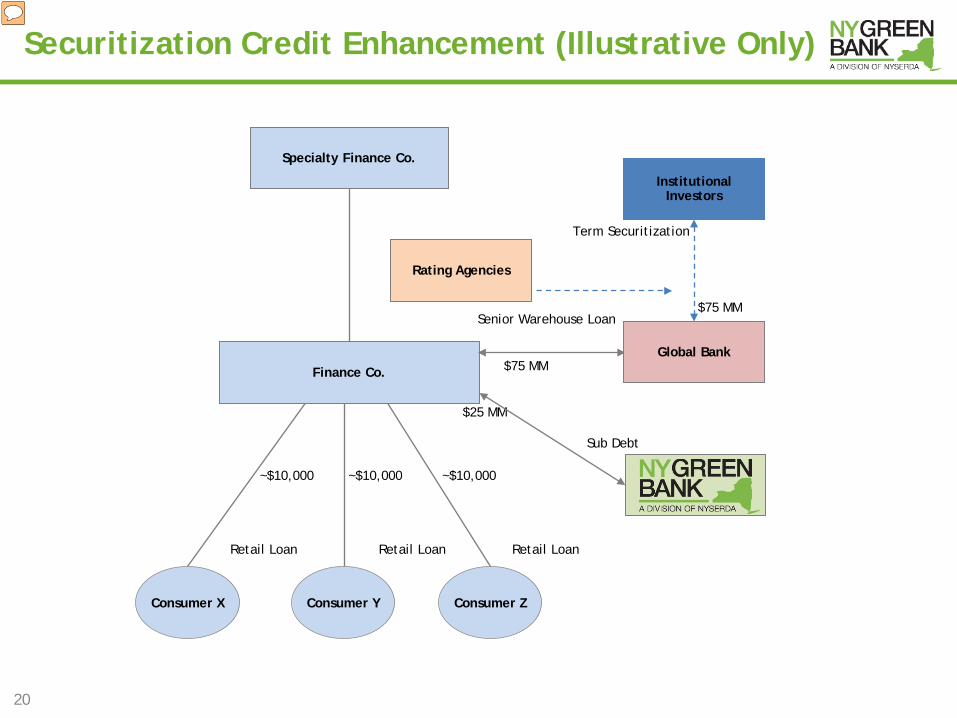
Securitization Credit Enhancement (Illustrative Only)
20
$25 MM
Specialty Finance Co.
Finance Co.
Consumer Y Consumer Z Consumer X
NY Green Bank
Sub Debt
~$10,000 ~$10,000 ~$10,000
Retail Loan Retail Loan Retail Loan
$75 MM
Senior Warehouse Loan
Global Bank
Term Securitization
Institutional Investors
$75 MM
Rating Agencies

20/05/2015 European Investment Bank Group 2
FINANCE FOR CLIMATE ACTION http://www.eib.org/attachments/thematic/climate_action_en.pdf
INNOVATIVE CLIMATE FINANCE PRODUCTS
http://www.eib.org/attachments/thematic/innovative_climate_finance_products_en.pdf


