The role of informal childcare: understanding the research evidence Summary report Caroline Bryson, Bryson Purdon Social Research Mike Brewer, Institute for Social & Economic Research, University of Essex Luke Sibieta, Institute for Fiscal Studies Sarah Butt, NatCen Social Research
Transcript
The role of informal childcare: understanding the research evidence Summary report
Caroline Bryson, Bryson Purdon Social Research
Mike Brewer, Institute for Social & Economic Research, University of Essex
Luke Sibieta, Institute for Fiscal Studies
Sarah Butt, NatCen Social Research
1
Overview This briefing paper summarises what we know about the role that ‘informal childcare’ plays for different families in the UK. As a secondary aim, it highlights where gaps in the evidence hamper our ability to fully assess the impact of informal childcare and makes suggestions for how to plug them. These gaps relate to the role of ‘informal childcare’ in facilitating parental (particularly mothers’) employment, in improving children’s educational and socio-emotional development, and on the lives of those providing the childcare. It draws on work compiled in a full research report ‘The role of informal childcare: a synthesis and critical review of the evidence’, and is intended as a resource for those interested in or working on the formation of policies around childcare, parental paid work and the support of informal carers, particularly grandparents. The full report is available to download from http://www.nuffieldfoundation.org/role-informal-childcare. This summary addresses the following questions – How has over a decade of policy intervention in formal childcare altered the number
and profile of families using informal childcare? Is the demand for informal childcare likely to be sustainable in the future? Is informal childcare something to be encouraged, and is there a government role to
be played in promoting or discouraging its use? What further research is needed to fully address these questions?
We use evidence from new empirical analysis of the Childcare and Early Years Survey of Parents (the ‘Childcare Survey’), the Millennium Cohort Study (MCS), the British Social Attitudes Survey and the Labour Force Survey, as well as drawing on the published quantitative and qualitative evidence1
full report. Throughout the summary, we provide references to
the relevant chapters of the . In Appendix 1, we provide a complete list of the published evidence to which we have referred in the full review.
About the Nuffield Foundation The Nuffield Foundation is an endowed charitable trust that aims to improve social well-being in the widest sense. It funds research and innovation in education and social policy and also works to build capacity in education, science and social science research. The Nuffield Foundation has funded this project, but the views expressed are those of the authors and not necessarily those of the Foundation.
1 The review has tried to look across the UK, but has an inevitable focus on England, in part due to data limitations. We focus mainly on UK evidence but, where appropriate, draw on other literature, largely from the US. At the time of our analysis, we were restricted to using the Childcare Survey data up to 2008. Our analysis of the LFS mirrors the same timeframe.
Defining informal childcare We start by defining what we mean by the term ‘informal childcare’ in this review. A precise definition is not straightforward, particularly as the term is used to mean different things – and sometimes left as a loose definition – in different contexts. It is clear from the evidence that the use of this umbrella grouping is of limited value: informal childcare comprises a heterogeneous group of providers, fulfilling different roles, attracting different parental expectations, and providing varying quality of care. As a result, discussions about the policy implications of using different types of informal childcare are often muddied. In its broadest sense, ‘informal childcare’ is simply the converse of ‘formal childcare’. Formal childcare is childcare which is government-regulated (and studies usually include early years provision within this umbrella term), and can either be paid for by parents (with or without government or employer subsidies) or be provided free at source as part of the entitlement to part-time early years provision. If we take ‘informal childcare’ to be simply the converse of formal childcare, then it is ‘unregulated childcare’, and some studies do define it this way. However, treating all unregulated childcare as ‘informal’ care is not always useful. There is a big difference between childcare provided by non-parental family and friends (e.g. by grandparents or older siblings), and childcare provided by unregistered childminders, unregistered nannies or babysitters. The latter groups are not ‘formal childcare’ providers, in that they are not regulated, and are ineligible for almost all of the funding streams to offset childcare costs. On the other hand, the relationship between provider and parent in some of these cases is more similar to formal childcare than is childcare provided by grandparents, for example. For the purposes of our review, we focus on childcare provided by non-parental family and friends. Our interest is in the ways in which families choose to use informal childcare alongside or instead of formal childcare, and the different effects of using these packages of childcare. For these reasons, we do not include childcare provided by non-resident parents (in separated families) within our definition, in the same way that we have not included ‘shift-parenting’ within two-parent families as a form of childcare. So wherever the evidence allows, we are specific and explicit about which forms or patterns of informal childcare we are discussing. Since, as we show later, grandparents account for such a large proportion of all familial ‘informal’ care, we often find that our capacity to report in detail on other family carers is limited. Most of the evidence does not allow us to look separately at the roles of grandmothers and grandfathers, so we usually talk about grandparents as a whole. However, we know from evidence from the British Social Attitudes Survey series and others on the relative childcare roles of grandmothers and grandfathers that when we report on ‘grandparents’ we are largely referring to the roles played by grandmothers.
3
Our review focuses on how informal childcare is used to facilitate parental work or study. For this reason, we are particularly alert to how parents use informal care that is used ad hoc as well as that which is part of a regular arrangement.
Why is it important to understand the role of informal childcare? In a ‘snapshot’ reference week in 2008, close to three million (2.71m) children, or 30 per cent of children under the age of 15, had been looked after by an ‘informal’ childcare provider. Nearly two million (1.89m) children had been looked after by their grandparents, around a quarter of a million (0.28m) had been cared for by their older siblings, and half a million (0.5m) by a friend or neighbour. In total, informal childcare accounted for 42 per cent of all the hours children in working families spent in childcare (source: Childcare Survey 2008; see Chapter 3 and Chapter ). 4 of the full report These figures highlight the importance of informal childcare in many families. So it is perhaps surprising how little attention it receives from policy makers or in research. This is partly because informal care is often seen purely as a ‘family matter’, and thus not of interest to social policy. However, given how many families use it, we argue that a greater appreciation of how informal childcare is used is important. Who uses it and why? How does it sit alongside the use of formal childcare – to what extent is it used as an alternative to formal care, to what extent as a supplement, and to what extent as a transitional arrangement? How does its availability affect parents’ working lives? Is it a ‘good thing’ for children? How does it affect the lives of providers of informal childcare? This summary highlights some of the key evidence in the full review and, as importantly, it highlights what we do not know at this point in time.
To what extent has over a decade of policy intervention in formal childcare altered the number and profile of families using informal childcare? There are several aspects to this question, addressed in the sub-sections below: What effect has the National Childcare Strategy had on the number of formal
childcare places available? What change has there been in the number and profile of families using formal and
informal childcare? How can we explain the continued high demand for informal childcare?
Further detail on all these points can be found in Chapter . 3 of the full report What effect has the National Childcare Strategy had on the number of formal childcare places available? In 1998, the Labour Government introduced the National Childcare Strategy. Its dual aims were: to improve the employment opportunities for parents, particularly mothers, by making formal childcare more accessible (through financial subsidies to parents and increased provision across the age range); and to improve the life chances of children, both
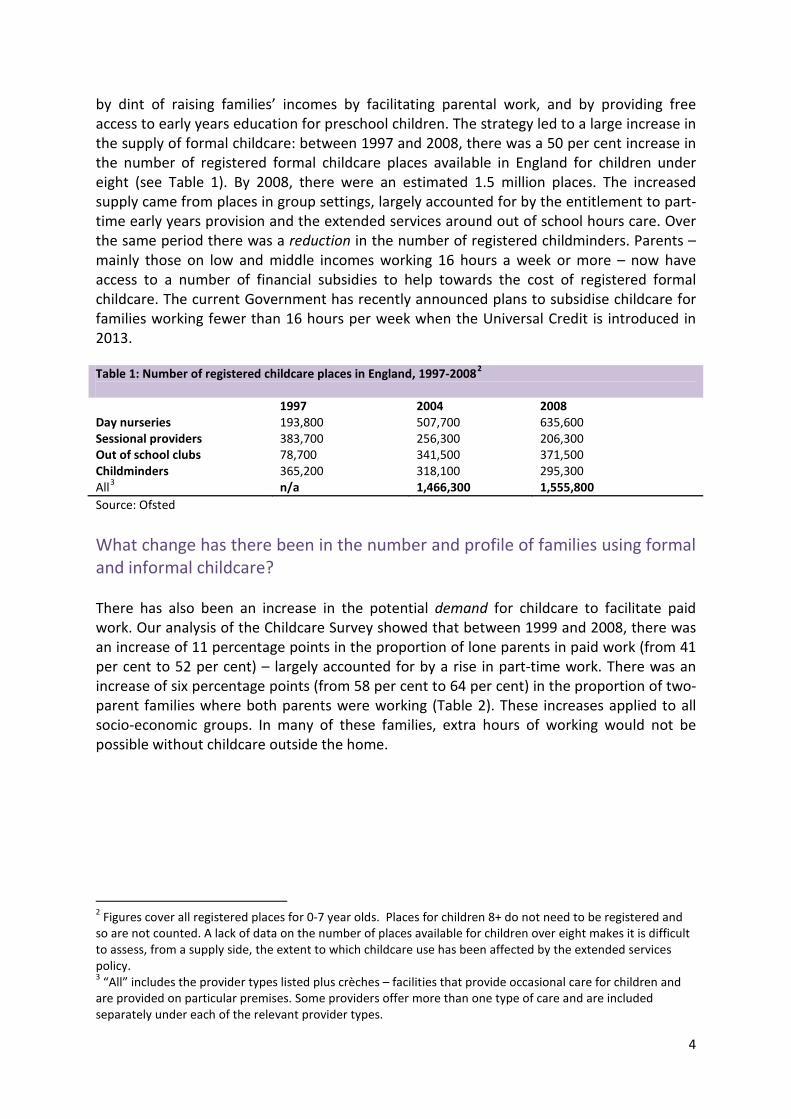
by dint of raising families’ incomes by facilitating parental work, and by providing free access to early years education for preschool children. The strategy led to a large increase in the supply of formal childcare: between 1997 and 2008, there was a 50 per cent increase in the number of registered formal childcare places available in England for children under eight (see Table 1). By 2008, there were an estimated 1.5 million places. The increased supply came from places in group settings, largely accounted for by the entitlement to part-time early years provision and the extended services around out of school hours care. Over the same period there was a reduction in the number of registered childminders. Parents – mainly those on low and middle incomes working 16 hours a week or more – now have access to a number of financial subsidies to help towards the cost of registered formal childcare. The current Government has recently announced plans to subsidise childcare for families working fewer than 16 hours per week when the Universal Credit is introduced in 2013. Table 1: Number of registered childcare places in England, 1997-20082
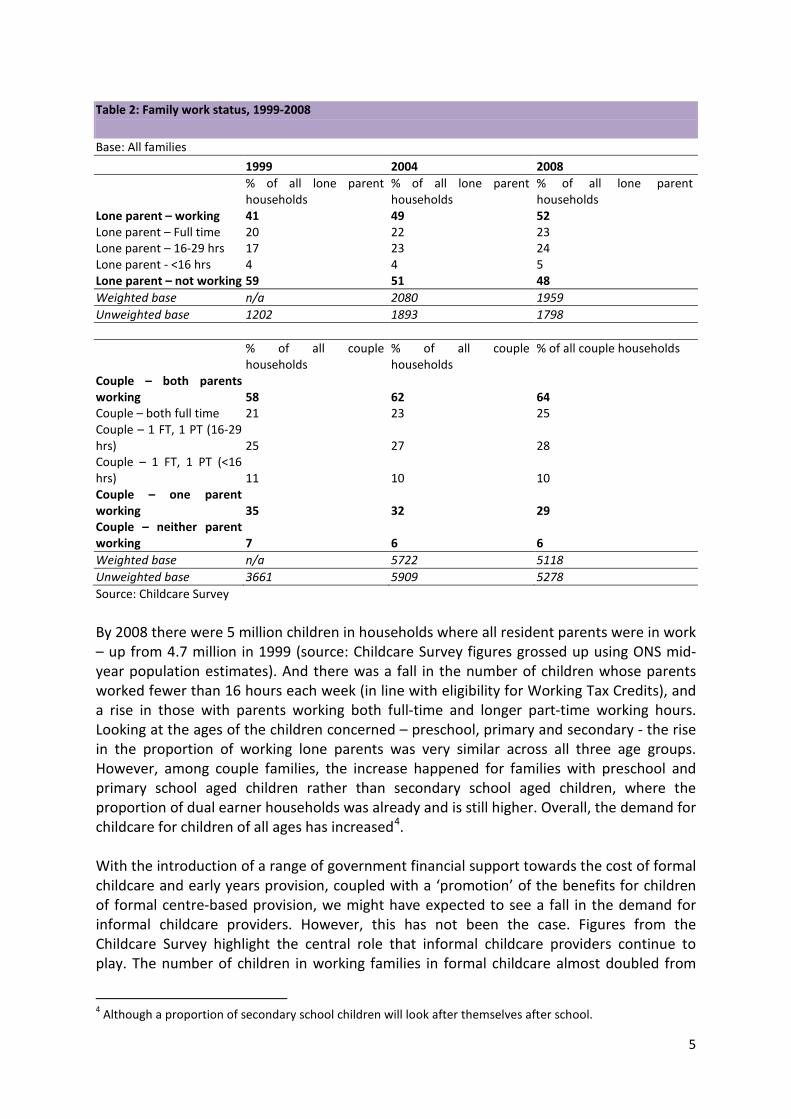
1997 2004 2008 Day nurseries 193,800 507,700 635,600 Sessional providers 383,700 256,300 206,300 Out of school clubs 78,700 341,500 371,500 Childminders 365,200 318,100 295,300 All3 n/a 1,466,300 1,555,800 Source: Ofsted What change has there been in the number and profile of families using formal and informal childcare? There has also been an increase in the potential demand for childcare to facilitate paid work. Our analysis of the Childcare Survey showed that between 1999 and 2008, there was an increase of 11 percentage points in the proportion of lone parents in paid work (from 41 per cent to 52 per cent) – largely accounted for by a rise in part-time work. There was an increase of six percentage points (from 58 per cent to 64 per cent) in the proportion of two-parent families where both parents were working (Table 2). These increases applied to all socio-economic groups. In many of these families, extra hours of working would not be possible without childcare outside the home.
2 Figures cover all registered places for 0-7 year olds. Places for children 8+ do not need to be registered and so are not counted. A lack of data on the number of places available for children over eight makes it is difficult to assess, from a supply side, the extent to which childcare use has been affected by the extended services policy. 3 “All” includes the provider types listed plus crèches – facilities that provide occasional care for children and are provided on particular premises. Some providers offer more than one type of care and are included separately under each of the relevant provider types.
5
Source: Childcare Survey By 2008 there were 5 million children in households where all resident parents were in work – up from 4.7 million in 1999 (source: Childcare Survey figures grossed up using ONS mid-year population estimates). And there was a fall in the number of children whose parents worked fewer than 16 hours each week (in line with eligibility for Working Tax Credits), and a rise in those with parents working both full-time and longer part-time working hours. Looking at the ages of the children concerned – preschool, primary and secondary - the rise in the proportion of working lone parents was very similar across all three age groups. However, among couple families, the increase happened for families with preschool and primary school aged children rather than secondary school aged children, where the proportion of dual earner households was already and is still higher. Overall, the demand for childcare for children of all ages has increased4
.
With the introduction of a range of government financial support towards the cost of formal childcare and early years provision, coupled with a ‘promotion’ of the benefits for children of formal centre-based provision, we might have expected to see a fall in the demand for informal childcare providers. However, this has not been the case. Figures from the Childcare Survey highlight the central role that informal childcare providers continue to play. The number of children in working families in formal childcare almost doubled from
4 Although a proportion of secondary school children will look after themselves after school.
Table 2: Family work status, 1999-2008 Base: All families 1999 2004 2008
% of all lone parent households
% of all lone parent households
% of all lone parent households
Lone parent – working 41 49 52 Lone parent – Full time 20 22 23 Lone parent – 16-29 hrs 17 23 24 Lone parent - <16 hrs 4 4 5 Lone parent – not working 59 51 48 Weighted base n/a 2080 1959 Unweighted base 1202 1893 1798
% of all couple households
% of all couple households
% of all couple households
Couple – both parents working 58 62 64 Couple – both full time 21 23 25 Couple – 1 FT, 1 PT (16-29 hrs) 25 27 28 Couple – 1 FT, 1 PT (<16 hrs) 11 10 10 Couple – one parent working 35 32 29 Couple – neither parent working 7 6 6 Weighted base n/a 5722 5118 Unweighted base 3661 5909 5278
6
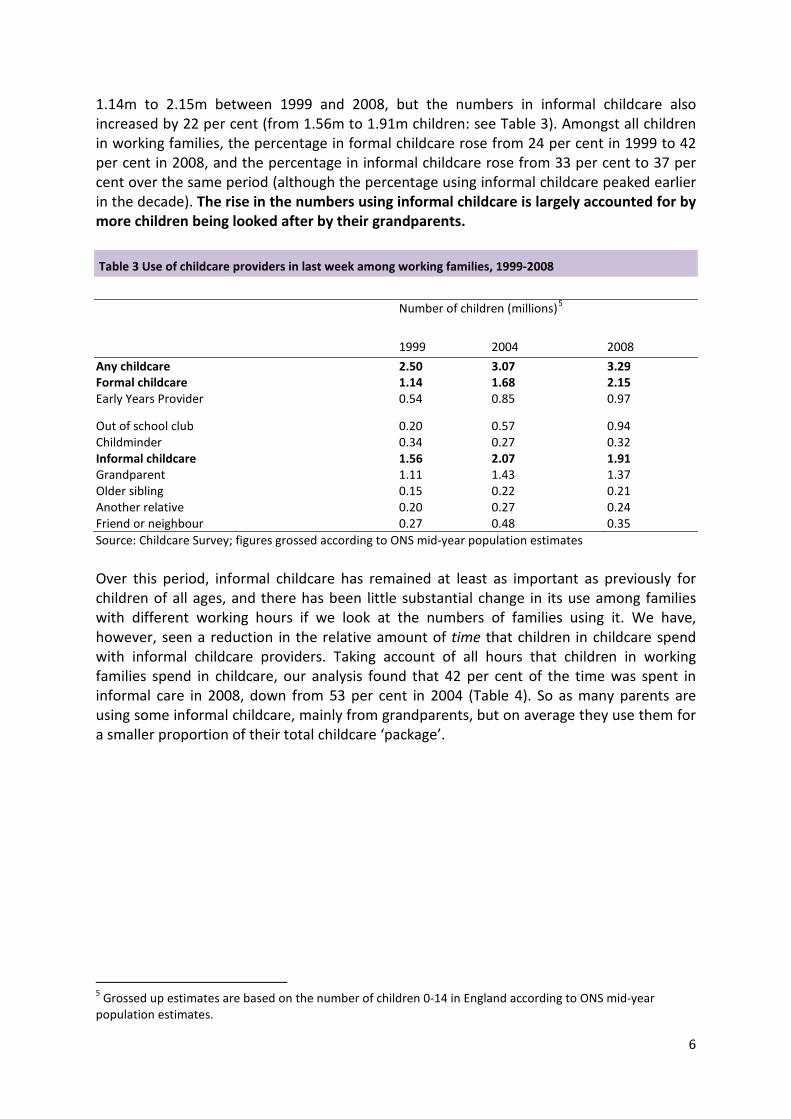
1.14m to 2.15m between 1999 and 2008, but the numbers in informal childcare also increased by 22 per cent (from 1.56m to 1.91m children: see Table 3). Amongst all children in working families, the percentage in formal childcare rose from 24 per cent in 1999 to 42 per cent in 2008, and the percentage in informal childcare rose from 33 per cent to 37 per cent over the same period (although the percentage using informal childcare peaked earlier in the decade). The rise in the numbers using informal childcare is largely accounted for by more children being looked after by their grandparents. Table 3 Use of childcare providers in last week among working families, 1999-2008
Number of children (millions)5
1999 2004 2008 Any childcare 2.50 3.07 3.29 Formal childcare 1.14 1.68 2.15 Early Years Provider 0.54 0.85 0.97
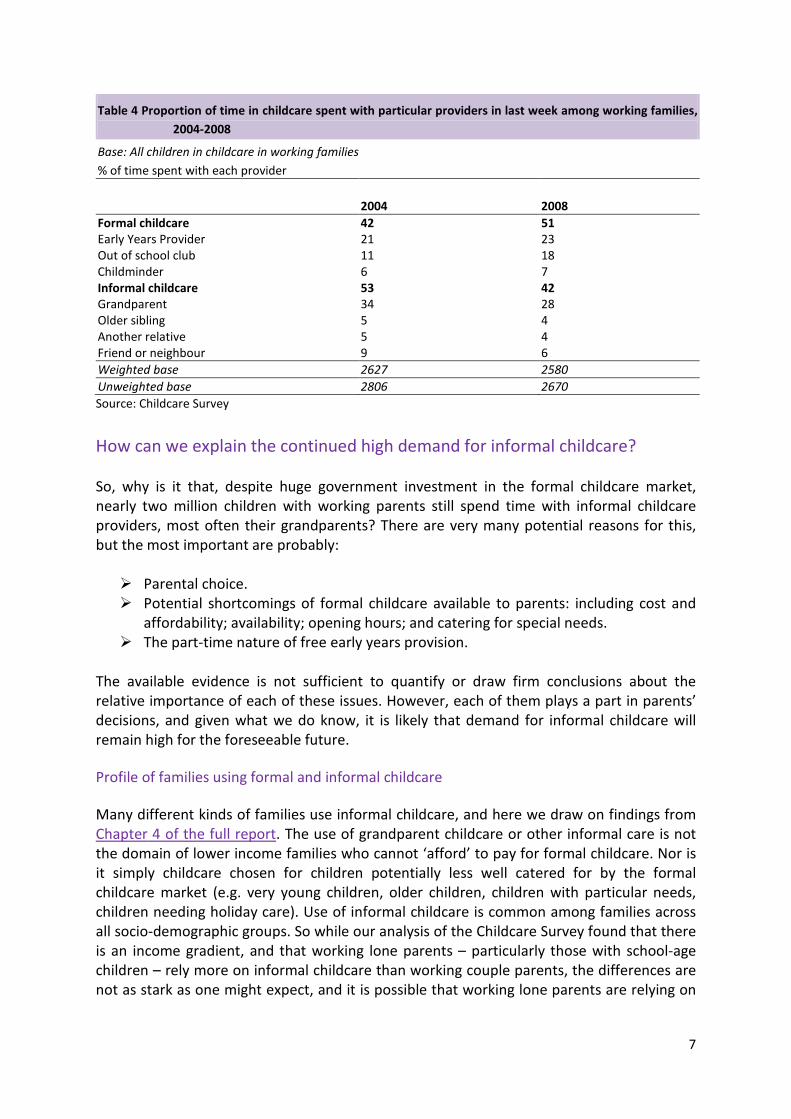
Out of school club 0.20 0.57 0.94 Childminder 0.34 0.27 0.32 Informal childcare 1.56 2.07 1.91 Grandparent 1.11 1.43 1.37 Older sibling 0.15 0.22 0.21 Another relative 0.20 0.27 0.24 Friend or neighbour 0.27 0.48 0.35 Source: Childcare Survey; figures grossed according to ONS mid-year population estimates Over this period, informal childcare has remained at least as important as previously for children of all ages, and there has been little substantial change in its use among families with different working hours if we look at the numbers of families using it. We have, however, seen a reduction in the relative amount of time that children in childcare spend with informal childcare providers. Taking account of all hours that children in working families spend in childcare, our analysis found that 42 per cent of the time was spent in informal care in 2008, down from 53 per cent in 2004 (Table 4). So as many parents are using some informal childcare, mainly from grandparents, but on average they use them for a smaller proportion of their total childcare ‘package’.
5 Grossed up estimates are based on the number of children 0-14 in England according to ONS mid-year population estimates.
7
Table 4 Proportion of time in childcare spent with particular providers in last week among working families, 2004-2008
Base: All children in childcare in working families % of time spent with each provider
2004 2008
Formal childcare 42 51 Early Years Provider 21 23 Out of school club 11 18 Childminder 6 7 Informal childcare 53 42 Grandparent 34 28 Older sibling 5 4 Another relative 5 4 Friend or neighbour 9 6 Weighted base 2627 2580 Unweighted base 2806 2670 Source: Childcare Survey
How can we explain the continued high demand for informal childcare? So, why is it that, despite huge government investment in the formal childcare market, nearly two million children with working parents still spend time with informal childcare providers, most often their grandparents? There are very many potential reasons for this, but the most important are probably: Parental choice. Potential shortcomings of formal childcare available to parents: including cost and
affordability; availability; opening hours; and catering for special needs. The part-time nature of free early years provision.
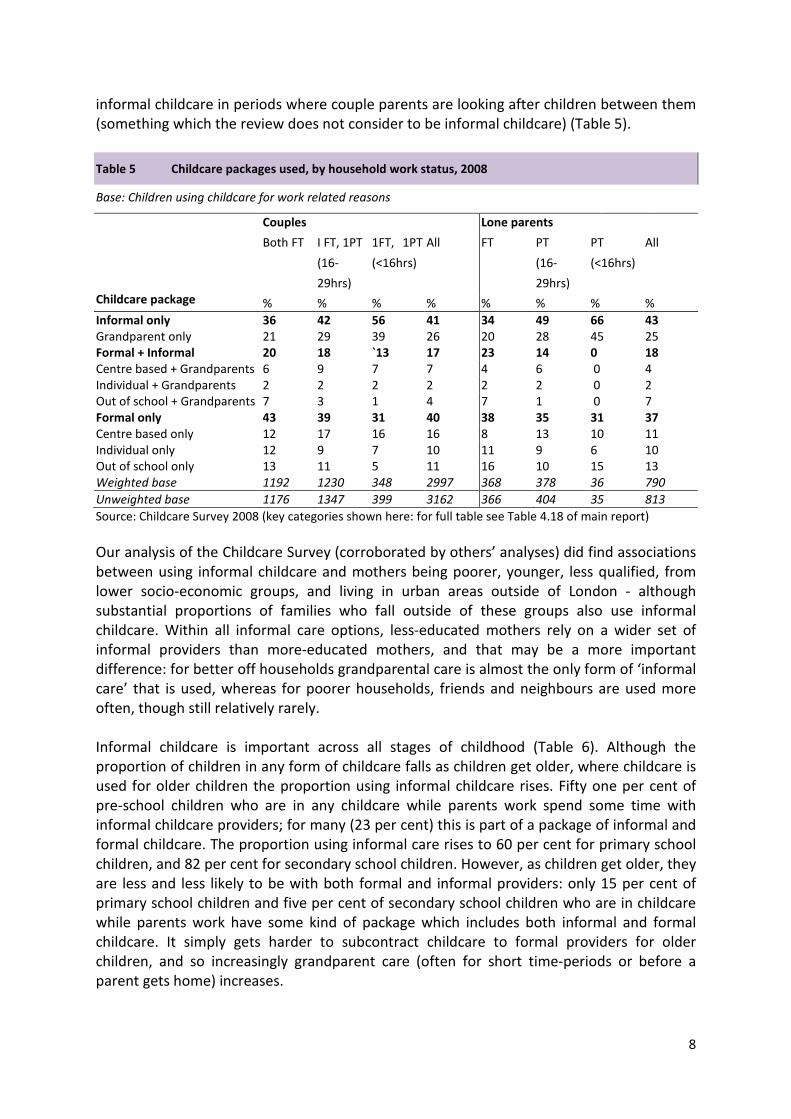
The available evidence is not sufficient to quantify or draw firm conclusions about the relative importance of each of these issues. However, each of them plays a part in parents’ decisions, and given what we do know, it is likely that demand for informal childcare will remain high for the foreseeable future. Profile of families using formal and informal childcare Many different kinds of families use informal childcare, and here we draw on findings from Chapter . The use of grandparent childcare or other informal care is not the domain of lower income families who cannot ‘afford’ to pay for formal childcare. Nor is it simply childcare chosen for children potentially less well catered for by the formal childcare market (e.g. very young children, older children, children with particular needs, children needing holiday care). Use of informal childcare is common among families across all socio-demographic groups. So while our analysis of the Childcare Survey found that there is an income gradient, and that working lone parents – particularly those with school-age children – rely more on informal childcare than working couple parents, the differences are not as stark as one might expect, and it is possible that working lone parents are relying on
informal childcare in periods where couple parents are looking after children between them (something which the review does not consider to be informal childcare) (Table 5). Table 5 Childcare packages used, by household work status, 2008
Base: Children using childcare for work related reasons
Childcare package
Couples Lone parents Both FT I FT, 1PT
(16-29hrs)
1FT, 1PT (<16hrs)
All FT PT (16-29hrs)
PT (<16hrs)
All
% % % % % % % % Informal only 36 42 56 41 34 49 66 43 Grandparent only 21 29 39 26 20 28 45 25 Formal + Informal 20 18 `13 17 23 14 0 18 Centre based + Grandparents 6 9 7 7 4 6 0 4 Individual + Grandparents 2 2 2 2 2 2 0 2 Out of school + Grandparents 7 3 1 4 7 1 0 7 Formal only 43 39 31 40 38 35 31 37 Centre based only 12 17 16 16 8 13 10 11 Individual only 12 9 7 10 11 9 6 10 Out of school only 13 11 5 11 16 10 15 13 Weighted base 1192 1230 348 2997 368 378 36 790 Unweighted base 1176 1347 399 3162 366 404 35 813 Source: Childcare Survey 2008 (key categories shown here: for full table see Table 4.18 of main report) Our analysis of the Childcare Survey (corroborated by others’ analyses) did find associations between using informal childcare and mothers being poorer, younger, less qualified, from lower socio-economic groups, and living in urban areas outside of London - although substantial proportions of families who fall outside of these groups also use informal childcare. Within all informal care options, less-educated mothers rely on a wider set of informal providers than more-educated mothers, and that may be a more important difference: for better off households grandparental care is almost the only form of ‘informal care’ that is used, whereas for poorer households, friends and neighbours are used more often, though still relatively rarely. Informal childcare is important across all stages of childhood (Table 6). Although the proportion of children in any form of childcare falls as children get older, where childcare is used for older children the proportion using informal childcare rises. Fifty one per cent of pre-school children who are in any childcare while parents work spend some time with informal childcare providers; for many (23 per cent) this is part of a package of informal and formal childcare. The proportion using informal care rises to 60 per cent for primary school children, and 82 per cent for secondary school children. However, as children get older, they are less and less likely to be with both formal and informal providers: only 15 per cent of primary school children and five per cent of secondary school children who are in childcare while parents work have some kind of package which includes both informal and formal childcare. It simply gets harder to subcontract childcare to formal providers for older children, and so increasingly grandparent care (often for short time-periods or before a parent gets home) increases.
9
We cannot emphasise enough that the vast majority of informal childcare is done by grandparents rather than by other relatives, friends or neighbours. Among working parents, similar proportions use formal childcare as use informal childcare, but grandparents are used more than twice as often as any other single formal or informal childcare provider.
Source: Childcare Survey 2008 (key categories shown here: for full table see Table 4.6 of main report) Parental choice One likely reason for the continued high demand for informal childcare is that – whatever the financial incentives and government promotion of formal childcare – a substantial number of parents will always choose to ask grandparents and other relatives or friends to look after their children rather than use formal childcare. This is something we discuss in detail in Chapter . Perhaps more precisely, parents choose to organise their working lives by using informal childcare in combination with some formal childcare or early years provision. Unfortunately, this is an issue which is not well explored in the current literature: we rely largely on parents’ retrospective analysis of why they ‘decided’ on different childcare arrangements and the extent to which their choice was constrained by their circumstances (financial, geographic, cultural, etc). Such an approach is particularly problematic when the societal pressure on parents to be seen to be ‘doing the best’ by their children may lead to a degree of post hoc rationalisation about their decisions.
6 of the full report
Surveys like the Childcare Survey suggest that it is very common when deciding on formal or informal childcare, for parents to take into account both the benefits of the care that can be provided, given the available alternatives, and other practical considerations. It is less clear what the key underlying drivers behind their decisions are, and the extent to which they had realistic choices to make between providers. With the available data, we are far from being
Table 6 Use of childcare providers for work related reasons in past week, by child’s age, 2008
Base: All children 0-14 using childcare for work related reasons
able to quantify this. Our own analysis of the Childcare Survey suggests that the majority of parents said that they positively chose their childcare on the basis of the environment that it can offer (with informal providers chosen for offering ‘a caring environment’). However, a majority6
also talked about taking account of practical issues such as convenience and cost. There is evidence from the Childcare Survey to suggest that many parents choose informal childcare without taking into consideration the option of using formal childcare. When asked about the affordability, availability and quality of formal childcare locally, around a quarter of parents using only informal childcare answered ‘don’t know’ to these questions.
Findings from qualitative studies7
add to the survey data by providing more detail on parents’ thinking. Many parents stress the potential for informal childcare arrangements to have positive effects on the well-being of parents and grandparents and on the closeness of family relations. However, they also highlight the potentially negative consequences that some parents take into consideration, with lone parents voicing concerns over family and friends feeling obliged to help, and of grandparents interfering with their own childrearing practices.
Potential shortcomings of formal childcare available to parents In this section, we focus on what the evidence can tell us about the extent to which parents’ use of informal childcare is connected with failures in the formal childcare market. Again, the evidence is rather patchy. We start with the issue of cost and affordability of childcare and then turn to other practical issues such as availability; opening hours; catering for special needs; and suitability for older children. Although the evidence indicates that cost is far from being the only driver of the use of informal childcare, it is clearly at least a contributing factor for a proportion of families. Working families with lower incomes are more likely than those with higher incomes to use informal childcare (see Chapter ). Cost was a contributing factor for just under half of children whose main childcare provider was informal, although nine out of ten also took account of the providers’ caring role (
4
see Chapter ). The Childcare Survey provides some further evidence that cost is a key factor in the use of informal childcare. Around six in ten parents who use only informal childcare cited the fact that their childcare was free or cheap when asked what is was about their childcare that enabled them to work. Despite substantial government intervention in the formal childcare market, only a minority of parents think that the local childcare available to them is affordable, and there has been little change in that view in the period between 2004 and 2008 (Table 7).
6
6 In the Childcare Survey, parents were able to give more than one reason for choosing their provider. 7 eg Wheelock and Jones (2002); Bell et al (2005); Skinner and Finch (2006).
Table 7 Perceptions of the affordability of childcare provision 2004-2008, by age of child
Base: All families using childcare in past year Pre-school Primary school Secondary school All 2004 2008 2004 2008 2004 2008 2004 2008 % % % % % % % % Very good 8 7 7 5 4 3 7 6 Fairly good 34 33 28 30 22 20 30 30 Fairly poor 27 24 24 21 22 18 25 22 Very poor 13 16 12 15 9 15 12 15 Not sure 19 20 29 28 43 43 26 27 Weighted base 3077 3010 2788 2888 839 1178 6704 7075 Unweighted base 3859 3784 2521 2627 523 663 6903 7074 Source: Childcare Survey Overall, the use of informal childcare does not appear to be related to parents’ perceptions about the availability of formal childcare places in their local area. Indeed, our analysis of the Childcare Survey found parents using informal childcare are less likely to report that there are too few places (e.g. 35 per cent of those using only informal childcare compared to 45 per cent of those using only formal childcare), though this may reflect more the unmet demand felt by parents who are using formal care. The fact that a substantial minority of parents who only use informal care do not know about the availability of formal childcare suggests that for them formal provision is not always relevant. (See Chapter of the full report for further discussion of this). However, there is evidence of shortfalls in the particular situations where parents often turn to informal childcare.
6
Parents working or studying outside of the standard working week rely heavily on
informal childcare – particularly on grandparents. Mothers who worked and used childcare during non-standard hours found childcare a problem, particularly in the early mornings and evenings (32 per cent of mothers working these times reported problems with finding childcare). But those using informal childcare were far less likely to have these problems (e.g. they were half as likely as those using formal providers to have problems with evening provision). Childcare for parents working in non-standard hours is discussed further in Chapter of the full report. 5
Likewise, reliance on informal childcare increases during school holidays. Table 8 shows the proportion of school-age children, split into three age groups, in different childcare arrangements during school holidays. Among each age group, the proportions in informal childcare alone (usually involving grandparents) are about ten percentage points higher in the holidays than in term time. We do not have the data to know whether parents would choose different arrangements were formal childcare more available or affordable during school holidays. But we do know that around a third of parents find affordable and flexible holiday childcare a problem. Those who end up with a mix of formal and informal childcare experience most difficulties, suggesting that they had to choose a combination ‘to make things work’. Further discussion of holiday provision can be found in Chapter . 4 of the full report
Table 8 Childcare packages used in school holidays, by age of children in household
Base: all families with school-age children and using childcare for work related reasons in holidays
Childcare package 5 to 7 8 to 11 12 to 14 % % %
Informal only 41 55 68 Grandparent only 24 32 32 Grandparent + other informal 10 11 18 Formal + Informal 24 19 13 Centre based + Grandparents 5 1 1 Individual + Grandparents 6 4 2 Out of school club + grandparents 7 9 7 Formal only 32 23 16 Centre based only 7 2 2 Individual only 9 7 6 Out of school only 11 12 8 Weighted base 736 927 584 Unweighted base 859 947 567 Source: Childcare Survey 2008 (key categories shown here: for full table see Table 4.24 of main report) Although the Childcare Survey data do not show disproportionate use of informal care
among parents with children with special educational needs or disabilities (SEND), several studies report on the shortcomings of formal childcare for these families (e.g. Kagan et al, 1999, Contact a Family, 2002, Smith et al, 2010). In recent years, Government has made attempts to improve the availability of suitable childcare to these families, but the impact of some of these initiatives is not yet known. Meanwhile, there is limited evidence to suggest that while some families with disabled children do rely heavily on informal childcare, others, especially those with ‘high demand’ children find it is not possible or appropriate to do so (e.g. Daycare Trust, 2007). See Chapter
for more details. 5 of the
full report There are differences in the use of informal (and formal) childcare between white
families and particular minority ethnic groups, which could reflect differences in cultural attitudes to the role of mothers and the appropriateness of familial care, differences in the propensity to be a lone parent or couple family, geographical differences, or differences in the availability of informal childcarers. All of these factors contribute to the differential use of different providers, but there is insufficient survey evidence (with relatively small sample sizes in the Childcare Survey; see Kazimirski et al, 2006) to quantify the relative influence of each. Among children who are in childcare while their parents to work, Asian children are more likely to be cared for solely by informal carers (including a range of relatives or friend), but white children are more likely than others to be looked after solely by their grandparent (28 per cent). Six in ten black children rely solely on formal care. Childcare for families from minority ethnic backgrounds is further discussed in Chapter . 5 of the full report
Student parents can have particular need to call on informal childcare providers. With fewer childcare subsidies available to them than working parents (and the fact that by dint of studying they are not in paid work, or at most working part-time), the need for
low or no cost childcare is an issue. Likewise, the nature of some students’ study requires out-of-hours, flexible childcare of a nature most often provided by informal rather than formal providers. See Chapter . 5 of the full report
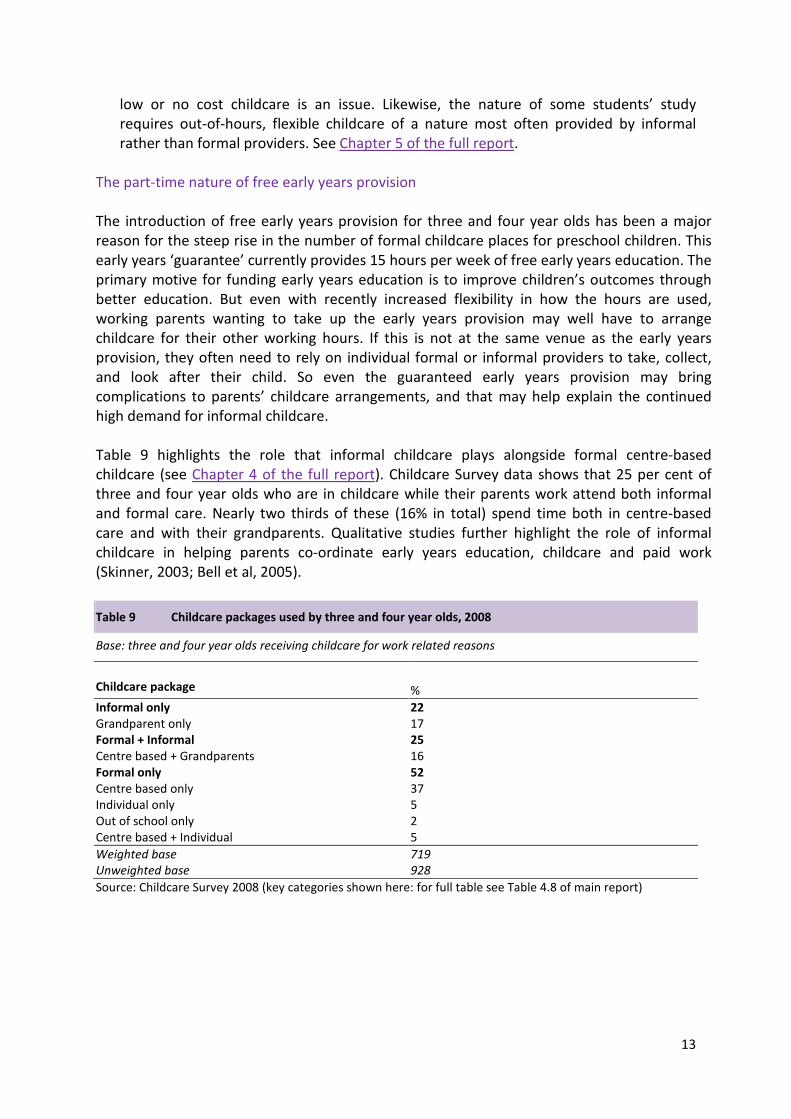
The part-time nature of free early years provision The introduction of free early years provision for three and four year olds has been a major reason for the steep rise in the number of formal childcare places for preschool children. This early years ‘guarantee’ currently provides 15 hours per week of free early years education. The primary motive for funding early years education is to improve children’s outcomes through better education. But even with recently increased flexibility in how the hours are used, working parents wanting to take up the early years provision may well have to arrange childcare for their other working hours. If this is not at the same venue as the early years provision, they often need to rely on individual formal or informal providers to take, collect, and look after their child. So even the guaranteed early years provision may bring complications to parents’ childcare arrangements, and that may help explain the continued high demand for informal childcare. Table 9 highlights the role that informal childcare plays alongside formal centre-based childcare (see Chapter ). Childcare Survey data shows that 25 per cent of three and four year olds who are in childcare while their parents work attend both informal and formal care. Nearly two thirds of these (16% in total) spend time both in centre-based care and with their grandparents. Qualitative studies further highlight the role of informal childcare in helping parents co-ordinate early years education, childcare and paid work (Skinner, 2003; Bell et al, 2005).
4 of the full report
Table 9 Childcare packages used by three and four year olds, 2008
Base: three and four year olds receiving childcare for work related reasons
Childcare package %
Informal only 22 Grandparent only 17 Formal + Informal 25 Centre based + Grandparents 16 Formal only 52 Centre based only 37 Individual only 5 Out of school only 2 Centre based + Individual 5 Weighted base 719 Unweighted base 928 Source: Childcare Survey 2008 (key categories shown here: for full table see Table 4.8 of main report)
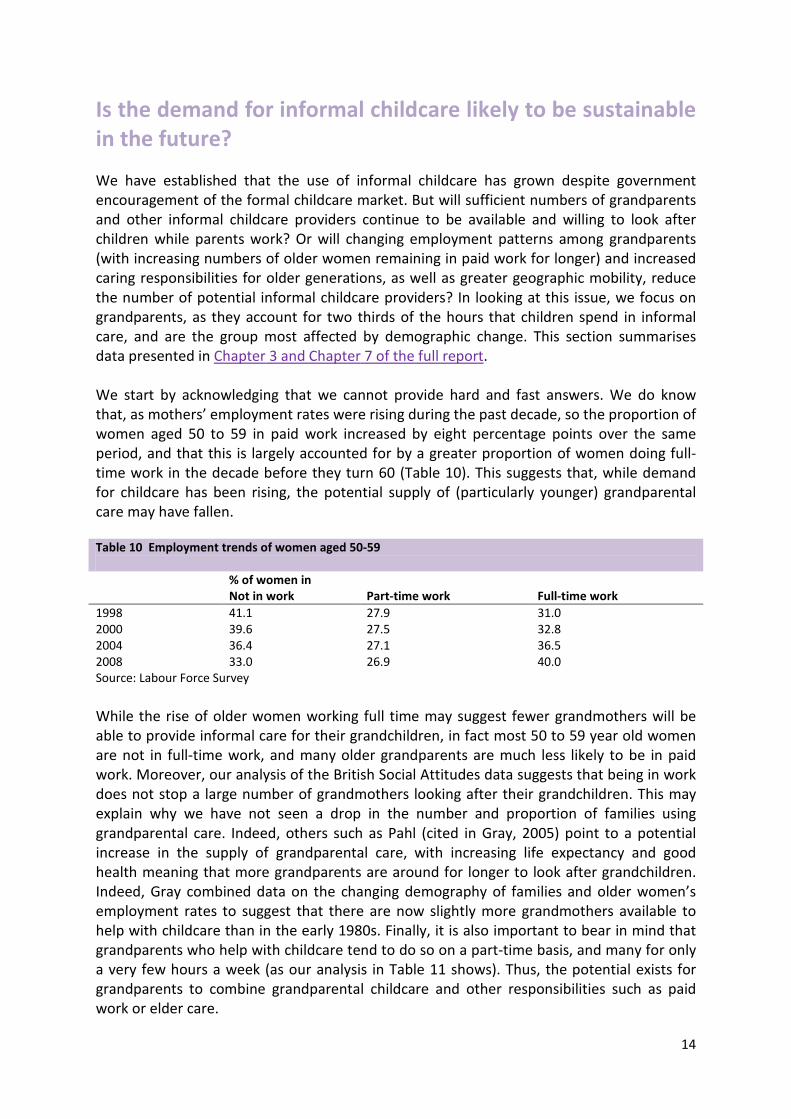
Is the demand for informal childcare likely to be sustainable in the future? We have established that the use of informal childcare has grown despite government encouragement of the formal childcare market. But will sufficient numbers of grandparents and other informal childcare providers continue to be available and willing to look after children while parents work? Or will changing employment patterns among grandparents (with increasing numbers of older women remaining in paid work for longer) and increased caring responsibilities for older generations, as well as greater geographic mobility, reduce the number of potential informal childcare providers? In looking at this issue, we focus on grandparents, as they account for two thirds of the hours that children spend in informal care, and are the group most affected by demographic change. This section summarises data presented in Chapter 3 and Chapter . 7 of the full report We start by acknowledging that we cannot provide hard and fast answers. We do know that, as mothers’ employment rates were rising during the past decade, so the proportion of women aged 50 to 59 in paid work increased by eight percentage points over the same period, and that this is largely accounted for by a greater proportion of women doing full-time work in the decade before they turn 60 (Table 10). This suggests that, while demand for childcare has been rising, the potential supply of (particularly younger) grandparental care may have fallen. Table 10 Employment trends of women aged 50-59 % of women in
Not in work Part-time work Full-time work 1998 41.1 27.9 31.0 2000 39.6 27.5 32.8 2004 36.4 27.1 36.5 2008 33.0 26.9 40.0 Source: Labour Force Survey While the rise of older women working full time may suggest fewer grandmothers will be able to provide informal care for their grandchildren, in fact most 50 to 59 year old women are not in full-time work, and many older grandparents are much less likely to be in paid work. Moreover, our analysis of the British Social Attitudes data suggests that being in work does not stop a large number of grandmothers looking after their grandchildren. This may explain why we have not seen a drop in the number and proportion of families using grandparental care. Indeed, others such as Pahl (cited in Gray, 2005) point to a potential increase in the supply of grandparental care, with increasing life expectancy and good health meaning that more grandparents are around for longer to look after grandchildren. Indeed, Gray combined data on the changing demography of families and older women’s employment rates to suggest that there are now slightly more grandmothers available to help with childcare than in the early 1980s. Finally, it is also important to bear in mind that grandparents who help with childcare tend to do so on a part-time basis, and many for only a very few hours a week (as our analysis in Table 11 shows). Thus, the potential exists for grandparents to combine grandparental childcare and other responsibilities such as paid work or elder care.
Table 11 Average number of hours per week that grandparents look after grandchildren
Base: All grandparents who ever look after grandchildren
Grandfathers Grandmothers Grandparents Fewer than 5 hours 49 34 41 5 to 9 hours 15 18 17 Varies but usually less than 10 hours each week 12 14 13
10 to 34 hours 15 21 18 35 hours a week or more 4 4 4 Varies but usually more than 10 hours each week 3 4 4
Lives with grandchild 2 3 3 Don’t know 0 1 1 Weighted base 226 286 509 Unweighted base 227 330 557 Source: British Social Attitudes 2009 A number of studies8
discuss the fact that, while most grandparents say they enjoy looking after their grandchildren and helping their own children, some grandparents feel it is more of a sacrifice of their own social life or employment, and express tensions about how their expectations differed from their children’s. Although there is little expectation of pay there is evidence that grandparental care brings expectations of reciprocity in other ways, though these are often implicit rather than explicit.
Is informal childcare something to be encouraged, and is there a government role to be played in promoting or discouraging its use? This section covers two questions: What can the research evidence tell us about the educational and socio-emotional
development of children looked after by informal providers versus those in formal childcare?
Are there reasons that the state should be involved in the support of informal childcare users and providers?
What can the research evidence tell us about the educational and socio-emotional development of children looked after by informal providers versus those in formal childcare? Underpinning the previous government’s strategy to develop access to formal, largely group-based, childcare and early years provision was the belief that this will improve the life chances of young children. It draws on much-cited evidence (notably the body of work
8 eg Wheelock and Jones, 2002, Mooney and Statham, 2002; Arthur et al, 2003
16
based on the UK Effective Provision of Preschool Education Study, such as Sylva et al 2004) on the effects of good quality, early years provision on children’s educational development. EPPE has shown that time spent in high quality, formal, group early years settings can enhance children’s development, particularly for children from more disadvantaged backgrounds. There is now some UK evidence from EPPE of the longevity of impact (Sammons et al, 2007). In line with the EPPE findings, Smith et al’s (2009b) evaluation for DfE of the Early Education Pilot for Two Year Old Children found positive benefits of good quality, part-time provision for two year olds from disadvantaged backgrounds9
.
However, since large numbers of families will continue to use grandparents and other forms of informal childcare, either in conjunction with or instead of formal provision, there are questions about how exposure to different forms of informal childcare are associated with children’s educational and socio-emotional development. If families choose – or, indeed, have no choice but to – use informal childcare, what effect might this have on their children, compared to using formal provision? And does this vary by family background, the hours spent in different forms of childcare and, indeed, by the quality of the informal childcare provided? We recognise that, at least for children aged three and over, questions about the potential benefits, or drawbacks, of informal provision are arguably different from those we might ask about formal provision. The vast majority of three and four year olds spend a substantial number of hours in early years provision, and older children are in school for the bulk of the term-time day. Thus, for these children, time spent with informal providers is usually in addition to educational provision and socialising with children of the same age. What these children need, and what their parents want, from informal provision may not be the same as we expect from early years providers and schools – or from a childcare environment which is not experienced alongside hours of education. For this reason we, and most other researchers, have focused on the associations between childcare in the early years of a child’s life and their development. We have drawn on the evidence from the UK and, where appropriate, the US, to explore the associations between exposure to different forms of childcare and children’s educational and socio-emotional development. UK evidence comes largely from four studies: the Millennium Cohort Study, the Avon Longitudinal Study of Parents and Children (ALSPAC), the Family, Children and Child Care Project, and Growing Up in Scotland (GUS). Much of the US evidence draws on the NICHD Study of Early Childcare and Youth Development. In this summary, we focus most heavily on the work of Hansen and Hawkes (2009) and our own analysis, both using the Millennium Cohort Study (MCS). Despite some differences in the detailed results, the broad messages are replicated in other UK work (e.g. CMPO, 2006, using ALSPAC data) and in the US (e.g. NICHD Early Child Care Research Network, 2004). Most of the available evidence is based on non-experimental, longitudinal cohort studies. This means that we can report on associations between informal childcare and children’s outcomes, but cannot provide hard
9 Note, they found no statistically significant differences comparing all children taking up the provision with a comparison group of children outside of the pilot areas, but found a positive impact on vocabulary development in children in pilot areas in higher quality settings.
17
evidence about causation: we cannot attribute with certainty particular outcomes as being a direct result of the childcare provision10
.
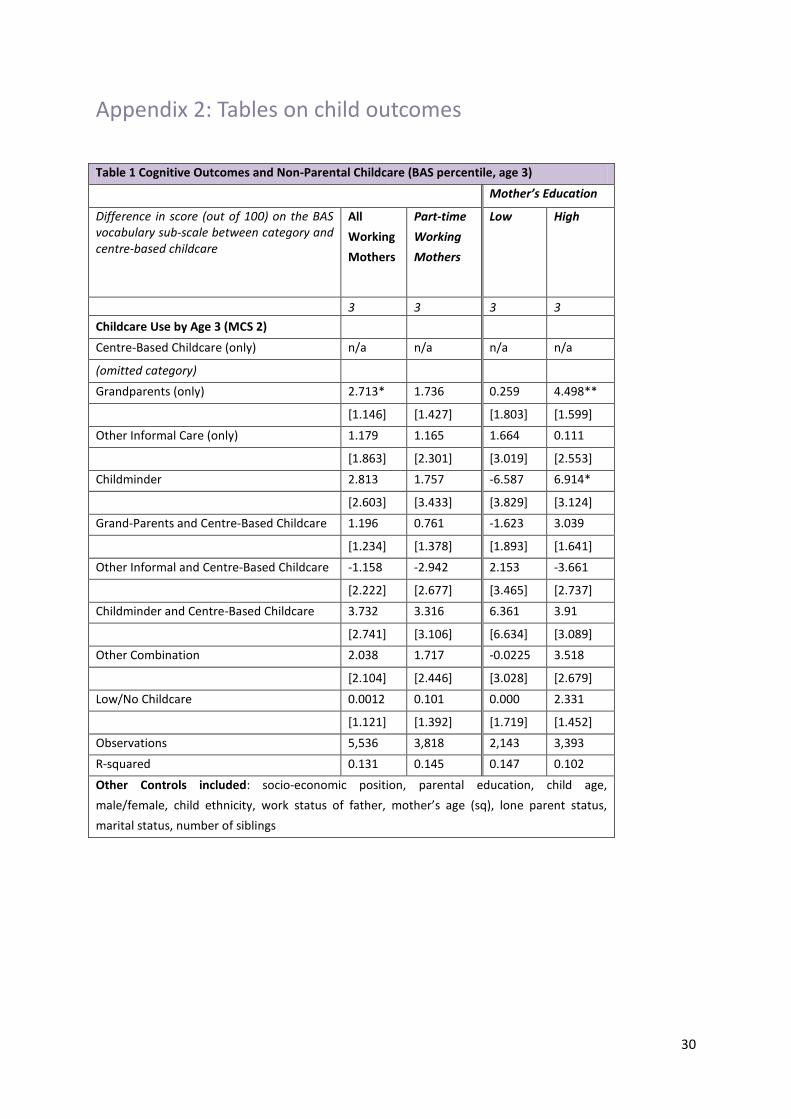
The UK evidence around the link between informal childcare and developmental outcomes is not clear cut. The picture is muddied by the fact that different longitudinal studies use different educational outcome measures, and vary in the extent to which they take account of the amount of time that children spend in different forms of care, their socio-demographics and so forth. However, from the overall pattern of results, it seems clear that – if there are associations between using informal childcare and children’s development – they are not very large. Chapter provides further detail on the associations between the use of different forms of childcare and children’s development, including a discussion of the quality of care. And, for ease of reference, in Appendix 2, we provide some of the more detailed findings from our own analysis.
8 of the main report
Educational outcomes We, and Hansen and Hawkes, used two measures to look at the associations between the use of different forms of childcare and children’s educational outcomes: vocabulary development, using the British Ability Scales (BAS) naming vocabulary sub-scale; and school readiness, using six subtests of the Revised Bracken Concept Scale. Hansen and Hawkes (2009) measured associations between childcare used at nine months and children’s development at age three. Our own analysis takes account of childcare used between the ages of one and three, and measures children’s development at ages three and five. So, in combination, these two analyses allow us to report on whether childcare used before the age at which children are eligible for free part-time early years education appears to be associated with differential rates of development. While Hansen and Hawkes look at the child’s ‘main’ source of childcare, we took account of packages of childcare and, in doing so, were able to look at the effect of combining different types. The MCS data do not provide enough information on childcare hours to examine the association between outcomes and the intensity of childcare usage. However, we are able to observe whether mothers worked full or part-time, and this latter group might be expected to use childcare for fewer hours, on average. Both we and Hansen and Hawkes focused on children with working mothers. One important point to note is that, in our analyses, we cannot take account of the quality of the childcare that the children were receiving, whether formal or informal. Given evidence from previous studies (e.g. Sylva et al, 2004; Smith et al, 2009b) that higher quality formal provision is associated with the greatest positive impacts on children’s outcomes, our inability to take account of quality is something to bear in mind in the interpretation of our findings. Overall, analysis of the MCS suggests that children living in more advantaged households11
10 There are no experimental studies in the UK, such as the US Perry Preschool randomised control trial of early years’ provision, which measure the impact. The evaluation of the Early Education Pilot for Two Year Old Children used a quasi-experimental design to measure medium-term outcomes at a single point in time, but focused on a particular age group and did not look in any detail at informal childcare.
who are looked after by their grandparents rather than in formal centre-based care
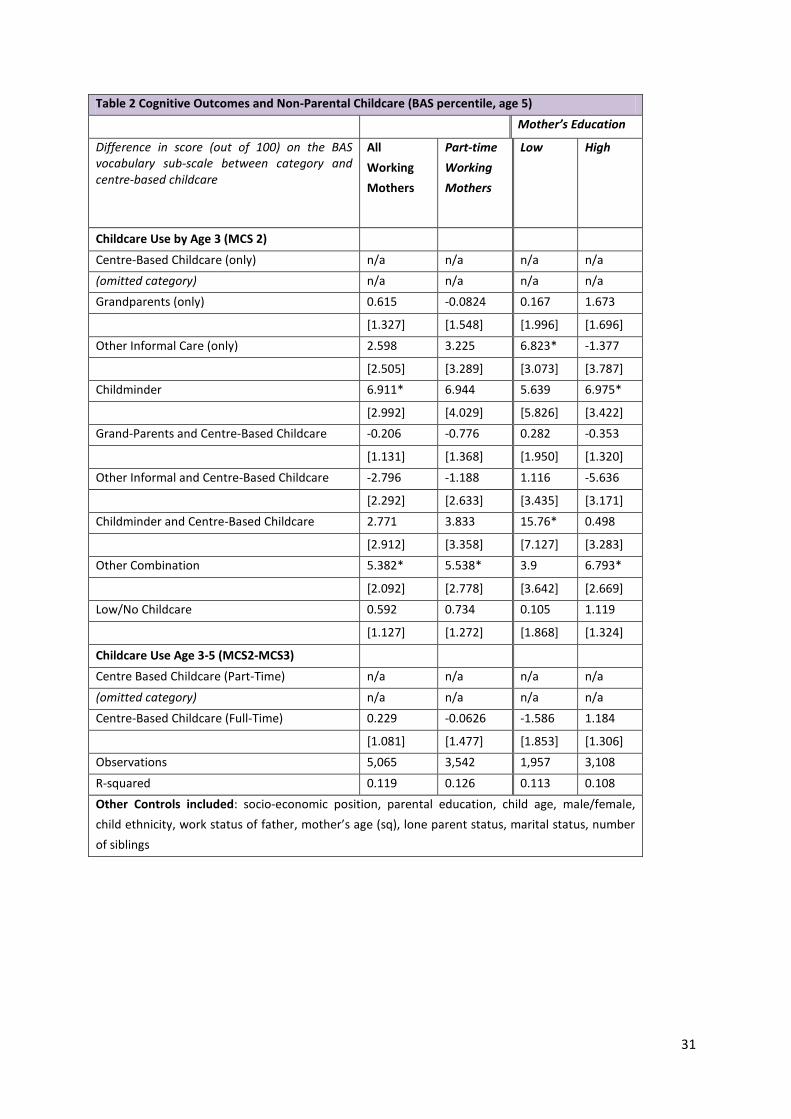
develop slightly better in terms of vocabulary. By the age of three, they were significantly further ahead than children in centre-based care, both if we look at care at nine months, or over the period up to the age they were three. For children in less advantaged families, there is no evidence to suggest that being in grandparental care disadvantages children in comparison to children in centre-based care but unlike more advantaged families, it did not put them further ahead. Although Hansen and Hawkes found that children looked after by other informal carers, or by their fathers or mothers’ partners, at the age of nine months were doing less well in terms of vocabulary development, this was not replicated in our analyses of childcare used between the ages of one and three, suggesting that any effect may have been short-lived. We found no significant association between grandparental care and vocabulary scores for children whose mother works part-time, who may be using informal childcare at lower levels of intensity. (See Appendix 2, Table 1.) Hansen and Hawkes found that children looked after by their grandparents were less ready for school than those in formal centre-based care (but as ready as children in other forms of care). However, in our analysis we found no statistically significant differences in the levels of school readiness of children in different childcare arrangements between the ages of one and three. In addition, our results show little significant association between using different forms of informal childcare between the ages of one and three, and age five vocabulary or school readiness scores. In other words, if there was an earlier effect, then it disappears after two years of early years provision. (See Appendix 2, Table 2 and Chapter
) 8 of main report for
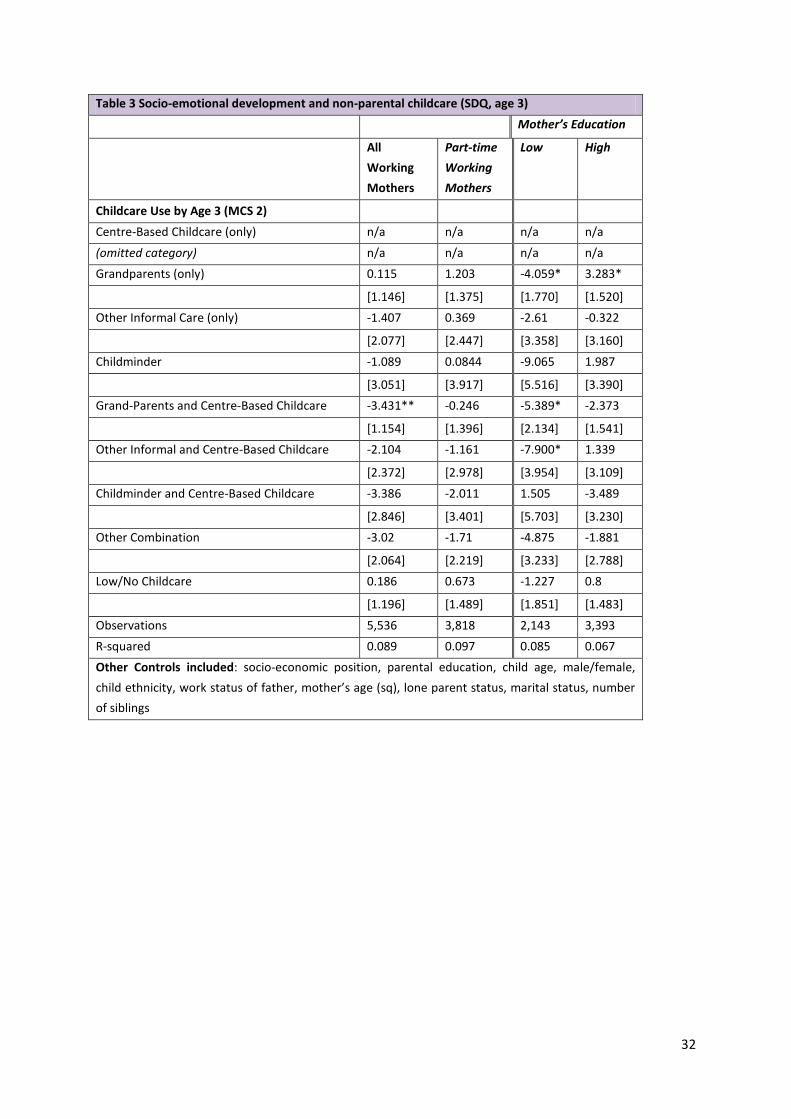
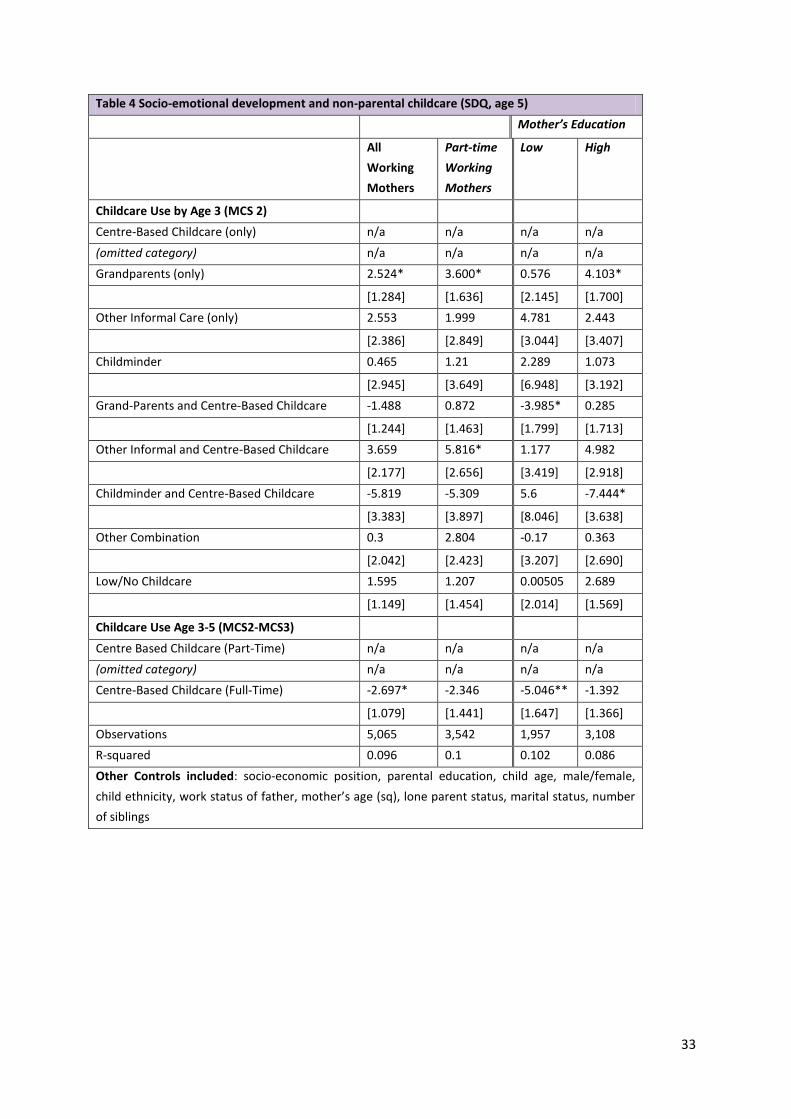
more details. Socio-emotional outcomes Using Goodman’s Strengths and Difficulties Questionnaire, Hansen and Hawkes found a small association between children having more negative peer relationships and being looked after by grandparents, especially among boys, and especially among families from more disadvantaged backgrounds. This finding has been backed up by work done using ALSPAC by Fergusson, Maughan and Golding. Looking at childcare used between the ages of one and three, we found a similar pattern to that identified by Hansen and Hawkes for children from less educated backgrounds, but found a positive association between socio-emotional development and being looked after by grandparents among more educated families. This was still apparent when the children reached age five, whereas the negative association among children in less educated families had disappeared once they had spent time as three and four year olds in early years provision (see Appendix 2, Tables 3 and 4 and Chapter for more details). 8 of main report Therefore, it would appear that there are some advantages, and certainly few disadvantages to children being looked after by grandparents, or other informal childcare providers, in the first three years of life – either solely or in combination with formal childcare. By the time children have spent time in early years provision, any associations between their 11 In Hansen and Hawkes, according to their mothers’ education, benefit receipt or single versus couple households according to their mothers’ education, benefit receipt or single versus couple households; in our own analysis according to only mothers’ education.
outcomes and childcare they experienced earlier disappear. We have some very limited evidence (looking at part-time versus all working mothers) that the intensity of the provision might influence the size of this association. So we would not expect the use of informal childcare in combination with early years provision or later, school, to significantly affect children’s development. Since many parents will continue to choose, or need to use, informal childcare in order to facilitate parents’ work, these findings are important. In particular, there is no strong evidence to suggest that, by doing so, they are putting their children at a disadvantage in relation to children in formal childcare. Childcare quality A better understanding of informal care environments would be useful. There is a strong body of evidence about the different effects of having good quality and less good quality formal childcare in the early years (e.g. Sylva et al 2004; Smith et al 2009b). However, the same body of evidence is not available about the quality of different forms of informal care. Few studies in the UK have sought to measure the quality of care provided by informal childcare providers, and, all too often, informal carers (or particular carers such as grandparents) are treated as if they are a homogenous group in term of the quality of care they provide. In the UK to date, studies usually rely on proxy indicators of the quality of informal care, such as the education of the mother, because of the correlation between that and the education level of grandparents, the key provider of informal childcare. Ideally, we would have better evidence to disentangle the role that quality of informal care plays. More efforts have been made to examine this in the US. However, our reading of this work is that it has proved very difficult to measure the quality of different forms of informal care, especially if we want to compare quality in informal care with quality in a formal care setting. Even where a measure is suitable for both environments, it does not necessarily work in the same way in informal and formal providers. And, indeed, it is arguable whether the same factors would be appropriate to look at ‘quality care’ in formal and informal settings. With these caveats in mind, we might tentatively suggest from the US literature that informal carers tend to provide a less rich learning environment than formal providers, and that their disciplining is more variable, but that they score better in terms of sensitivity and responsiveness. These findings are in line with evidence that children who spend much time with grandparents have better vocabulary than children in formal childcare (linked to responsiveness) but are potentially less school ready (linked to the learning environment). Are there arguments for the state to get more involved in the support of informal childcare users and providers? We considered whether there are convincing economic arguments that would justify government intervention to encourage or support the use of informal childcare. We then examined the practicality of specific proposals to support informal childcare, bearing in mind that it is not generally traded in a market as an economist would recognise it. We discuss these issues further in Chapter . 9 of the full report
Arguments which could, in principle, favour policy intervention to encourage or support informal childcarers (much as government policy currently supports formal childcare) could take one of three forms. First, the government could argue that parents place too little value on the benefits to their children experiencing informal childcare. Second, it could argue that financial constraints prevent families from affording informal childcare. Third, it could argue that parents place too little value on the benefits of their being in work, and that subsidising informal childcare would lead more parents to work. We found very little hard evidence to support or refute these potential arguments. In particular, we simply do not know whether more informal childcare arrangements might exist were potential informal childcarers to be remunerated. Although we suspect that as the vast majority of informal childcare is not paid for directly, any scheme that subsidised it would merely act as an income transfer to those families currently using it. Overall, we view the case for government intervention to support informal childcare is, at best, not proven. A practical reason not to introduce a direct subsidy of informal childcare is that there is no easily-verifiable record of which families use informal care, for how long and at what financial cost; this is because informal childcare is provided by people with whom the parent has a relationship as a friend or relative. Without the ability to verify transactions, any subsidy scheme would be open to abuse, which would increase the cost to government, lead to inequities, and perhaps weaken public acceptance. However, we note the government allows grandparents to claim Carer’s Credit by having a health-care professional verifying the details of the claim. The only policy proposed to support informal care that is not subject to this criticism is one that supports informal childcare indirectly, for example by increasing (possibly income-related) support for families where all adults work (if support is intended only for work-related childcare) or for all parents (if support is given regardless of a parent’s work status), perhaps limited to children of a certain age.
Recommendations for future research We found gaps in the research evidence available and recommend additional research in areas where further evidence may be most likely to have direct influence on government policies related to parental work and to childcare, be it formal or informal. Our suggestions are listed in a rough order of priority.
Further understanding children’s outcomes related to informal childcare Given many families continue to use informal childcare, we should seek to understand better the effect of different childcare situations on different types of children. Such evidence could direct policy makers, providers and parents about what might work best and for whom. It would also open up a discussion about what could be done to maximise the quality of informal childcare. The key missing information is a proper profile of the amount of time that children spend with different providers. A further important question is whether childcare arrangements affect all children in the same way. All the studies we looked at take account of some of the more concrete and measurable differences between children receiving different forms of care. To a certain extent, they take
21
account of family characteristics in order to see whether the picture varies from children of different backgrounds. In the US Pluess and Belsky (2009) found that children with high levels of negative emotionality appear to be particularly susceptible to the quality of their childcare setting. Examining this issue within a UK context would be of huge benefit. Given complementary evidence about the interaction between negative emotionality and parenting (cited in paper, Belsky 2005), we might hypothesise a similar relationship with informal childcare.
Thirdly, more needs to be done to measure the quality of the care provided by grandparents. Several studies show that, in the case of formal childcare, there is a clear relationship between the quality of care and better cognitive outcomes for children, although the evidence regarding socio-emotional outcomes is more mixed. But we do not know enough about the quality of informal childcare provision to know if there is a similar, or similar sized, effect for informal care. In addition to examining the work done in the US on this issue, it would also be useful to consider whether measures such as those used for the Home Learning Environment, which measure interactions between parents and their children (e.g. as used in Speight et al, 2010) could be adapted to measure what grandparents (or other informal providers) do with children. Folbre et al (2005) advocate the role of a child-centred Time Use Survey which takes account of the activities and time that children spend with grandparents as well as parents, one which uses more nuanced measures (than other time use surveys) of what adults do with children. This would help us to understand the information on outcomes and provide some data to measure the quality of interactions between grandparents and their grandchildren. In the US, in recognition that so many families rely on informal care, a number of initiatives have been developed in different US States to train informal carers in how to engage the children in their care and develop them educationally and socio-emotionally. For instance, the Child Care Development Fund, the federal child care program, requires states to incorporate training for ‘kith and kin’ caregivers in their professional development plans. Within the UK, organisations such as Grandparents Plus have called for more support for grandparent carers (Grandparents Plus 2009).
A robust examination of the choices that parents make in terms of the types and combinations of childcare There is clearly a role for collecting additional evidence on parents’ choices about childcare, including choices that might be less about trade-offs and more a positive preference for a mixed portfolio of care. Without this, it is hard to understand parents’ decision-making processes and the extent to which policies around, say, the affordability or quality of childcare provision will affect parental choice. However, collecting robust evidence on these choices is not straightforward. We do not know what options individual parents have open to them. Moreover, we do not know much about the attributes of those options which are in parents' choices sets. For formal childcare, we can measure the price and Ofsted rating, but not other attributes which parents clearly care about, such as location and opening hours. And we can measure very little about informal childcare. This means that traditional
22
economic analysis of choices is limited in its usefulness12
Collecting robust survey data on the prevalence and profile of grandparents who provide childcare while parents work
. One option would be to capture parents’ views before, or at least during, the decision-making process. We might draw on a study by Pungello and Kurtz-Costes (2000) in the US which involved interviewing employed women before and after the birth of their first child, in an attempt to avoid the methodological difficulties of asking mothers to provide retrospective information on their decisions about childcare. Another potential approach is the one taken in a recent study looking at how to quantitatively collect data on lone parents’ decision-making regarding barriers to paid work in a way that reflected the complexities of decision-making involved (De Souza et al, 2008).
An important but simple addition to the evidence base would be to add questions to some of the large surveys to enable researchers to identify people who have grandchildren. Ideally, this would include data on children’s ages, distance away and whether the grandchildren are related to the grandparents through the children’s mother or father. The English Longitudinal Study of Ageing (ELSA), which already asks whether older people have grandchildren or great-grandchildren, is a key candidate for this. A study which involved all generations would be of great benefit to the evidence base. This could build on the design of the 1998 British Social Attitudes module, but interviewing a number of generations from one family, regardless of the household they lived in. One way of doing this might be to seek consent to interview relatives of sample members of Understanding Society. There is also scope for research that would provide a greater understanding of the decisions that grandparents make. In the US, Baydar and Brooks-Gunn (1998) came up with a typology of grandmothers using cluster analysis, which would be interesting to replicate if there were the available UK data. Taking account of socio-demographics, well-being, employment status and levels of social participation, they categorised grandmothers into ‘homemakers’ (the most likely group to regularly look after their grandchildren), ‘young and connected’ (likely to be working and look after grandchildren), ‘remote’ and ‘frail’ (with these latter groups unlikely to be looking after grandchildren.
Understanding how and why informal childcare plugs gaps in formal childcare provision Although the number of formal childcare places has increased since the start of the National Childcare Strategy, and the number of children with informal providers has also risen, the research evidence suggests that there are shortfalls in provision for particular groups of children. Here, we are thinking particularly about childcare during non-standard working hours and school holidays; and childcare for disabled children or children with SEN. For instance, it is quite possible that further research into the childcare needs of parents working at the weekends and in the evenings might conclude that informal childcare
12 These are the same underlying reasons why it is so hard to learn about the link between the price of formal childcare and its use, and maternal employment.
23
providers are best placed to do this. If they are fulfilling a role that formal childcare does/cannot, should this affect discussions about whether such care should be eligible for childcare subsidies? Further analysis would also be possible using the 2009 Childcare Survey and data from the Disabled Children’s Access to Childcare (DCATCH) evaluation. There is also the potential to combine data from a number of waves of the Childcare Survey in order to increase the sample sizes of some smaller sub-groups. This exercise would give more precise figures on prevalence than are available from only a single wave. Adding modules of questions to surveys such as the Childcare Survey or surveys of families in these particular groups might also be useful, though at a cost and with potential complications in sampling strategies.
24
Appendix 1: References used in full review
Anderson, P. A. & Levine, P.B. (1999), “Child Care and Mothers’ Employment Decisions”, NBER Working Paper 7058
Arthur, S et al (2003), The moral economy of grandparenting, London: NatCen
Ball, S. & Vincent, C. (2005), “The childcare champion: New Labour, social justice and the childcare market”, British Educational Research Journal, 31(5), pp 557-570
Barnes, M. & Bryson, C. (2004), Keep time for children: the incidence of weekend working London: NatCen
Barnes, M. , Bryson, C. and Smith, R. (2006), Working atypical hours: what happens to family life? London: NatCen
Baydar, N. & Brooks-Gunn, J. (1998), “Profiles of grandmothers who help care for their grandchildren in the United States”, Family Relations, vol. 47 (4)
Bell A et al (2005) A question of balance: lone parents, childcare and work, London: DWP
Belsky J et al (2007a) “Are there long-term effects of early child care?” Child Development, 78 (2), pp681-701
Belsky J et al (2007b) “Do effects of early child care extend to age 15 years? Results from the NICHD study of early child care and youth development in Age 15 Follow-up”
Bergmann, B. (1996), Saving our Children from Poverty: What the US can learn from France, Russell Sage Foundation: New York
Bernal R and Keane M P (2006) Child Care Choices and Children’s Cognitive Achievement: the case of single mothers, Institute for Policy Research, Northwestern University, Working Paper Series WP-06-09
Blau, D M (1999) “The effects of child care characteristics on child development”, the Journal of Human Resources, XXXIV 4
Blau, D., and Currie, J. (2004), “Preschool, Day Care and Afterschool Care: Who’s Minding the Kids?” NBER WP 10670 (also in Handbook of the Economics of Education, Volume 2)
Blau D. and Hagy, A. (1998), “The Demand for Quality in Child Care”, Journal of Political Economy, vol. 106 no.1
Brewer, M., Crawford, C. & Dearden, L. (2005), “Helping Families: Childcare, early education and work–life balance”, IFS Election Briefing Note 7, http://www.ifs.org.uk/bns/05ebn7.pdf
Brewer, M. and Paull, G. (2004), “Childcare use and parents’ employment: reviewing approaches to understanding the link between childcare use and maternal employment”, DWP working paper No. 14. http://research.dwp.gov.uk/asd/asd5/WP14.pdf
Bradshaw P and Wasoff F (2009) Growing Up in Scotland: multiple childcare provision and its effects on child outcomes, The Scottish Government: Edinburgh
Bryson et al (2004) Use of childcare among families with children who have special educational needs, London: DfES
Buchanan, A. (2008) Involved grandparenting and child well-being: full research report, ESRC end of award report, RES-000-22-2283, Swindon: ESRC
Burchinal M R and Nelson L (2000) “Family selection and child care experiences: implications for studies of child outcomes”, Early Childhood Research Quarterly, 15, 3, 385-411
Butt et al (2007) Childcare Nation? Progress on the childcare strategy and priorities for the future, London: Daycare Trust
CMPO Research Team (2006) Up to age 7: family background and child development up to age 7 in the Avon Longitudinal Survey of Parents and Children (ALSPAC), Department for Education and Skills Research Report RR808A
Collins et al (2006) Lone parents and work: developing new survey measures of the choices and constraints, London: DWP Working Paper No 34
Contact a Family (2002) Everybody Here? Play and Leisure for disabled children and young people; London: Contact a Family.
Council for Disabled Children (2008) Extending Inclusion. Access for Disabled Children and young people to Extended Schools and Children’s Centres: a development manual. Nottingham: DCSF Publications.
Daycare Trust (2004), “Universal Early Education and Care in 2020: Costs, Benefits and Funding Options”, London: Daycare Trust
Daycare Trust (2006) “Ensuring equality: black and minority ethnic views on childcare”, London: Daycare Trust
Daycare Trust (2007a) “Listening to Parents of Disabled Children about Childcare” London: Daycare Trust
Daycare Trust (2007b) ‘Childcare for adult learners in further education’, Daycare Trust: London
DCSF (2007) Every child matters, London: DCSF
DCSF (2009) Next steps for early learning and childcare: building on the 10-year strategy, London: DCSF
DCSF (2010) Support for all: the families and relationship Green Paper, London: DCSF
De Souza et al (2008) Analysis of the choices and constraints question on the Families and Children Study, London: DWP Research Report No 481
Dearden, L., Sibieta, L. and Sylva, K. (2011), The socio-economic gradient in early child outcomes: evidence from the Millennium Cohort Study, Longitudinal and Life Course Studies, Vol. 2, No. 1, pp 19-40
Dench G et al (1999) “The role of grandparents” in British Social Attitudes 16th Report: who shares New Labour values, eds Jowell R et al, Aldershot: Ashgate
Dench G and Ogg J (2002) Grandparenting in Britain, London: Institute of Community Studies
Dex and Ward (2007) Parental care and employment in early childhood by Shirley Dex and Kelly Ward Fatherhood Institute working paper no 57
Dowsett et al (2008) “Structural and process features in three type of childcare for children from high and low income families”, Early Childhood Research Quarterly 23
Duncan G J and Gibson-Davis C M (2006) Connecting Child Care Quality to Child Outcomes: drawing policy lessons from nonexperimental data, Evaluation Review, 30, 5, 611-630
Duncan, A. and Giles, C., (1996), “Should We Subsidise Pre-School Childcare, and If So, How?” Fiscal Studies vol. 17, no. 3, pp. 39–61, http://www.ifs.org.uk/fs/articles/fsduncangiles.pdf
Duncan, A., Paull, G. And Taylor, J. (2001a), “Price and Quality in the UK childcare market”, IFS WP 1/14
Duncan, A., Paull, G. And Taylor, J. (2001b), “Mothers' employment and the use of childcare in the UK”, IFS WP 1/23
Duncan, S., Edwards, R., Reynolds, T. and Alldred, P., (2004), “Mothers and Childcare: Policies, Values and Theories”, Children and Society, 18, pp 254-265.
Family Matters Institute (2009) Do grandparents matter? The impact of grandparenting on the well-being of children, Bedford: Family Matters Institute
Fergusson, E et al (2008) “Which children receive grandparental care and what effect does it have?” Journal of Child Psychology and Psychiatry, 49 (2), pp161-169
Folbre N et al (2005) “By what measure? Family time devoted to children in the United States”, Demography, 42 (2)
Fuller B et al (2004) “Child care quality: centers and home settings that serve poor families”, Early Childhood Research Quarterly, 19
Goodman, A and Gregg, P (eds) (2010) “Poorer children's educational attainment: how important are attitudes and behaviour?”, York: Joseph Rowntree Foundation
Grandparents Plus (2009) Rethinking Family Life: exploring the role of grandparents and the wider family, London: Grandparents Plus
Gray A (2005) “The changing availability of grandparents as carers and its implications for childcare policy in the UK”, Journal of Social Policy, 34 (4)
Griggs J (2009) The Poor Relation? Grandparental care: where older people’s poverty and child poverty meet, London: Grandparents Plus
Hakim, C., Bradley, K., Price, E. and Mitchell, L. (2008), Little Britons: Financing Childcare Choice, London: Policy Exchange
Hansen K and Hawkes D (2009)” Early childcare and child development”, Journal of Social Policy, 38 (2), pp211-239
Himmelweit S and Sigala M (2004) “Choice and the relationship between identities and behaviour for mothers with pre-school children: some implications for policy from a UK study”, Journal of Social Policy, 33 (3)
HM Treasury/Department for Education and Skills (2007) Aiming High for Disabled Children: Better support for families
HM Treasury (2011), The Green Book: Appraisal and Evaluation in Central Government, London: The Stationery Office.
Kagan, C., Lewis, S., Heaton, P. & Cranshaw, M. (1999) Enabled or Disabled? Working Parents of Disabled Children and the Provision of Child-Care; Journal of Community & Applied Social Psychology 9; pp 367-381
Kazimirski A et al (2006) ‘Childcare and early years provision for minority ethnic families’ London: NatCen
La Valle et al (2002) ‘Happy Families? Atypical work and its influence on family life’ Bristol: the Policy Press
Leach et al (2006) “The quality of different types of childcare at 10 and 18 months: a comparison between types and factors related to quality”, Early Childhood Development and Care
Lyonette C and Clark M (2009) Unsocial hours: unsocial families? Working time and family wellbeing Cambridge: Relationships Foundation
Michalopoulos, C. and Robins, P. (2000), “Employment and Child Care Choices in the US and Canada”, Canadian Journal of Economics, 33(2), pp435-470
Mitchell, W. & Sloper, P. (2002) Quality services for disabled children. Social Policy Research Unit, University of York: York
Mooney, A. & Blackburn, T. (2003) Children’s views on childcare quality, Research Report No. 482, London: DfES
Mooney A and Statham J (2002) The Pivot Generation: informal care and work after fifty, Bristol: Policy Press
Morrissey T (2008) “Familial factors associated with the use of multiple child-care arrangements”, Journal of Marriage and Family 70
National Union of Students (2009) Meet the parents: the experiences of students with children in further and higher education, National Union of Students: London
NICHD Early Child Care Research Network (2004) “Type of childcare and children’s development at 54 months”, Early Childhood Research Quarterly 19 203-230
Paull, G., (2003), “Childcare Subsidies” in A. Dilnot, C. Emmerson and H. Simpson, The IFS Green Budget 2003, London: IFS. http://www.ifs.org.uk/budgets/gb2003/ch7.pdf
Paull, G. and Taylor, J., (2002), Mothers Employment and Childcare Use in Britain, London: IFS.
Pearce A et al (2010a) “Is childcare associated with the risk of overweight and obesity in the early years? Findings from the UK Millennium Cohort Study”, International Journal of Obesity,2010, pp1-9
Pearce A et al (2010b) “Does childcare influence socioeconomic inequalities in unintentional injury? Findings from the UK Millennium Cohort Study”, Journal of Epidemiology and Community Health, 64, pp161-166
Pettigrew N (2003) Experiences of lone parents from minority ethnic communities, DWP Research Report No. 187, London: DWP.
Peyton et al (2001) “Reasons for choosing childcare: associations with family factors, quality and satisfaction” Early Childhood Research Quarterly, 16
Plantenga J and Remery C (2009) The provision of childcare services: a comparative review of 30 countries, European Commission’s Expert Group on Gender and Employment issues, European Commission
Pluess M and Belsky J (2009) “Differential susceptibility to rearing experience: the case of childcare”, Journal of Child Psychology and Psychiatry, 50:4, pp 396-404
Porter T et al (2003) Doting on kids: understanding quality in kith and kin care, Institute for a Child Care Continuum, New York
Powell, L. (2002), “Joint Labour Supply and Childcare Decisions of Married Mothers”, Journal of Human Resources, 37(1), pp 106-128
PriceWaterhouseCoopers (2003), “Universal Childcare provision in the UK – Towards a Cost- Benefit Analysis”, London: PwC
Pungello E P and Kurtz-Costes B (2000) Working women’s selection of care for their infants: a prospective study, Family Relations, 49
Raeymaeckers et al (2008a) The influence of formal and informal support systems on the labour supply of divorced mothers, European Societies 10 (3)
Raeymaeckers, P., Dewilde, C., Snoeckx, L and Mortelmans, D. (2008b), “Childcare Strategies of Divorced Mothers in Europe: A Comparative Analysis”, European Sociological Review, 24(1), pp115-131
Read, J., Spencer, N. and Blackburn, C. (2007) Can We Count Them? Disabled Children and their Households. Full Research Report. ESRC End of Award Report, RES-000-22-1725. Swindon:ESRC
Ribar, D. (1995) “A Structural Model of Child Care and the Labor Supply of Married Women”, Journal of Labor Economics, vol. 13 no. 3
Ridge T and Millar J (2008) ‘Work and well-being over time: lone mothers and their children’, London: DWP
Rutter, J. and Evans, B. (2011a) Informal childcare: choice or chance? London: Daycare Trust
Rutter, J. And Evans, B. (2011b) Listening to grandparents London: Daycare Trust
Sammons P et al (2007) Effective Pre-school and primary education 3-22 Project (EPEE 3-11): influences on children’s attainment and progress in Key Stage 2: cognitive outcomes in Year 5, EPPE: London
Shivers E M (2006) A closer look at kith and kin care: exploring variability of quality within family, friend and neighbour care, Journal of Applied Psychology, 27
Skinner, C. (2003). Running Round in Circles, Bristol: The Policy Press
Skinner, C. and Finch, N. (2006), “Lone parents and informal childcare: a tax credit childcare subsidy?”, Social Policy and Administration, 40(7), pp807-823
Smith et al (2010) Childcare and early years survey of parents 2009, London: DfE
Smith et al (2009) Early education pilot for two year old children: evaluation, DCSF research report RR134
Speight et al (2009) Childcare and early years survey of parents 2008, London: DCSF
Speight S et al (2010) Families experiencing multiple disadvantage: their use of childcare and views on childcare provision, London: DCSF
Statham J and Mooney A (2003) ‘Around the clock: childcare services at atypical times’, Bristol: Policy Press
29
Stiell B et al (2006) Caring for sick and disabled children: parents’ experiences of combining work and care, London: Carers UK
Sylva K et al (2004) The Effective Provision of Pre-school Education (EPPE) Project: final report, DfES: London
Sylva et al (2007) Family and child factors related to the use of non-maternal infant care: an English study, Early Childhood Research Quarterly 22
Tekin, E. (2003), “Child Care Subsidy Receipt, Employment, and Child Care Choices of Single Mothers”, IZA Discussion Paper 1121
Waldfogel J (2002) Child care, women’s employment and child outcomes, Journal of Population Economics, 15
Waldfogel J (2006) What children need, Cambridge Massachusetts: Harvard University Press
Waldfogel J and Garnham A (2008) Childcare and Child Poverty, York: JRF
Wheelock, J. and Jones, K., (2002) “Grandparents are the next best thing: informal childcare for working parents in Britain”, Journal of Social Policy, 31 (3), pp 441-463
Woodland, S et al (2002) Parents’ demand for childcare survey, London: DfES
30
Appendix 2: Tables on child outcomes
Table 1 Cognitive Outcomes and Non-Parental Childcare (BAS percentile, age 3) Mother’s Education Difference in score (out of 100) on the BAS vocabulary sub-scale between category and centre-based childcare
All Working Mothers
Part-time Working Mothers
Low High
3 3 3 3 Childcare Use by Age 3 (MCS 2) Centre-Based Childcare (only) n/a n/a n/a n/a (omitted category) Grandparents (only) 2.713* 1.736 0.259 4.498** [1.146] [1.427] [1.803] [1.599] Other Informal Care (only) 1.179 1.165 1.664 0.111 [1.863] [2.301] [3.019] [2.553] Childminder 2.813 1.757 -6.587 6.914* [2.603] [3.433] [3.829] [3.124] Grand-Parents and Centre-Based Childcare 1.196 0.761 -1.623 3.039 [1.234] [1.378] [1.893] [1.641] Other Informal and Centre-Based Childcare -1.158 -2.942 2.153 -3.661 [2.222] [2.677] [3.465] [2.737] Childminder and Centre-Based Childcare 3.732 3.316 6.361 3.91 [2.741] [3.106] [6.634] [3.089] Other Combination 2.038 1.717 -0.0225 3.518 [2.104] [2.446] [3.028] [2.679] Low/No Childcare 0.0012 0.101 0.000 2.331 [1.121] [1.392] [1.719] [1.452] Observations 5,536 3,818 2,143 3,393 R-squared 0.131 0.145 0.147 0.102 Other Controls included: socio-economic position, parental education, child age, male/female, child ethnicity, work status of father, mother’s age (sq), lone parent status, marital status, number of siblings
31
Table 2 Cognitive Outcomes and Non-Parental Childcare (BAS percentile, age 5) Mother’s Education Difference in score (out of 100) on the BAS vocabulary sub-scale between category and centre-based childcare
All Working Mothers
Part-time Working Mothers
Low High
Childcare Use by Age 3 (MCS 2) Centre-Based Childcare (only) n/a n/a n/a n/a (omitted category) n/a n/a n/a n/a Grandparents (only) 0.615 -0.0824 0.167 1.673 [1.327] [1.548] [1.996] [1.696] Other Informal Care (only) 2.598 3.225 6.823* -1.377 [2.505] [3.289] [3.073] [3.787] Childminder 6.911* 6.944 5.639 6.975* [2.992] [4.029] [5.826] [3.422] Grand-Parents and Centre-Based Childcare -0.206 -0.776 0.282 -0.353 [1.131] [1.368] [1.950] [1.320] Other Informal and Centre-Based Childcare -2.796 -1.188 1.116 -5.636 [2.292] [2.633] [3.435] [3.171] Childminder and Centre-Based Childcare 2.771 3.833 15.76* 0.498 [2.912] [3.358] [7.127] [3.283] Other Combination 5.382* 5.538* 3.9 6.793* [2.092] [2.778] [3.642] [2.669] Low/No Childcare 0.592 0.734 0.105 1.119 [1.127] [1.272] [1.868] [1.324] Childcare Use Age 3-5 (MCS2-MCS3) Centre Based Childcare (Part-Time) n/a n/a n/a n/a (omitted category) n/a n/a n/a n/a Centre-Based Childcare (Full-Time) 0.229 -0.0626 -1.586 1.184 [1.081] [1.477] [1.853] [1.306] Observations 5,065 3,542 1,957 3,108 R-squared 0.119 0.126 0.113 0.108 Other Controls included: socio-economic position, parental education, child age, male/female, child ethnicity, work status of father, mother’s age (sq), lone parent status, marital status, number of siblings
32
Table 3 Socio-emotional development and non-parental childcare (SDQ, age 3) Mother’s Education
All Working Mothers
Part-time Working Mothers
Low High
Childcare Use by Age 3 (MCS 2) Centre-Based Childcare (only) n/a n/a n/a n/a (omitted category) n/a n/a n/a n/a Grandparents (only) 0.115 1.203 -4.059* 3.283* [1.146] [1.375] [1.770] [1.520] Other Informal Care (only) -1.407 0.369 -2.61 -0.322 [2.077] [2.447] [3.358] [3.160] Childminder -1.089 0.0844 -9.065 1.987 [3.051] [3.917] [5.516] [3.390] Grand-Parents and Centre-Based Childcare -3.431** -0.246 -5.389* -2.373 [1.154] [1.396] [2.134] [1.541] Other Informal and Centre-Based Childcare -2.104 -1.161 -7.900* 1.339 [2.372] [2.978] [3.954] [3.109] Childminder and Centre-Based Childcare -3.386 -2.011 1.505 -3.489 [2.846] [3.401] [5.703] [3.230] Other Combination -3.02 -1.71 -4.875 -1.881 [2.064] [2.219] [3.233] [2.788] Low/No Childcare 0.186 0.673 -1.227 0.8 [1.196] [1.489] [1.851] [1.483] Observations 5,536 3,818 2,143 3,393 R-squared 0.089 0.097 0.085 0.067 Other Controls included: socio-economic position, parental education, child age, male/female, child ethnicity, work status of father, mother’s age (sq), lone parent status, marital status, number of siblings
33
Table 4 Socio-emotional development and non-parental childcare (SDQ, age 5) Mother’s Education
All Working Mothers
Part-time Working Mothers
Low High
Childcare Use by Age 3 (MCS 2) Centre-Based Childcare (only) n/a n/a n/a n/a (omitted category) n/a n/a n/a n/a Grandparents (only) 2.524* 3.600* 0.576 4.103* [1.284] [1.636] [2.145] [1.700] Other Informal Care (only) 2.553 1.999 4.781 2.443 [2.386] [2.849] [3.044] [3.407] Childminder 0.465 1.21 2.289 1.073 [2.945] [3.649] [6.948] [3.192] Grand-Parents and Centre-Based Childcare -1.488 0.872 -3.985* 0.285 [1.244] [1.463] [1.799] [1.713] Other Informal and Centre-Based Childcare 3.659 5.816* 1.177 4.982 [2.177] [2.656] [3.419] [2.918] Childminder and Centre-Based Childcare -5.819 -5.309 5.6 -7.444* [3.383] [3.897] [8.046] [3.638] Other Combination 0.3 2.804 -0.17 0.363 [2.042] [2.423] [3.207] [2.690] Low/No Childcare 1.595 1.207 0.00505 2.689 [1.149] [1.454] [2.014] [1.569] Childcare Use Age 3-5 (MCS2-MCS3) Centre Based Childcare (Part-Time) n/a n/a n/a n/a (omitted category) n/a n/a n/a n/a Centre-Based Childcare (Full-Time) -2.697* -2.346 -5.046** -1.392 [1.079] [1.441] [1.647] [1.366] Observations 5,065 3,542 1,957 3,108 R-squared 0.096 0.1 0.102 0.086 Other Controls included: socio-economic position, parental education, child age, male/female, child ethnicity, work status of father, mother’s age (sq), lone parent status, marital status, number of siblings