Faculdade de Medicina da Universidade de Coimbra Mestrado em Investigação Biomédica Role of Natural Killer cells in the progression of Mycobacterium tuberculosis infection to pulmonary disease Mónica Teresa Parente Abreu Coimbra, Setembro 2011
Transcript
Faculdade de Medicina da Universidade de Coimbra
Mestrado em Investigação Biomédica
Role of Natural Killer cells in the progression
of Mycobacterium tuberculosis infection
to pulmonary disease
Mónica Teresa Parente Abreu
Coimbra, Setembro 2011
Faculdade de Medicina da Universidade de Coimbra
Role of Natural Killer cell in the progression of Mycobacterium tuberculosis infection to
pulmonary disease
Dissertação apresentada à Faculdade de Medicina da Universidade de Coimbra para a obtenção do grau
de Mestre em Investigação Biomédica
Autor: Mónica Teresa Parente Abreu Orientador: Doutor Paulo Rodrigues Santos Co-orientador: Professor Doutor António Segorbe Luís
ii
Trabalho realizado na:
Imunologia, Faculdade de Medicina da Universidade de Coimbra
Centro de Neurociências e Biologia Celular, Universidade de Coimbra
iii
iv
AGRADECIMENTOS
Ao Dr. Paulo Rodrigues Santos, agradeço todo o apoio, amizade, disponibilidade,
orientação e ensinamentos sólidos imprescindíveis à realização deste trabalho de
investigação. Obrigada “chefe” pela confiança que depositou em mim, por nunca deixar que
desanimasse mesmo nas horas em que tudo parecia perdido e por ter sempre garantidas as
condições necessárias para que este trabalho fosse realizado.
Ao Professor Doutor Manuel Amaro de Matos Santos Rosa, director da Faculdade
Medicina da Universidade de Coimbra e da Imunologia da Universidade de Coimbra pela
cedência de espaço e material sem o qual não teria sido possível a realização deste
trabalho.
Ao Professor Doutor António Segorbe Luís pela disponibilidade para a co-orientação
deste trabalho.
Ao Professor Doutor Paulo Pereira pela oportunidade concedida aquando da
aceitação para o mestrado em Investigação Biomédica.
À Professora Doutora Raquel Duarte coordenado do Centro de Referência Regional
para a Tuberculose Multi-Resistente do Centro Diagnóstico neumol gico de ila ova de
Gaia (Directora Dra. Aurora Carvalho), pela cedência das amostras e informações clínicas
necessárias à realização deste trabalho, bem como por toda a disponibilidade demonstrada.
À Doutora Vera Alves por toda a amizade, companhia e ensinamentos pertinentes à
realização deste trabalho de investigação. Obrigada pelas palavras amigas em todos os
momentos e por me ter recebido tão bem.
À Mestre Margarida Teixeira, por tudo: amizade, companhia, paciência e
disponibilidade dentro e fora do laboratório.
Ao grupo de Imunologia do Centro de Neurociências da Universidade de Coimbra.
A todos os meus amigos, pelo apoio, amizade, confiança e inúmeros momentos de
animação indispensáveis naqueles momentos! Sem vocês tudo isto seria muito mais
complicado.
Aos meus papás e manito pelo amor, amizade, apoio e confiança incondicionais.
Nunca terei palavras para descrever a gratidão por tudo que sempre fizeram por mim.
Obrigada por acreditarem em mim em todos os momentos e tornarem a minha vida tão feliz.
Figure 10 – CD27/CD11b expression in NK cells: representative dot plots, analysis and MFI
in TB and HC ........................................................................................................................39
Figure 11 – IFNγ intracellular expression in NK cell: representative histogram, analysis MFI
in TB and HC ........................................................................................................................40
Figure 12 – CD57 surface expression in NK cell and intracellular IFNγ: histograms, analysis
and MFI in TB and HC ..........................................................................................................41
Figure 13 – CD94 and NKG2D surface expression in NK cells: representative dot plots,
analysis and MFI in TB and HC ............................................................................................43
Figure 14 – Natural Cytotoxicity Receptors expression in NK cells: representative
histograms, analysis, MFI and intracellular IFNγ expression in TB and HC ..........................46
Figure 15 – Inhibitory KIRs expression on NK cells: representative dot plots and histograms,
analysis and MFI in TB and HC ............................................................................................50
Figure 16 – Activating KIR expression on NK cells: representative dot plots and histogram,
analysis and MFI in TB and HC ............................................................................................55
viii
TABLE INDEX
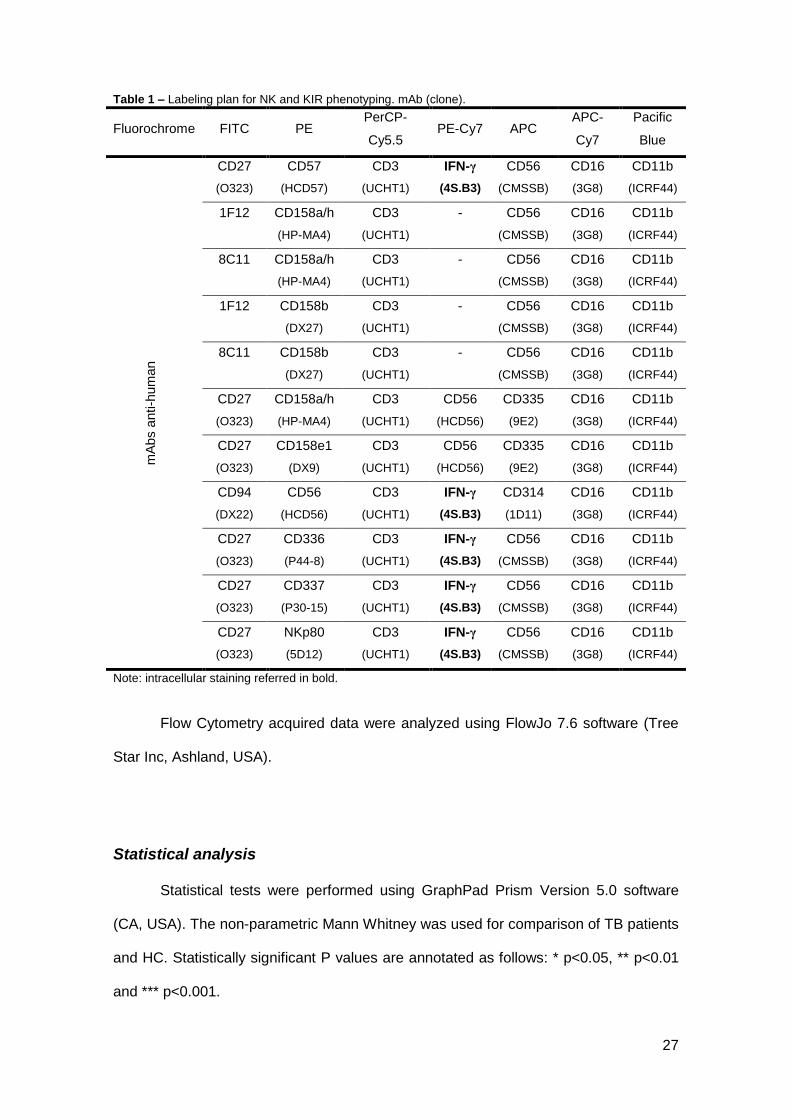
Table 1 – Labeling plan for NK and KIR phenotyping. mAb (clone). ......................................... 27
Table 2 – Absolute and relative frequencies of white blood cells in CBC from HC and TB. .. 29
Table 3 – Percentage and MFI of cells CD16+ and in each CD27/CD11b subset for CD3-
CD56+ in TB and HC .......................................................................................................................... 32
Table 4 – Percentage and MFI of cells CD16+ and in each CD27/CD11b subset for CD3-
NKp46+ in TB and HC ........................................................................................................................ 34
Table 5 – Percentage and MFI of cells CD16+ and in each CD27/CD11b subset for CD3-
CD56+NKp46+ in TB and HC ............................................................................................................ 36
Table 6 – Percentage and MFI of cells in each CD27/CD11b subset for CD3-CD56brightCD16-
in TB and HC ....................................................................................................................................... 38
Table 7 – Percentage and MFI of cells expressing CD16 and in each CD27/CD11b subset
for CD3-CD56+CD57+ in TB and HC ................................................................................................ 42
Table 8 – Percentage and MFI of cells expressing CD16 and intracellular IFNγ in each
CD94/NKG2D subset in TB and HC. ............................................................................................... 44
Table 9 – Percentage and MFI of cells CD16+ and in each CD27/CD11b subset for CD3-
CD56+NKp44+ in TB and HC ............................................................................................................ 47
Table 10 – Percentage and MIF of cells each CD27/CD11b subset for CD3-CD56+NKp30+ in
TB and HC ........................................................................................................................................... 48
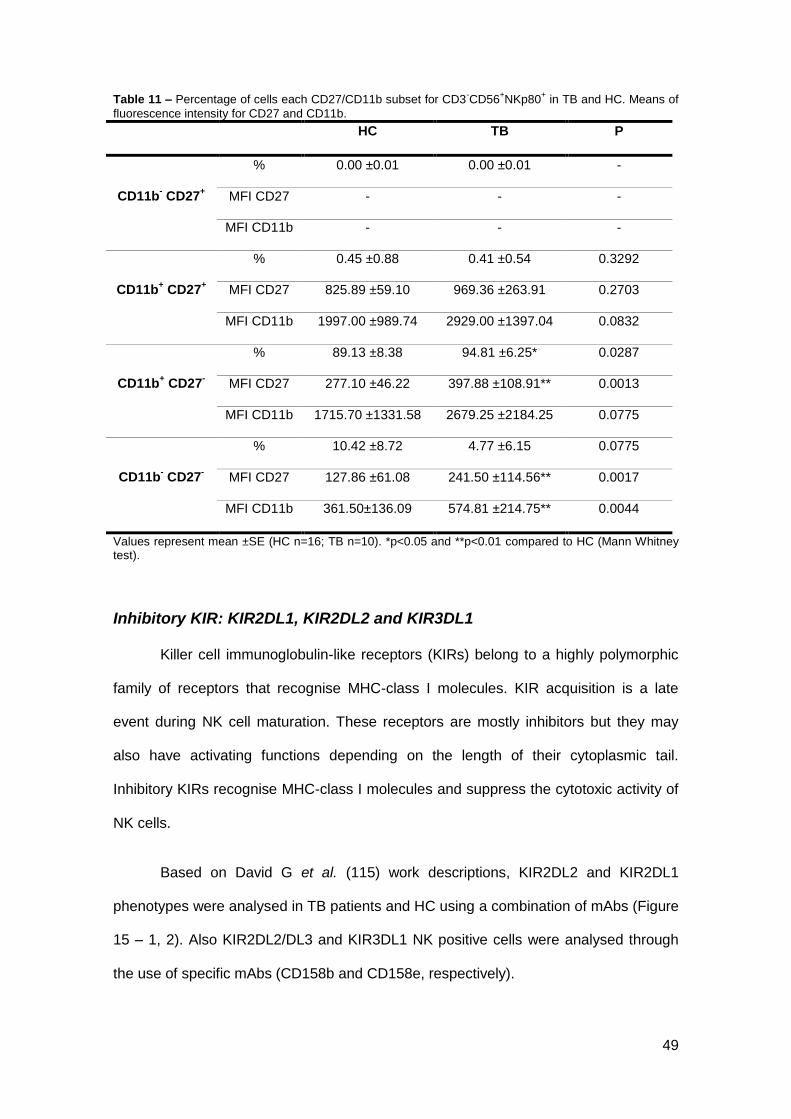
Table 11 – Percentage and MFI of cells each CD27/CD11b subset for CD3-CD56+NKp80+ in
TB and HC ........................................................................................................................................... 49
Table 12 – Percentage and MFI of cells CD16+ and in each CD27/CD11b subset for
KIR2DL2+ cells in TB and HC ........................................................................................................... 51
Table 13 – Percentage and MFI of cells CD16+ and in each CD27/CD11b subset for
KIR2DL1+ cells in TB and HC ........................................................................................................... 52
Table 14 – Percentage and MFI of cells CD16+ and in each CD27/CD11b subset for
CD158b+ cells in TB and HC ............................................................................................................. 53
ix
Table 15 – Percentage and MFI of cells CD16+ and in each CD27/CD11b subset for
CD158e+ cells in TB and HC ............................................................................................................. 54
Table 16 – Percentage and MFI of cells CD16+ and in each CD27/CD11b subset for
KIR2DS1+ cells in TB and HC ........................................................................................................... 56
Table 17 – Percentage and MFI of cells CD16+ and in each CD27/CD11b subset for
CD158a/h+ cells in TB and HC ......................................................................................................... 57
KIR2DL1, KIR2DL2, KIR3DL1, KIR2DS1) foi avaliada juntamente com a expressão
intracelular de IFN-γ.
Resultados e discussão: Foi observada uma linfopenia moderada nos doentes com
tuberculose, com um decréscimo em todos os subtipos de linfócitos, à excepção das
células B. As células NK dos doentes com tuberculose apresentaram níveis mais
elevados de maturação e de produção de IFN-γ. O aumento mais acentuado registou-
se na expressão do CD57.
Conclusão: Os dados aqui apresentados relativos à fenotipagem das células NK
poderão ajudar na compreensão do papel destas células na infecção pela
Mycobacterium tuberculosis e progressão para doença, abrindo perfectivas de
utilização das células NK como alvos terapêuticos.
4
INTRODUCTION
5
Immune System
The immune system is a specialized network of organs, cells and soluble
mediators that all together forms a defence mechanism against invading pathogens,
infectious agents and transformed cells. The immune system can be divided into two
branches: the innate and the adaptive systems. Both systems interact and complement
each other to provide the protection of the body.
Innate immune system
The innate immune system offers a first barrier against penetration and is
quickly activated after tissue injure or infection and targets pathogens non-specifically.
However, it does not have memory, so the immune response will not increase with next
exposure to the same pathogen. Physical barriers (skin and mucosal membranes),
which prevent the infection by a pathogen, are combined with a set of cellular
mechanisms and soluble factors that are able to destroy a pathogen once the infection
occurred.
The most important cells in a response to an infection are phagocytic white
blood cells like macrophages and neutrophils, competent to ingest and kill microbes by
producing toxic chemicals and degradative enzymes, and Natural Killer (NK) cells,
which mediate lysis of target cells. During the early phase of the innate immune
response, both cell types produce cytokines, which cause a local inflammation and
active the adaptive immune system. NK cells are crucial for early defence against
infections and tumour surveillance and also represent a connecting cell type between
innate and adaptive immune system.
As phagocytic cells, macrophages and neutrophils are important in the
elimination of pathogens. Macrophages migrate to the site of infection after neutrophils
but are also involved in other functions, such as initiating healing and stimulating the
adaptive immune response. Like macrophages, dendritic cells serve as antigen-
6
presenting cells (APCs) and stimulate the adaptive response. On the other hand,
natural killer cells are quickly activated lymphocytes that attack tumours and cells
infected with virus.
In order to be alerted, the innate immune system displays a set of receptors,
which recognize many related molecular structures called pathogen-associated
patterns (PAMPs). PAMPs are molecular motifs consistently found on pathogens and
not in the host. They are recognized by toll-like receptors (TLRs) and other pattern
recognition receptors (PRRs), such as dectins and nucleotide-binding oligomerization
domain containing (NOD). The binding of PAMP to cells of the innate immune system
results in killing of the pathogens and secretion of pro-inflammatory cytokines. The
innate immune system acts within minutes to hours after an infection and many of the
effector and costimulatory molecules generated during this early phase of the immune
response play an important role for the slower developing adaptive response.
Adaptive immune system
Although 90% of infections are eliminated by mechanisms of the innate immune
system, some pathogens escape the defences and the adaptive immune system has to
be activated. Soluble factors that belong to the complement system and chemokines
and cytokines secreted by innate immune system induce recruitment of lymphocytes
and the activation of the adaptive immune system. Adaptive immunity is mainly exerted
by two types of lymphocytes, namely T cells and B cells. In contrast to innate immune
cells, T and B lymphocytes express antigen specific receptors (TCR and BCR,
respectively) which undergo genetic recombination in somatic cells. This process
provides with a highly diverse repertoire of receptors able to recognize plenty different
pathogen-derived antigens. Adaptive immunity not only contributes to pathogen
clearance but is also essential for the formation of an immunological memory allowing
fast acting responses in case of reinfection. The protection of the extracellular fluids
and spaces is mediated by humoral immune response, in which antibodies produced
7
by B cells bind to extracellular pathogens and toxins. Activation of naive B cells is
triggered by binding of the BCR to its specific antigen and usually requires the help of T
cells. Following antigen binding to the BCR, B cells become activated and differentiate
into antibody secreting plasma cells. The secreted antibodies bind specifically to the
antigen on the pathogen surface, subsequently leading to complement activation and
phagocytosis of the pathogen. Also NK cells recognize target cells coated with
antibodies, leading to lysis of the target cell by so-called antibody dependent cellular
cytotoxicity (ADCC).
Different from B cells, T cells are not able to recognize the pathogens directly,
needing the help of a professional APC which have been activated by pathogen-
derived PAMP degrade the pathogen and present the antigens on major
histocompatibility complex (MHC) molecules expressed on their surface leading to T
cell activation and clonal expansion. Among T cells, two populations can be
distinguished: CD4+ T helper (TH) and CD8+ cytotoxic T cells. CD8+ T cell activation
and release of cytotoxic molecules leads to killing of the infected target cells and CD4+
T cell do not only stimulate innate cells but also play a crucial role in activating other
adaptive cells, contributing to the elimination of the pathogen.
Summing up, innate and adaptive immune responses intensively cooperate with
each other contributing to pathogen elimination. While the innate immune system has a
crucial importance during the early phase of a primary infection but does not provide
immunological memory, the adaptive system takes longer to be activated but have
immunological memory, which allows an even quicker response in case of re-exposure
to the same pathogen. (1, 2)
8
Natural Killer Cells
Natural killer (NK) cells represent the third largest lymphoid cell population in
mammals, are key components of the innate immune system and participate in the
early response against infected or transformed cells (3). They constitute a first line of
defence and can kill infected and tumor cells. These cells are large, granular, bone-
marrow – as well as lymph node-derived lymphocytes. However, NK cells are distinct
from T cells or B cells and have distinct morphologic, phenotypic and functional
properties. NK cells do not require sensitization for the exertion of their activity
differently from T cells or B cells (4).
NK cells are present in blood as circulating cells and to other organs of the body
as resident cells. In peripheral blood, they are characteristically described as having
the morphology of large granular lymphocytes (5), whereas in tissues, the
microenvironment of the organ has influence on phenotype and activity of NK cells.
They are characterized by the expression, on their cell surface, of a varied repertoire of
receptors, named inhibitors and activators, which balance mediates their function (6).
The balance of inhibitory and stimulatory signals received by a NK cell determines the
outcome of interactions with target cells. Normal target cells are protected from killing
by NK cells when inhibitory signals delivered by self MHC class I molecules
compensate the signals delivered by stimulatory ligands (7).
Development and maturation
NK cells are believed to be relatively short-lived lymphocytes. They derived
from CD34+ hematopoietic progenitor cells (HPC) and some observations indicate that
the bone marrow (BM) and lymph nodes (LN) are important for their
development/maturation (8, 9).
Primarily, NK cell development occurs in the BM, and despite the critical factors
necessary for development are still unknown, some analyses demonstrated the
9
presence of an enriched microenvironment with CD34+ HPC, including a fraction of NK
cell precursors (pre-NK) in BM(10). IL-2 has been used to study NK cell development
from CD34+ HPC in vitro (10-12), however, this cytokine is not found within the BM
stroma (11, 13, 14), so other factors that bind to the IL-2R are critical for NK cell
development. IL-15 is produced by human BM stromal cells and its function have
demonstrated to facilitated the differentiation of cytolytic NK cells from CD34+ HPC (15)
because this cytokine shares common signalling receptor subunits with IL-2, which
form an intermediate-affinity heterodimeric receptor complex, IL-2/IL-15Rβγ (16). It has
been demonstrated that only the CD34+ CD45RA+ phenotype is all-inclusive for human
IL-2/IL-15-responsive pre-NK cells (17, 18). Other BM stromal cell factors such as c-kit
ligand (KL) and flt3 ligand (FL), the ligands for members of the class III receptor
tyrosine kinase family (includes c-kit and flt3), have been shown to potentiate
significantly the expansion of NK cells from CD34+ HPC in combination with IL-15,
however alone these molecules have no effect on cell differentiation into NK cell (19,
20). In development, NK cell it may be divided into an early phase in which FL acts
synergistically with IL-15 to generate an exclusive CD34+CD122+CD38+ NK cell
intermediate subset from CD34+ HPC, and where IL-15 is necessary to increase the
mature NK cells characteristics such as CD56 and NKR expression, cytotoxic activity
and the ability to produce abundant cytokines and chemokines (11). CD56 is a 140-
kDa isoform of neural cell adhesion molecule (NCAM).
LN are also naturally and selectively enriched with CD34dimCD45RA+ HPC and
are able to differentiate these cells into CD56bright NK cells in the presence of either IL-2
or IL-15 (17). Fehniger et al. (21) showed that endogenous T cell-derived IL-2 may
trigger, through the NK high-affinity IL-2 receptor, CD56bright NK cells to produce IFN-γ.
This selective enrichment of both CD34dimCD45RA+ HPC and CD56bright NK cells within
LN compared with the BM or blood is suggesting of LN as a site for NK cell
development.
10
There are two distinct blood subsets of human NK cells identified by cell surface
density of CD56 (22). NK cells in human peripheral blood are majority CD56dim, express
high levels of CD16 and killer cell immunoglobulin-like receptor (KIR) and a minority
are CD56bright CD16dim/neg, having low cytotoxic activity and secrete more cytokines in
response to stimulation (22). Furthermore, Romagnani et al. (23) demonstrated that
CD56dim NK cells from peripheral blood exhibit shorter telomeres than peripheral and
LN-derived CD56bright NK cells.
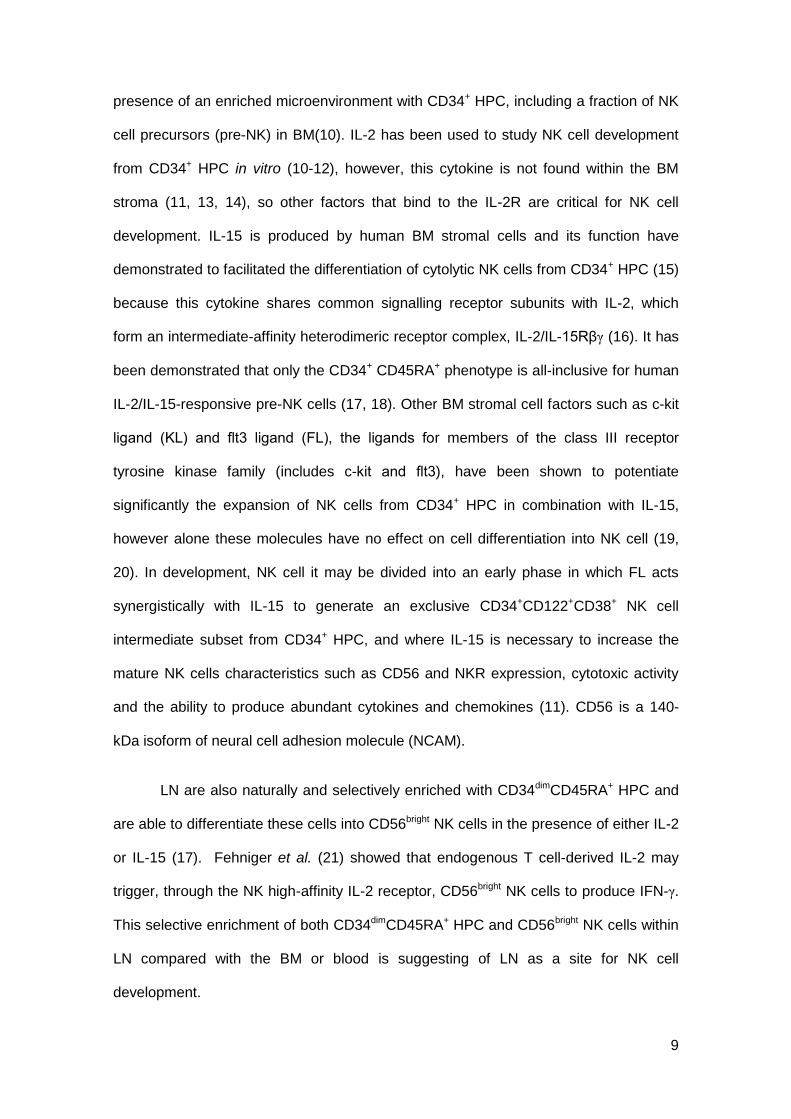
The NK cell development stages in human are not yet well established but
based on the presence of different expression kinetics of surface markers could define
distinct stages of their development. Freud et al. (24) based on the principle that: more
than 99% of NK cells within LN express at least CD34, CD117, and/or CD94; CD34
and CD94 are independent antigens, indicating that NK cells intermediate stages would
first lose CD34 and then express CD94; and NK cell functional maturity (cytotoxic and
IFN-γ secretion) as well as acquisition of surface CD56 in humans are acquired at a
later stage of development (25, 26), have proposed a marker panel set using the
combination of CD34, CD117, CD94 and CD16 to differentiate the functionally distinct
stages of human NK cell development (figure 1).
The first stages of NK cells differentiation are dependent of concomitant IL-15
responsiveness and not all CD34+ CD117+ CD94- cells are compromised with NK cell
lineage. Immature NK cells (iNK cells), are different from the first developmental stage
of NK cell because these cells are completely incapable to generate T cells and DC,
being this way committed with NK cell lineage (8, 24). iNK cells express antigens
including CD2, CD7, CD56, CD161 and NKp44, besides lack of CD10, integrin β7 and
HLA-DR, characteristics that further will distinguish the iNK cells phenotype from pre-
NK cells. In this third developmental stage, iNK cells are exclusively in NK cell branch
however they are not capable to produce IFN-γ or mediate perforin-dependent cellular
cytotoxicity against MHC-I negative target cells (24). CD56+ cells can express different
11
levels of CD117 and are subdivided in CD56+CD117high and CD56+ CD117low/- subsets
(27). These populations are considered different since the latter expresses NKp30,
NKp46, NKG2D, NKG2A and CD94, while CD56+CD117high cell do not. It were been
shown that CD56+CD117highCD94- cells are not cytotoxic and CD56+CD117low/-CD94+
effectively kill target cells and express high levels of FasL and IFN-γ, representing
differentiation at stage 4. KIR+ NK cells are primarily within the CD56dimCD94+/-CD16+
fraction of cells in both LN and peripheral blood, whereas the CD56bright CD94+CD16+/-
do not express KIR, which is consistent with evidence indicating that KIR acquisition is
rather a late event during NK cell maturation (28-30).
Stage 1
(Pro-NK)
Stage 2
(Pre-NK)
Stage 3
(iNK)
Stage 4
(CD56bright
)
Stage 5
(CD56dim
)
CD34+ CD34
+ CD34
- CD34
- CD34-
CD117- CD117
+ CD117
+ CD117
+/- CD117
-
CD94- CD94
- CD94
- CD94
+ CD94
+/-
CD16- CD16
- CD16
- CD16
- CD16
+
Enrollment to NK cell lineage
NK cell maturation
Cytotoxicity
acquisition
Figure 1 – Phenotypic features used to discriminate the main NK cell subsets during the ontogenic
process. This figure brings the more important markers acquired during the five ontogenic stages (31)
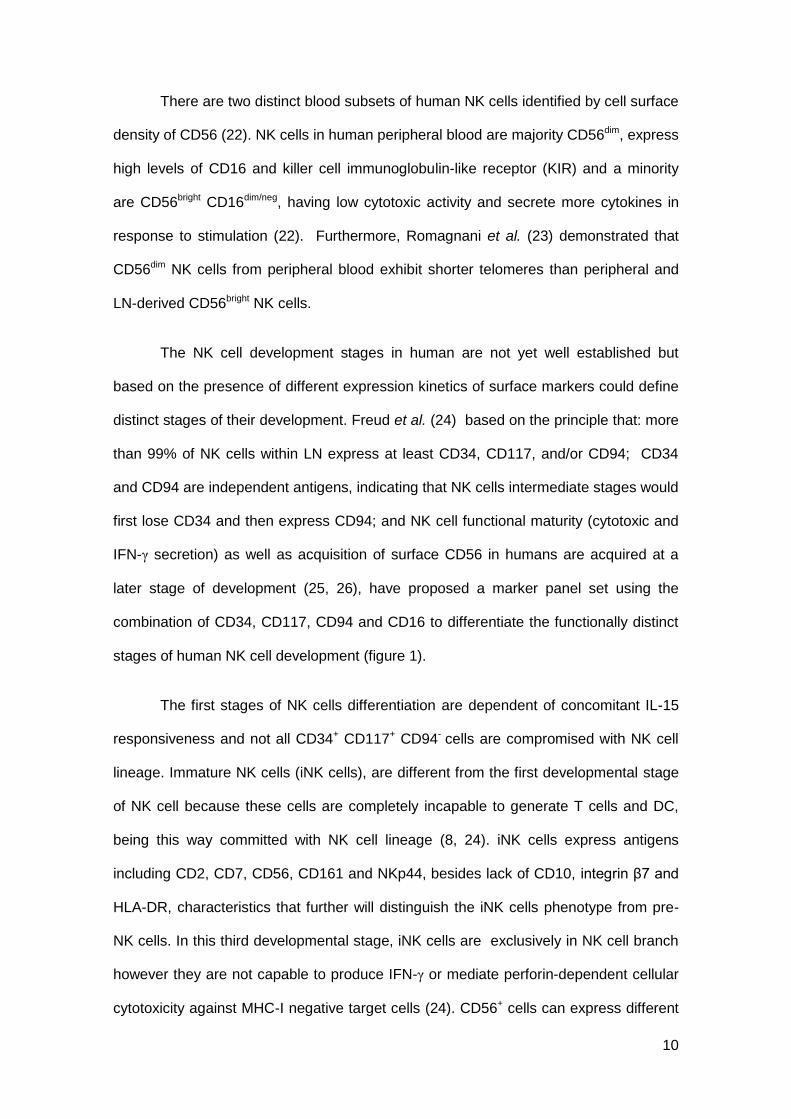
The dominant NK cell subset in LN are CD56bright (75% median value), however,
in peripheral blood and spleen, the majority of NK cells are a more mature subset:
CD56dim (95% and 85%, respectively) (32). Moreover, the CD56dim subsets in the
spleen and in the peripheral blood express CD16; CD56bright NK cells in LN are
negative for CD16 and express low levels of activation markers (HLA-DR and CD69)
(32). These observations suggest that the CD56bright cells are more immature and will
give rise to CD56dimCD16+ NK cells (the last stage of NK cell life) inside the LN and
12
then go to peripheral blood. It is important to mention that despite these stages
representing a possible developmental NK cell pathway, it is still possible that some
cells from each stage may still be terminally differentiated with essential functions for
body homeostasis.
Figure 2 – Phenotypical and functional properties of CD56bright
and CD56dim
NK cells. (a) Schematic
illustration of CD56 and CD16 expression on CD3-CD4
-CD14
-CD19
- lymphocytes with gates on CD56
bright
(blue) and CD56dim
(red) NK cells. (b) Relative expression levels of activation and inhibitory receptors on CD56
bright (blue) and CD56
dim (red), and NK cells from peripheral blood. (c) Functions of CD56
bright and
CD56dim
NK cells from peripheral blood (adapted from Björkström et al. Trends Immunol 2010 (33))
Fu et al. (34) recently found that according to the differential CD27/CD11b
expression NK cells could be characterized in terms of maturation state. This work
refer that during NK cell maturation, they acquire CD27 having a highest cytokine
expression, suggesting that NK cells had the ability to produce cytokines, low
expression of CD16, suggesting a diminished cytotoxic capacity. After acquisition of
CD27, NK cells acquire CD11b and lost CD27. These NK cells had the highest CD16
expression, suggesting that they have the strongest cytotoxic capacity. Summary, NK
cells during development/maturation pass for four stages according to CD27/CD11b
expression: CD27-CD11b-, CD27+CD11b-, CD27+CD11b+ and finally CD27-CD11b+.
13
Recently, CD57 was described as a marker for NK cell terminal differentiation
as happens in CD8+ T cells (35). Authors refer CD57+ NK cells as subset of highly
mature cells, having lower frequency of IFN-γ+ cells comparatively to CD57- cells, lower
proliferative capacity and with a mature phenotype.
Function properties
NK cell functions can be classified in three categories: cytotoxicity, cytokine and
chemokine secretion and contact-dependent cell costimulation.
Cytotoxicity
NK cells can kill certain infected cells and tumor target cells apart of their MHC
expression (36). NK cells have a relatively large number of cytolytic granules (secretory
lysosomes) containing perforin and various granzymes. After the contact between an
NK cell and its target, these granules travel to the contact zone with the susceptible
target cell (immunological synapse), and the contents are released to effect lysis.
Perforin-dependent cytotoxicity is the major mechanism of NK cell lysis, but NK cells
have also other ways of killing, namely in a perforin-independent manner utilizing FAS
ligand, TNF or TNF-related apoptosis-inducing ligand (TRAIL), although with less
efficiency and in a slower time kinetic.
Cytokine and chemokine secretion
NK cells are best noted for their ability to produce IFN-γ but also produce a
number of other cytokines and chemokines which contribute to the resistance against
infectious agents (37-39). Killing and cytokine secretion are mediated by two different
subsets of human NK cells characterized by the intensity of expression of CD56 and
CD16 on their surface.
14
Contact-dependent cell costimulation
NK cells express several costimulatory ligands including CD40L (CD154) and
OX40L, allowing them to provide a costimulatory signal to T cells or B cells (40, 41).
NK cells may serve as a bridge in an interactive loop between innate and adaptive
immunity. Dendritic cells (DC) stimulate NK cells, which then deliver a costimulatory
signal to T or B cells allowing for an optimal immune response. NK cells also stimulate
cells from the innate immune systems after being stimulated by them.
Cytokines and chemokines
The cytokines play a key role in NK cell activation. They are immunomodulating
molecules, once secreted by infected cells, they signal NK cells for the presence of
pathogens. NK cells produce cytokines after being stimulated, in part by the monocyte-
derived cytokines during the early pro-inflammatory response to infection and also by
the a subset of NK cells present at the site of inflammation (42).
NK cells produce a range of cytokines, including haematopoietic factors such as
IL-3 and granulocyte–macrophage colony-stimulating factor (GM-CSF), TNF-α and
regulatory cytokines such as transforming growth factor (TGF-β) and IFN-γ (42). In both
viral and bacterial models of infection, IFN-γ production by NK cells has been shown to
be a crucial event in successful resolution of infection (43). These molecules secreted
by NK cells will stimulate phagocytosis of bacteria by macrophages and facilitate their
elimination via a number of mechanisms including the generation of reactive oxygen
and nitrogen species important in immune response (44). In a very early phase of
infection, IL-12 is produced and will be responsible for driving NK cells to produce IFN-
γ (45).
The CD56bright NK cell subset produces significantly more IFN-γ following IL-18
and IL-12 stimulation compared with CD56dim NK cells (45).
15
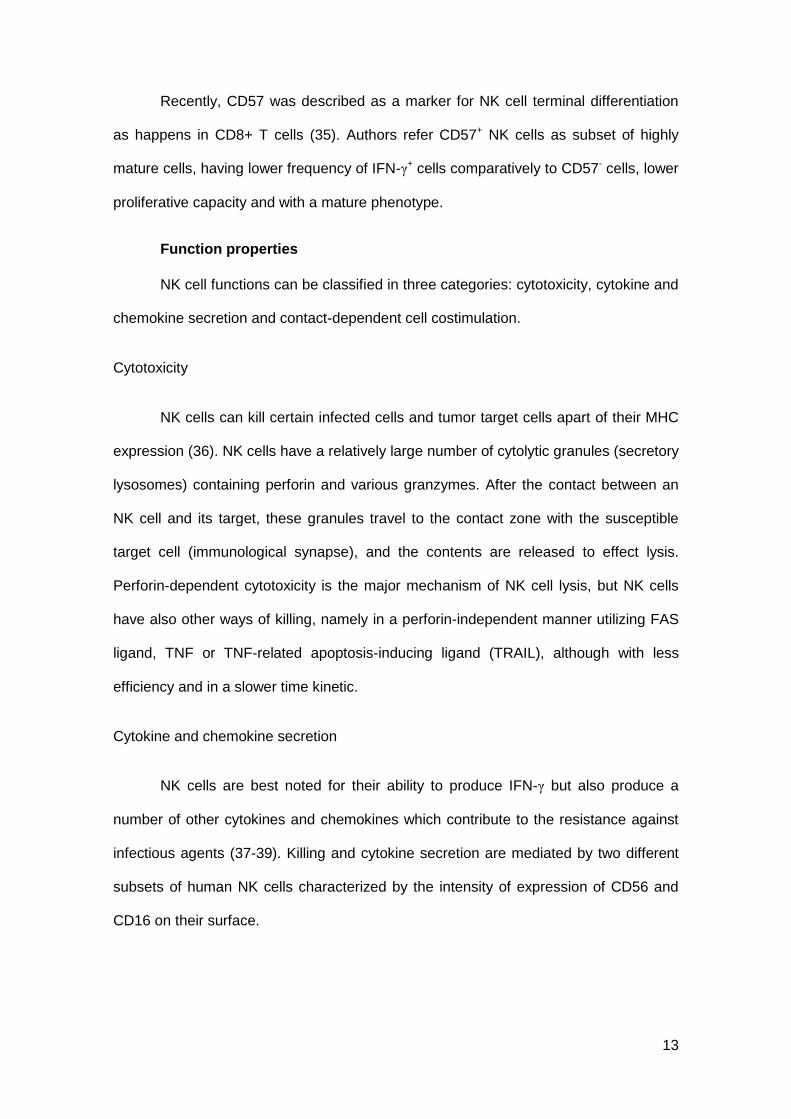
Natural Cytotoxicity Receptors (NCRs) and other activating receptors
Natural cytotoxicity receptors are an important group of activating receptors
consisting of NKp30 (CD337), NKp44 (CD336) and NKp46 (CD335) expressed
exclusively on NK cell surface (46). NCRs play a major role in the NK-mediated killing
of most tumor cells (47). NKp46 and NKp30 are constitutively expressed on resting or
activated NK cells, enabling a precise identification of all NK cells (which is not true for
other widely used NK cell markers including CD56 and CD16) and NKp44 is selectively
expressed only by IL-2 activated NK cells (47, 48). The ligands for the NCRs are not
well characterized but seem to exist on tumor cells and virally infected cells.
NK cells also express other triggering receptors that contribute to cell activation
and target cell killing, including NKG2D, NKp80, NTB-A (CD352), 2B4 (CD244),
DNAM-1 (CD226), and NKG2C. Among these molecules, NKG2D forms homodimers,
is not structurally related to the other NKG2 receptors and represents a major triggering
receptor that is known to specifically recognize the stress-inducible MHC class I-related
chain molecules and plays a role in NK-mediated cytolysis (47, 49). On the contrary,
NKp80, NTB-A, 2B4, and NKG2C appear to synergize with NCRs and NKG2D in the
NK-mediated cytolysis, working as co-receptors (47).
16
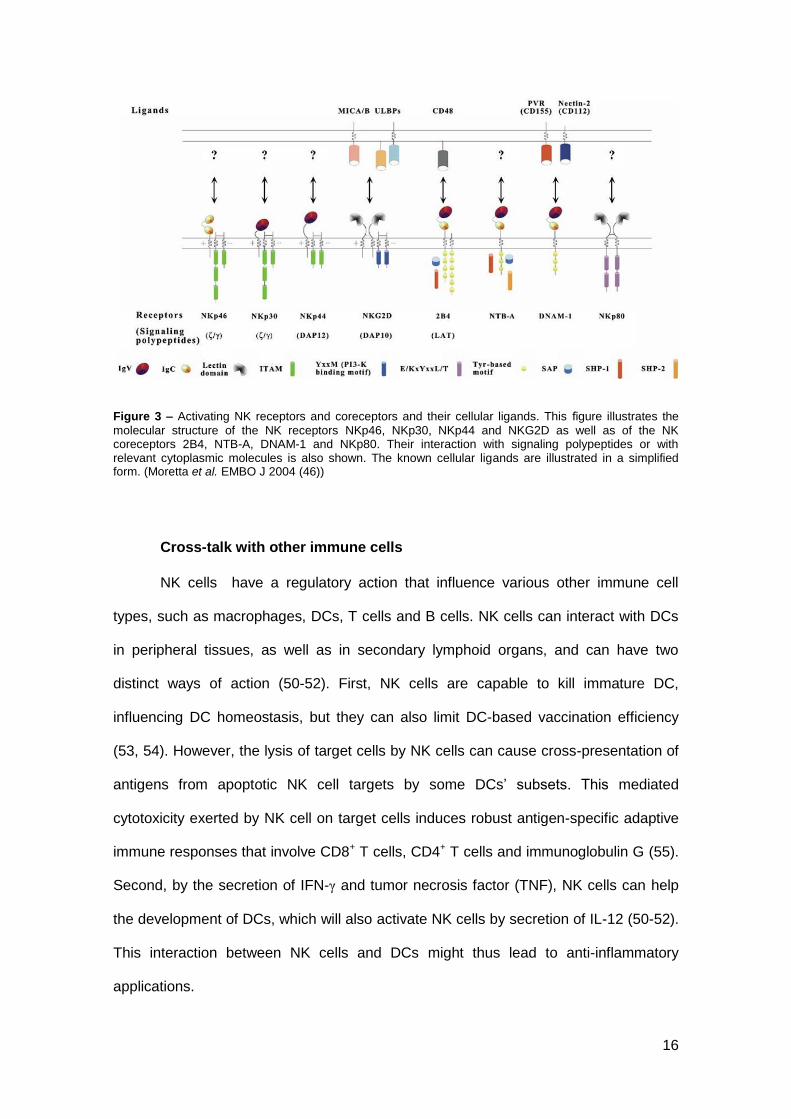
Figure 3 – Activating NK receptors and coreceptors and their cellular ligands. This figure illustrates the
molecular structure of the NK receptors NKp46, NKp30, NKp44 and NKG2D as well as of the NK coreceptors 2B4, NTB-A, DNAM-1 and NKp80. Their interaction with signaling polypeptides or with relevant cytoplasmic molecules is also shown. The known cellular ligands are illustrated in a simplified form. (Moretta et al. EMBO J 2004 (46))
Cross-talk with other immune cells
NK cells have a regulatory action that influence various other immune cell
types, such as macrophages, DCs, T cells and B cells. NK cells can interact with DCs
in peripheral tissues, as well as in secondary lymphoid organs, and can have two
distinct ways of action (50-52). First, NK cells are capable to kill immature DC,
influencing DC homeostasis, but they can also limit DC-based vaccination efficiency
(53, 54). However, the lysis of target cells by NK cells can cause cross-presentation of
antigens from apoptotic NK cell targets by some DCs’ subsets. This mediated
cytotoxicity exerted by NK cell on target cells induces robust antigen-specific adaptive
immune responses that involve CD8+ T cells, CD4+ T cells and immunoglobulin G (55).
Second, by the secretion of IFN-γ and tumor necrosis factor (TNF), NK cells can help
the development of DCs, which will also activate NK cells by secretion of IL-12 (50-52).
This interaction between NK cells and DCs might thus lead to anti-inflammatory
applications.
17
In addition to the influence exercised in DC function, NK cells also influence
adaptive immune responses by direct action on T and B cells. The IFN-γ secretion by
NK cells can help the priming of CD4+ T helper type 1 (TH1) (56, 57). NK cells have
also the capacity of killing activated T cells, except T cells express sufficient amounts
of classical or non-classical MHC I molecules (58). Blockade of CD94-NKG2A
inhibitory receptors results in NK cell lysis of activated CD4+ T cells. This knowledge
can be useful in CD4+ T cell-dependent autoimmunity therapy by the use of blocking
antibodies to NKG2A to prevent it (58).
NK cells not only protect the host against pathological agents, but also control
the immune response exerted by other immune cells.
Killer-cell Immunoglobulin-like Receptors (KIRs)
Natural Killer cells and some subsets of T cells express in its surface receptors
belonging to the immunoglobulin-like receptors (KIRs). KIR nomenclature is based on
its structure: they can have two (KIR2D) or three (KIR3D) extracellular immunoglobulin-
like domains (59, 60). The cytoplasmic tail varies in length, a property connected to
functional activity: inhibitory KIRs have long (L) cytoplasmic tails with ITIM motifs and
activating KIRs have short (S) cytoplasmic tails which can associate with the ITAM-
containing DAP12 adaptor protein.
Currently, about 14 KIR genes and 2 pseudogenes have been described in the
KIR gene cluster on chromosome 19 in humans. The number of genes varies greatly
between individuals and there are only three commonly shared framework genes
present in all individuals (KIR2DL4, KIR3DL2 and KIR3DL3). KIR genes are highly
homologous so it is likely that the variability is due to gene duplications or non-allelic
homologous recombinations during evolution (61).
Based on the gene content two types of haplotypes have been defined, where B
haplotypes have more activating KIRs compared to A haplotypes. KIR haplotype B
18
have one or more of the KIR genes; 2DS1, 2DS2, 2DS3, 2DS5, 3DS1 and 2DL5 and
haplotype A lack all of these and can as an alternative possess inhibitory KIRs
including 2DL1, 2DL3 and 3DL1 as well as the activating 2DS4 (62). An extensive
allelic variation in several genes confers an even higher diversity to KIR genes that will
influence the amount of KIR expressed on each NK cell (63-65). In addition, some
allelic variants do not produce functional proteins expressed at the cell surface (64).
This highly diverse expression is believed to be important for giving a broad NK cell
response against different pathogens.
The KIR proteins are also expressed in a diverse way on NK cells (59, 60, 66).
However, once an NK cell clone has started to express a certain KIR gene during
development, the expression is established and does not appear to be affected by
cytokines (64, 67). In recent studies, it was described that KIR gene transcription is
controlled by epigenetic mechanisms such as methylation, and by the presence of a
bidirectional promoter able to stochastically switch direction of transcription during
maturation of the NK cell, determining if the NK cell will express the KIR gene or not
(68, 69). Resulting in a diverse KIR expression repertoire in NK cells that can recognize
almost every MHC class I molecule (66).
Natural Killer cells in infection
NK cells have long been demonstrated to be activated in vitro by virus-infected
cells (70). Other types of intracellular pathogens have also been shown to activate NK
cells for IFN-γ production or increase cytotoxicity (70, 71). Evidence for an implication
of NK cells in the control of extracellular pathogens is not defined (72).
NK cells are activated by a variety of intracellular pathogens, including many
viruses and also bacteria or protozoa having potential to contribute to the immune
defence against a variety of infections. However, in certain infections were a high of NK
19
cell activation is observed, there is no evidence that NK cells play a direct role in the
control of the pathogen (73). Thus, the modulation of NK cell functions by an infection
is not enough to indicate that NK cells contribute directly to the clearance of the
pathogen.
NK cell secretion of the cytokines TNF-α and IFN-γ is known to play a crucial
role in granuloma formation following challenge with intracellular bacteria, including
Mycobacterium avium and Francisella tularensis (74, 75). Granulomas help protect the
host from bacterial dissemination by isolating infectious foci.
NK cell activation resulting of infections by intracellular bacteria, such as Listeria
monocytogenes (76), or protozoa, such as Leishmania (77) or Plasmodium (78),
involves the production of IL-12 and IL-18 by innate immune cells such as DCs,
monocyte or macrophages and also the direct interactions between these cells and NK
cells. Activation receptors on primary NK cells can add to these cells the capacity of
IFN-γ production and also to the cytotoxic activity (38, 79). Finally, NK cells can
respond to a variety of chemokines being essential for their recruitment to the site of
inflammation quickly after infection, as demonstrated in the model of murine
cytomegalovirus infection in a seminal report from Salazar-Mather and colleagues (80),
more recently in Toxoplasma gondii infection (81) and reviewed elsewhere (82).
Tuberculosis
The World Health Organization (WHO) defines Tuberculosis as:
“… an infectious bacterial disease caused by Mycobacterium tuberculosis,
which most commonly affects the lungs. It is transmitted from person to person via
droplets from the throat and lungs of people with the active respiratory disease. In
healthy people, infection with Mycobacterium tuberculosis often causes no symptoms,
20
since the person's immune system acts to “wall off” the bacteria. The symptoms of
active TB of the lung are coughing, sometimes with sputum or blood, chest pains,
weakness, weight loss, fever and night sweats. Tuberculosis is treatable with a six-
month course of antibiotics.”
Mycobacterium tuberculosis (Mtb) infection remains a major international health
problem that is probable to become even more significant in coming years because of
the high prevalence of human immunodeficiency virus (HIV). Although it is estimated
that one-third of the world population is currently infected by M. tuberculosis, the
majority never develop the active disease (83), indicating the ability of human immune
responses to control the infection. On the other hand, approximately 10% of these
individuals develop active pulmonary disease. Immune mechanisms involved in this
differential response by each individual are not clearly explained. Genetic mechanisms
involved in immune response can also be one of the reasons.
Mtb is an obligatory aerobic, intracellular pathogen, which preferentially infects
lung tissue rich in oxygen, but can also spread to other parts of the body. The tubercle
bacilli enter the body via the respiratory and are phagocytosed by alveolar
macrophages as first event in the host-pathogen relationship that decides the outcome
of infection. Then, an influx of lymphocytes is observed and activated macrophages
migrate to the site of infection, granuloma is formed. The exponential growth of the
bacilli is verified and dead macrophages form a caseum containing the bacilli. The
bacilli can remain forever within the granuloma, get re-activated later or may get
released into the airways after enormous increase in number, necrosis of bronchi and
cavitation.
“Fibrosis represents the last-ditch defence mechanism of the host, where it
occurs surrounding a central area of necrosis to wall off the infection when all other
mechanisms failed” (84).
21
There are some other mechanisms that can be described in immune response
against TB: the binding of Mtb to monocytes/macrophages by complement, mannose
and other surface receptors; the fusion of phagolysossome that will allow the Mtb
degradation; the recruitment of accessory immune cells for the local of inflammatory
response; the role of reactive oxygen and nitrogen intermediates in the signalling of the
infection; the IFN-γ and TNF-α mediated anti-mycobacterial effects; the NK cells action
upon pathogens or infected monocytes; the antigen presentation by APCs to T
lymphocytes for the development of adaptive response; and finally, the role of B cells
or antibody in response to Mtb infection (84).
Natural killer cells in Tuberculosis
As integrant part of innate immune system, NK cells has been implicated in
early immune response to a variety of pathogens because they are capable of rapidly
producing IFN-γ and other immunoregulatory cytokines, as well as lysing specific target
infected cells always in the absence of prior activation. Some researches have
demonstrated that NK cells from the peripheral blood contribute for protective immunity
though IFN-γ of cytotoxic mechanisms, having a huge bactericidal role against Mtb
(85).
The role of NK cell receptors in cytotoxic-mediated killing of mononuclear
phagocytes infected with an intracellular bacterium has already been reported (85) in
the same work were they propose that the diminished NK activity during tuberculosis
infection is probably the 'effect' and not the 'cause' for the disease. Human NK cells are
known to directly lyse M. tuberculosis-infected monocytes and macrophages in vitro
(86, 87). In this work, it was found that NKp46 and NKG2D receptors contribute to NK
cell-mediated lysis of cells infected with Mtb and that reduced functional capacity of NK
cells is associated with severe manifestations in disease. Denis’ data (88) suggest an
22
important involvement of NK cells in host resistance to TB because of their elevated
lytic activity against Mtb-infected monocytes. Another study demonstrate the direct
binding of NKp44 to the mycobacterial surface (89), suggesting that ligands for other
NK cell receptors may play a role in the specific NK-mediated recognition of Mtb.
But the NK cells activity in Mtb-infection is not just lyse Mtb-infected cells, these
cells also actively restrict the infectious agent growth in an apoptosis-dependent but
Fas/FasL independent manner (90, 91) and this action can be further higher by
addition of IL-2, IL-12 and glutathione (90). Consistent with the protective role of NK
cells in tuberculosis (TB), reduced activity of NK cells has been found in active
pulmonary TB patients (85). Higher levels of pre-NK cells were observed in positive
tuberculin skin test (TST+) and in TB patients, and in addiction TST+ individuals
presented levels greatly increased of these cells in comparison to TB (92). Barcelos et
al. (92) also observed a selective increase in putative activated NK cells of TST+
individuals and demonstrated for TST+ and TB patients a distinct correlation profile
between NK cells and macrophage-like monocytes, suggesting that high levels of
activated NK cells together with macrophage-like monocytes may be involved in
protective mechanisms in putative TB-resistant individuals. This finding could be
important to explain the immunopathogenic context, since these cells contribute for
protective mechanisms because NK cells have a great ability to proliferate and their
potential to differentiate into CD3-CD16+CD56+ cells with higher cytotoxic activity.
Infection with the intracellular pathogen Mtb also results in local lung NK cell
accumulation and activation, however, their importance in clearing the infection is not
clear yet (93, 94). Junqueira-Kipnis et al. (94) explained that NK cells become activated
during the early response to Mtb infection, but their removal does not substantially
affect the expression of host resistance. Contrary, Roy et al. (95) identified a potential
new role for NK cells in maintaining the balance between the regulatory and effector
arms of the immune response to Mtb infection with the Treg cells lysis. Other findings
23
also suggest NK cells role upon other immune cells in response to Mtb infection,
promoting expansion of γδ T cells forming immune synapse and by soluble factors
TNF-α, GM-CSF, and IL-12, but not IFN-γ concluding the NK cells action might be
beneficial to prevention and control this infection (96).
Aim
In the present research on TB patients and healthy contacts it was intended to
analyze NK cell subsets, surface receptors and intracellular production of cytokines
(IFN-γ), accounting for the effect in Mycobacterium tuberculosis infection and to the
progression to pulmonary disease. Establishment of regulatory, cytotoxic and cell-
dependent contact status of NK cells in TB is aimed for an extended characterization of
NK cells in TB. The main objective is to clarify the role of NK cells in
immunopathogenesis and hypothetical contribution as targets for therapy interventions.
24
MATERIAL AND METHODS
25
Study population
The samples used in this study are from two different groups: healthy contacts
(HC) and pulmonary tuberculosis patients (TB) from Centro de Diagnóstico
Pneumológico (CDP) de Vila Nova de Gaia. Were studied 38 TB patients 68% male,
age 45±16 and 15 HC 73% male, age 38±14. Sample number in each experience is
referred in results (figure or table). Patients with concomitant conditions including
autoimmune disease, HIV infection, cancer, extrapulmonary TB and other systemic
disease were excluded from the present analysis. Samples from TB patients were
collected within the first two weeks of anti-mycobacterial therapy.
It was obtained informed consent from participants and approval from the Ethics
Committee of the Faculty of Medicine of the University of Coimbra and of the Faculty of
Medicine of the University of Porto.
Blood sampling
Peripheral blood samples were collected using one K3EDTA tube (3mL), one
Lithium heparin tube (4mL) and one tube for serum separation (5mL). Serum and
plasma aliquots were frozen at -80ºC. PBMCs from K3EDTA and samples from Lithium
heparin tubes were used to flow cytometry and cell culture, respectively.
Complete Blood Cell (CBC) count
CBC were released in COULTER AC •T diff Analyzer (Beckman Coulter) using
12µL of whole blood from K3EDTA tube. The Coulter method accurately counts and
sizes by detecting and measuring changes in electrical resistance when a particle in a
conductive liquid passes through a small aperture.
26
Enumeration of Lymphocyte subsets
In order to enumerate lymphocytes and subpopulations, leukocytes from 100µL
of each peripheral blood sample were labeled with surface monoclonal antibodies
Values represent mean ±SE (HC n=10; TB n=26). *p<0.05 compared to HC (Mann Whitney test).
All the parameters analysed in the CBC were within the reference values for
Portuguese populations (97). Comparing the two groups, there is only statistically
significant difference in the percentage of lymphocytes (p<0,05). This decrease of
lymphocytes is supported by several studies (98-100), other study found this decrease
30
in 46% of the untreated TB patients but a lymphocytosis in 6% of TB patients (101) and
two other reports, relate the lymphopenia with the severity of the disease (102, 103).
Enumeration of lymphocyte subsets
Lymphocyte subsets reference values are used to monitor infectious diseases
including tuberculosis. Using Flow Cytometry, these subsets were evaluated by the
differential surface expression of some markers: CD3+ (T cells); CD3+CD4+ (helper T
cells); CD3+CD8+ (cytotoxic T cells); CD3-CD19+ (B cells) and CD3-CD56+ (NK cells).
With Flow Cytometry data (percentage of cells) and the absolute values for
lymphocytes of the CBC it was possible to calculate the absolute numbers of each
lymphocyte subset.
Figure 4 – A, B – Representative dot plots of lymphocyte sub-populations in TB and HC, respectively. C – Lymphocyte sub-populations percentage in TB (gray; n=11) and HC (white; n=9). D – Absolute number of
lymphocyte sub-populations in TB and HC. *p<0.05 compared to HC (Mann Whitney test).
In terms of percentages of cells there are no statistically significant differences
and the distribution is similar between both groups. When the comparison is made in
31
number of cells there are important changes to report. All the lymphocytes subsets are
decreased in TB group, particularly cytotoxic T cells (p=0.0184), except B cells subset.
Since the number of lymphocytes was lower in TB, as was observed in CBC, was
expected that the same happen in its subsets. In the literature, the results for this type
of lymphocyte counts are not consensual. Wu et al. (104) observed a decrease in CD3+
and CD3+CD4+, an increase in B cells and CD3+CD8+ and a similar numbers in NK
cells between TB and controls. Ainslie et al. (105) also found decrease in CD3+CD4+
and an increase in CD3+CD8+. Rodrigues et al. (106) and Beck et al. (107) describe a
decrease in both CD3+CD4+ and CD3+CD8+. Uppal et al. (108) observed a decrease in
CD3+CD4+ but similar levels for CD3+CD8+, Hernandez et al. (109) found significant
lower values for B cells and similar for CD3+. These contrasting results may be
explained by the possibility that the modifications of PBMCs change over time since
immunological factors seem to change in concentrations over the time.
Total NK cells
NK cells are lymphocytes phenotypically characterized as CD3-CD56+. Once
the work focused the NK cells, it was performed another evaluation of this cells in TB
and HC using labelling with mAbs in other fluorochromes.
Figure 5 - A, B – Representative dot plots of total NK cells (CD3 vs. CD56) in TB and HC, respectively. C – Analysis of total NK cells (CD3
-CD56
+) in peripheral blood of TB (gray, n=27) and HC (white, n=9).
D – Mean fluorescence intensity of CD56 and CD3 in NK cells of TB and HC. Gated lymphocytes were
used in analysis. Not significant results. (Mann Whitney test).
32
Once again the results only present a trend to a decrease of NK cells in TB
comparatively to HC. As was referred above, other studies also didn’t find significant
differences between these two groups. It is important to report that the mAbs used in
this labelling seems to be unstable since the population CD3+CD56+ is not according to
what was expected. The mean of fluorescence intensity for CD3 and CD56 in CD3-
CD56+ population in both groups was analysed and CD56 was no significantly increase
in HC population. These increase that mean a higher expression of this molecule can
be due to the instability of the fluorochrome so, in the future, different fluorochromes
should be tested.
For CD3-CD56+ populations in both TB and HC were evaluated theirs
expression of CD16 as well as their distribution in terms of CD27/CD11b. The results
are represented in Table 3.
Table 3 – Percentage of cells CD16+ and in each CD27/CD11b subset for CD3
-CD56
+ in TB and HC.
Means of fluorescence intensity for CD16, CD27 and CD11b.
HC TB P
CD16+
% 62.83 ±20.70 57.21 ±17.45 0.5837
MFI CD16 1336.33 ±381.58 1077.04 ±684.55 0.0860
CD11b- CD27
+
% 1.25 ±1.23 1.17 ±1.23 0.9272
MFI CD27 2177.75 ±1450.53 1240.08 ±997.29* 0.0140
MFI CD11b 261.25 ±54.00 243.95 ±73.40 0.7453
CD11b+ CD27
+
% 1.92 ±1.40 7.69 ±11.54* 0.0235
MFI CD27 1163.33 ±289.48 841.96 ±337.14* 0.0137
MFI CD11b 1822.22 ±479.18 1739.70 ±800.74 0.4650
CD11b+ CD27
-
% 64.94 ±20.51 65.59 ±15.28 0.8982
MFI CD27 13.52 ±28.14 65.33 ±84.43 0.0531
MFI CD11b 2228.78 ±503.08 2144.59 ±807.88 0.6348
CD11b- CD27
-
% 31.89 ±20.63 25.57 ±14.33 0.4216
MFI CD27 37.77 ±30.89 49.09 ±37.20 0.5211
MFI CD11b 135.29 ±53.40 122.73 ±51.06 0.6090
Values represent mean ±SE (HC n=27; TB n=9). *p<0.05 compared to HC. (Mann Whitney test)
The distribution of these surface makers will be explained in more detail below,
where it is only important to refer that the CD16 expression tends to decrease and it is
33
observed a higher percentage in CD11b+CD27+ subset in TB patients, probably due to
a decrease in NK cell maturation. The partial decrease in CD16 expression does not
corroborate a previous study that reports a great increase of CD16 expression in TB
patients (110).
Proposal of NKp46 for NK cell definition
NKp46, a natural cytotoxicity receptor, is expressed almost exclusively in NK
cells. Recently this molecule is being referred as a better markers for NK cells than
CD56, so it as analysed its expression of CD3- subset of lymphocytes (111).
It was observed a higher percentage of CD3- cells expressing NKp46 in TB
relatively to HC, but with a decrease level of expression of this receptor. The role of
NKp46 in lysis of infected monocytes with Mtb is already defined. One study correlates
this capacity of lyse with increased expression of mRNA of NKp46 receptor and also
refers that this expression in reduced in TB patients (86). Results presented here are
concordant because despite of the higher percentage of NKp46+ cells present in TB, its
expression tends to decrease.
When the expression of CD16 and subset distribution of CD27/CD11b was
evaluated (Table 4), once again it was observed an increase in CD11b+CD27+ (not
Figure 6 – A, B – Representative dot plots of NK cells (CD3 vs. NKp46) in TB and HC, respectively. C –
Analysis of NK cells (CD3-NKp46
+) in peripheral blood of TB (gray, n=27) and HC (white, n=9). D – Mean
fluorescence intensity of NKp46 and CD3 in NK cells of TB and HC. Gated lymphocytes were used in analysis. (Mann Whitney test).
34
statistically significant) in TB patients, with a slight decreased expression of CD27 in
this subset. This result points towards a more immature form of cells in TB patients.
Table 4 – Percentage of cells CD16+ and in each CD27/CD11b subset for CD3
-NKp46
+ in TB and HC.
Means of fluorescence intensity for CD16, CD27 and CD11b.
HC TB P
CD16+
% 84.51 ±6.09 80.84 ±13.35 0.7285
MFI CD16 1478.56 ±453.33 1174.26 ±717.53 0.0734
CD11b- CD27
+
% 0.26 ±0.38 0.43 ±0.86 0.7549
MFI CD27 892.75 ±764.06 622.40 ±224.02 0.5249
MFI CD11b 127.71 ±79.46 232.96 ±93.04* 0.0102
CD11b+ CD27
+
% 5.29 ±3.71 11.45 ±15.41 0.4762
MFI CD27 685.25 ±107.39 524.15 ±139.35** 0.0045
MFI CD11b 2095.00 ±218.10 1752.31 ±611.03* 0.0403
CD11b+ CD27
-
% 91.32 ±3.89 85.03 ±15.04 0.4321
MFI CD27 17.07 ±38.57 44.83 ±58.09 0.1001
MFI CD11b 2476.22 ±513.43 2351.07 ±829.02 0.4876
CD11b- CD27
-
% 3.12 ±3.07 3.10 ±3.10 0.9418
MFI CD27 16.75 ±22.38 61.53 ±62.26 0.0929
MFI CD11b 113.43 ±31.22 177.76 ±89.13* 0.0258
Values represent mean ±SE (HC n=27; TB n=9). *p<0.05 **p<0.01 compared to HC (Mann Whitney test).
When the values of CD3-CD56+ were compared to CD3-NKp46+, the first
observation was that CD3-NKp46+ population is smaller, meaning that if only CD3-
NKp46+ was considering as NK cells, probably would be lost a lot of information. So,
CD3-CD56+ still remain as the better characterization for NK cells.
35
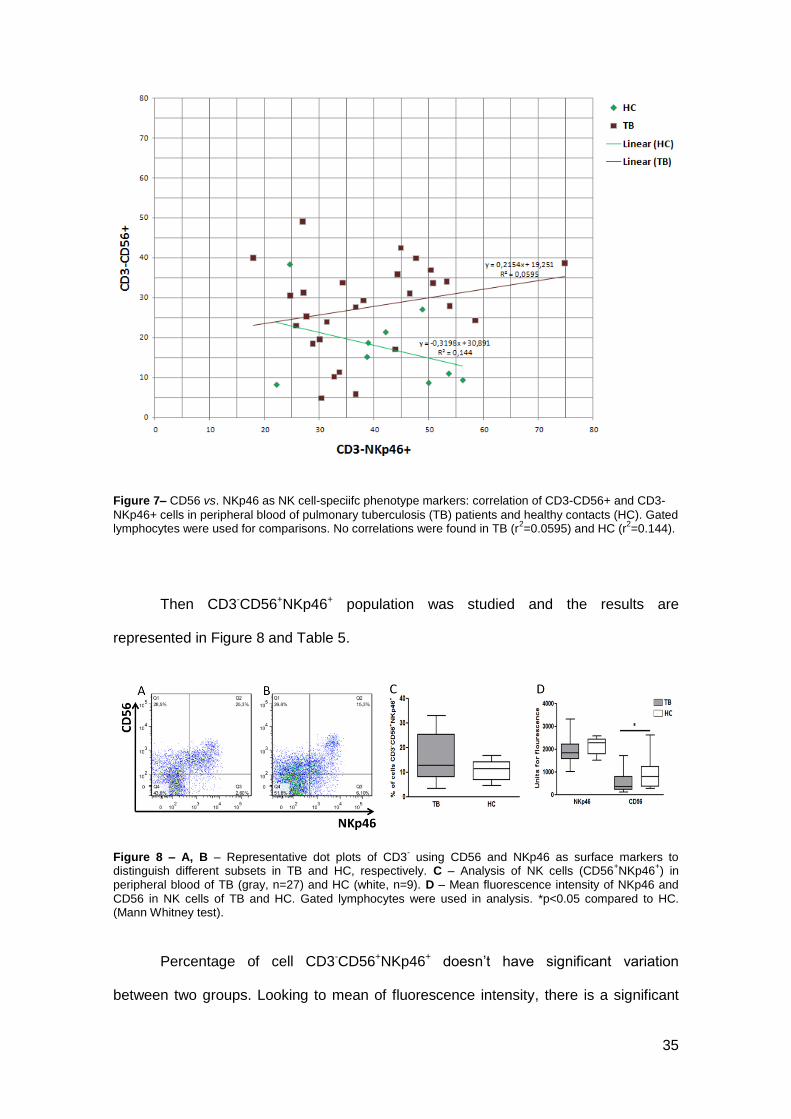
Figure 7– CD56 vs. NKp46 as NK cell-speciifc phenotype markers: correlation of CD3-CD56+ and CD3-
NKp46+ cells in peripheral blood of pulmonary tuberculosis (TB) patients and healthy contacts (HC). Gated lymphocytes were used for comparisons. No correlations were found in TB (r
2=0.0595) and HC (r
2=0.144).
Then CD3-CD56+NKp46+ population was studied and the results are
represented in Figure 8 and Table 5.
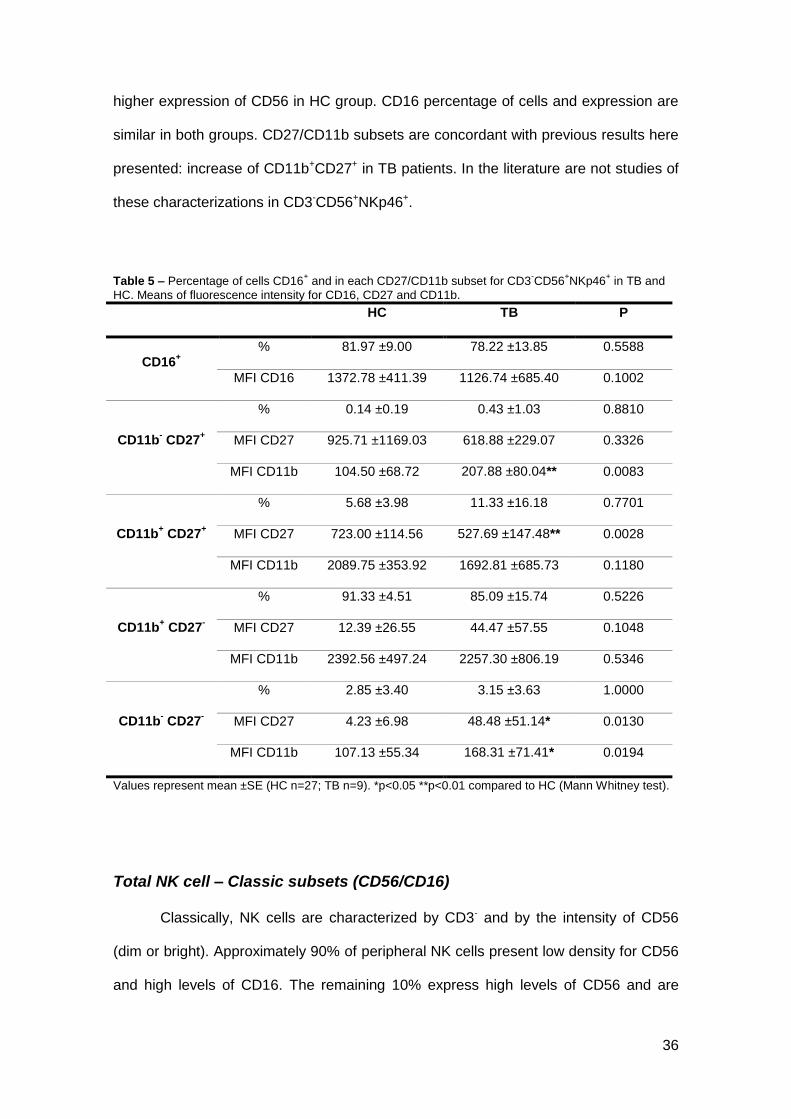
Figure 8 – A, B – Representative dot plots of CD3- using CD56 and NKp46 as surface markers to
distinguish different subsets in TB and HC, respectively. C – Analysis of NK cells (CD56+NKp46
+) in
peripheral blood of TB (gray, n=27) and HC (white, n=9). D – Mean fluorescence intensity of NKp46 and
CD56 in NK cells of TB and HC. Gated lymphocytes were used in analysis. *p<0.05 compared to HC. (Mann Whitney test).
Percentage of cell CD3-CD56+NKp46+ doesn’t have significant variation
between two groups. Looking to mean of fluorescence intensity, there is a significant
36
higher expression of CD56 in HC group. CD16 percentage of cells and expression are
similar in both groups. CD27/CD11b subsets are concordant with previous results here
presented: increase of CD11b+CD27+ in TB patients. In the literature are not studies of
these characterizations in CD3-CD56+NKp46+.
Table 5 – Percentage of cells CD16+ and in each CD27/CD11b subset for CD3
-CD56
+NKp46
+ in TB and
HC. Means of fluorescence intensity for CD16, CD27 and CD11b.
HC TB P
CD16+
% 81.97 ±9.00 78.22 ±13.85 0.5588
MFI CD16 1372.78 ±411.39 1126.74 ±685.40 0.1002
CD11b- CD27
+
% 0.14 ±0.19 0.43 ±1.03 0.8810
MFI CD27 925.71 ±1169.03 618.88 ±229.07 0.3326
MFI CD11b 104.50 ±68.72 207.88 ±80.04** 0.0083
CD11b+ CD27
+
% 5.68 ±3.98 11.33 ±16.18 0.7701
MFI CD27 723.00 ±114.56 527.69 ±147.48** 0.0028
MFI CD11b 2089.75 ±353.92 1692.81 ±685.73 0.1180
CD11b+ CD27
-
% 91.33 ±4.51 85.09 ±15.74 0.5226
MFI CD27 12.39 ±26.55 44.47 ±57.55 0.1048
MFI CD11b 2392.56 ±497.24 2257.30 ±806.19 0.5346
CD11b- CD27
-
% 2.85 ±3.40 3.15 ±3.63 1.0000
MFI CD27 4.23 ±6.98 48.48 ±51.14* 0.0130
MFI CD11b 107.13 ±55.34 168.31 ±71.41* 0.0194
Values represent mean ±SE (HC n=27; TB n=9). *p<0.05 **p<0.01 compared to HC (Mann Whitney test).
Total NK cell – Classic subsets (CD56/CD16)
Classically, NK cells are characterized by CD3- and by the intensity of CD56
(dim or bright). Approximately 90% of peripheral NK cells present low density for CD56
and high levels of CD16. The remaining 10% express high levels of CD56 and are
37
negative for CD16 (112). This last subset is more immature, it is thought that during
their development and cytotoxicity acquisition NK cells pass through three stages:
CD56dimCD16- (immature), CD56brightCD16- (“regulatory”) and CD56dimCD16+
(cytotoxic). In this study was considered another stage: CD56brightCD16+ as a “pro-
inflammatory” stage.
Figure 9 – A, B – Representative dot plots of NK cell subsets according to CD56 and CD16 surface expression in TB and HC, respectively. C – Analysis of NK cell sub-sets in peripheral blood of TB (gray, n=29) and HC (white, n=10). D – Mean fluorescence intensity of CD56 and CD16 in NK cell subsets of TB
and HC. Gated lymphocytes were used in analysis. *p<0.05 **<0.01 compared to HC. (Mann Whitney test)
Data represent NK cells normalized for a total of 100%. As can be observed in
first graph (C) there are no statistically significant changes in both of groups for NK cell
subsets, but the values for more mature subsets in TB patients tend to be increased.
The mean of fluorescence intensity has some variations in CD16 expression with a
significant decrease in TB patients. This means that although TB patients present
these increased values in more mature subsets, NK cells have less cytotoxic capacity
in comparison with HC.
Previous data supports these results referring a decrease in CD3-CD16-
/+CD56dim and an increase in CD3-CD16-/+CD56bright in TST+ controls (92). However,
38
Bozzano et al. (113) found decreased proportions of CD16+/-CD56bright and increased
values of CD16+CD56dull subsets in TB.
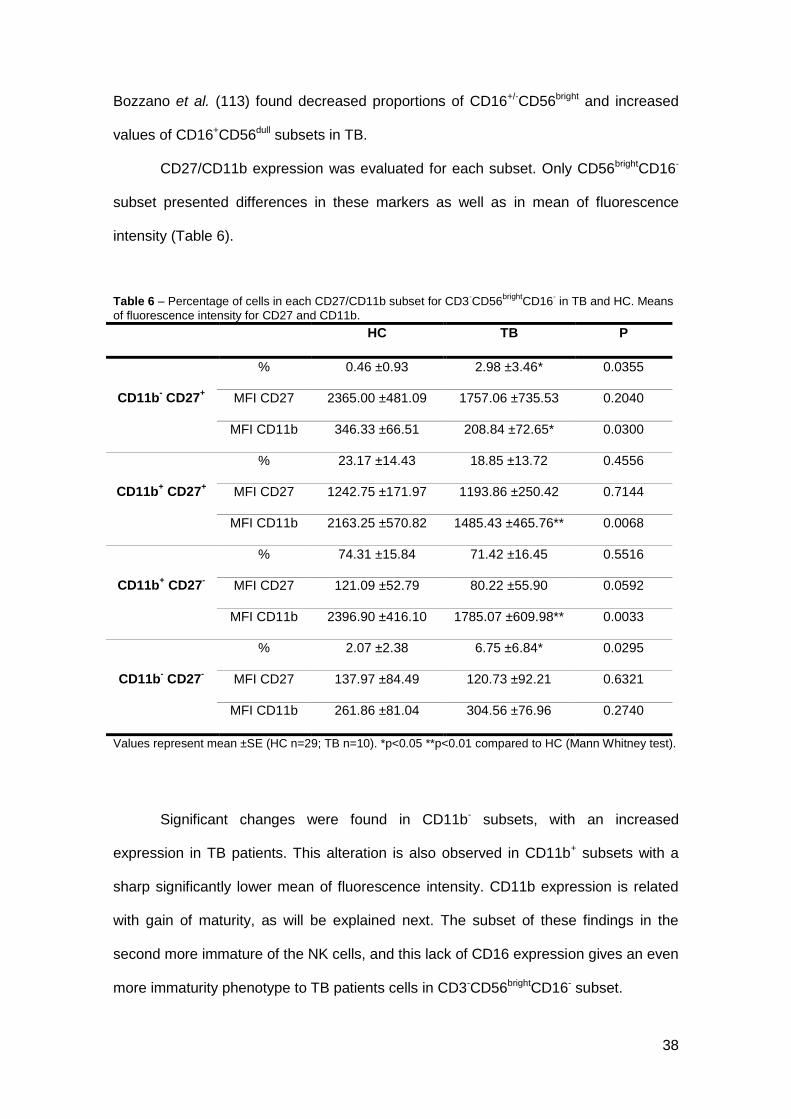
CD27/CD11b expression was evaluated for each subset. Only CD56brightCD16-
subset presented differences in these markers as well as in mean of fluorescence
intensity (Table 6).
Table 6 – Percentage of cells in each CD27/CD11b subset for CD3-CD56
Values represent mean ±SE (HC n=29; TB n=10). *p<0.05 **p<0.01 compared to HC (Mann Whitney test).
Significant changes were found in CD11b- subsets, with an increased
expression in TB patients. This alteration is also observed in CD11b+ subsets with a
sharp significantly lower mean of fluorescence intensity. CD11b expression is related
with gain of maturity, as will be explained next. The subset of these findings in the
second more immature of the NK cells, and this lack of CD16 expression gives an even
more immaturity phenotype to TB patients cells in CD3-CD56brightCD16- subset.
39
CD27/CD11b
Recently, Fu et al. (34), made some progress in NK cell phenotyping relatively
to CD27/CD11b expression and defined four stages that describe NK cell development:
CD11b-CD27-, CD11b-CD27+, CD11b+CD27+ and CD11b+CD27-. So, during their
maturation cells acquire and lose CD27 and acquire CD11b. In peripheral blood NK
cells have their more mature stage: CD11b+CD27-.
Data of this kind of analysis is represented in Figure 10. There are no
differences in subset distribution of NK cells in TB and HC. In other words, according to
this characterization NK cells in terms of CD27/CD11b, TB and HC have the same
level of development.
Figure 10 – A, B – Representative dot plots of NK cells and NK cell subsets according to CD27 and CD11b surface expression in TB and HC, respectively. C – Analysis of NK cell subsets in peripheral blood of TB (gray, n=29) and HC (white, n=11). D – Mean fluorescence intensity for CD27 and CD11b in NK cell
subsets of TB and HC. Gated lymphocytes were used in analysis. *p<0.05 compared to HC (Mann Whitney test).
40
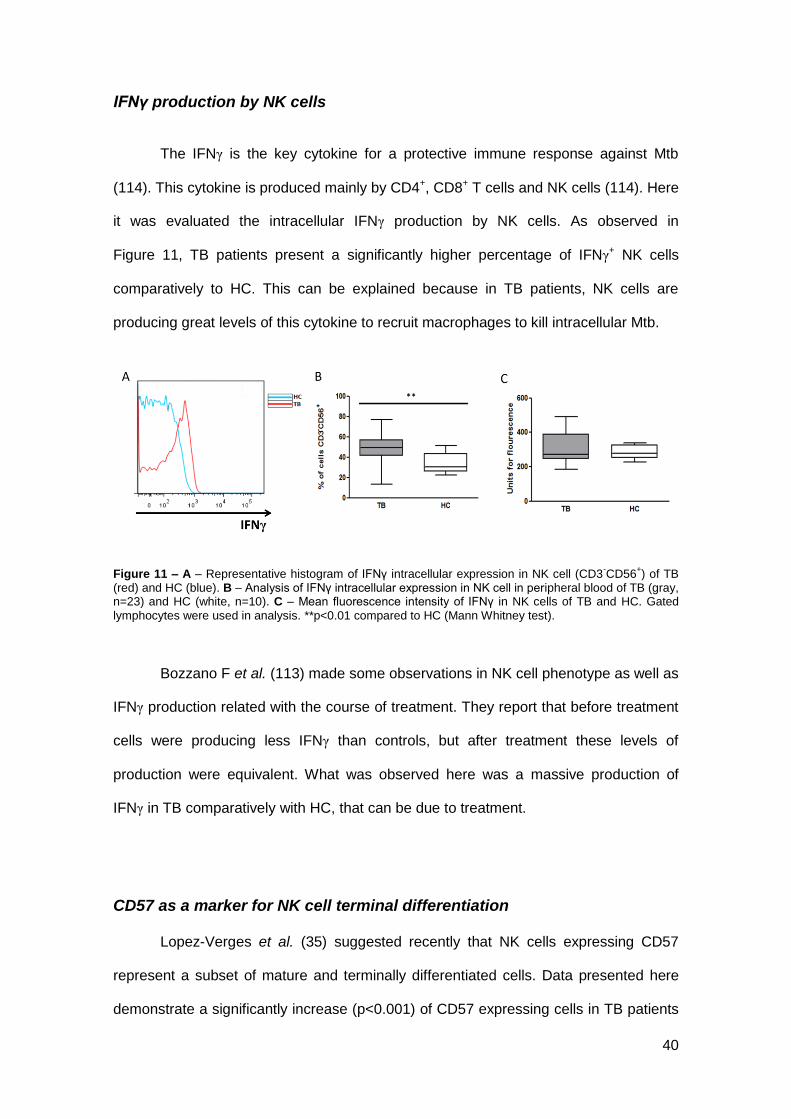
IFNγ production by NK cells
The IFNγ is the key cytokine for a protective immune response against Mtb
(114). This cytokine is produced mainly by CD4+, CD8+ T cells and NK cells (114). Here
it was evaluated the intracellular IFNγ production by NK cells. As observed in
Figure 11, TB patients present a significantly higher percentage of IFNγ+ NK cells
comparatively to HC. This can be explained because in TB patients, NK cells are
producing great levels of this cytokine to recruit macrophages to kill intracellular Mtb.
Figure 11 – A – Representative histogram of IFNγ intracellular expression in NK cell (CD3-CD56
+) of TB
(red) and HC (blue). B – Analysis of IFNγ intracellular expression in NK cell in peripheral blood of TB (gray, n=23) and HC (white, n=10). C – Mean fluorescence intensity of IFNγ in NK cells of TB and HC. Gated
lymphocytes were used in analysis. **p<0.01 compared to HC (Mann Whitney test).
Bozzano F et al. (113) made some observations in NK cell phenotype as well as
IFNγ production related with the course of treatment. They report that before treatment
cells were producing less IFNγ than controls, but after treatment these levels of
production were equivalent. What was observed here was a massive production of
IFNγ in TB comparatively with HC, that can be due to treatment.
CD57 as a marker for NK cell terminal differentiation
Lopez-Verges et al. (35) suggested recently that NK cells expressing CD57
represent a subset of mature and terminally differentiated cells. Data presented here
demonstrate a significantly increase (p<0.001) of CD57 expressing cells in TB patients
41
with a partial increase in intracellular IFNγ in these cells represented in Figure 12. In
terms of CD27/CD11b distribution, results for CD57+ subset are concordant with what
was expected: almost of cells are CD11b+CD27-, confirming their high degree of
maturation (Table 7). CD16 expression is not according with this state of differentiation;
it was expected higher percentage of cells expressing this marker. This may be due to
instability of marker once cells were first extracellular labelled and than permeabilized,
so there may be some interference with extracellular labelling of this marker.
Figure 12 – A - Representative histogram of CD57 surface expression in NK cell (CD3-CD56
+) of TB (red)
and HC (blue). B – Analysis of CD57 expression on NK cell in peripheral blood of TB (gray, n=20) and HC (white, n=11). C – Mean fluorescence intensity of CD57 in NK cells of TB and HC. D – Representative histogram of IFNγ intracellular expression on NK cell CD57
+ for TB (red) and HC (blue). E – Anaysis of
IFNγ intracellular expression on NK cells CD57+. F – Mean fluorescence intensity of IFNγ in NK cells
CD57+ in TB and HC. Gated lymphocytes were used in analysis. ***p<0.001 compared to HC (Mann
Whitney test).
The meaning of these results can be explained by the NK response to infection,
once Lopez-Verges (35) explained that CD57+ cells have more lytic activity and higher
sensibility to stimulation. According to the same author, these cells also express higher
levels of NCRs being well prepared to oppose infected cells with Mtb.
42
Table 7 – Percentage of cells expressing CD16 and in each CD27/CD11b subset for CD3-CD56
+CD57
+ in
TB and HC. Means of fluorescence intensity for CD16, CD27 and CD11b.
Values represent mean ±SE (HC n=20; TB n=11). *p<0.05 compared to HC (Mann Whitney test).
Surface expression of CD94 and NKG2D
CD94 is a Killer cell lectin-like receptor belonging to subfamily D, number 1
(also known as KLRD1). This receptor appears usually as heterodimers with elements
of NKG2 family. NKG2D, a member of NKG2 family, is an activating receptor. CD94
can also appears linked with NKG2A (inhibitory receptor) and NKG2C (activatory
receptor) as well as in form of oligodimer. Here as observed the co-expression of CD94
and NKG2D in TB and HC.
43
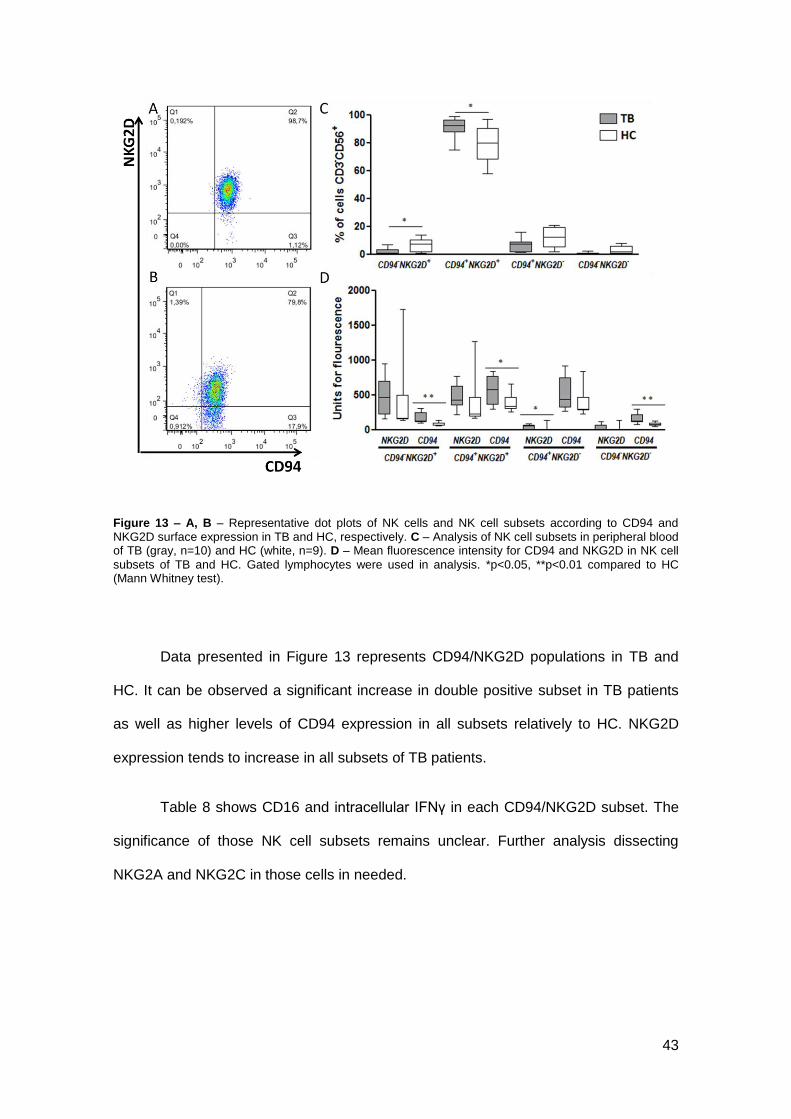
Figure 13 – A, B – Representative dot plots of NK cells and NK cell subsets according to CD94 and NKG2D surface expression in TB and HC, respectively. C – Analysis of NK cell subsets in peripheral blood of TB (gray, n=10) and HC (white, n=9). D – Mean fluorescence intensity for CD94 and NKG2D in NK cell
subsets of TB and HC. Gated lymphocytes were used in analysis. *p<0.05, **p<0.01 compared to HC (Mann Whitney test).
Data presented in Figure 13 represents CD94/NKG2D populations in TB and
HC. It can be observed a significant increase in double positive subset in TB patients
as well as higher levels of CD94 expression in all subsets relatively to HC. NKG2D
expression tends to increase in all subsets of TB patients.
Table 8 shows CD16 and intracellular IFNγ in each CD94/NKG2D subset. The
significance of those NK cell subsets remains unclear. Further analysis dissecting
NKG2A and NKG2C in those cells in needed.
44
Table 8 – Percentage of cells expressing CD16 and intracellular IFNγ in each CD94/NKG2D subset in TB and HC. Means of fluorescence intensity for CD16 and IFNγ.
HC TB P
CD94- NKG2D
+
% CD16 32.91 ±33.56 50.89 ±31.31 0.3154
MFI CD16 436.89 ±591.87 576.80 ±663.35 0.1207
% IFNγ 33.21 ±15.13 44.42 ±14.49 0.1912
MFI IFNγ 303.22 ±72.57 281.40 ±81.58 0.4470
CD94+ NKG2D
+
% CD16 39.77 ±24.19 58.86 ±20.66 0.0653
MFI CD16 306.22 ±325.78 423.40 ±440.73 0.0535
% IFNγ 39.48 ±3.75 44.29 ±6.99 0.2528
MFI IFNγ 271.78 ±44.67 277.00 ±57.82 0.8702
CD94+ NKG2D
-
% CD16 54.17 ±10.25 53.15 ±22.65 0.8421
MFI CD16 288.67 ±89.70 325.00 ±141.82 0.7197
% IFNγ 40.08 ±10.02 40.71 ±9.40 0.7802
MFI IFNγ 286.78 ±56.80 280.10 ±57.68 0.7802
CD94- NKG2D
-
% CD16 40.66 ±13.39 45.50 ±35.23 0.8380
MFI CD16 345.78 ±106.31 225.88 ±93.59* 0.0384
% IFNγ 37.74 ±15.15 32.78 ±29.21 0.4132
MFI IFNγ 301.89 ±87.13 264.71 ±48.07 0.4698
Values represent mean ±SE (HC n=10; TB n=9). *p<0.05 compared to HC (Mann Whitney test).
Other Natural Cytotoxicity Receptors (NCRs)
Natural cytotoxicity receptors (NCRs) play a major role in NK cell cytotoxicity
against transformed cells (47). NKp46, NKG2D and CD94 NCRs have already been
discussed in the results. It was also analysed NKp44, NKp30 and NKp80 positive cells,
expression, intracellular IFNγ, CD16 and CD27/CD11b positive cells and expression on
TB and HC. In data it can be observed increased levels of positive cells for all of these
NCRs as well as higher levels of intracellular IFNγ in TB patients (Figure 14). The most
significant increase in NCRs was observed for NKp80 and this receptor is also the
most expressed in NK cells in both groups. NKp30 is not only the least represented in
45
NK cells from two groups, but also the receptor that presented the least increase in TB
patients. Although in terms of expression NKp30 was significantly increased in TB
patients. NKp44 is present in a vast majority of NK cells in both groups however is
increased in TB patients.
Intracellular IFNγ positive cells were significantly elevated in all NCRs positive
cells and its expression tends to be elevated in TB patients.
NKp44+CD16+ cells decreased in both groups regarding to expected for cells in
high degree of maturation (Table 9).
46
Figure 14 – 1 – Results for NKp44+ NK cells (TB n=23, HC n=10). 2 – Results for NKp30+ NK cells (TB n=19, HC n=9). 3 – Results for NKp80+ NK cells (TB n=16, HC n=10). A – Representative histogram of each NCR surface expression in NK cell (CD3
-CD56
+) of TB (red) and HC (blue). B – Analysis of each
NCR expression on NK cell in peripheral blood of TB (gray) and HC (white). C – Mean fluorescence intensity of each NCR in NK cells of TB and HC. D – Representative histogram of IFNγ intracellular expression on NK cell positive for each NCR in TB (red) and HC (blue). E – Analysis of IFNγ intracellular expression on NK cells positive for each NCR. F – Mean fluorescence intensity of IFNγ in NK cells positive
for each NCR in TB and HC. Gated lymphocytes were used in analysis. *p<0.05, **p<0.01 compared to HC (Mann Whitney test).
47
CD27/CD11b subsets of NCRs positive populations had no significant
differences except for NKp80 in CD11b+CD27- subset were can be observed an
increase in TB patients (Table 11). But in general, almost all cells express CD11b and
are negative for CD27 in both groups.
Table 9 – Percentage of cells CD16+ and in each CD27/CD11b subset for CD3
-CD56
+NKp44
+ in TB and
HC. Means of fluorescence intensity for CD16, CD27 and CD11b.
Values represent mean ±SE (HC n=16; TB n=10). *p<0.05 and **p<0.01 compared to HC (Mann Whitney test).
Inhibitory KIR: KIR2DL1, KIR2DL2 and KIR3DL1
Killer cell immunoglobulin-like receptors (KIRs) belong to a highly polymorphic
family of receptors that recognise MHC-class I molecules. KIR acquisition is a late
event during NK cell maturation. These receptors are mostly inhibitors but they may
also have activating functions depending on the length of their cytoplasmic tail.
Inhibitory KIRs recognise MHC-class I molecules and suppress the cytotoxic activity of
NK cells.
Based on David G et al. (115) work descriptions, KIR2DL2 and KIR2DL1
phenotypes were analysed in TB patients and HC using a combination of mAbs (Figure
15 – 1, 2). Also KIR2DL2/DL3 and KIR3DL1 NK positive cells were analysed through
the use of specific mAbs (CD158b and CD158e, respectively).
50
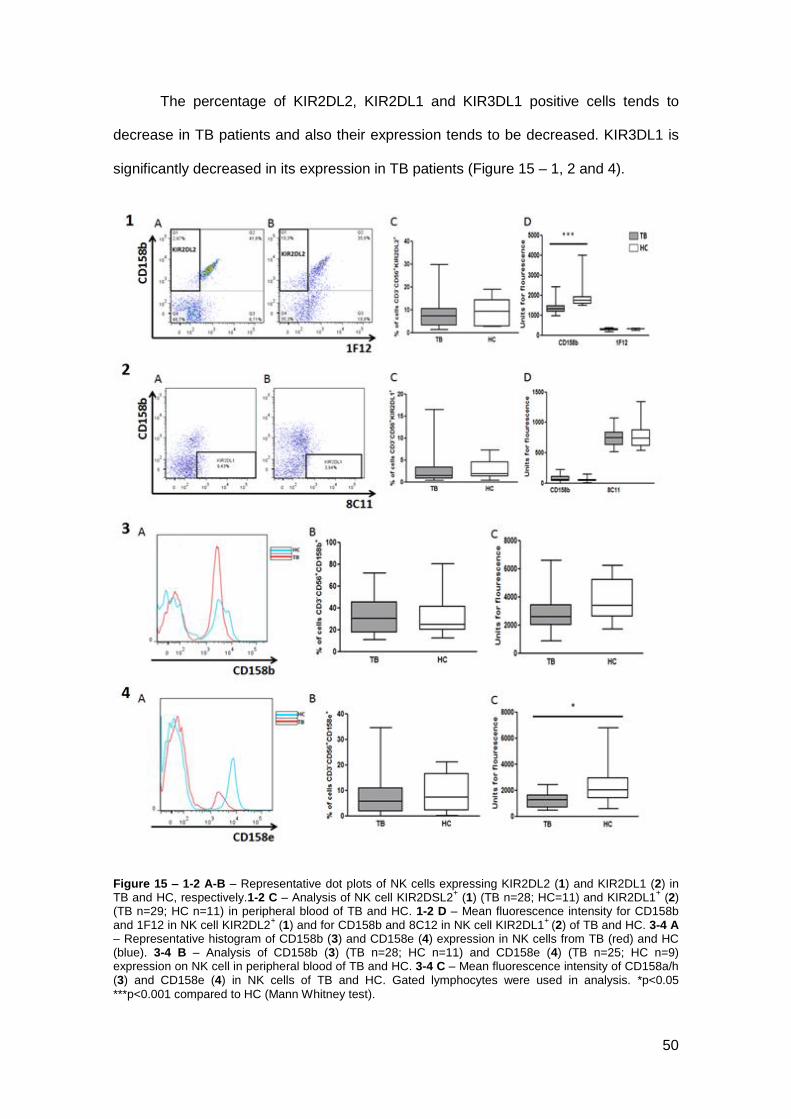
The percentage of KIR2DL2, KIR2DL1 and KIR3DL1 positive cells tends to
decrease in TB patients and also their expression tends to be decreased. KIR3DL1 is
significantly decreased in its expression in TB patients (Figure 15 – 1, 2 and 4).
Figure 15 – 1-2 A-B – Representative dot plots of NK cells expressing KIR2DL2 (1) and KIR2DL1 (2) in TB and HC, respectively.1-2 C – Analysis of NK cell KIR2DSL2
+ (1) (TB n=28; HC=11) and KIR2DL1
+ (2)
(TB n=29; HC n=11) in peripheral blood of TB and HC. 1-2 D – Mean fluorescence intensity for CD158b and 1F12 in NK cell KIR2DL2
+ (1) and for CD158b and 8C12 in NK cell KIR2DL1
+ (2) of TB and HC. 3-4 A
– Representative histogram of CD158b (3) and CD158e (4) expression in NK cells from TB (red) and HC (blue). 3-4 B – Analysis of CD158b (3) (TB n=28; HC n=11) and CD158e (4) (TB n=25; HC n=9) expression on NK cell in peripheral blood of TB and HC. 3-4 C – Mean fluorescence intensity of CD158a/h (3) and CD158e (4) in NK cells of TB and HC. Gated lymphocytes were used in analysis. *p<0.05
***p<0.001 compared to HC (Mann Whitney test).
51
Table 12 – Percentage of cells CD16+ and in each CD27/CD11b subset for KIR2DL2
+ cells in TB and HC.
Means of fluorescence intensity for CD16, CD27 and CD11b.
Values represent mean ±SE (HC n=25; TB n=9). Not significant data (Mann Whitney test).
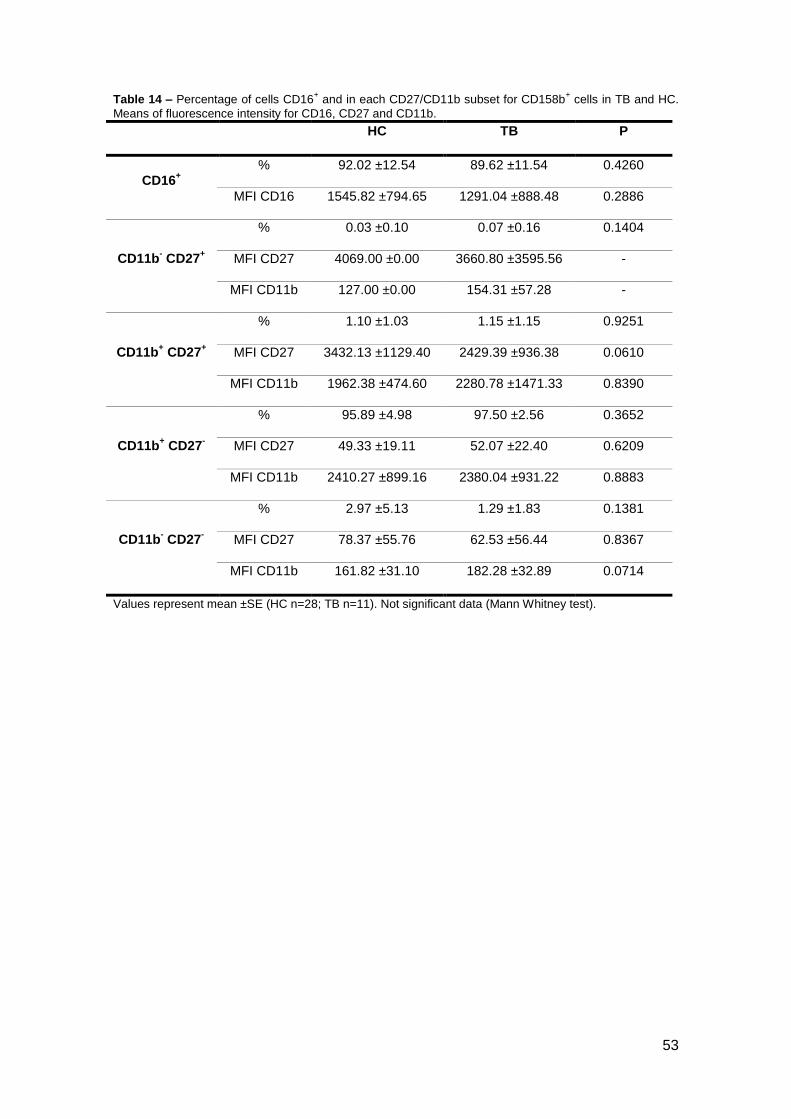
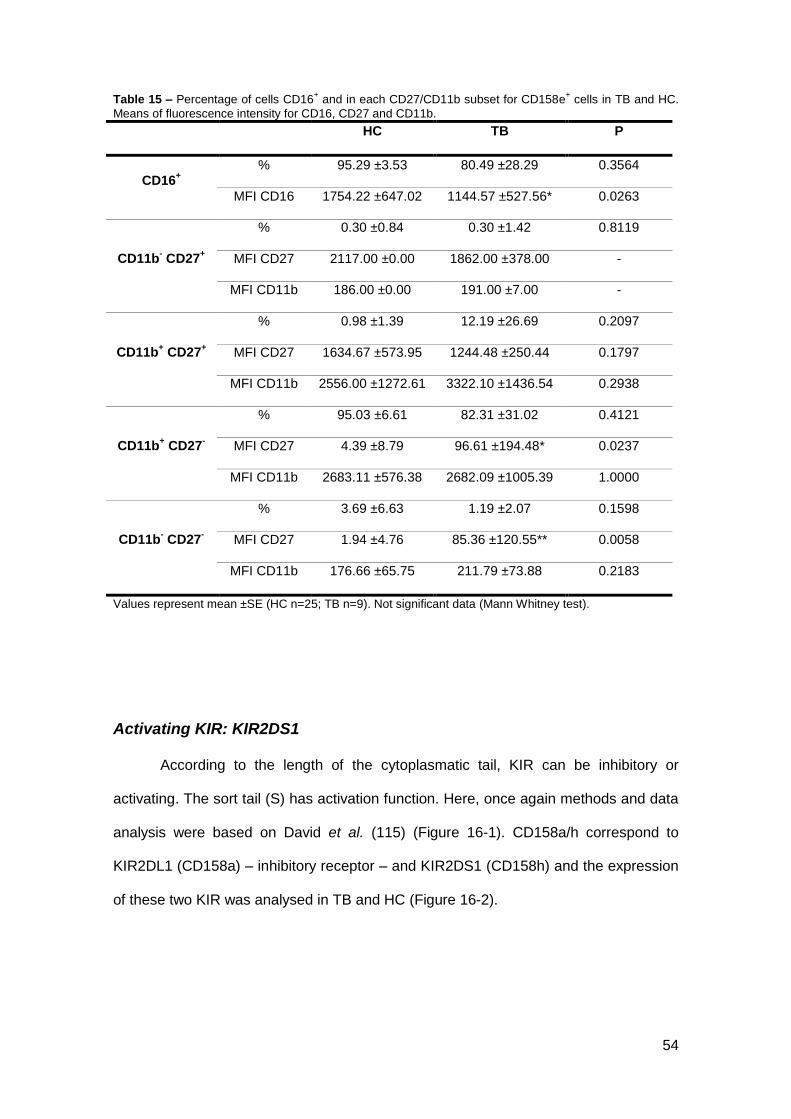
Activating KIR: KIR2DS1
According to the length of the cytoplasmatic tail, KIR can be inhibitory or
activating. The sort tail (S) has activation function. Here, once again methods and data
analysis were based on David et al. (115) (Figure 16-1). CD158a/h correspond to
KIR2DL1 (CD158a) – inhibitory receptor – and KIR2DS1 (CD158h) and the expression
of these two KIR was analysed in TB and HC (Figure 16-2).
55
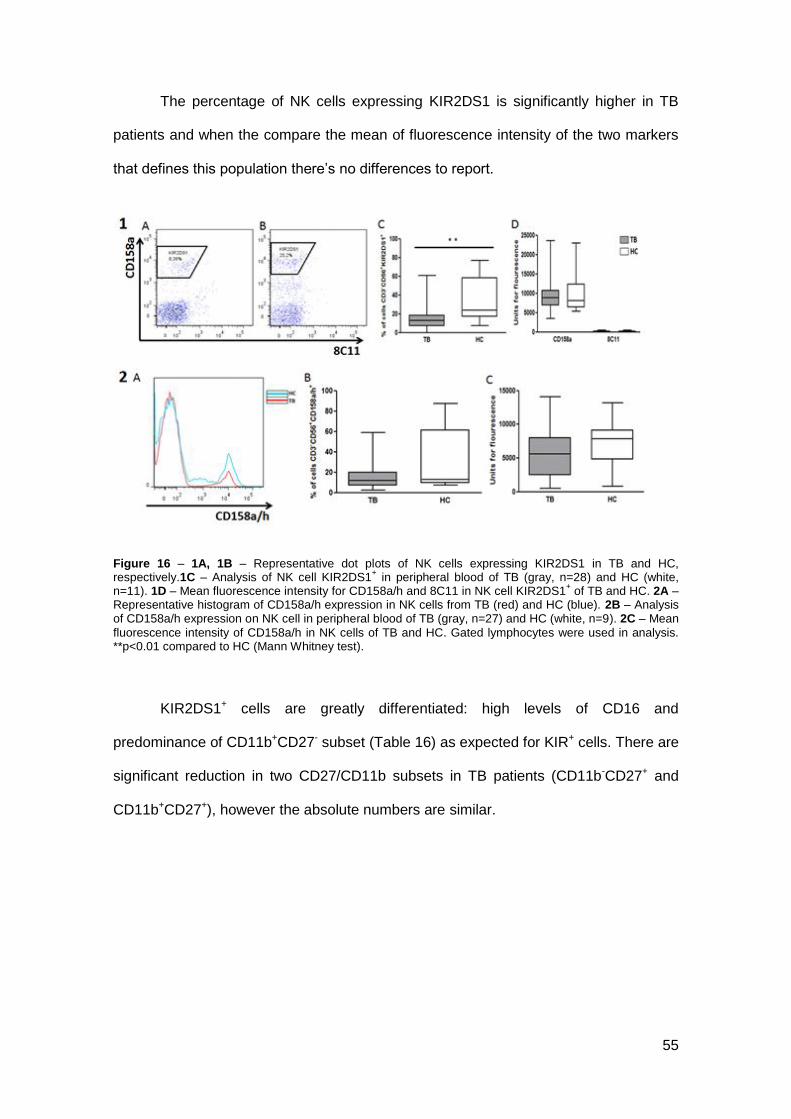
The percentage of NK cells expressing KIR2DS1 is significantly higher in TB
patients and when the compare the mean of fluorescence intensity of the two markers
that defines this population there’s no differences to report.
Figure 16 – 1A, 1B – Representative dot plots of NK cells expressing KIR2DS1 in TB and HC, respectively.1C – Analysis of NK cell KIR2DS1
+ in peripheral blood of TB (gray, n=28) and HC (white,
n=11). 1D – Mean fluorescence intensity for CD158a/h and 8C11 in NK cell KIR2DS1+ of TB and HC. 2A –
Representative histogram of CD158a/h expression in NK cells from TB (red) and HC (blue). 2B – Analysis of CD158a/h expression on NK cell in peripheral blood of TB (gray, n=27) and HC (white, n=9). 2C – Mean
fluorescence intensity of CD158a/h in NK cells of TB and HC. Gated lymphocytes were used in analysis. **p<0.01 compared to HC (Mann Whitney test).
KIR2DS1+ cells are greatly differentiated: high levels of CD16 and
predominance of CD11b+CD27- subset (Table 16) as expected for KIR+ cells. There are
significant reduction in two CD27/CD11b subsets in TB patients (CD11b-CD27+ and
CD11b+CD27+), however the absolute numbers are similar.
56
Table 16 – Percentage of cells CD16+ and in each CD27/CD11b subset for KIR2DS1
+ cells in TB and HC.
Means of fluorescence intensity for CD16, CD27 and CD11b.
HC TB P
CD16+
% 85.96 ±22.79 80.47 ±23.34 0.3572
MFI CD16 1656.55 ±762.76 1332.07 ±671.50 0.2466
CD11b- CD27
+
% 0.25 ±0.51 0.06 ±0.14* 0.0301
MFI CD27 3239.00 ±2845.02 2389.83 ±1466.43 0.8357
MFI CD11b 193.31 ±157.31 264.83 ±203.31 0.8357
CD11b+ CD27
+
% 0.69 ±0.56 0.33 ±0.44* 0.0451
MFI CD27 2023.00 ±1314.96 2946.27 ±1530.93 0.1272
MFI CD11b 2554.20 ±1632.15 1957.33 ±922.13 0.4212
CD11b+ CD27
-
% 93.13 ±3.53 89.84 ±18.95 0.1978
MFI CD27 74.66 ±40.83 60.68 ±38.50 0.2955
MFI CD11b 2303.36 ±871.68 2475.15 ±954.72 0.7968
CD11b- CD27
-
% 5.94 ±3.24 6.19 ±7.88 0.3506
MFI CD27 60.74 ±65.62 60.01 ±61.60 0.9230
MFI CD11b 326.09 ±81.16 368.89 ±85.44 0.2337
Values represent mean ±SE (HC n=28; TB n=11). *p<0.05 compared to HC (Mann Whitney test).
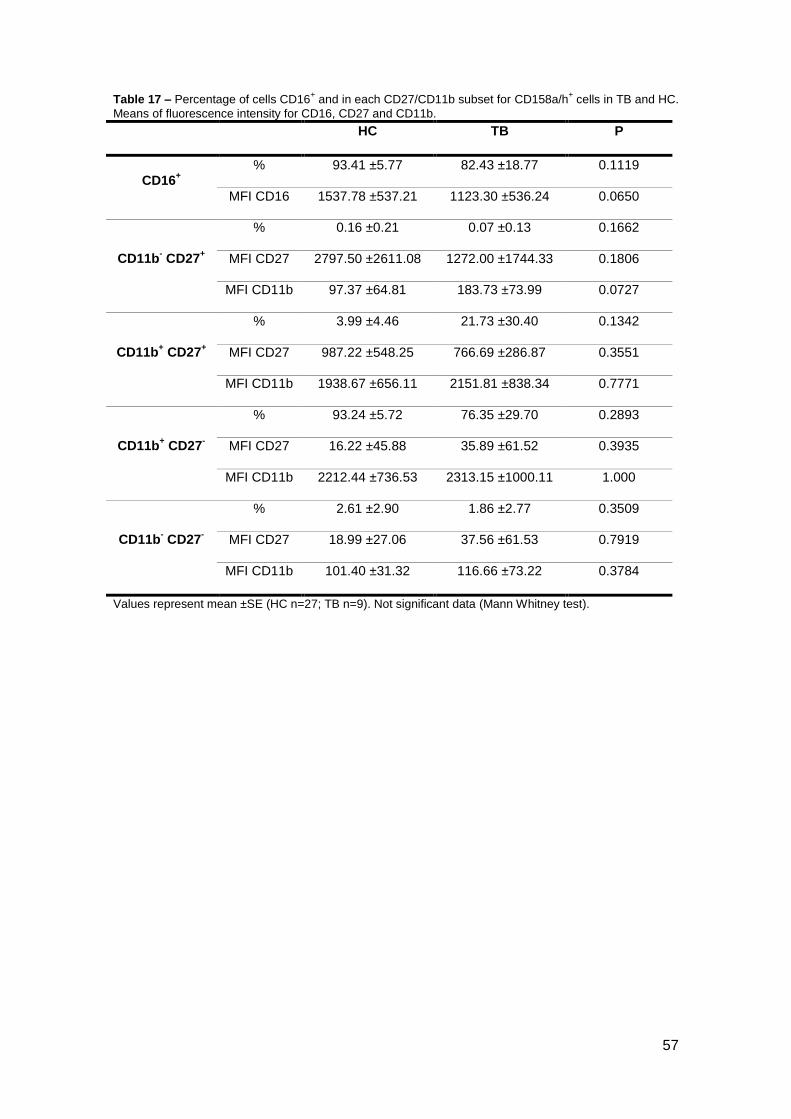
The co-expressing cells for KIR2DS1 and KIR2DL1 (CD158a/h+) are
represented in histogram on Figure 13-2. Values are significantly different from values
for isolated KIR2DS1. Levels of maturity are about the same as those observed for
KIR2DS1+ cells (Table 16).
These two KIR belongs to the same group, based on their structural
characteristics (KIR2D type I) but belong to different haplotypes (KIR2DS1 – haplotype
B and KIR2DL1 – haplotype A) (116).
57
Table 17 – Percentage of cells CD16+ and in each CD27/CD11b subset for CD158a/h
+ cells in TB and HC.
Means of fluorescence intensity for CD16, CD27 and CD11b.
HC TB P
CD16+
% 93.41 ±5.77 82.43 ±18.77 0.1119
MFI CD16 1537.78 ±537.21 1123.30 ±536.24 0.0650
CD11b- CD27
+
% 0.16 ±0.21 0.07 ±0.13 0.1662
MFI CD27 2797.50 ±2611.08 1272.00 ±1744.33 0.1806
MFI CD11b 97.37 ±64.81 183.73 ±73.99 0.0727
CD11b+ CD27
+
% 3.99 ±4.46 21.73 ±30.40 0.1342
MFI CD27 987.22 ±548.25 766.69 ±286.87 0.3551
MFI CD11b 1938.67 ±656.11 2151.81 ±838.34 0.7771
CD11b+ CD27
-
% 93.24 ±5.72 76.35 ±29.70 0.2893
MFI CD27 16.22 ±45.88 35.89 ±61.52 0.3935
MFI CD11b 2212.44 ±736.53 2313.15 ±1000.11 1.000
CD11b- CD27
-
% 2.61 ±2.90 1.86 ±2.77 0.3509
MFI CD27 18.99 ±27.06 37.56 ±61.53 0.7919
MFI CD11b 101.40 ±31.32 116.66 ±73.22 0.3784
Values represent mean ±SE (HC n=27; TB n=9). Not significant data (Mann Whitney test).
58
CONCLUSION
59
Pulmonary tuberculosis still remains one of the greatest public health problems.
In some research NK cells’ importance have already studied, however the human NK
cell phenotype in this pathology and in healthy contacts remains unclear. Several
works have this NK cell characterization in animal models, and a few in human, but a
wide research was needed.
Taken together the presented results for these NK cell characterization in both
TB patients and healthy contacts, NK cells from TB patients suggest a higher
maturation, a higher activation and also higher levels of cytokine (IFN-γ) production.
From the beginning, TB patients present a moderate lymphopenia (p<0,05) with
a decreasing trend in all lymphocyte subsets. The exception was observed in B cells
that tend to be increased and in T CD8+ cells that were significantly decreased
(p<0,05).
As it was observed when lymphocyte subsets were evaluated and confirmed
with other labeling, NK cells (CD3-CD56+) in TB patients tend to decrease, however,
when CD3-NKp46+ NK cells were counted, it was observed a partial increase in TB
patients. NKp46 was recently referred as better marker than CD56 for NK cells,
however it was not found a correlation between this to markers nor in TB patients and
in HC.
The classic markers for NK cells are CD56 and CD16. It is defined four subsets
according the level of expression of these two markers in CD3- cells. Results suggest a
higher percentage of NK cells in more mature stages in TB patients. The expression of
CD27/CD11b in NK cells surface also define developmental subsets but presented
data do not demonstrate differences between two groups.
CD57 is present in more mature NK cells, the expression of this marker were
greatly increased in TB patients NK cells (p<0.0005). Despite CD27/CD11b, the higher
60
percentage of CD57+ cells and also the CD56/CD16 expression profile suggest a
higher percentage of more mature NK cells in peripheral blood of TB patients.
It was observed a great increase in intracellular IFN-γ in total NK cells from TB
patients (p<0.01). These increased values were also observed in NKp30, NKp44 and
NKp80 positive subsets (p<0.05).
The co-expression of CD94 and NKG2D was also evaluated and a significant
increase was observed in double positive subset (p<0.05) in TB patients. The meaning
of these observations remains unclear.
Other NCRs and NKp80 (co-receptor) expression was increased (NKp44:
p<0.05; NKp80: p<0.01; NKp30: n.s.). As referred above, it was observed an increase
in intracellular IFN-γ+ in all NK cells expressing these receptors and co-receptor.
Killer Immunoglobulin-like receptors expression was evaluated. Data
demonstrate that three inhibitory KIRs (KIR2DL2, KIR2DL1 and KIR3DL1) tend to
decrease, KIR2DL2/DL3 tend to increase and activating KIR2DS1 was significantly
increased (p<0.005).
Despite the importance of the presented data, further research is needed. A
general phenotyping of NK cells was performed, giving some highlights about the role
of these cells in TB, opening new doors for the future work. KIR genotyping have to be
done for the TB patients and HC for correlations to the phenotype results. Also the
gene expression of KIR genes, cytokines, chemokines, as well as the SNP screening
for NK cells receptors. Once NK cells crosstalk with other immune cells, the effect of
NK cells on other cells (e.g. dendritic cells and monocytes) should be studied.
Functional activation and inhibition tests should be performed to evaluate NK cells role
in immune response against pulmonary TB.
61
Expansion and manipulation of NK cells for immunotherapy in infectious
diseases is a promising field that remains to be explored.