Munich Personal RePEc Archive Role of Non-Governmental Organizations in Healthcare Sector of India Das, Nimai and Kumar, Rajeev Public Health Foundation of India 16 September 2016 Online at https://mpra.ub.uni-muenchen.de/79402/ MPRA Paper No. 79402, posted 30 May 2017 04:27 UTC
Transcript
Munich Personal RePEc Archive
Role of Non-Governmental Organizations
in Healthcare Sector of India
Das, Nimai and Kumar, Rajeev
Public Health Foundation of India
16 September 2016
Online at https://mpra.ub.uni-muenchen.de/79402/
MPRA Paper No. 79402, posted 30 May 2017 04:27 UTC
Published document URL: http://dx.doi.org/10.13140/rg.2.2.30420.19845
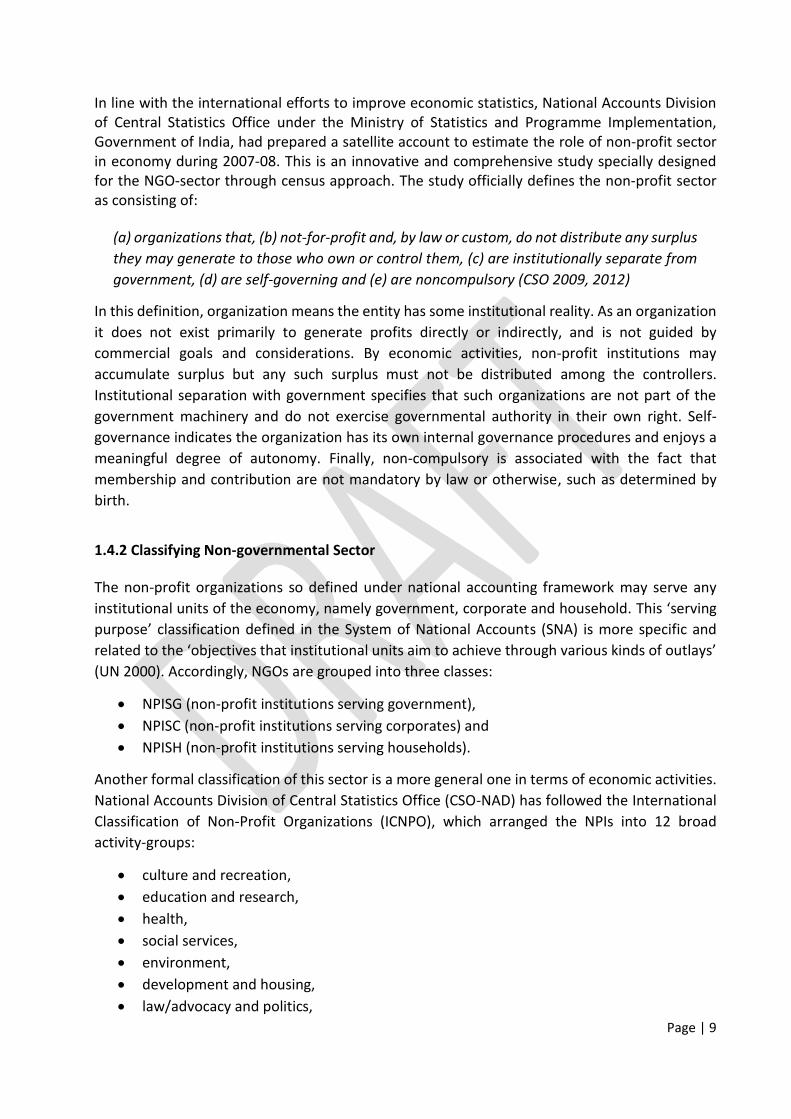
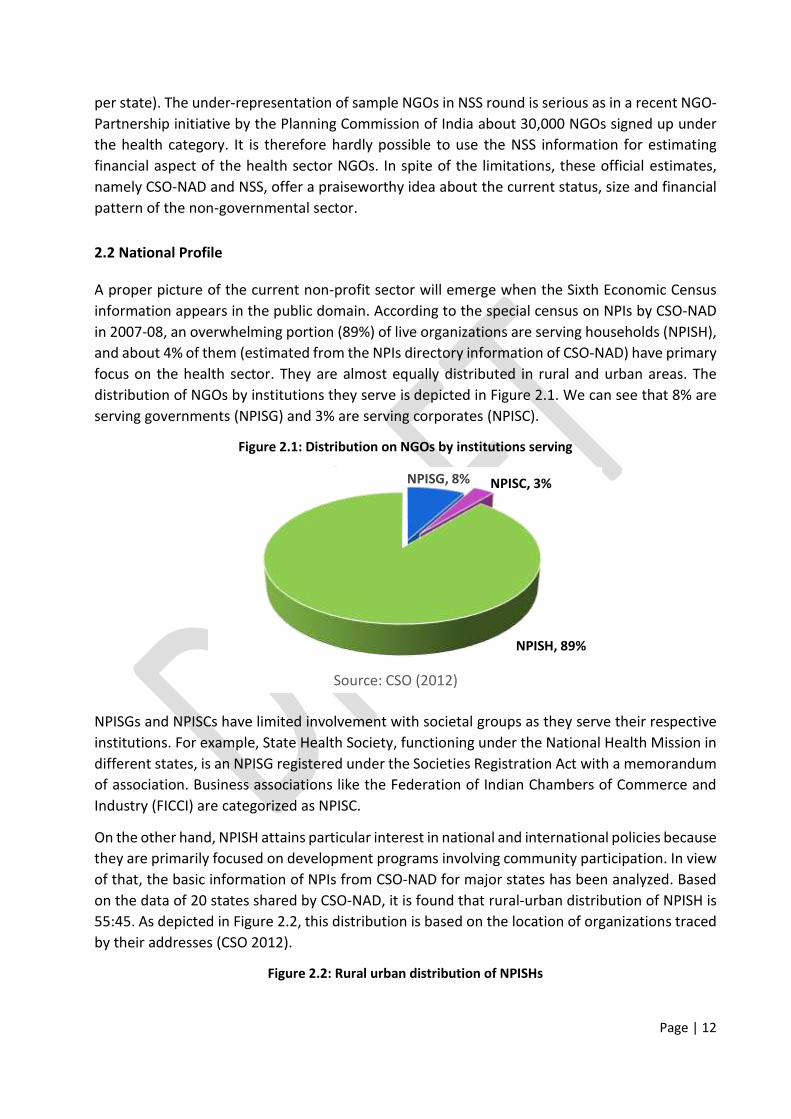
2.2 National Profile .................................................................................................................................... 9
2.3 Extent across States ........................................................................................................................... 10
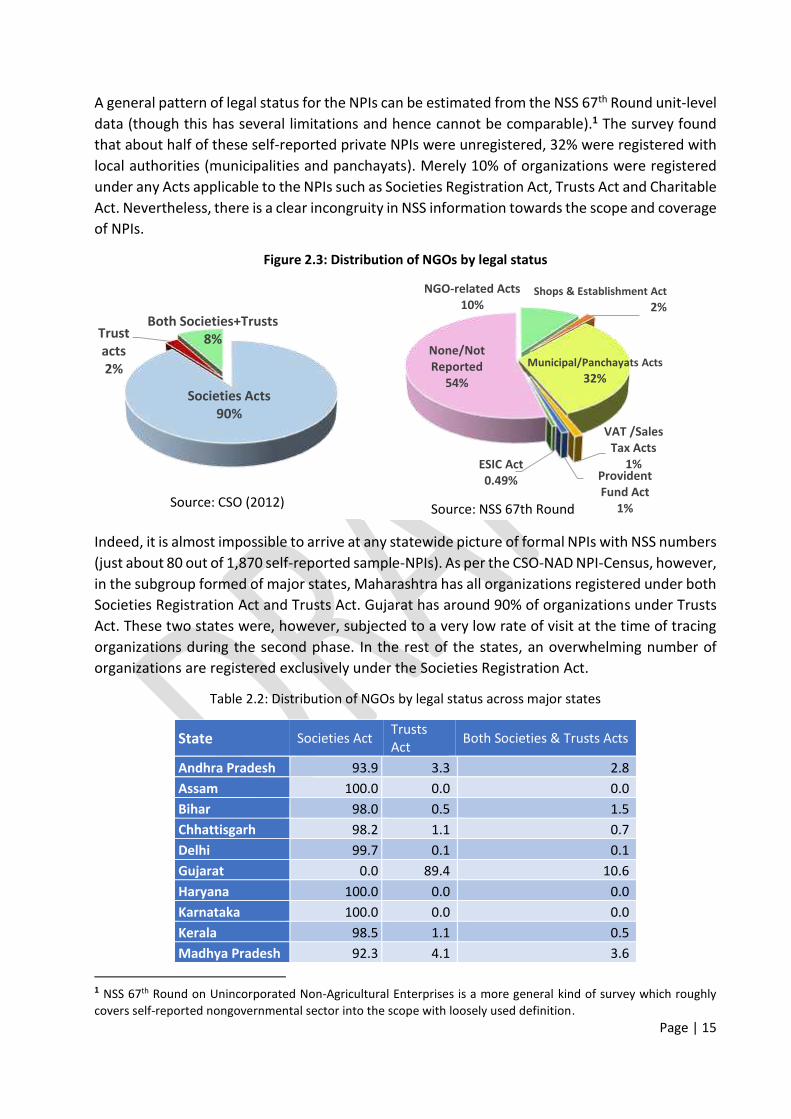
2.4 Legal Status ........................................................................................................................................ 12
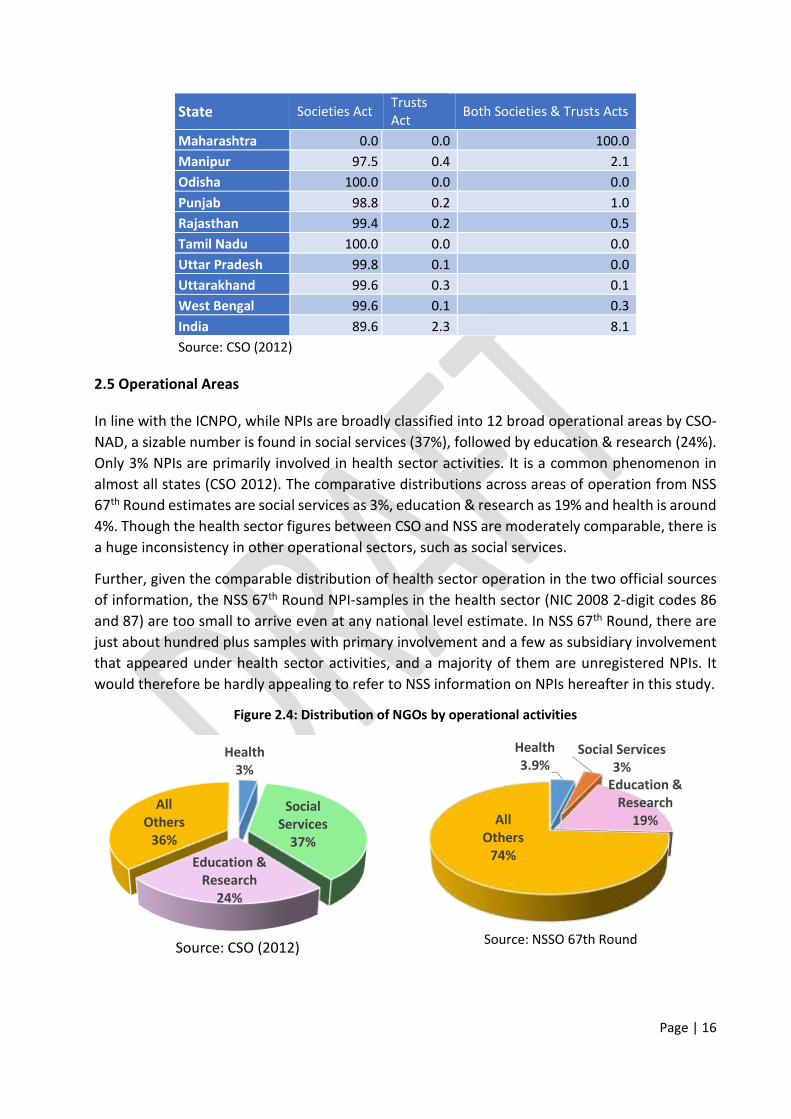
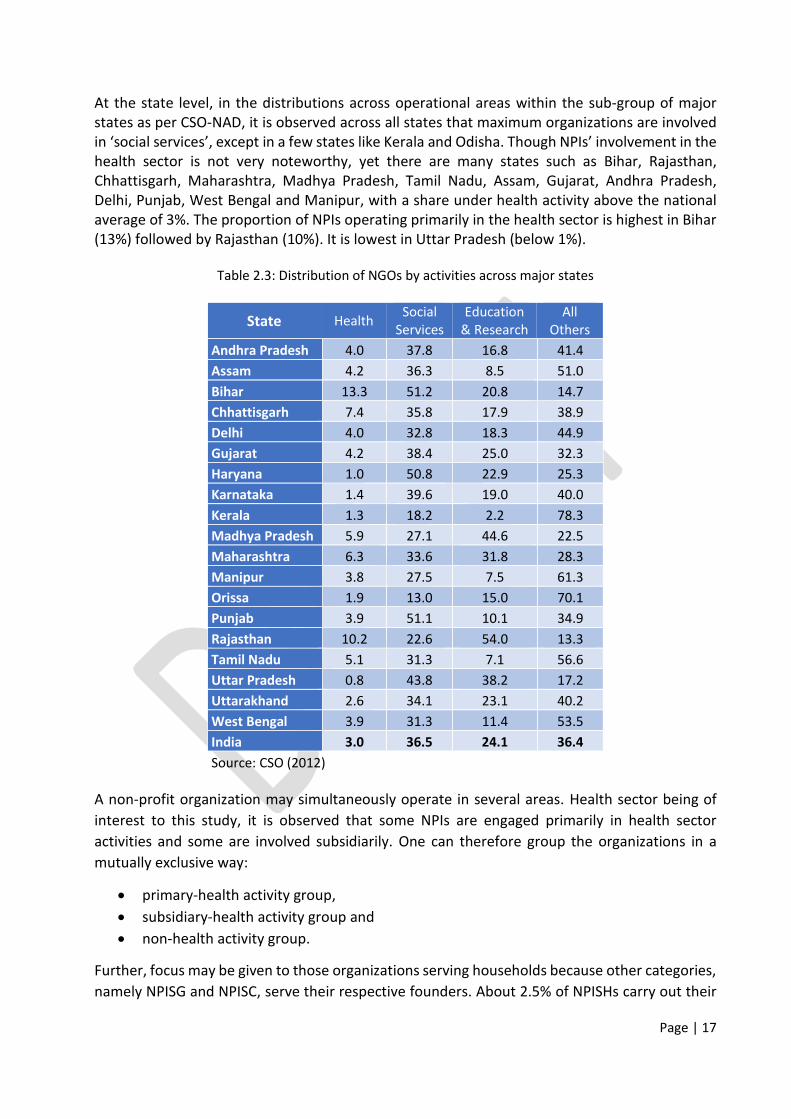
2.5 Operational Areas .............................................................................................................................. 13
2.6 Employment Status ........................................................................................................................... 16
Chapter 3: Study of Health Financing for Non-Governmental Organizations ...................................... 19
3.1 Study Outline ..................................................................................................................................... 19
4.1 Discussions and Policy Implications .................................................................................................. 38
4.2 Strength and Limitation of Study ...................................................................................................... 39
4.3 Way forward ...................................................................................................................................... 40
Annexure-I: Research Methodology and Estimation ......................................................................... 41
Annexure-II: Sample Size across States ............................................................................................. 44
civil society organizations (CSO), third sector organizations and so on with slightly modified scope
and coverage. Given the complexities of non-governmental sector, the Johns Hopkins University
Comparative Non-Profit Sector Project and United Nations Statistical Division have undertaken a
worldwide initiative to develop a handbook on NPIs under the System of National Accounts.
Page | 9
In line with the international efforts to improve economic statistics, National Accounts Division
of Central Statistics Office under the Ministry of Statistics and Programme Implementation,
Government of India, had prepared a satellite account to estimate the role of non-profit sector
in economy during 2007-08. This is an innovative and comprehensive study specially designed
for the NGO-sector through census approach. The study officially defines the non-profit sector
as consisting of:
(a) organizations that, (b) not-for-profit and, by law or custom, do not distribute any surplus
they may generate to those who own or control them, (c) are institutionally separate from
government, (d) are self-governing and (e) are noncompulsory (CSO 2009, 2012)
In this definition, organization means the entity has some institutional reality. As an organization
it does not exist primarily to generate profits directly or indirectly, and is not guided by
commercial goals and considerations. By economic activities, non-profit institutions may
accumulate surplus but any such surplus must not be distributed among the controllers.
Institutional separation with government specifies that such organizations are not part of the
government machinery and do not exercise governmental authority in their own right. Self-
governance indicates the organization has its own internal governance procedures and enjoys a
meaningful degree of autonomy. Finally, non-compulsory is associated with the fact that
membership and contribution are not mandatory by law or otherwise, such as determined by
birth.
1.4.2 Classifying Non-governmental Sector
The non-profit organizations so defined under national accounting framework may serve any
institutional units of the economy, namely government, corporate and household. This ‘serving purpose’ classification defined in the System of National Accounts (SNA) is more specific and
related to the ‘objectives that institutional units aim to achieve through various kinds of outlays’ (UN 2000). Accordingly, NGOs are grouped into three classes:
Outpatient Clinic Ancillary Services Non-clinical Support
Health Insurance Outreach Medical Research
Subsidiary Health-NGOs
Page | 32
seen in only a few states such as Bihar, Manipur and to some extent in Rajasthan and
Uttarakhand.
NGOs from Kerala, Tamil Nadu and Maharashtra held camps for ANC-PNC. Only about 20 out of
100 NGOs at national level reported blood donation activities, with wide state-level variation
ranging from just 1% in Manipur and Uttar Pradesh to about 60% in Bihar.
Table 3.3: Observed pattern of outreach activities for NGOs across states
State Health
awareness
Surgical
Camp
Diagnostic
Camp
Immunization
Program
Blood
Donation ANC-PNC
Andhra Pradesh+ 65.4 16.1 7.4 16.2 49.4 0.8
Assam 93.9 0.8 89.7 13.4 21.0 3.6
Bihar 78.8 46.7 48.5 30.7 60.6 16.1
Chhattisgarh 80.4 7.9 80.4 7.2 29.3 5.4
Delhi 94.9 1.5 45.2 1.8 42.3 2.1
Gujarat 60.8 5.2 8.8 22.4 19.5 14.2
Haryana 67.7 3.3 32.8 0.0 5.1 2.8
Karnataka 75.1 17.5 22.4 3.0 47.1 3.9
Kerala 78.6 23.6 78.5 22.1 41.4 33.3
Madhya Pradesh 93.1 0.1 61.3 6.6 9.1 7.4
Maharashtra 27.9 14.5 35.1 18.0 23.7 24.5
Manipur 27.7 39.8 3.0 31.9 0.9 3.0
Orissa 40.2 0.2 55.7 0.1 25.6 2.3
Punjab 41.1 6.8 34.5 12.3 5.4 0.3
Rajasthan 65.6 2.4 15.4 24.1 30.6 19.7
Tamil Nadu 78.1 10.1 67.0 20.9 52.7 35.5
Uttar Pradesh 82.5 8.1 6.4 3.9 1.0 0.9
Uttarakhand 71.3 10.4 60.0 26.3 12.4 19.4
West Bengal 79.1 8.0 47.8 16.9 4.3 0.5
India 67.8 7.6 35.1 10.9 20.2 7.2
Source: Primary Survey; + includes Telangana
3.4 Pattern of Revenue
In the non-governmental sector, grants and donations are important sources of revenue to run
NGOs. CSO (2012) observed that during the reference period 2007-08, NPIs generated about 70%
of the revenue from these two sources. Our survey for the reference period 2013-14 confirmed
that the maximum revenue (about 78%) was generated from these two sources. The grant
component was individually the highest part in revenue receipts during both 2007-08 and 2013-
14. Notably, the present study finds that the gap between grants and donations has shrunk. The
contributions of own operation and others are respectively 7% and 15.2% at national level.
In the following table, we find that 55% of the revenue of Tamil Nadu NGOs came through own
operations, which was the highest. Grants (22%) and donations (19%) were other sources of
revenue in the same state.
Page | 33
Donation is the largest source of revenue for NGOs in Bihar, Kerala, Madhya Pradesh and Punjab,
whereas grant is largest source of revenue for NGOs in Andhra Pradesh, Assam, Chhattisgarh,
Delhi, Gujarat, Karnataka, Maharashtra, Manipur, Orissa, Rajasthan and West Bengal.
Table 3.4: Observed pattern of revenues for NGOs across states
State Grant Donation
Own
operation
Others
(rent/interest etc.)
Andhra Pradesh+ 70.7 12.4 4.0 12.9
Assam 43.0 19.5 13.4 24.0
Bihar 30.4 62.9 6.2 0.6
Chhattisgarh 38.5 21.2 17.5 22.8
Delhi 75.7 4.9 3.8 15.5
Gujarat 60.5 23.1 8.0 8.5
Haryana 28.2 15.9 16.9 39.0
Karnataka 43.8 16.2 2.8 37.2
Kerala 14.0 51.9 18.8 15.3
Madhya Pradesh 35.9 59.9 1.0 3.2
Maharashtra 57.2 25.8 7.4 9.6
Manipur 50.2 23.3 22.6 3.9
Orissa 93.8 2.8 0.0 3.4
Punjab 16.2 63.7 13.7 6.4
Rajasthan 84.3 10.4 1.9 3.3
Tamil Nadu 22.4 19.0 54.5 4.1
Uttar Pradesh 24.1 41.3 32.8 1.9
Uttarakhand 39.5 43.8 13.3 3.4
West Bengal 50.0 37.7 7.6 4.7
India 47.6 30.2 7.0 15.2
Source: Primary Survey; + includes Telangana
If we disaggregate NGOs on the basis of size, grant still remains the major source of revenue for
almost all types of NGOs. For micro NGOs, donation is the highest, followed by grant; for small
and medium NGOs, grant is the highest, followed by donation. For large NGOs, apart from grant,
other income (such as rent and interest) appeared as an important source (about 27%).
Table 3.5: Observed pattern of revenues across size of NGOs
Grant Donation
Own
operation
Others
(rent/interest etc.)
Micro 33.9 41.0 13.0 12.1
Small 56.0 21.8 4.9 17.3
Medium 47.5 35.2 5.6 11.6
Large 50.7 13.1 8.8 27.4
Source: Primary Survey
3.4.1 Composition across Different Types of Organizations
Page | 34
The composition of revenue receipts is depicted in the following set of figures with more details
relating to each type of organization considered in this study, namely primary-health NGOs,
subsidiary-health NGOs and non-health NGOs.
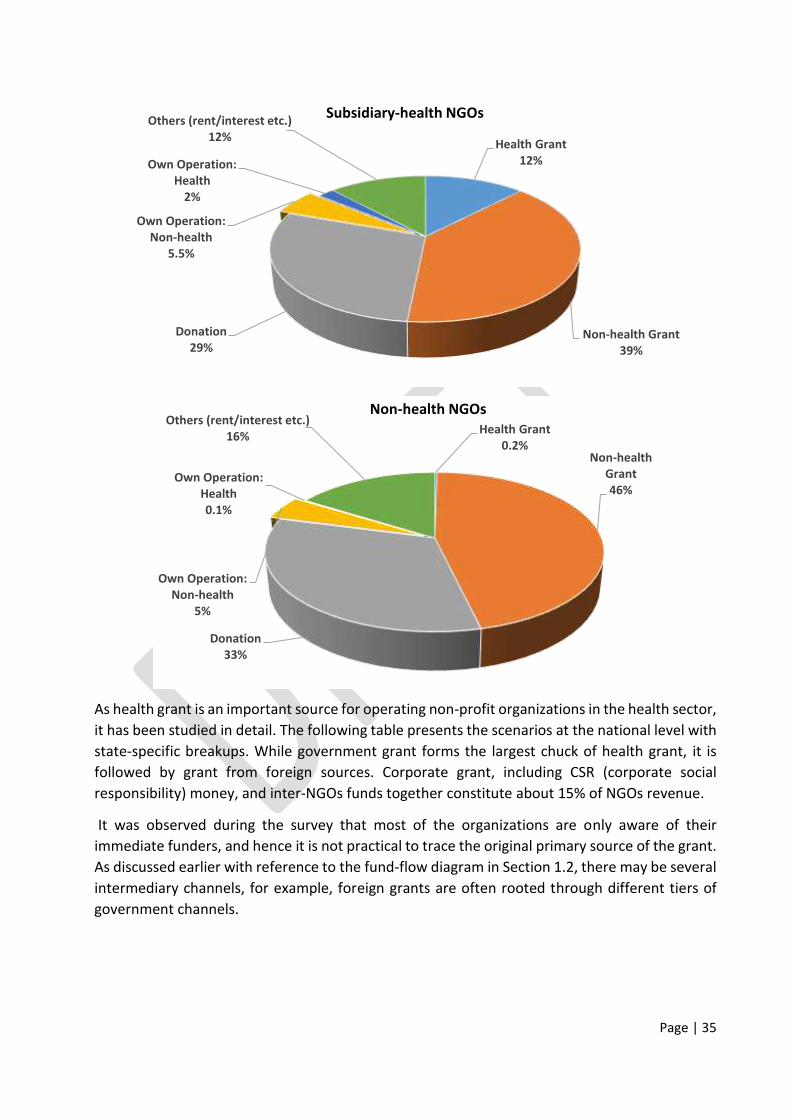
As expected, health grant appears as the largest source of revenue for primary-health NGOs and
non-health grant is the largest source of revenue for the rest. Non-health NGOs receive more
non-health grant than do subsidiary-health NGOs.
The non-health NGOs considered in this study being relatively big in size, donations contributed
around 33% of their revenue. Around 29% of the revenue of subsidiary-health NGOs came from
donations as did 23% of the revenue of primary-health NGOs.
Given the fact that the health grant for non-health NGOs is almost nil, the returns from own
operations related to health is also negligible for them. The return from health operations is
important for primary-health NGOs.
NGOs of all the three groups get almost similar returns (between 4% and 5.5%) from their non-
health operations.
Similarly, NGOs of all the three groups get almost similar returns (between 12% and 15%) through
rent, interest etc.
Figure 3.5: Observed pattern of revenues for different NGOs
Health Grant
39%
Non-health Grant
8%Donation
23%
Own Operation:
Non-health
4%
Own Operation:
Health
10%
Others (rent/interest etc.)
16%
Primary-health NGOs
Page | 35
As health grant is an important source for operating non-profit organizations in the health sector,
it has been studied in detail. The following table presents the scenarios at the national level with
state-specific breakups. While government grant forms the largest chuck of health grant, it is
followed by grant from foreign sources. Corporate grant, including CSR (corporate social
responsibility) money, and inter-NGOs funds together constitute about 15% of NGOs revenue.
It was observed during the survey that most of the organizations are only aware of their
immediate funders, and hence it is not practical to trace the original primary source of the grant.
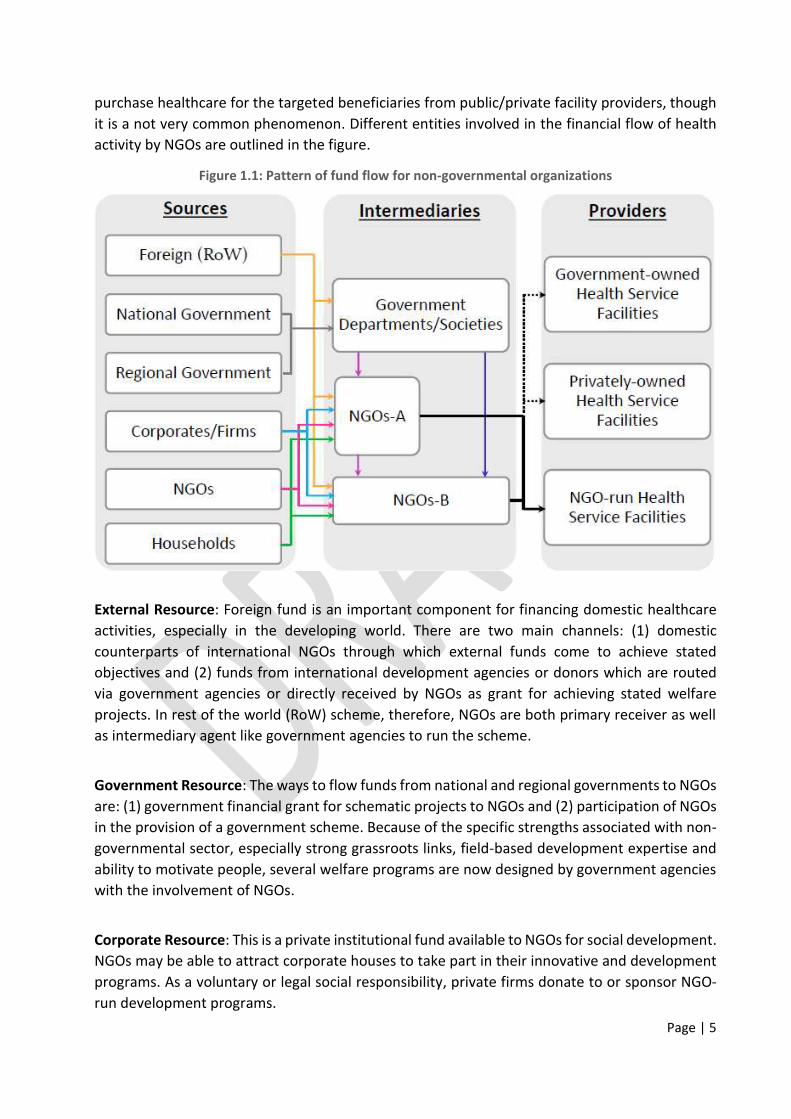
As discussed earlier with reference to the fund-flow diagram in Section 1.2, there may be several
intermediary channels, for example, foreign grants are often rooted through different tiers of
government channels.
Health Grant
12%
Non-health Grant
39%
Donation
29%
Own Operation:
Non-health
5.5%
Own Operation:
Health
2%
Others (rent/interest etc.)
12%
Subsidiary-health NGOs
Health Grant
0.2%Non-health
Grant
46%
Donation
33%
Own Operation:
Non-health
5%
Own Operation:
Health
0.1%
Others (rent/interest etc.)
16%
Non-health NGOs
Page | 36
Table 3.6: Observed composition of grant receipts across states for NGOs
State Government Corporate Foreign Other NGOs
Andhra Pradesh+ 37.4 0.5 62.1 0.0
Assam 96.5 0.3 3.2 0.0
Bihar 99.7 0.0 0.3 0.0
Chhattisgarh 67.6 0.5 31.9 0.0
Delhi 31.7 57.0 1.5 9.8
Gujarat 81.6 13.9 0.0 4.5
Haryana 52.5 2.0 0.0 45.5
Karnataka 97.9 0.0 0.3 1.8
Kerala 31.7 48.4 0.6 19.3
Madhya Pradesh 96.8 0.3 2.9 0.0
Maharashtra 52.2 22.5 0.0 25.4
Manipur 89.8 0.0 10.2 0.0
Orissa 20.9 64.0 2.0 13.1
Punjab 93.1 0.0 0.0 6.9
Rajasthan 26.7 47.8 1.9 23.6
Tamil Nadu 78.5 10.2 4.0 7.4
Uttar Pradesh 35.9 0.5 63.6 0.0
Uttarakhand 97.8 0.0 0.0 2.2
West Bengal 24.8 1.0 74.1 0.0
India 54.7 9.3 30.1 6.0
Source: Primary Survey; + includes Telangana
3.4.2 Composition and Purpose of Health Grants
Non-profit organizations usually receive grants for specific purposes, such as for implementing
public health programs by donor agencies. A grant may have a single or multiple purposes. The
following figures show that 63% of government grants are received for multipurpose objectives.
An overwhelming part of corporate grants is also received for multipurpose goals. Grants from
other NGOs, however, have almost equal ratio between single and multiple goals. Foreign grants
are relatively more focused on attaining a specific objective, 58% of grants are for single purpose.
Figure 3.6: Observed composition of grant receipts from different sources for NGOs
Page | 37
An analysis of multipurpose grants requires a sophisticated technique, especially developing
appropriate distribution keys to apportion them into individual items. Grants with a specific
objective are rather straightforward. The following figure shows that HIV/AIDS receives the
largest share (31%) of single-purpose grant received by the non-governmental sector. This is
followed by health system management (29%) and then programs related to RMNCH (18%).
Other program-specific grants are given for TB control (6%), fevers such as dengue, malaria and
so on (5%), disabled persons (4%), and tribals (3%).
Figure 3.7: Observed composition of single purpose grant for NGOs
Multi-purpose
63%
Single-purpose
37%
Government
Multi-purpose
75%
Single-purpose
25%
Corporate
Multi-purpose
42%Single-purpose
58%
Foreign
Multi-purpose
48%Single-purpose
52%
Other NGOs
Page | 38
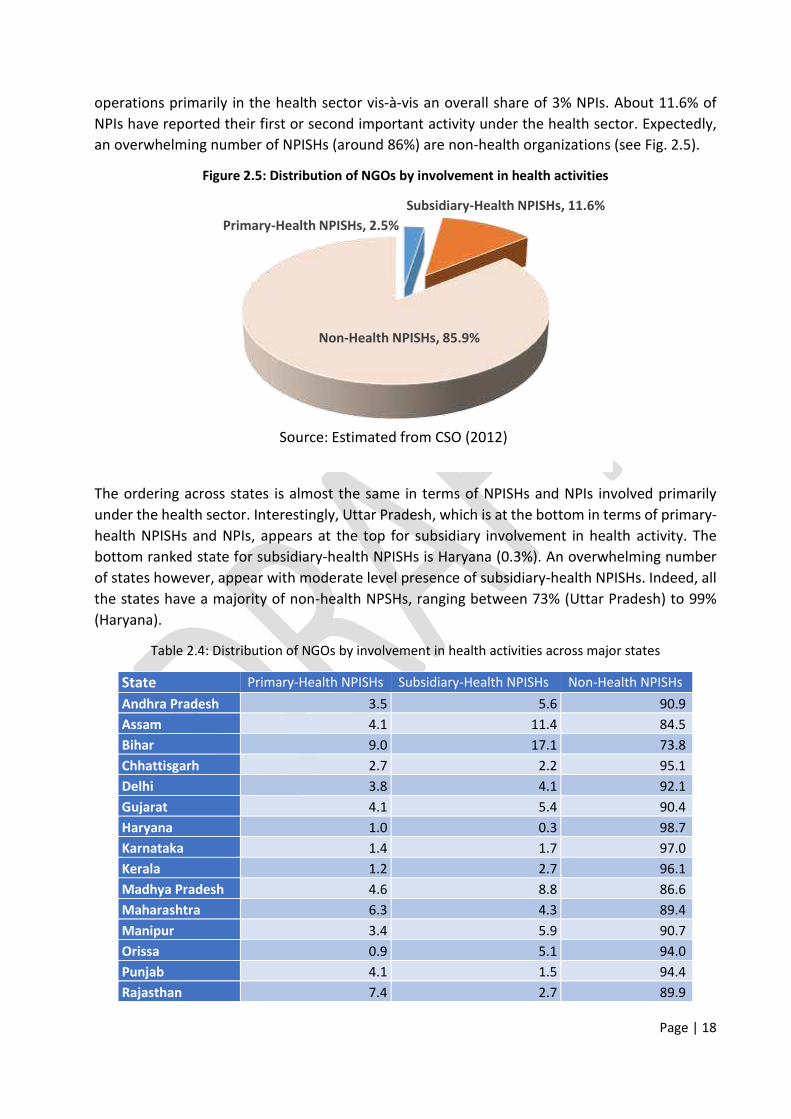
3.5 Extent of Health Expenditure
Estimating the current health expenditure by private non-governmental institutions is the core
of the study. We captured the expenditures of the non-profit sector on several health activities
with a scheduled questionnaire and analyzed the result using the framework proposed by SHA
(2011). The way to classify several expenditure items available through primary survey (see
Annexure III for the questionnaire) using healthcare boundaries in SHA (2011) guideline is
presented in Annexure IV. The current health expenditure is estimated by excluding medical
education and research items and a few expenditure items are adjusted to avoid double counting
(details about the estimation procedure is available in Annexure I: Research Methodology and
Estimation).
Table 3.7: Estimated current health expenditure across states for NGOs
State Current Health
Expenditure
Current Health
Expenditure-
User charge
adjusted
State’s share in
Current Health
Expenditure
Share of current
health
expenditure to
GSDP/GDP
Andhra Pradesh+ 1,39,133 1,35,803 13.8 0.150
Assam 28,087 20,966 2.8 0.166
Bihar 25,932 21,098 2.6 0.079
Chhattisgarh 7,625 7,511 0.8 0.039
HIV/AIDS
31%
RMNCH
18%
Adolescent health
1%Tribal health
3%
Disability
4%
Specified fever
5%
TB control
6%
Health system
29%
Child blindness
1%
Others
diseases
2%
Source: Primary Survey
Page | 39
State Current Health
Expenditure
Current Health
Expenditure-
User charge
adjusted
State’s share in
Current Health
Expenditure
Share of current
health
expenditure to
GSDP/GDP
Delhi 4,869 4,698 0.5 0.011
Gujarat 21,913 18,565 2.2 0.027
Haryana 2,974 2,856 0.3 0.008
Karnataka 63,425 59,458 6.3 0.084
Kerala 17,298 11,882 1.7 0.039
Madhya Pradesh 13,921 13,828 1.4 0.035
Maharashtra 1,22,069 1,11,844 12.1 0.075
Manipur 7,510 6,207 0.7 0.486
Orissa 9,626 9,626 1.0 0.035
Punjab 6,627 5,594 0.7 0.020
Rajasthan 30,939 30,939 3.1 0.056
Tamil Nadu 1,42,735 87,506 14.1 0.147
Uttar Pradesh 57,294 49,280 5.7 0.061
Uttarakhand 3,353 2,807 0.3 0.026
West Bengal 57,115 53,033 5.7 0.081
India 10,09,078 8,91,482 100.0 0.089
Source: Primary Survey; + includes Telangana
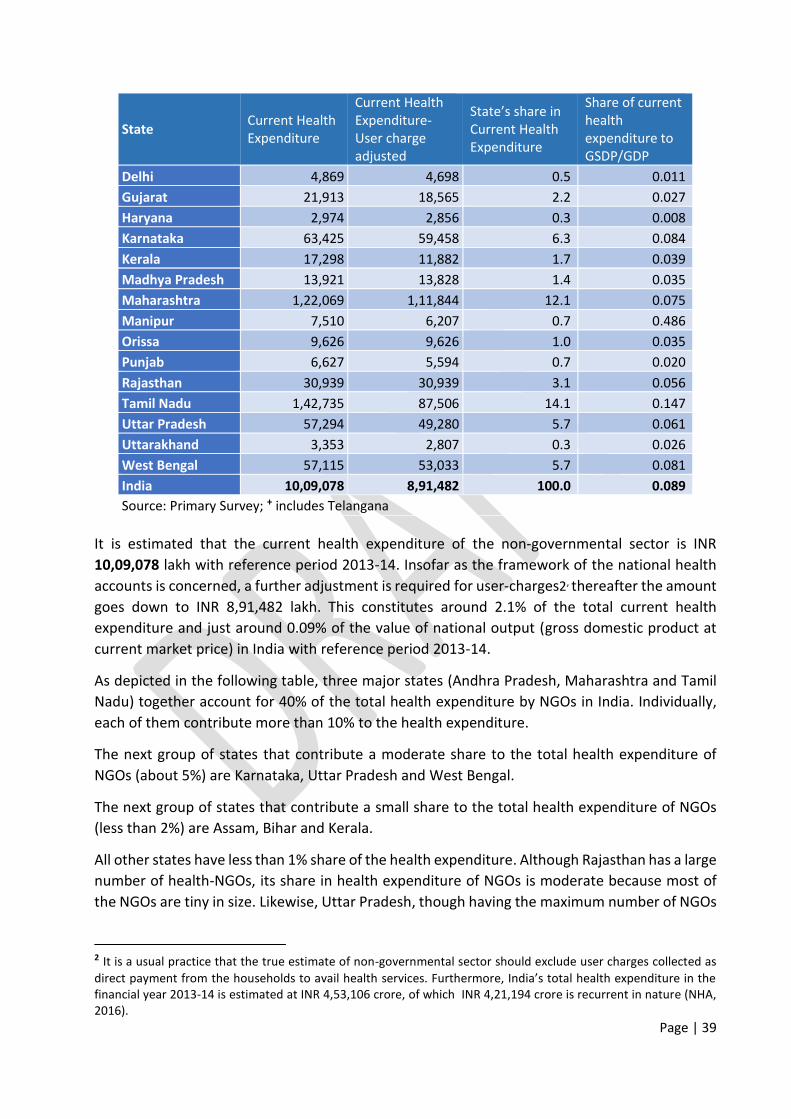
It is estimated that the current health expenditure of the non-governmental sector is INR
10,09,078 lakh with reference period 2013-14. Insofar as the framework of the national health
accounts is concerned, a further adjustment is required for user-charges2, thereafter the amount
goes down to INR 8,91,482 lakh. This constitutes around 2.1% of the total current health
expenditure and just around 0.09% of the value of national output (gross domestic product at
current market price) in India with reference period 2013-14.
As depicted in the following table, three major states (Andhra Pradesh, Maharashtra and Tamil
Nadu) together account for 40% of the total health expenditure by NGOs in India. Individually,
each of them contribute more than 10% to the health expenditure.
The next group of states that contribute a moderate share to the total health expenditure of
NGOs (about 5%) are Karnataka, Uttar Pradesh and West Bengal.
The next group of states that contribute a small share to the total health expenditure of NGOs
(less than 2%) are Assam, Bihar and Kerala.
All other states have less than 1% share of the health expenditure. Although Rajasthan has a large
number of health-NGOs, its share in health expenditure of NGOs is moderate because most of
the NGOs are tiny in size. Likewise, Uttar Pradesh, though having the maximum number of NGOs
2 It is a usual practice that the true estimate of non-governmental sector should exclude user charges collected as
direct payment from the households to avail health services. Furthermore, India’s total health expenditure in the
financial year 2013-14 is estimated at INR 4,53,106 crore, of which INR 4,21,194 crore is recurrent in nature (NHA,
2016).
Page | 40
in India, is fifth in terms of the share of health expenditure by NGOs because the NGOs with
primary focus on health are few.
Though the share of state’s health expenditure to own state gross domestic product is
considerably low and never goes beyond 0.5%, a moderate level variation is found among states.
Two major southern states (Andhra Pradesh and Tamil Nadu) along with two north-eastern states
(Assam and Manipur) are found above the national average share of 0.089%. A few major states
like Karnataka, West Bengal and Maharashtra are very close to the national average value in
terms of health expenditure by the non-profit sector to corresponding state gross domestic
product.
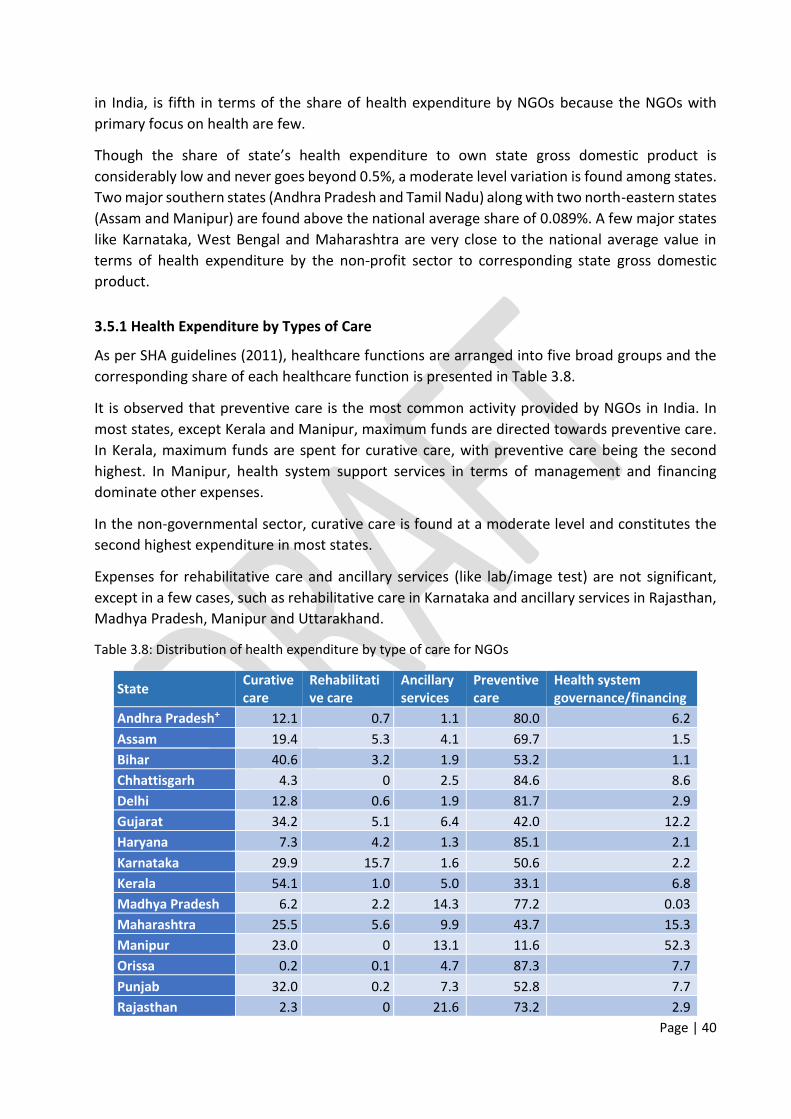
3.5.1 Health Expenditure by Types of Care
As per SHA guidelines (2011), healthcare functions are arranged into five broad groups and the
corresponding share of each healthcare function is presented in Table 3.8.
It is observed that preventive care is the most common activity provided by NGOs in India. In
most states, except Kerala and Manipur, maximum funds are directed towards preventive care.
In Kerala, maximum funds are spent for curative care, with preventive care being the second
highest. In Manipur, health system support services in terms of management and financing
dominate other expenses.
In the non-governmental sector, curative care is found at a moderate level and constitutes the
second highest expenditure in most states.
Expenses for rehabilitative care and ancillary services (like lab/image test) are not significant,
except in a few cases, such as rehabilitative care in Karnataka and ancillary services in Rajasthan,
Madhya Pradesh, Manipur and Uttarakhand.
Table 3.8: Distribution of health expenditure by type of care for NGOs
State Curative
care
Rehabilitati
ve care
Ancillary
services
Preventive
care
Health system
governance/financing
Andhra Pradesh+ 12.1 0.7 1.1 80.0 6.2
Assam 19.4 5.3 4.1 69.7 1.5
Bihar 40.6 3.2 1.9 53.2 1.1
Chhattisgarh 4.3 0 2.5 84.6 8.6
Delhi 12.8 0.6 1.9 81.7 2.9
Gujarat 34.2 5.1 6.4 42.0 12.2
Haryana 7.3 4.2 1.3 85.1 2.1
Karnataka 29.9 15.7 1.6 50.6 2.2
Kerala 54.1 1.0 5.0 33.1 6.8
Madhya Pradesh 6.2 2.2 14.3 77.2 0.03
Maharashtra 25.5 5.6 9.9 43.7 15.3
Manipur 23.0 0 13.1 11.6 52.3
Orissa 0.2 0.1 4.7 87.3 7.7
Punjab 32.0 0.2 7.3 52.8 7.7
Rajasthan 2.3 0 21.6 73.2 2.9
Page | 41
State Curative
care
Rehabilitati
ve care
Ancillary
services
Preventive
care
Health system
governance/financing
Tamil Nadu 35.7 1.1 1.7 57.5 4.0
Uttar Pradesh 14.0 0.3 3.9 81.4 0.4
Uttarakhand 37.0 3.2 11.6 46.4 1.8
West Bengal 17.8 1.2 2.2 41.3 37.5
India 21.2 2.5 3.9 62.5 9.9
Source: Primary Survey; + includes Telangana
3.5.2 Preventive and Curative Care Expenditure
Preventive and curative care together constitute around 84% of the health expenditure of the
voluntary sector in India. Figure 3.8 presents the four preventive care activities. As expected,
health awareness is found to be the highest among all outreach activities. The expenditure for
diagnostic camps is 18% of the total preventive care expenditure, followed by expenses on
immunization programs and antenatal-postnatal care, both of which involve 5% of total
preventive care expenditure.
Figure 3.8: Observed composition of preventive care expenditure for NGOs
In India, the highest share of around 41% of the curative care expenditure of the NGOs is taken
by outpatient care covering hospital outpatient and ambulatory clinics. This is followed by
hospital inpatient care with a share of around 36%. The share of daycare is just about 5% at
hospital level. However, NGOs in different states have different focus in terms of curative care
expenditure.
In the two neighboring southern states of Kerala and Tamil Nadu, inpatient care at hospitals is
above 60% of the curative care, while it is about 40% in the two northern states of Delhi and
Haryana. The inpatient care is between 30% and 34% of the curative care health expenditure in
Andhra Pradesh (including Telangana), Assam, Gujarat, Karnataka and Uttar Pradesh.
Ambulatory camps for minor surgical procedures took the highest share of about 90% of curative
care in Manipur but the expenses for the same were as low as around 1% in Uttar Pradesh. Except
for a few states like Manipur and Odisha, outpatient expenditure is ranging from the modest to
Health
awareness
72%
Diagnostics
camps
18%
Immunisation
5%
Antenatal-postnatal
5%
Source: Primary Survey
Page | 42
greatest level in curative care for NGOs. Ten out of 19 listed states are above the national average
and their share of curative outpatient expenditure ranges between 53% and 83% of the curative
expenditure.
Table 3.9: Observed composition of curative care expenditure across states for NGOs
Hospital Level Ambulatory Level
State Inpatient care Daycare Outpatient care Outpatient clinic Surgical camps
Andhra Pradesh+ 33.3 4.6 8.2 15.2 38.7
Assam 34.0 4.5 6.3 46.8 8.4
Bihar 0.4 NA 0.1 69.6 30.0
Chhattisgarh NA NA NA 58.5 41.5
Delhi 44.8 5.7 6.3 33.3 9.9
Gujarat 32.8 5.0 11.9 41.9 8.4
Haryana 41.2 5.3 6.4 27.5 19.6
Karnataka 30.6 4.2 6.9 22.4 35.9
Kerala 63.1 8.6 14.3 4.4 9.5
Madhya Pradesh 16.0 5.6 34.3 34.6 9.5
Maharashtra 20.4 2.5 2.3 60.6 14.2
Manipur NA NA NA 9.9 90.1
Orissa 23.1 2.7 1.6 ─ 72.5
Punjab 4.3 0.6 0.7 81.9 12.5
Rajasthan NA NA NA 23.8 76.2
Tamil Nadu 63.8 9.3 19.5 4.7 2.7
Uttar Pradesh 30.0 4.1 7.2 58.0 0.7
Uttarakhand 2.1 0.3 0.7 80.1 16.8
West Bengal 6.0 1.0 3.2 76.7 13.1
India 35.9 5.0 9.2 31.7 18.2
Source: Primary Survey; + includes Telangana
Financial information of hospital level care is not available for a few states like Chhattisgarh and
Rajasthan, even though there are hospitals run by NGOs (e.g. Sri Sathya Sai Sanjeevani Hospital
in Raipur and Shri Jinkushal Charitable Hospital in Jaipur). Hence the total curative care
expenditure in these states is estimated at the level of ambulatory care only using available
sample information.
Page | 43
Chapter 4
Conclusion
In India, the non-governmental or not-for-profit organizations involved in health care sector are
spread in both rural and urban areas with a primary focus of providing curative, preventive and
rehabilitative care services through their established healthcare institutions and/or community
level health camps in targeted areas. They are also involved in facilitating several public health
programs by other institutions including governments. A very common feature among them is
that the beneficiaries of their services are often not the payers. They generate resources from
institutional and individual donors to facilitate achieving key goals and deliver services to the
targeted beneficiaries.
The study estimates that an overwhelming part of the revenue of NGOs in India comes from
grants and donations. However, in states like Tamil Nadu, revenue from own operations (user
charges) is the highest, followed by grants and donations. Grant is found to be a major source of
revenue in states like Andhra Pradesh (including Telangana), Assam, Chhattisgarh, Gujarat,
Karnataka, Maharashtra, Manipur, Rajasthan, Orissa, Delhi and West Bengal.
With reference to single purpose grant receipts, it is found that two-third of the total resources
are allocated almost equally to the HIV/AIDS and health system management. The reproductive,
maternal, newborn and child health (RMNCH) programs are observed as another important path
to flow funds to the NGOs. Other program-specific grants comprise control of tuberculosis, fever
such as dengue and malaria, program for disabled persons and special focus programs for tribals.
In health care activities, the study observed that a majority of non-governmental organizations
are involved in preventive care activities through outreach programs. Outreach activity is found
to be the main health activity for majority of the organizations functioning primarily or
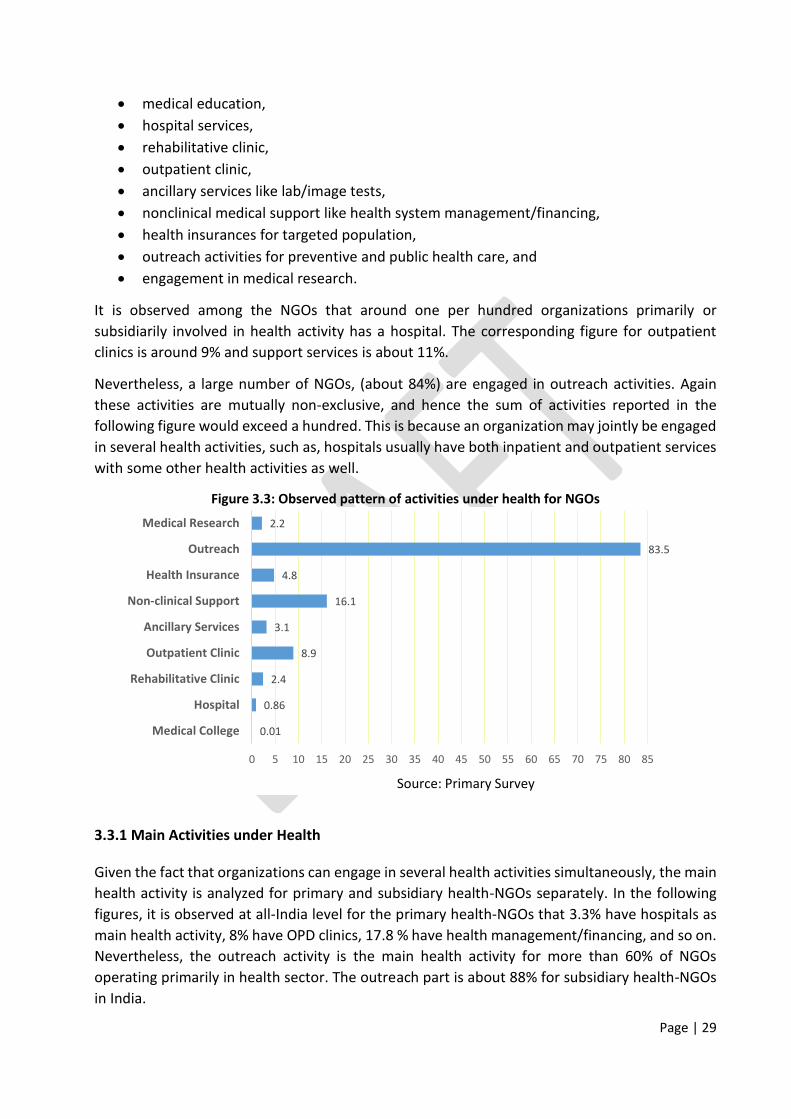
subsidiarily in the health sector. Around one per hundred organizations primarily or subsidiarily
involved in health sector activities has hospital services, and the corresponding figure for
outpatient clinic is nine. As expected, preventive care appears as the highest and/or major health
expenditure of NGOs in most of the states, except for a few cases. In Kerala, it is the second
highest, first being curative care. Health system support services in terms of management and/or
financing is dominant in Manipur. Rehabilitative care and ancillary services like lab/image test
are not very significant for the NGOs. Of course, curative care is found at a moderate level, and
it constitutes the second highest level of expenditure in most of the states.
In curative care expenditure, outpatient care covering hospital outpatient and ambulatory clinic
constitutes the highest followed by hospital inpatient care. However nonprofit organizations
operate simultaneously in several health activities, thus preventive versus curative cares are not
mutually exclusive set of their health activities. Again, health versus non-health activities are also
mutually non-exclusive for the non-governmental sector but some organizations have an
exclusive focus on health care activities only.
4.1 Discussions and Policy Implications
Page | 44
In spite of several important health activities that non-governmental organizations, their
contribution to the estimated national health expenditure appears to be just about two per cent
in India. Statewide, three major states - Andhra Pradesh, Maharashtra and Tamil Nadu - together
account for around half of the health expenditure of NGOs in India. Indeed, there is an extensive
variation across the states in total health expenditure of NGOs. A moderate level of share is found
for Karnataka, Uttar Pradesh and West Bengal followed by Assam, Bihar and Kerala.
For the non-profit institutions, however, financial contributions are not as imperative as their
reach to the grassroots level of society. National and international policymakers are of the view
that non-governmental organizations typically function at close quarters to exposed populations
for their societal upliftment and development.
The present study also observed that the NGOs in India are predominantly involved in preventive
health activities like community level camps for building health awareness and disease detection
programs for underprivileged groups. There are several health schemes of the government that
involve non-profit sector especially for implementation at community level and to reach socially
excluded citizens.
However, some critical issues are associated with the non-governmental sector in general. In
India, there is a lack of well-defined regulatory framework for NGOs. Several legal provisions are
available simultaneously with hardly any monitoring mechanism of the stated objectives of
organizations in successive periods. There is no provision to de-register an organization if it is not
functioning, and the updated information is not readily available to the competent public
authorities. Further, a large number of organizations who have the reach at grassroots level,
especially small and micro in size, do not have the capability to maintain and audit their financial
statements on a regular basis.
National statistical authorities have also given a very limited focus to account for this sector in
their estimates. Indeed, an in-depth and updated information about non-governmental
organizations is required to involve them in development programs. Only then would it facilitate
policymakers to take advantage of the decentralized and participatory approach of non-
governmental organizations. The present study therefore seems to be the first comprehensive
attempt of this kind towards health sector functioning of not-for-profit institutes at national and
subnational levels in India.
4.2 Strengths and Limitations of Study
This first ever study on the role of NGOs in healthcare system is based on a primary survey of all
major states including national capital territory of India. Notwithstanding the very exclusive focus
on health sector operations, the study covers a whole set of non-profit organizations
differentially involved in healthcare activities. Representative number of samples are drawn
randomly from different strata for more precise estimation. Furthermore, large organizations
with primary focus on health activities are surveyed by the census approach. A comprehensive
survey questionnaire has been designed to collect information including disaggregated levels of
data on revenue and expenditure by sources/purposes. Both the ‘activity based’ approach and standard ‘gross value added’ approach have been used for apprehending expenditures of the
Page | 45
NGOs. Likewise, a set of scheduled questions has been used to collect revenue details including
disaggregated information on health grants by sources and purposes. At the end, every effort has
been made to validate information on revenue and expenditure with the audited financial
statements of surveyed organizations. In spite of these facts, the study has some limitations as
follows:
(1) The official sample frame used is fairly old since updated population is not available in the
public domain till date. While the rates and ratios of available frame population have been
adjusted with the provisional results of the Sixth Economic Census, a more precise estimate
may well be obtained by using unit level information of the Sixth Economic Census.
(2) The sample size should be increased especially at the state level. The current samples seem
to be good at national level. For more precise state-specific estimates, there is a scope to
consider more samples at each strata, which could not be attained by the present study
because of time and resource constrains.
(3) In spite of a comprehensive attempt, the lack of responses and inaccessibility, especially for
large organizations involved primarily in health sector activities in a few states like Rajasthan
and Chhattisgarh, might have undermined the estimates.
(4) There is a scope to improve the survey tools, especially for respondent organizations that
are unable to furnish all applicable financial information needed for gross value added. This
might restrict the analysis to activity based expenditure only.
4.3 Way Forward
Availability of evidences is very crucial for policymakers to plan and execute development
schemes especially involving non-governmental sector. Indeed, the policy focus on decentralized
and community participatory development strategy has led the official statistical agencies to
undertake initiatives for strengthening evidence base of the NGOs. Official socio-economic
surveys and census have now incorporated additional information regarding the non-profit
sector. Such an effort is, however, not very comprehensive and hardly captures the non-profit
sector in general. Further, a lack of clarity in the definition of the non-governmental sector in
several official statistics limits creating robust evidences of the NGOs.
Nevertheless, the National Sample Survey Organization may take it forward in its national level
survey of the un-incorporated non-agricultural sector by drawing statewide representative
samples across operational activities of NGOs. Ideal and robust evidences may well be generated
for the non-profit sector through an annual survey of the services sector, which is supposed to
be initiated soon by the CSO. Of course, a few additional blocks of questionnaire and
representativeness of samples would be required to make reliable estimates of the nonprofit
sector using the existing/proposed official surveys.
Page | 46
Annexure-I: Research Methodology and Estimation
The health expenditure of non-governmental sector is intended to be estimated across all major
States and Union Territories through a sample survey of registered NPISHs. Some important
issues related to concept, coverage and sample design are as follows:
1. In line with the national accounting framework of India, a non-governmental unit is defined as
a legal entity which is (a) an organization and (b) not allowed to distribute any profit, by law or
custom, to those who own or control it, and (c) institutionally separate from government, (d)
self-governing and (e) noncompulsory (CSO 2012). Though an organization may operate in
different sectors like education, health, recreation, religion, culture and so on in mutually non-
exclusive ways, and may be classified according to the purpose it envisages for itself, like
governments, corporates and households, the scope of this study is to cover those serving the
households and functioning differentially in the health sector.
2. By considering the sector of operations and envisaging the serving purpose, samples are drawn
from three mutually exclusive groups: the first group is primary-health NGOs, a set of
organizations primarily involved in health sector activities, and they are of prime interest in this
study. The second group is subsidiary-health NGOs, those operating in health sector activities on
secondary basis. Rest are the third group, non-health NGOs, which may occasionally spend on
health as an activity or provide health benefits to their own employees, and hence get less
importance in this study. We consider only a selected part of non-health NGOs that are fairly big
in size3.
3. The survey questionnaire is especially designed to capture health expenditure of non-profit
sector in terms of different roles played in health sector as provider of healthcare services, agent
for mobilizing funds in health system and primary source of revenue for healthcare financing
schemes. There are six broad blocks in the survey schedule comprising identification of
particulars, basic information with detailed health activities, geographical coverage with
employment size, receipts as non-grant and grant with details of health grants, expenditures on
all possible heads of health activities, and some basic details on each of the healthcare facilities,
as applicable (for more details, see survey questionnaire in Annexure-IV). The current health
expenditure of an organization is estimated by covering all available expenditures on health
activities excluding medical education and research part. To avoid double counting, inter-NGOs
fund flows have been excluded. The identified variables of health activities are finally classified
(see Annexure-V for details) in line with the guidelines of health accounting by SHA (2011).
4. For survey design, the study is not restricted to any particular official lists of NGOs because
none of them are updated recently and/or relevant information for stratification is not readily
available in the public domain. However, the Planning Commission list of signed up organizations
in NGO Partnership System and Directory Information of major states from CSO-NAD NPI Census
2007-08 are consulted, and an approach of snowballing network is employed to trace relevant
3 There are four types of NGOs classified on the size of employment: Micro-NGO involving only volunteers with no
formal employment, Small-NGO encompassing employment size up to 20, Medium-NGO ranging employment 20-
100 and Large-NGO with employment more than 100.
Page | 47
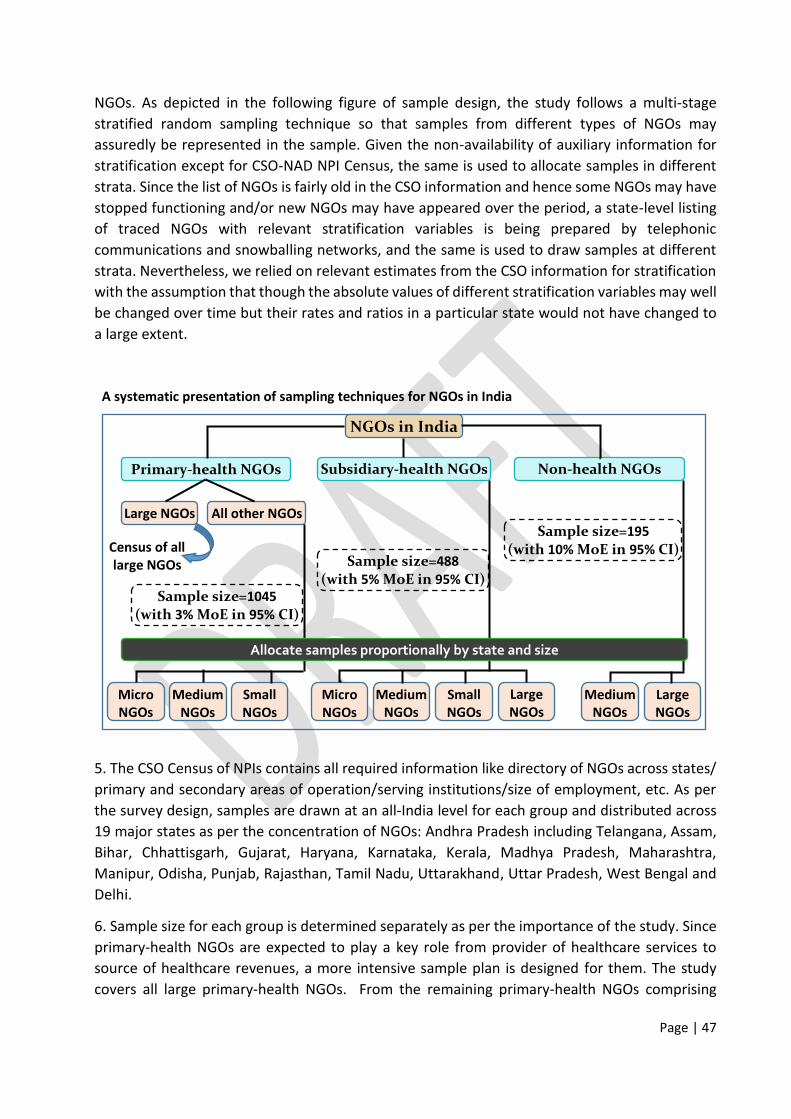
NGOs. As depicted in the following figure of sample design, the study follows a multi-stage
stratified random sampling technique so that samples from different types of NGOs may
assuredly be represented in the sample. Given the non-availability of auxiliary information for
stratification except for CSO-NAD NPI Census, the same is used to allocate samples in different
strata. Since the list of NGOs is fairly old in the CSO information and hence some NGOs may have
stopped functioning and/or new NGOs may have appeared over the period, a state-level listing
of traced NGOs with relevant stratification variables is being prepared by telephonic
communications and snowballing networks, and the same is used to draw samples at different
strata. Nevertheless, we relied on relevant estimates from the CSO information for stratification
with the assumption that though the absolute values of different stratification variables may well
be changed over time but their rates and ratios in a particular state would not have changed to
a large extent.
A systematic presentation of sampling techniques for NGOs in India
5. The CSO Census of NPIs contains all required information like directory of NGOs across states/
primary and secondary areas of operation/serving institutions/size of employment, etc. As per
the survey design, samples are drawn at an all-India level for each group and distributed across
19 major states as per the concentration of NGOs: Andhra Pradesh including Telangana, Assam,
micro/small/medium size, samples are drawn at 3% margin of error in 95% confidence interval
and distributed proportionally at different stages of stratification (across states, and then size-
based strata). A moderate level of samples are drawn (5% margin of error in 95% confidence
interval) from the subsidiary-health NGOs and distributed accordingly. Since the large and
medium NGOs are merely considered for non-health NGOs, samples are drawn at 10% margin of
error in 95% confidence interval for them.
7. While the samples in each stratum are drawn randomly without replacement, we are ensuring
at least 30 samples in each selected state and a minimum quota of two samples in each size
based stratum for standard statistical analysis. Further, a particular stratum may be absent in the
samples because none of the NGOs are operating in such stratum. Finally, if any non-response
arises, a replacement is allowed with similar characteristics.
8. The ‘blow-up strategy’ from sample statistics (sample mean and ratio) is intended to use latest (sixth) Economic Census information to arrive at state and national level estimates. But, given
the fact that unit-level information of sixth Economic Census is not in the public domain as of
now, the CSO-NAD NPIs Census information may provisionally be used. Nevertheless, as per the
sample design, the weighting patterns for aggregation as well as ratio estimate at state and
national level are designed separately for respective groups of NGOs. Evidently, a multi-stage
stratified random sampling is designed for surveying the NGOs. In this complex sample design,
though proportional distribution is planned, aimed at statewide analysis and stratum-specific
minimum quota, the sample distribution seems to be different from relative distribution of the
population with respect to a variable in terms of both scale and proportion. In our stratified
sampling process, suppose, the population size is N, and allocated total sample size is n among S
identified strata, the objective of weighting sample data is to confine its representativeness in
relation to the study population. Applying weight(s) to sample seeks the goal of making sample
largely like the population. In stratified sampling therefore an integrated weight may be defined
as a product of scale and proportional factors: 𝑤𝑠 = 𝑁𝑛 × 𝑁𝑠 𝑁⁄𝑛𝑠 𝑛⁄ = 𝑁𝑠𝑛𝑠, where the symbols have the
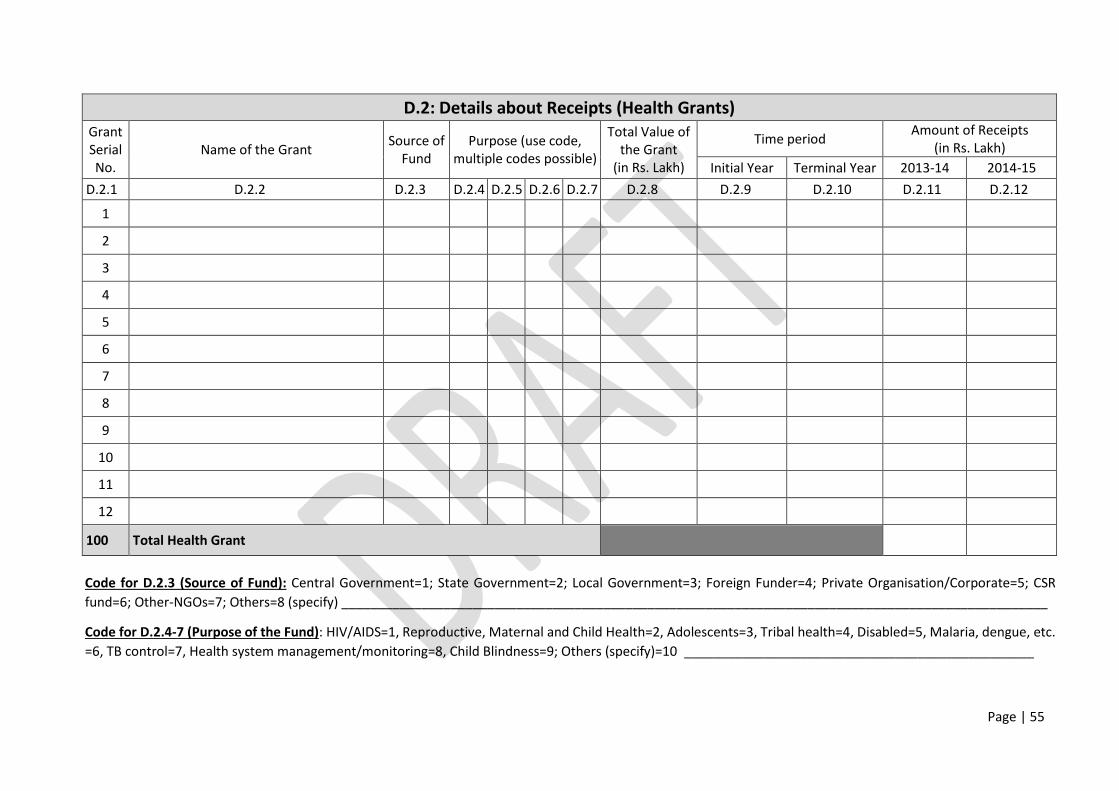
Code for D.2.4-7 (Purpose of the Fund): HIV/AIDS=1, Reproductive, Maternal and Child Health=2, Adolescents=3, Tribal health=4, Disabled=5, Malaria, dengue, etc.
=6, TB control=7, Health system management/monitoring=8, Child Blindness=9; Others (specify)=10 ________________________________________________
Page | 56
E.1: Details about Expenditure
Expenditure Details
Amount of Expenditure
(in Rs. Lakh)
2013-14 2014-15
E.1.1 E.1.2 E.1.3
1. Medical college (maintained by trust)
2. Hospital
3. Clinic for rehabilitative and long-term care
4. Clinic or dispensary for outpatient care
5. Clinic for ancillary services like lab and/or image tests, ambulance
6. Non-clinical medical support like management/financial help
7. Health insurance scheme for community or targeted group
8. Awareness campaigns, enrolment drives etc.
9. Health camps for surgical procedures
10. Health camps for diagnostics and general check-up of community/
targeted groups
11. Child immunization programmes
12. Antenatal and/or postnatal care of women (ANC/PNC)
13. Blood Donation camps
14. Research in medical and/or public health
15. Other Expenditure on Health (specify) ___________________________
16. Expenditure on NON-HEALTH activities
Total Expenditure of NGO
Page | 57
E.2: Disaggregated Expenditure on Health (in Rs. Lakh) Head of expenditure 2013-14 2014-15
E.2.1 E.2.2 E.2.3
Total HEALTH expenditure
Of
which
Salary of medical officers (DOCTORS)
Salary of paramedics/nurses
Salary of other health personal
Medicines
Equipment
Other medical consumables (specify) ________________________
Maintenance costs
Other medical expenses like administrative costs
Health awareness of community (camp, poster, loudspeaker, etc.)