Role of Rhodobacter sp. Strain PS9, a Purple Non-SulfurPhotosynthetic Bacterium Isolated from an Anaerobic
Swine Waste Lagoon, in Odor RemediationYoung S. Do,1† Thomas M. Schmidt,2 James A. Zahn,1‡ Eric S. Boyd,1
Arlene de la Mora,3 and Alan A. DiSpirito1*Departments of Microbiology1 and Psychology,3 Iowa State University, Ames, Iowa 50011, and
Department of Microbiology and Molecular Genetics and Center for Microbial Ecology,Michigan State University, East Lansing, Michigan 488242
Received 4 June 2002/Accepted 7 November 2002
Temporal pigmentation changes resulting from the development of a purple color in anaerobic swine wastelagoons were investigated during a 4-year period. The major purple photosynthetic bacterium responsible forthese color changes and the corresponding reductions in odor was isolated from nine photosynthetic lagoons.By using morphological, physiological, and phylogenetic characterization methods we identified the predom-inant photosynthetic bacterium as a new strain of Rhodobacter, designated Rhodobacter sp. strain PS9.Rhodobacter sp. strain PS9 is capable of photoorganotrophic growth on a variety of organic compounds,including all of the characteristic volatile organic compounds (VOC) responsible for the odor associated withswine production facilities (J. A. Zahn, A. A. DiSpirito, Y. S. Do, B. E. Brooks, E. E. Copper, and J. L. Hatfield,J. Environ. Qual. 30:624-634, 2001). The seasonal variations in airborne VOC emitted from waste lagoonsshowed that there was a 80 to 93% decrease in the concentration of VOC during a photosynthetic bloom. Duringthe height of a bloom, the Rhodobacter sp. strain PS9 population accounted for 10% of the total community andup to 27% of the eubacterial community based on 16S ribosomal DNA signals. Additional observations basedon seasonal variations in meteorological, biological, and chemical parameters suggested that the photosyn-thetic blooms of Rhodobacter sp. strain PS9 were correlated with lagoon water temperature and with theconcentrations of sulfate and phosphate. In addition, the photosynthetic blooms of Rhodobacter sp. strain PS9were inversely correlated with the concentrations of protein and fluoride.
Improved swine production efficiency over the last few de-cades has resulted in a trend towards concentrated animalfeeding operations (15). This trend has also resulted in in-creased private and government awareness of the potentialeffects of high-density production facilities on water and airquality associated with manure storage and treatment systems(3, 32, 43, 45, 46, 52). Swine production facilities generallystore manure in earthen, concrete, or steel-lined storage basin,pit, or lagoon systems for up to 14 months prior to land appli-cation (14, 16). During storage, the effluent becomes anaero-bic, and emission of malodorous compounds often becomes aproblem. Several treatment systems have been described tocontrol the release of odorous compounds from livestockwastes (26, 56). Aeration, addition of chemical oxidants, andmethanogenic digestors all reduce odors generated duringstorage and treatment (1, 37). However, the use of these tech-niques has not received widespread acceptance because of theinitial expense, management time, and equipment mainte-nance required. Other treatments designed to reduce odorsfrom swine production facilities include addition of chemicals,including sodium nitrate and enzymes such as yucca extracts,
and addition of mixed microbial populations to storage systems(56). These treatments are expensive and have produced in-consistent results (38).
Because of cost and space limitations, anaerobic lagoons areoften used for animal waste management systems. These la-goons serve as storage facilities and support anaerobic degra-dation of complex organic compounds. However, in the ab-sence of oxygen and most other terminal electron acceptors,the incomplete oxidation of the complex organic compounds inlivestock waste produces offensive by-products, such as volatileorganic compounds (VOC), hydrogen sulfide, and ammonia(21, 32, 38, 45,46, 54). The concentration of odorous com-pounds from anaerobic lagoons can be minimized in manycases with good management practices (56). However, regard-less of the management practices used, the concentration ofodors from lagoons appears to be dependent on the microflorathat develops in the system. For example, it is common practiceto seed new anaerobic swine waste lagoons with material fromworking lagoons to accelerate the development of a stablemicroflora (56).
One microbial event that has been observed by a number ofinvestigators in relation to odors from swine waste storagelagoon systems is the temporal change in the pigmentation ofthe lagoons from brown to rose to pink (11, 44, 50, 53). In fieldreports workers have described a relationship between de-creased odor intensity and a change in lagoon color to purple.Studies of Zahn et al. (59) confirmed the field reports andshowed that the horizontal flux rates of VOC from anaerobic
* Corresponding author. Mailing address: Department of Microbi-ology, Iowa State University, 205 Science Building, Ames, IA 50011-3211. Phone: (515) 294-2944. Fax: (515) 294-6019. E-mail: [email protected].
† Present address: Division of Ecosystem Sciences, University ofCalifornia, Berkeley, Berkeley, CA 94720-3110.
‡ Present address: Dow AgroSciences, Harbor Beach, MI 48441.
swine waste lagoons that exhibit photosynthetic blooms arelower than the horizontal flux rates of VOC from anaerobicswine waste lagoons that do not exhibit photosynthetic blooms.In this study we focused on characterization of the photosyn-thetic blooms in swine waste lagoons and on the relationshipbetween the photosynthetic blooms and VOC emissions.
MATERIALS AND METHODS
Description of anaerobic swine waste storage lagoons. Samples from nineanaerobic swine waste lagoons (five lagoons in central Iowa and four lagoons innorthern Missouri) known to turn purple, which are referred to below as pho-tosynthetic lagoons, were used as inocula for enrichment cultures or were plateddirectly onto solid media. In addition to the nine photosynthetic lagoons, sixanaerobic swine waste lagoons (two lagoons in central Iowa and four lagoons innorthern Missouri) in which photosynthetic blooms had never been observed,which are referred to below as nonphotosynthetic lagoons, were also monitoredperiodically for 4 years. Single samples were also taken from photosyntheticlagoons in North Carolina (n � 2) and Minnesota (n � 3) and were assayed forthe presence of Rhodobacter sp. strain PS9 by microbial identification systemfatty acid methyl ester (MIDI-FAME) analysis as described below. All of thelagoons studied were earthen lined, 64 to 120 by 61 to 120 m, and 4 to 8 m deep.To examine the temporal events that occur during a blooming event, one site inOgden, Iowa, was monitored weekly for 1 year and periodically (at 1- to 3-monthintervals) over a 4-year period. At this site a two-stage anaerobic lagoon systemwas utilized to process waste from 1,200 sows with piglets and 3,000 feederanimals. All confinement buildings had slotted floors and shallow underfloor pitswhich were flushed periodically with lagoon surface water. The diluted waste inthe pits was pumped into outside storage systems through a pipe. The first-stagelagoon received all diluted waste from the buildings and was connected to thesecond-stage lagoon with a pipe. The first-stage earthen slurry storage anaerobiclagoon systems were 64 by 64 m and 7 m deep (primary lagoon) and 61 by 95 mand 4 m deep (secondary lagoon).
Weather station. Meteorological conditions (wind speed, solar radiation, rel-ative humidity, air temperature, and solution temperature for every 10 cm ofdepth) were monitored continuously with an integrated weather station (42) aspreviously described (58).
Field monitoring. Effluent samples were taken at four locations around theperimeter of each lagoon system at a distance of at least 2.0 m from the edge ofthe storage impoundment and at a depth of 0.2 to 0.3 m by using the method ofDiSpirito et al. (7). Lagoon liquid samples were filtered with a single layer ofcheesecloth to remove large particulate material directly into 110-ml serum vialsthat were flushed with argon gas to maintain anaerobic conditions and weresealed with Teflon-lined silicon septa (Tuf-Bond; Pierce Chemical Co., Rock-ford, Ill.). The samples either were stored on ice if they were processed within24 h or were frozen and stored at �20°C if they were analyzed later. Samplesused for RNA or DNA isolation were centrifuged at 13,000 � g for 15 min at 4°C,and the pellets were washed twice with RNase-free 10 mM phosphate buffer (pH7.0), centrifuged at 13,000 � g for 15 min, and stored at �80°C until they wereprocessed for nucleic acid recovery.
Chemical characterization of swine waste lagoons. The organic solid contentwas estimated by determining the dry weight (20) and by determining the proteinconcentration (22). Analyses of soluble anions were performed by using a DX500 chromatography system (Dionex Corp., Sunnyvale, Calif.) equipped with aDionex CD20 conductivity detector and an IonPac AS9-SC analytical column (4by 200 mm; Dionex Corp.). Chemical identities and concentrations were deter-mined by using standards obtained from Dionex.
Collection of environmental odor pollutants. VOC emitted from the lagoonswere collected on thermal desorption tubes with a multibed combination ofTenax TA (Alltech Associates Inc., Deerfield, Ill.) and Carbopack C (SupelcoInc., Bellefonte, Pa.) at the ambient temperature as previously described (7, 9,10). Thermal desorption tube samples were collected on the downwind edge ofa lagoon or from the surface of the lagoon by using sampling pumps in thevacuum mode (56). Samples from the surface of the lagoon were collected withdynamic flux chambers as previously described (9, 10). In order to collect suffi-cient VOC for analysis, 50 liters of air at a flow rate of 500 ml � min�1 was passedthrough a thermal desorption tube (59). After sampling, the tubes were sealed inglass storage tubes, transported to the laboratory on ice, and stored at �20°Cuntil analysis. All thermal desorption tube samples were processed and analyzedwithin 7 days (28).
Analysis of environmental odor pollutants in the air. Chemical analytes con-centrated on the thermal desorption tubes were analyzed by using a Dynatherm
thermal desorption unit (model 890; Supelco Inc., Bellefonte, Pa.) coupled to aTrimetrics model 9001 gas chromatograph (Finnigan Corp., Austin, Tex.)equipped with a flame ionization detector. Tubes were desorbed at 300°C for 5min at a carrier flow rate of 2.2 ml � min�1. Analytes were transferred from thedesorber oven to an HP-Innowax capillary column (30 m by 0.25 mm by 0.25 �m;Hewlett-Packard, Rolling Meadows, Ill.) through a nickel transfer line heated at240°C. Analytes were adequately focused on the front of the column by using aninitial oven temperature of 50°C for 3 min. The oven temperature was increasedto 210°C at a rate of 8°C � min�1, maintained at 210°C for 3 min, and thenincreased to 260°C at a rate of 10°C � min�1. The identity of each VOC wasdetermined based on the retention times of authentic standards purchased fromAldrich Chemical Co. (Milwaukee, Wis.) and was confirmed by gas chromatog-raphy-mass spectrometry. Authentic standards were trapped on thermal desorp-tion tubes by using a model 1000 dynamic thermal stripper (Supelco Inc.) byheating standard solutions of each VOC to 92°C for 30 min. Standard solutionswere purged with activated-carbon-filtered nitrogen gas during the heating pro-cedure and then trapped on thermal desorption tubes inside a heated jacket(70°C).
The gas chromatography-mass spectrometry analysis was performed by usinga Hewlett-Packard model 6890 gas chromatograph equipped with a mass spec-trometer and by using either an HP-Innowax capillary column or a PTE-5 QTMcapillary column (30 m by 0.25 mm by 0.25 �m; Supelco Inc.) as previouslydescribed (58, 59).
Correlation of a human olfactory response with a VOC concentration wasdetermined by using an equation based on Stevens’ law of perception (47–49), asdescribed previously (57).
Isolation of photosynthetic bacteria from lagoon samples by using enrichmentcultures. The following two media were used for isolation and maintenance ofphotosynthetic bacteria from swine waste lagoons: photosynthetic mineral saltsbroth (PMSB) (34) and photosynthetic mineral salts medium (PMS) (12). Inaddition, six reductants (hydrogen sulfide, succinate, valeric acid, butanoic acid,phenol, and 3-methyl indole) were tested with each medium with samples fromeach site. Samples (10 ml) of lagoon water filtered through cheesecloth wereused to inoculate 100 ml of PMS or PMSB in 110-ml glass Hypo vials sealed withTeflon-lined silicon septa. The cultures were incubated under anaerobic condi-tions in the presence of light (General Electric Bright Stik Gro and Sho bulbs)for 10 days at room temperature (20 to 23°C). When a culture reached thestationary phase, a 10-ml inoculum was transferred into fresh mineral saltsmedium and incubated as described above; a total of four transfers were made.Cells from the fourth enrichment culture were then spread onto PMS agar platesand incubated in an Oxoid anaerobic jar (Unipath Ltd., Basingstoke, Hampshire,United Kingdom). The plates were incubated under grow lights at room tem-perature for 10 days, and individual colonies were streaked for single-colonyisolation.
Identification of photosynthetic bacteria from lagoon samples on solid media.Lagoon samples were also plated on solid PMBS or PMS containing 5% filter-sterilized lagoon water. The lagoon water was sterilized by centrifugation at13,200 � g for 20 min at 4°C and then centrifugation of the supernatant at 13,200� g for 20 min at 4°C and subsequent filter sterilization with a 0.22-�m-pore-sizefilter. The substrates and carbon sources described above for liquid enrichmentcultures were used for all three solid media. Plates were incubated under anaer-obic conditions under grow lights at room temperature for 10 days. The greenand purple colonies were picked and streaked for single-colony isolation.
Isolation and identification of bacteriochlorophylls. Chlorophylls were iso-lated, characterized, and identified as described by Oelze (29). Spectra wereobtained with an Aminco DW-2000 UV-visible spectrophotometer in the splitbeam mode.
Cellular fatty acid analysis. Photosynthetic isolates were cultured on Bactotryptic soy broth agar (Difco) and incubated at 28°C for 48 h, and the cellularfatty acid contents were determined by using the MIDI procedure (MIDI, Inc.,Newark, Del.). Identification of isolates was based on a comparison of fatty acidprofiles with the fatty acid profiles in tryptic soy broth agar anaerobe databases(MIDI Inc.) (27, 40, 41).
Phylogenetic analysis. The sequence of the gene coding for the 16S rRNAfrom nine purple non-sulfur bacterial isolates, one from each photosyntheticlagoon tested, was determined. The 16S rRNA-encoding gene was PCR ampli-fied from genomic DNA by using primers 8F (5�-AGAGTTTGATCCTGGCTCAG-3�) and 1492R (GGTTACCTTGTTACGACTT-3�) as previously described(4). Approximately 500 bases of sequence was determined directly from eachamplicon by using primer 519R (5� GTATTACCGCGGCTGCTGG). The se-quences of the isolates were identical. Strain PS9 (8) was selected as a repre-sentative strain, and a collection of primers based on known sequences was usedto determine the entire 1,419-base sequence of the amplified 16S rRNA gene at
VOL. 69, 2003 PHOTOSYNTHETIC BACTERIA IN SWINE WASTE LAGOON 1711
an average coverage of 2.5. The consensus 16S ribosomal DNA (rDNA) se-quence of strain PS9 was initially aligned with a collection of rDNA sequences inthe Ribosomal Database Project (release 8.0) (24) by using the automatedalignment tool in ARB (http://www.arb-home.de). The alignment was then ad-justed manually to align regions of conserved primary sequence and secondary-structure elements.
A phylogenetic tree was created by using the maximum-likelihood methodFastDNAml (31). Bootstrap values were computed with the neighbor-joiningprogram in ARB. The GenBank accession numbers for sequences used in thephylogenetic reconstruction are as follows: Rhodobacter gluconicum,AB077986.1; Rhodobacter blasticus, D16429; Rhodobacter sp. strain TCRI3,AB017796; Rhodobacter apigmentum, AF035433; Rhodobacter azotoformans,D70847; Rhodobacter sphaeroides, X53855; Roseobacter litoralis, X78312; Ro-seobacter denitrificans, M59063; Roseobacter gallaeciensis, Y13244; Rhodovulumiodosum, Y15011; and Rhodovulum adriaticum, D16418.
Nucleic acid extraction and analysis of lagoon samples. Sufficient quantities ofnucleic acids for filter hybridization experiments were obtained from 0.5-g (wetweight) portions of harvested lagoon pellets by using modifications of themethod of Buckley et al. (4). Lagoon pellets were resuspended in 0.7 ml ofhomogenization buffer (4 M guanidium thiocyanate, 200 mM sodium phosphate[pH 8], 25 mM sodium citrate, 0.5% N-lauryl sarcosine, 1.7% polyvinylpolypyr-rolidone) (30) and combined with 0.7 g of 0.1-mm-diameter zirconia-silica beads(Biospec Products, Bartlesville, Okla.). Cells were lysed with a bead beater(Biospec Products) at 0 to 4°C and centrifuged at 3,000 � g for 10 min, and thesupernatant was mixed with 0.1 volume of 5 M sodium chloride and 0.5 volumeof 50% polyethylene glycol 8000 and incubated on ice for 2 h. Samples werecentrifuged at 15,000 � g for 30 min, washed with 70% ethanol, and thenresuspended in 2 ml of 120 mM sodium phosphate buffer (pH 7.2). Each extractwas combined with 0.1 volume of 10% hexadecyltrimethylammonium bromideand heated at 60°C for 5 to 8 min to remove some humic acid contamination. Thenucleic acids were purified further by extraction with an equal volume of phenol-chloroform-isoamyl alcohol (25:24:1) at pH 4.7 for RNA and at pH 7.0 for DNA.Hydroxyapatite spin columns (Bio-Rad Laboratories, Hercules, Calif.) were usedto remove the remaining humic acid contaminants by the method of Purdy et al.(35), desalted with Sephadex G-75 spin columns (Pharmacia Biotech, Uppsala,Sweden) precipitated with sodium acetate-isopropanol (1:6, vol/vol) (35), andresuspended in diethyl pyrocarbonate-treated RNase-free water (39). For extrac-tion of DNA, 100 �g of RNase A (Sigma Chemical Co., St. Louis, Mo.) per mlwas added following the hydroxyapatite spin column treatment, and the samplewas incubated for 1 h at 37°C.
Oligonucleotide probes and labeling. Total 16S rDNA and 16S rRNA werequantified with the universal oligonucleotide probe Univ1390 (GAC GGG CGGTGT GTA CAA) (60) as described previously, and the contribution of membersof the domain Eubacteria was determined by hybridization with the Eubacteria-specific oligonucleotide probe Eub338 (GCT GCC TCC CGT AGG AGT) asdescribed previously (2). Like the Univ1390 and Eub338 probes, probe Rhodo2(ACC ATC TCT GGA ACC GCG) complementary to regions of the small-subunit rRNA molecule was designed for detection and monitoring of a taxon,Rhodobacter sp. strain PS9. Rhodo2 was designed by using the Probe Designfunction in the ARP program (http://www.arb-home.de). Probes Rhodo1 (CTGGAA CCG CGA TCG CCA) and Rhodo2, suggested by the Probe Designprogram, were tested with a variety of bacterial species, including R. sphaeroides.Rhodo2 was chosen based on its specificity for Rhodobacter sp. strain PS9 underthe hybridization conditions described below. Rhodo1 was less specific andshowed similar hybridization to R. sphaeroides and Rhodobacter sp. strain PS9.Oligonucleotide probes were 5� end labeled by using T4 polynucleotide kinase(Promega Corp., Madison, Wis.) with [�-32P]ATP as previously described (39).
Quantitative filter hybridization. Quantitative filter hybridization was per-formed by the method of DeLong (6), with minor modifications. Nucleic acidsfrom lagoon samples and cultures were denatured with 2% glutaraldehyde–50mM Na2HPO4 and blotted onto Magna Charge nylon membranes (MSI MicronSeparations Inc., Westborough, Mass.) with a Bio-Dot microfiltration apparatus(Bio-Rad Laboratories). Replicate membranes were hybridized with 32P-labeledoligonucleotide probes (Univ1390, Eub338, or Rhodo2) for a minimum of 24 hat 40°C and washed twice for 30 min at 45°C in 2� ST solution containing 0.1%sodium dodecyl sulfate (6, 36). The membranes were then dried and cut intoseparate hybridization spots, and the radioactivity was quantified with a PackardTri-Carb 2100TR liquid scintillation analyzer.
The relative abundance of 16S rDNA and the relative abundance of 16S rRNAwere calculated by determining the ratio of the signal derived from domain- orgroup-specific probes to the signal derived from the universal probe (6, 13). Tocalculate the relative abundance of Rhodobacter sp. strain PS9, the slopes of theprobe binding curves were determined for serial dilutions of positive controls
(Rhodobacter sp. strain PS9), negative controls (Saccharomyces cerevisiae ATCC32747, Halobacterium sp., Escherichia coli ATCC e11303, Methylococcus capsu-latus Bath, and R. sphaeroides ATCC 17023), and lagoon samples. Positivecontrols were included on each membrane. The relative abundance of 16S rDNAand the relative abundance of 16S rRNA from Rhodobacter sp. strain PS9 inswine lagoon samples (expressed as percentages) were determined by using thefollowing equation:
% Abundance � �Ssample
Gsample��
i�1
nSneg
Gneg
Spos
Gpos��
i�1
nSneg
Gneg
� � 100
To account for the contribution of nonspecific binding, the ratio of specificprobe (S) binding to universal or general probe (G) binding for each of thenegative controls (Sneg/Gneg) was subtracted from ratio of the signal intensitiesfor each of the samples (Ssample/Gsample). To account for the difference inprobe-specific activity, the ratio of specific probe binding to universal probebinding for positive controls (Spos/Gpos) was determined. Because nonspecificbinding could occur for positive controls, Sneg/Gneg was subtracted from Spos/Gpos. Under the hybridization conditions described above, Rhod2 showed nocross-reactivity with the negative controls tested. The equation given above wasused to correct for the different specific activities of the probes used and toaccount for nonspecific binding.
Microscopy. Phase-contrast microscopy and fluorescent microscopy were per-formed with a Zeiss Axioplan II microscope equipped with an Axio Cam HRCcamera. Fluorescent microscopy was carried out in a dark room to minimizebackground light by using a 4�,6�-diamidino-2-phenylindole (DAPI) filter.
Electron microscopy samples were prepared at the Iowa State UniversityBessey Microscopy Facility as previously described (51). Images were obtainedwith a JEOL 1200EX scanning transmission electron microscope (Japan Elec-tron Optic Laboratories, Akishima, Japan).
Statistical analysis. Pearson correlation coefficients and probabilities weredetermined by bivariate correlation analysis by using SPSS 10.1.3 (SPSS Inc.,Chicago, Ill.).
Nucleotide sequence accession number. The consensus 16S rDNA sequence ofstrain PS9 has been deposited in the GenBank database under accession numberAF515782.
RESULTS
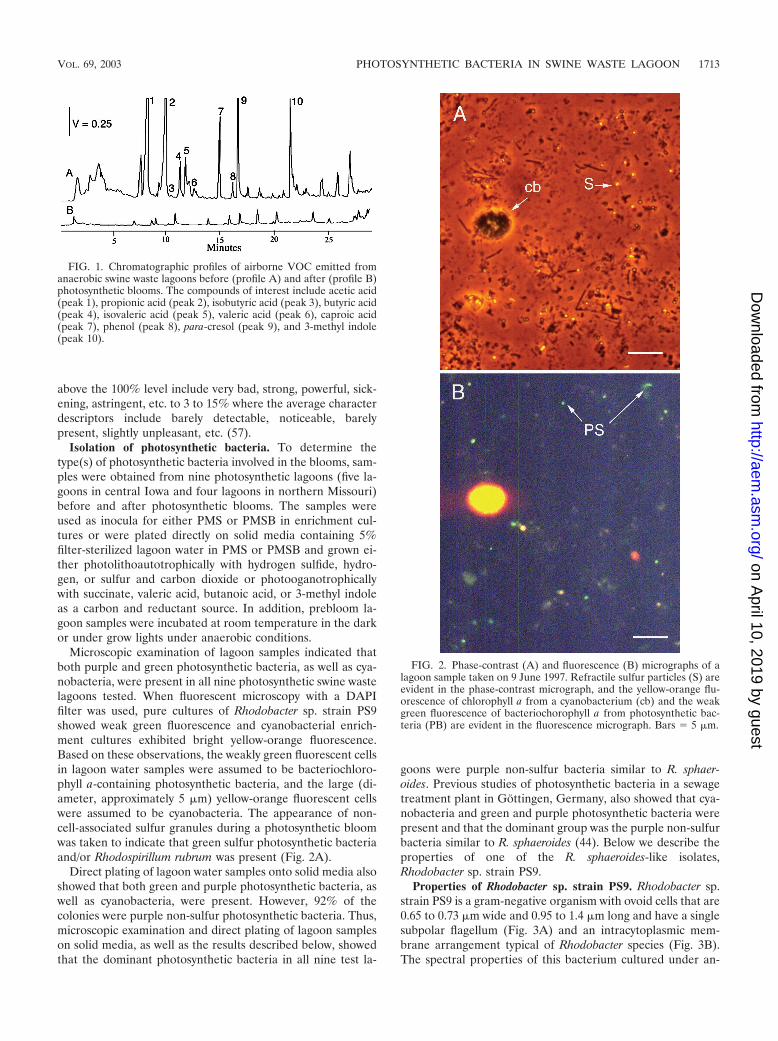
Field observations. Several investigators have describedtemporal changes in the pigmentation of swine waste lagoons(50). In field reports workers have also described reductions inodor with coincidental changes in lagoon color to purple. Toinvestigate these temporal events, the emission of VOC priorto and following photosynthetic blooms was monitored in ninelagoons. The concentration of VOC was used to monitor odorlevels since it is the only reliable predictor of odor intensity atswine production facilities (19, 55, 57–59). An example of theVOC emissions before and after a photosynthetic bloom in ananaerobic swine waste lagoon in central Iowa is shown in Fig.1. Reductions in the VOC emissions of 80 to 93% were ob-served following photosynthetic blooms in all nine test lagoons.Conversely, the VOC emissions from the six nonphotosyn-thetic lagoons increased 23 to 36% during the same time pe-riod. These results are consistent with studies of Zahn et al.(59) that showed that the levels of VOC emissions from pho-tosynthetic lagoons were 10 to 20% of the levels of emissionsfrom nonphotosynthetic lagoons or from other swine wastestorage or treatment systems at test sites in Iowa, Oklahoma,Minnesota, and North Carolina (59). On a 1 to 100% humanresponse scale (see Materials and Methods) (57) the odorintensity level decreased from more than 100% where theaverage character descriptors associated with the odor at or
above the 100% level include very bad, strong, powerful, sick-ening, astringent, etc. to 3 to 15% where the average characterdescriptors include barely detectable, noticeable, barelypresent, slightly unpleasant, etc. (57).
Isolation of photosynthetic bacteria. To determine thetype(s) of photosynthetic bacteria involved in the blooms, sam-ples were obtained from nine photosynthetic lagoons (five la-goons in central Iowa and four lagoons in northern Missouri)before and after photosynthetic blooms. The samples wereused as inocula for either PMS or PMSB in enrichment cul-tures or were plated directly on solid media containing 5%filter-sterilized lagoon water in PMS or PMSB and grown ei-ther photolithoautotrophically with hydrogen sulfide, hydro-gen, or sulfur and carbon dioxide or photooganotrophicallywith succinate, valeric acid, butanoic acid, or 3-methyl indoleas a carbon and reductant source. In addition, prebloom la-goon samples were incubated at room temperature in the darkor under grow lights under anaerobic conditions.
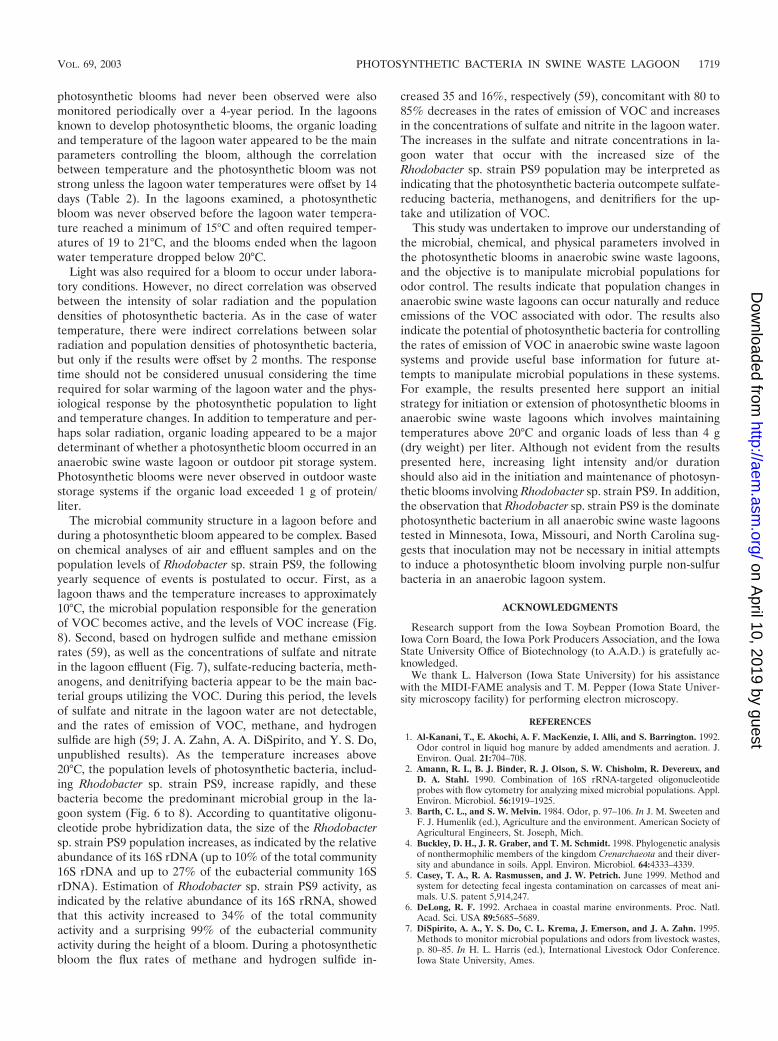
Microscopic examination of lagoon samples indicated thatboth purple and green photosynthetic bacteria, as well as cya-nobacteria, were present in all nine photosynthetic swine wastelagoons tested. When fluorescent microscopy with a DAPIfilter was used, pure cultures of Rhodobacter sp. strain PS9showed weak green fluorescence and cyanobacterial enrich-ment cultures exhibited bright yellow-orange fluorescence.Based on these observations, the weakly green fluorescent cellsin lagoon water samples were assumed to be bacteriochloro-phyll a-containing photosynthetic bacteria, and the large (di-ameter, approximately 5 �m) yellow-orange fluorescent cellswere assumed to be cyanobacteria. The appearance of non-cell-associated sulfur granules during a photosynthetic bloomwas taken to indicate that green sulfur photosynthetic bacteriaand/or Rhodospirillum rubrum was present (Fig. 2A).
Direct plating of lagoon water samples onto solid media alsoshowed that both green and purple photosynthetic bacteria, aswell as cyanobacteria, were present. However, 92% of thecolonies were purple non-sulfur photosynthetic bacteria. Thus,microscopic examination and direct plating of lagoon sampleson solid media, as well as the results described below, showedthat the dominant photosynthetic bacteria in all nine test la-
goons were purple non-sulfur bacteria similar to R. sphaer-oides. Previous studies of photosynthetic bacteria in a sewagetreatment plant in Gottingen, Germany, also showed that cya-nobacteria and green and purple photosynthetic bacteria werepresent and that the dominant group was the purple non-sulfurbacteria similar to R. sphaeroides (44). Below we describe theproperties of one of the R. sphaeroides-like isolates,Rhodobacter sp. strain PS9.
Properties of Rhodobacter sp. strain PS9. Rhodobacter sp.strain PS9 is a gram-negative organism with ovoid cells that are0.65 to 0.73 �m wide and 0.95 to 1.4 �m long and have a singlesubpolar flagellum (Fig. 3A) and an intracytoplasmic mem-brane arrangement typical of Rhodobacter species (Fig. 3B).The spectral properties of this bacterium cultured under an-
FIG. 1. Chromatographic profiles of airborne VOC emitted fromanaerobic swine waste lagoons before (profile A) and after (profile B)photosynthetic blooms. The compounds of interest include acetic acid(peak 1), propionic acid (peak 2), isobutyric acid (peak 3), butyric acid(peak 4), isovaleric acid (peak 5), valeric acid (peak 6), caproic acid(peak 7), phenol (peak 8), para-cresol (peak 9), and 3-methyl indole(peak 10).
FIG. 2. Phase-contrast (A) and fluorescence (B) micrographs of alagoon sample taken on 9 June 1997. Refractile sulfur particles (S) areevident in the phase-contrast micrograph, and the yellow-orange flu-orescence of chlorophyll a from a cyanobacterium (cb) and the weakgreen fluorescence of bacteriochorophyll a from photosynthetic bac-teria (PB) are evident in the fluorescence micrograph. Bars � 5 �m.
VOL. 69, 2003 PHOTOSYNTHETIC BACTERIA IN SWINE WASTE LAGOON 1713
aerobic conditions in the presence of light were similar to thespectral properties obtained directly for anaerobic swine wastelagoons during photosynthetic blooms in late summer, as wellas the spectral properties of prebloom lagoon samples incu-bated in the presence of light at room temperature (approxi-mately 22°C) (Fig. 4). Whole-cell UV-visible absorption spec-tra had absorption maxima at 377, 450, 477, 509, 589, 801, 850,and 951 nm. The whole-cell absorption spectrum of Rhodo-bacter sp. strain PS9 (Fig. 4A) indicated that the cells containedboth light-harvesting I and light-harvesting II photocomplexes(23, 61) and the B800-850-type antenna complex, as well ascarotenoids, all of which are characteristic of purple non-sulfurphotosynthetic bacteria (23, 29, 33, 61).
Bacteriochlorophyll extracts resuspended in ethyl ether alsoproduced UV-visible absorption maxima characteristic of bac-teriochlorophyll a and of carotenoids and the spheroideneseries (Fig. 4B) (17, 22, 28). The spectra of bacteriochlorophyllextracts of lagoon samples obtained during the blooms weresimilar to the spectra of extracts of Rhodobacter sp. strain PS9,and additional absorption maxima at 436, 524, and 677 nmindicated that chlorophyll a was present (Fig. 4B). The highconcentrations of chlorophyll a observed in the extracts oflagoon samples (Fig. 4B) were unexpected since macroscopicand microscopic examinations of lagoon water showed thatlittle or no plant material, algae, or cyanobacteria werepresent. Cyanobacteria could be detected during enrichment inmost of the lagoons tested, but few cyanobacteria were de-tected prior to enrichment. Since there was no other identifi-able source of chlorophyll a, the source of chlorophyll a wasprobably the corn- and soybean-based animal feed. Chloro-phyll a is a pigment associated with manure from animal feedscontaining corn and soybean products and can be used todetect fecal contamination (5).
By using MIDI-FAME analysis the major purple photosyn-thetic isolates from all nine test photosynthetic lagoons wereidentified as R. sphaeroides strains with similarity indices of 0.9� 0.05. The predominant fatty acid (84.3% � 6.8% of the totalfatty acids) was 18:1 7c, followed by 18:0 (3.6% � 0.5%), 10:03OH (3.3% � 0.5%), 16:0 (1.1% � 0.12%), 17:0 (1% � 0.2%),
and 11-methyl 18:1 7c (0.9% � 0.1%). In addition to thesamples from the nine photosynthetic lagoons in Iowa andMissouri tested, single samples from five additional photosyn-thetic swine waste lagoons in Minnesota (n �3) and NorthCarolina (n � 2) were used for enrichments. The 17 purplenon-sulfur photosynthetic isolates obtained from these fivephotosynthetic lagoons were similar to Rhodobacter sp. strainPS9 and showed MIDI-FAME similarity indices of 0.91 � 0.07to R. sphaeroides.
The phylogenetic tree based on the 16S rRNA gene se-quence (Fig. 5) also grouped Rhodobacter sp. strain PS9 withother members of the genus Rhodobacter. Rhodobacter sp.strain PS9 grouped closest to R. azotoformans, a denitrifyingpurple non-sulfur photosynthetic bacteria isolated from an ac-tivated sludge pit (17, 18), exhibiting a 2% sequence difference.
Four Rhodobacter isolates from swine waste lagoons weretested to determine the range of suitable electron donors andcarbon sources during photosynthetic growth. The results werethe same for all four isolates, and the results for Rhodobactersp. strain PS9 are shown in Table 1. Rhodobacter sp. strain PS9grew photoorganotropically on a wide variety of organic com-pounds, including short-chain fatty acids, sugars, amino acids,and aromatic carbon compounds, but not on chemolithotro-
FIG. 3. Electron micrographs of negatively stained (A) and ultra-thin-sectioned (B) cells of Rhodobacter sp. strain PS9, showing ovoidcells with a subpolar flagellum and a vesicular type of intracytoplasmicmembrane arrangement, respectively.
FIG. 4. UV-visible absorption spectra. (A) Spectra for anaerobicswine waste lagoons before (trace c) and after (trace a) purple pho-tosynthetic blooms, compared with the spectrum for Rhodobacter sp.strain PS9 grown photosynthetically (trace b). (B) Spectra for metha-nol extracts of bacteriochorophyll from a purple photosynthetic lagoon(trace a) and Rhodobacter sp. strain PS9 (trace b). (Inset) Lagoonliquid samples taken prior to a photosynthetic bloom and incubated for20 days under anaerobic conditions in the dark (serum vial A) or undergrow lights (serum vial B) at room temperature.
phic substrates. Rhodobacter sp. strain PS9 also did not grow inthe dark on any of the growth substrates tested.
Quantification of Rhodobacter sp. strain PS9 in anaerobicswine waste lagoons by oligonucleotide probe hybridization.Lagoon samples were taken from four locations around theperimeter of a lagoon at a depth of 0.2 to 0.3 m. Previouslyobtained depth profiles for seven of the nine test lagoonsdemonstrated that above the sludge layer, 0.5 to 1 m from thebottom, the concentrations of target microorganisms, bacteri-ochlorophyll, and total protein were essentially constant withdepth (7). This high degree of homogeneity in the water col-umns of the test lagoons eliminated the need for depth profil-ing during this phase of the study. Figure 6 shows the relativeabundance of the Rhodobacter sp. strain PS9 population in ananaerobic swine waste lagoon during 1997 based on rDNA andrRNA signals. For simplicity, weekly hybridization and VOCmeasurements were combined to obtain monthly averages. Byusing the universal oligonucleotide probe (Univ1390) andprobes specific for eubacteria (Eub338) and Rhodobacter sp.strain PS9 (Rhodo2), the abundance of 16S rDNA and theabundance of 16S rRNA were determined. The concentrationof rDNA was used to estimate population density, whereas theconcentration of rRNA was used to estimate the activity levelof this bacterium. During the 3-month period from April toJune, the contribution of Rhodobacter sp. strain PS9 16S rDNAto the total community 16S rDNA was low (approximately0.3%), as was the contribution of the 16S rRNA of this organ-ism to the total community 16S rRNA (approximately 0.8%).However, the relative levels of Rhodobacter sp. strain PS9 16SrDNA and 16S rRNA increased rapidly in late June and even-tually were 10% � 3% and 34% � 12% of the total communitylevels, respectively, in September. Moreover, the relative levelsof Rhodobacter sp. strain PS9 16S rDNA and 16S rRNA in-creased to 27 and 99% of the eubacterial community levels inSeptember, respectively. The results obtained were consistentwith the results of previous studies of Merrill and Halverson(25) for community structure in anaerobic swine wastes la-goons obtained by using MIDI-FAME analysis. Taken to-gether, the results demonstrate that during the photosyntheticblooms, which peak in the late summer to the early fall,
Rhodobacter sp. strain PS9 is the major photosynthetic bacte-rium in the lagoons.
Correlation of photosynthetic blooms with environmentalconditions. In an attempt to identify the environmental condi-tions conducive to photosynthetic blooming, seasonal varia-tions in the meteorological, biological, and chemical factorswere measured and related to changes in the microbial popu-lations. To minimize variables due to site, lagoon construction,weather, management practices, animal genetics, and feedvariability, eight test lagoons (four photosynthetic lagoons andfour nonphotosynthetic lagoons) in northern Missouri at thesame production facility were studied. At this facility the samefeed (mixed on site), building and lagoon construction, numberof animals per building, and animal genetic lines were utilizedfor all buildings and lagoons. The only discernible difference
FIG. 5. Phylogenetic analysis of Rhodobacter sp. strain PS9 andselect photosynthetic bacteria in the alpha subdivision of the divisionProteobacteria. Bootstrap values greater than 80% are indicated at thenodes. The 16S rDNA sequence of Caulobacter vibrioides (data notshown) was used to root the phylogenetic tree. The evolutionary dis-tance is based on the number of fixed point mutations per position.
TABLE 1. Utilization of electron donor and carbon sources forphototrophic growth by Rhodobacter sp. strain PS9 and
was the size and age of the animals in the buildings. Thelagoons servicing the buildings devoted to finisher pigs hadhigher organic loading rates and higher residual organic con-tents (more than 5 mg [dry weight]/ml) than the lagoons ser-vicing buildings devoted to farrowing pigs (usually less than 4mg [dry weight]/ml). Of the four photosynthetic lagoons exam-ined in northern Missouri, three serviced farrowing pigs, whileone serviced a finisher pig site.
Figure 7 shows the seasonal variations in biomass (protein)and bacteriochlorophyll concentrations (Fig. 7A), air and la-goon water temperatures (Fig. 7B), solar radiation (Fig. 7B),and nitrate, sulfate, fluoride, chloride, and phosphate ion con-centrations (Fig. 7C) before and after a photosynthetic bloom.Of the lagoon water parameters monitored, the concentrationsof sulfate and phosphate showed the strongest positive corre-lation with the photosynthetic bloom, and the protein andfluoride concentrations showed the strongest negative correla-tion (Table 2).
On the basis of organic loading, the test lagoon chosen forweekly monitoring appeared to be ideal for culturing photo-synthetic bacteria; it had an organic load of approximately 3mg [dry weight]/ml throughout the year. Previous studies ofSeifert et al. (44) showed that the population of photosyntheticbacteria in sewage treatment plants increased with organicloading up to the highest concentration tested, 2.5 mg (dry
FIG. 6. Relative abundance of Rhodobacter sp. strain PS9 16SrDNA (top panel) and relative abundance of Rhodobacter sp. strainPS9 16S rRNA (bottom panel) in liquid samples obtained from anaer-obic swine waste lagoons during 1997, showing the contribution ofeubacteria to the total community (cross-hatched bars), the contribu-tion of Rhodobacter sp. strain PS9 to the total community (solid bars),and the contribution of Rhodobacter sp. strain PS9 to the total eubac-terial community (open bars).
FIG. 7. Seasonal variations in the meteorological, biological, andchemical factors in two-stage anaerobic swine waste lagoons.(A) Monthly averages for the concentrations of bacteriochlorophyll(■) and protein (F) and the contribution of Rhodobacter sp. strain PS9to the total community as measured by the abundance of 16S rRNA(�). (B) Monthly averages for solar radiation (■), water temperature(F), air temperature (Œ), and the contribution of Rhodobacter sp.strain PS9 to the total community as measured by the abundance of16S rRNA (�). (C) Monthly averages for the concentrations of phos-phate (Œ), fluoride (�), chloride (■), sulfate (E), and nitrate (‚) andthe contribution of Rhodobacter sp. strain PS9 to the total communityas measured by the abundance of 16S rRNA (�).
weight)/ml. The results of this study showed that this trendcontinued up to a maximum value of 3.0 to 3.5 mg (dryweight)/ml and showed that the trend was the opposite athigher organic loading rates. In the lagoons that were moni-tored or sampled, photosynthetic blooms were observed onlyin swine waste lagoons with protein concentrations of less than4 g (dry weight)/liter or 1 g of protein/liter. Organic loadingwas not a determining variable in the Ogden, Iowa, lagoonused for weekly monitoring in this study since the concentra-tion in the test lagoon never exceeded 1 g of protein/ml. How-ever, even in this lagoon, a strong negative correlation betweenthe organic load as measured by protein concentration (Fig.7A) and the photosynthetic bloom was still apparent.
To our surprise, the correlation between temperature and aphotosynthetic bloom was significant only when the data werecompared to the abundance of Rhodobacter sp. strain PS9 16SrRNA in the total eubacterial population (Table 2). This wassurprising considering that in all nine test lagoons, as well as inmore than 30 lagoons visited over a 4-year period, initiation ofthe photosynthetic bloom occurred only when the lagoon watertemperature reached 15 to 20°C. A possible explanation forthis unexpected result was obtained if the water temperaturevalues were moved forward 14 days. When this shift was made,statistically significant correlations were observed between la-goon water temperature and the photosynthetic blooms (Table2). The 14-day shift in the temperature data was chosen basedon the incubation time needed for a photosynthetic bloom tooccur in the laboratory when prebloom lagoon samples areincubated at 23°C (Fig. 4, inset). Thus, a positive correlationbetween temperature and the photosynthetic bloom was ob-served when the physiological response time was taken intoconsideration.
Little correlation was also observed between light intensityand the photosynthetic blooms. As illustrated in Fig. 4, lightwas necessary for a bloom to occur; however, there was littlecorrelation between the level of solar radiation and the devel-opment of a photosynthetic bloom (Table 2; Fig. 7B). In fact,the largest population and highest activity levels of Rhodo-bacter sp. strain PS9 were observed during periods of low lightintensity. However, as with lagoon temperatures, if the solarradiation data and the time of a population bloom were offsetby 2 months, then some correlation between solar radiationand the photosynthetic bloom was observed (Table 2). Asobserved with temperature, there appeared to be a lag periodbetween the exposure to solar radiation and the physiologicalresponse leading to higher population levels.
A second unexpected result was the positive correlation be-tween a photosynthetic bloom and the concentration of sulfatein the lagoon water, as well as the presence of nitrate duringthe photosynthetic bloom (Table 2; Fig. 7C). These resultssuggest that there may be competition among sulfate-reducingbacteria, denitrifying bacteria, and photosynthetic bacteria,possibly for low-molecular-mass organic substrates. However,this competition is only inferred since the populations of sul-fate-reducing and denitrifying bacteria were not monitored inthis study.
At this time we have no explanation for the positive corre-lation between the phosphate concentration and the photosyn-thetic blooms and the negative correlation between the fluo-ride concentration and the photosynthetic blooms (Table 2).
Correlation between photosynthetic blooms and rate ofemission of VOC. The seasonal rates of emission of VOC,including short-chain fatty acids, such as acetic acid, propionicacid, butyric acid, valeric acid, isovaleric acid, caproic acid, andisocaproic acid, and aromatic carbon compounds, such as phe-nol, para-cresol, and 3-methyl indole, were measured, and theywere inversely correlated with Rhodobacter sp. strain PS9 pop-ulation and activity levels (Table 2; Fig. 8). For simplicity, theconcentrations of individual fatty acids and individual aromaticcompounds were combined for Fig. 8, since the compounds ineach group exhibited similar temporal trends. The rates ofemission of short-chain fatty acids and aromatic carbon com-pounds were highest during August and September, respec-tively, and decreased to 80% and 85% of the maximal values,respectively, during the photosynthetic blooms in Septemberand early November. Figure 8 also shows that the concentra-tions of volatile short-chain fatty acids decreased first and thatthese decreases were followed by decreases in the concentra-tions of aromatic compounds.
DISCUSSION
Temporal changes in the pigmentation of waste treatmentlagoons from pink to rose to brown have previously been ob-served by a number of researchers (50, 53). The color changesreflect changes in physical and chemical factors that result inthe selection of different bacterial groups, and this is especiallyevident in anaerobic livestock waste lagoons (53). Moreover,field reports indicate that there is a correlation between odorreduction and pigmentation changes in lagoons to purple.However, the organism(s) responsible for odor reduction hasnever been identified, nor have the population levels of themicroorganisms responsible for the change to a purple colorbeen studied in a systematic manner over time.
In this study nine anaerobic swine waste lagoons known todevelop photosynthetic blooms were monitored periodicallyover a 4-year period, and one lagoon was monitored weekly for1 year. In addition, six anaerobic swine waste lagoons in which
FIG. 8. Seasonal fluctuations in the concentrations of volatile fattyacids (acetic acid, propionic acid, butyric acid, isobutyric acid, valericacid, isovaleric acid, caproic acid, isocaproic acid) (Œ) and aromaticcarbon compounds (4-methyl phenol, 4-ethyl phenol, para-cresol, in-dole, 3-methyl indole) (‚) compared with the abundance ofRhodobacter sp. strain PS9 16S rDNA (■) and the abundance ofRhodobacter sp. strain PS9 16S rRNA (�) in the total community inliquid lagoon samples.
photosynthetic blooms had never been observed were alsomonitored periodically over a 4-year period. In the lagoonsknown to develop photosynthetic blooms, the organic loadingand temperature of the lagoon water appeared to be the mainparameters controlling the bloom, although the correlationbetween temperature and the photosynthetic bloom was notstrong unless the lagoon water temperatures were offset by 14days (Table 2). In the lagoons examined, a photosyntheticbloom was never observed before the lagoon water tempera-ture reached a minimum of 15°C and often required temper-atures of 19 to 21°C, and the blooms ended when the lagoonwater temperature dropped below 20°C.
Light was also required for a bloom to occur under labora-tory conditions. However, no direct correlation was observedbetween the intensity of solar radiation and the populationdensities of photosynthetic bacteria. As in the case of watertemperature, there were indirect correlations between solarradiation and population densities of photosynthetic bacteria,but only if the results were offset by 2 months. The responsetime should not be considered unusual considering the timerequired for solar warming of the lagoon water and the phys-iological response by the photosynthetic population to lightand temperature changes. In addition to temperature and per-haps solar radiation, organic loading appeared to be a majordeterminant of whether a photosynthetic bloom occurred in ananaerobic swine waste lagoon or outdoor pit storage system.Photosynthetic blooms were never observed in outdoor wastestorage systems if the organic load exceeded 1 g of protein/liter.
The microbial community structure in a lagoon before andduring a photosynthetic bloom appeared to be complex. Basedon chemical analyses of air and effluent samples and on thepopulation levels of Rhodobacter sp. strain PS9, the followingyearly sequence of events is postulated to occur. First, as alagoon thaws and the temperature increases to approximately10°C, the microbial population responsible for the generationof VOC becomes active, and the levels of VOC increase (Fig.8). Second, based on hydrogen sulfide and methane emissionrates (59), as well as the concentrations of sulfate and nitratein the lagoon effluent (Fig. 7), sulfate-reducing bacteria, meth-anogens, and denitrifying bacteria appear to be the main bac-terial groups utilizing the VOC. During this period, the levelsof sulfate and nitrate in the lagoon water are not detectable,and the rates of emission of VOC, methane, and hydrogensulfide are high (59; J. A. Zahn, A. A. DiSpirito, and Y. S. Do,unpublished results). As the temperature increases above20°C, the population levels of photosynthetic bacteria, includ-ing Rhodobacter sp. strain PS9, increase rapidly, and thesebacteria become the predominant microbial group in the la-goon system (Fig. 6 to 8). According to quantitative oligonu-cleotide probe hybridization data, the size of the Rhodobactersp. strain PS9 population increases, as indicated by the relativeabundance of its 16S rDNA (up to 10% of the total community16S rDNA and up to 27% of the eubacterial community 16SrDNA). Estimation of Rhodobacter sp. strain PS9 activity, asindicated by the relative abundance of its 16S rRNA, showedthat this activity increased to 34% of the total communityactivity and a surprising 99% of the eubacterial communityactivity during the height of a bloom. During a photosyntheticbloom the flux rates of methane and hydrogen sulfide in-
creased 35 and 16%, respectively (59), concomitant with 80 to85% decreases in the rates of emission of VOC and increasesin the concentrations of sulfate and nitrite in the lagoon water.The increases in the sulfate and nitrate concentrations in la-goon water that occur with the increased size of theRhodobacter sp. strain PS9 population may be interpreted asindicating that the photosynthetic bacteria outcompete sulfate-reducing bacteria, methanogens, and denitrifiers for the up-take and utilization of VOC.
This study was undertaken to improve our understanding ofthe microbial, chemical, and physical parameters involved inthe photosynthetic blooms in anaerobic swine waste lagoons,and the objective is to manipulate microbial populations forodor control. The results indicate that population changes inanaerobic swine waste lagoons can occur naturally and reduceemissions of the VOC associated with odor. The results alsoindicate the potential of photosynthetic bacteria for controllingthe rates of emission of VOC in anaerobic swine waste lagoonsystems and provide useful base information for future at-tempts to manipulate microbial populations in these systems.For example, the results presented here support an initialstrategy for initiation or extension of photosynthetic blooms inanaerobic swine waste lagoons which involves maintainingtemperatures above 20°C and organic loads of less than 4 g(dry weight) per liter. Although not evident from the resultspresented here, increasing light intensity and/or durationshould also aid in the initiation and maintenance of photosyn-thetic blooms involving Rhodobacter sp. strain PS9. In addition,the observation that Rhodobacter sp. strain PS9 is the dominatephotosynthetic bacterium in all anaerobic swine waste lagoonstested in Minnesota, Iowa, Missouri, and North Carolina sug-gests that inoculation may not be necessary in initial attemptsto induce a photosynthetic bloom involving purple non-sulfurbacteria in an anaerobic lagoon system.
ACKNOWLEDGMENTS
Research support from the Iowa Soybean Promotion Board, theIowa Corn Board, the Iowa Pork Producers Association, and the IowaState University Office of Biotechnology (to A.A.D.) is gratefully ac-knowledged.
We thank L. Halverson (Iowa State University) for his assistancewith the MIDI-FAME analysis and T. M. Pepper (Iowa State Univer-sity microscopy facility) for performing electron microscopy.
REFERENCES
1. Al-Kanani, T., E. Akochi, A. F. MacKenzie, I. Alli, and S. Barrington. 1992.Odor control in liquid hog manure by added amendments and aeration. J.Environ. Qual. 21:704–708.
2. Amann, R. I., B. J. Binder, R. J. Olson, S. W. Chisholm, R. Devereux, andD. A. Stahl. 1990. Combination of 16S rRNA-targeted oligonucleotideprobes with flow cytometry for analyzing mixed microbial populations. Appl.Environ. Microbiol. 56:1919–1925.
3. Barth, C. L., and S. W. Melvin. 1984. Odor, p. 97–106. In J. M. Sweeten andF. J. Humenlik (ed.), Agriculture and the environment. American Society ofAgricultural Engineers, St. Joseph, Mich.
4. Buckley, D. H., J. R. Graber, and T. M. Schmidt. 1998. Phylogenetic analysisof nonthermophilic members of the kingdom Crenarchaeota and their diver-sity and abundance in soils. Appl. Environ. Microbiol. 64:4333–4339.
5. Casey, T. A., R. A. Rasmussen, and J. W. Petrich. June 1999. Method andsystem for detecting fecal ingesta contamination on carcasses of meat ani-mals. U.S. patent 5,914,247.
6. DeLong, R. F. 1992. Archaea in coastal marine environments. Proc. Natl.Acad. Sci. USA 89:5685–5689.
7. DiSpirito, A. A., Y. S. Do, C. L. Krema, J. Emerson, and J. A. Zahn. 1995.Methods to monitor microbial populations and odors from livestock wastes,p. 80–85. In H. L. Harris (ed.), International Livestock Odor Conference.Iowa State University, Ames.
VOL. 69, 2003 PHOTOSYNTHETIC BACTERIA IN SWINE WASTE LAGOON 1719
8. DiSpirito, A. A., Y. S. Do, G. J. Philips, and J. A. Zahn. January 2003. ARhodobacter strain for odor remediation of anaerobic livestock waste la-goons and biomass production. U.S. patent 6,489,156.
9. DiSpirito, A. A., and J. A. Zahn. June 1998. Device for quantification ofodors from liquid livestock wastes. U.S. patent 5,766,551.
10. DiSpirito, A. A., and J. A. Zahn. April 1999. Methods and means for quan-tification of odors from livestock wastes. U.S. patent 5,898,003.
11. Do, Y. S. 2001. Role of the dominant phototrosynthetic bacterium in anaer-obic swine waste lagoons, Rhodobacter sp. PS9, in odor remediation. Ph.D.thesis. Iowa State University, Ames.
12. Gemerden, H. V., and H. H. Beeftink. 1983. Ecology of phototrophic bacte-ria, p. 146–185. In J. G. Ormerod (ed.), The phototrophic bacteria: anaerobiclife in light, vol. 4. University of California Press, Los Angeles.
13. Giovannoni, S. J., T. B. Britsschgi, C. L. Moyer, and K. G. Field. 1990.Genetic diversity in Sargasso Sea bacterioplankton. Nature 345:60–63.
14. Grady, L. C. P., T. T. Daigger, and H. C. Lim. 1999. Biological waste watertreatment, 2nd ed. Marcel Dekker, New York, N.Y.
15. Harkin, T. 1997. Animal waste pollution in America: an emerging nationalproblem. [Online.] The Minority Staff of the United States Senate Commit-tee on Agriculture, Nutrition, and Forestry, Washington, D.C. www.senate.gov/agriculture/animalw.htm.
16. Harper, L. A., and R. R. Sharpe. 1997. Lagoon nutrient cycling and atmo-spheric nitrogen losses. USDA Agricultural Research Service, Beltsville, Md.
17. Hiraishi, A., K. Muramatsu, and Y. Ueda. 1996. Molecular genetic analysisof Rhodobacter azotoformans sp. nov. and related species of phototrophicbacteria. Syst. Appl. Microbiol. 19:168–177.
18. Hiraishi, A., K. Muramatsu, and K. Urata. 1995. Characterization of newdenitrifying Rhodobacter strains isolated from photosynthetic sludge forwastewater treatment. J. Ferment. Bioeng. 79:39–44.
19. Hobbs, P. J., T. H. Misselbrook, and B. F. Pain. 1995. Assessment of odorsfrom livestock wastes by a photoionization detector, an electronic nose,olfactometry and gas chromatography-mass spectrometry. J. Agric. Eng. Res.60:137–144.
20. Koch, A. L. 1994. Growth measurement, p. 249–277. In P. Gerhardt, R. G. E.Murray, W. A. Wood, and N. R. Krieg (ed.), Methods for general andmolecular biology. American Society for Microbiology, Washington, D.C.
21. Lindley, J. A. 1982. Processing manure for feed components. AgriculturalExperimental Station North Central Regional Research publication 284.USDA Agricultural Research Service, Beltsville, Md.
22. Lowry, O. H., N. J. Rosebrough, A. L. Farr, and R. J. Randall. 1951. Proteinmeasurement with the Folin phenol reagent. J. Biol. Chem. 193:265–275.
23. Madigan, M. T., D. O. Jung, C. R. Woese, and L. A. Achenbach. 2000.Rhodoferax antarcticus sp. nov., a moderately psychrophilic purple nonsulfurbacterium isolated from an Antarctic microbial mat. Arch. Microbiol. 173:269–277.
24. Maidak, B. L., J. R. Cole, T. G. Lilburn, C. T. Parker, P. R. Saxman, R. J.Ferris, G. M. Garrity, G. J. Olsen, T. M. Schmidt, and J. M. Tiedje. 2001.The RDP (Ribosomal Database Project) moves forward. Nucleic Acids Res.29:173–174.
25. Merrill, L. S. 1999. Microbial community structure and malodorous com-pounds within swine waste storage systems. M.S. thesis. Iowa State Univer-sity, Ames.
26. Miner, J. R. 1982. Controlling odors from livestock production facilities.Agricultural Experimental Station North central Regional Research publi-cation 284. USDA Agricultural Research Service, Beltsville, Md.
27. Mukwaya, G. M., and D. F. Welch. 1989. Subgrouping of Pseudomonascepacia by cellular fatty acid composition. J. Clin. Microbiol. 27:2640–2646.
28. Odam, E. M., J. Page, M. G. Townsend, and J. P. Wilkins. 1986. Identifica-tion of volatile components in headspace from animal slurries, p. 284–295. InV. C. Nielsen, J. H. Voorburg, and P. L. Hermite (ed.), Odor prevention andcontrol of organic sludge and livestock farming. Elsevier Applied SciencePublishers, New York, N.Y.
29. Oelze, J. 1985. Analysis of bacteriochlorophylls. Methods Microbiol. 18:275–284.
30. Ogram, A., W. Sun, F. J. Brockman, and J. K. Frederickson. 1995. Isolationand characterization of RNA from low-biomass deep-subsurface sediments.Appl. Environ. Microbiol. 61:763–768.
31. Olsen, G. J., H. Matsuda, R. Hagstrom, and R. Overbeek. 1994. FasDNAml:a tool for construction of phylogenetic trees of DNA sequences using max-imum likelihood. Comput. Applic. Biosci. 10:41–48.
32. Pain, B. F., C. R. Clarkson, V. R. Phillips, J. V. Klarenbeek, T. H. Missel-brook, and M. Bruins. 1991. Odor emission arising from application oflivestock slurries on land: measurements following spreading using a mi-crometeorological technique and olfactometry. J. Agric. Eng. Res. 48:101–110.
33. Pfennig, N., and H. G. Truper. 1992. The family Cromatiaceae, p. 3200–3221.
In A. Balows, H. G. Truper, M. Dworkin, W. Harder, and K.-H. Schleifer(ed.), The prokaryotes. Springer-Verlag, Berlin, Germany.
34. Phillips, J. A., and T. D. Brock. 1991. Laboratory manual: biology of micro-organisms, 6th ed. Prentice Hall, Englewood Cliffs, N.J.
35. Purdy, K. J., T. M. Embley, S. Takii, and D. B. Nedwell. 1996. Rapidextraction of DNA and rRNA from sediments by a novel hydroxyapatitespin-column method. Appl. Environ. Microbiol. 62:3905–3907.
36. Raskin, L., J. M. Stromley, B. E. Rittmann, and D. A. Stahl. 1994. Group-specific 16S rRNA hybridization probes to describe natural communities ofmethanogens. Appl. Environ. Microbiol. 60:1232–1240.
37. Ritter, W. F. 1981. Chemical and biochemical odor control of livestockwastes: review. Can. Agric. Eng. 23:1–4.
38. Ritter, W. F. 1989. Odor control of livestock wastes: state-of-the-art in NorthAmerica. J. Agric. Eng. Res. 42:51–62.
39. Sambrook, J., E. F. Fritsch, and T. Maniatis. 1989. Molecular cloning: alaboratory manual, 2nd ed. Cold Spring Harbor Laboratory Press, ColdSpring Harbor, N.Y.
40. Sasser, M. 1990. Identification of bacteria by gas chromatography of cellularfatty acids. MIDI technical note 101. MIDI, Newark, Del.
41. Sasser, M. 1990. “Tracking” a strain using the Microbial Identification Sys-tem. MIDI technical note 102. MIDI, Newark, Del.
42. Sauer, P. J., and J. L. Hatfield.1994. Walnut Creek watershed researchprotocol report. Bulletin 94–1. National Soil Tilth Lab, USDA AgriculturalResearch Service, Beltsville, Md.
43. Schiffman, S. S., E. A. S. Miller, M. S. Suggs, and B. G. Graham. 1995. Theeffect of environmental odors emanating from commercial swine operationson the mood of nearby residents. Brain Res. Bull. 37:369–375.
44. Siefert, E., R. L. Igrens, and N. Pfennig. 1978. Phototrophic purple andgreen bacteria in a sewage treatment plant. Appl. Environ. Microbiol. 35:38–44.
45. Spoelstra, S. F. 1980. Origin of objectionable odorous components in piggerywastes and the possibility of applying indicator components for studying odordevelopment. Agric. Environ. 5:241–260.
46. Spoelstra, S. F. 1977. Simple phenols and indoles in anaerobically storedpiggery wastes. J. Sci. Food Agric. 28:415–423.
47. Stevens, S. S. 1970. Neural events and the psychological law. Science 170:1043–1050.
48. Stevens, S. S. 1962. The surprising simplicity of sensory metric. Am. Psychol.17:29–39.
49. Stevens, S. S. 1961. To honor Fechner and repeal his law. Science 133:80–86.50. Thauer, R. K. 1989. Energy metabolism of sulfate-reducing bacteria, p.
397–414. In H. G. Schlegel and B. Browien (ed.), Autotrophic bacteria.Springer-Verlag, New York, N.Y.
51. Trampel, D. W., T. M. Pepper, and B. L. Blaburn. 2000. Urinary tractcryptosporidiosis in commercial laying hens. Avian Dis. 44:479–484.
52. Warner, P. O., K. S. Sidhu, and L. Chadzynski. 1990. Measurement andimpact of agricultural odors from a large scale swine production farm. Vet.Hum. Toxicol. 32:319–323.
53. Wenke, T. L., and J. C. Vogt. 1981. Temporal changes in a pink feedlotlagoon. Appl. Environ. Microbiol. 41:381–385.
54. Williams, A. G. 1984. Indicators of piggery slurry odor offensiveness. Agric.Wastes 10:15–36.
55. Williams, A. G., and M. R. Evans. 1981. Storage of piggery slurry. Agric.Wastes 3:311–322.
56. Zahn, J. A. 1997. Swine odor and emissions from pork production, p. 20–122.In K. McGuire (ed.), Environmental assurance program. National PorkProducers Council, Clive, Iowa.
57. Zahn, J. A., A. A. DiSpirito, Y. S. Do, B. E. Brooks, E. E. Copper, and J. L.Hatfield. 2001. Correlation of human olfactory responses to airborne con-centrations of malodorous volatile organic compounds emitted from swineeffluent. J. Environ. Qual. 30:624–634.
58. Zahn, J. A., J. L. Hatfield, Y. S. Do, A. A. DiSpirito, D. A. Laird, and R. L.Pfeiffer. 1997. Characterization of volatile organic emissions and wastes froma swine production facility. J. Environ. Qual. 26:1687–1696.
59. Zahn, J. A., J. L. Hatfield, D. A. Laird, T. T. Hart, Y. S. Do, and A. A.DiSpirito. 2001. Functional classification of swine manure management sys-tems based on effluent and gas emission characteristics. J. Environ. Qual.30:635–647.
60. Zheng, D., L. Raskin, E. W. Alm, and D. A. Stahl. 1996. Characterization ofuniversal small-subunit rRNA-targeted oligonucleotide hybridization probes.Appl. Environ. Microbiol. 62:4504–4513.
61. Zuber, H., and R. J. Cogdell. 1995. Structure and organization of purplebacterial antenna complexes, p. 315–348. In R. E. Blankenship, M. T. Ma-digan, and C. E. Bauer (ed.), Anoxygenic photosynthetic bacteria. KluwerAcademic Publishers, Dordrecht, The Netherlands.