August 26, 2010 12:6 Philosophical Magazine Letters hys˙PhilMagLett˙v09˙Revised Philosophical Magazine Letters Vol. 00, No. 00, January 2008, 1–11 Role of Surface Roughness in Hysteresis during Adhesive Elastic Contact Haneesh Kesari a , Joseph C. Doll a , Beth L. Pruitt a , Wei Cai a , and Adrian J. Lew a * a Department of Mechanical Engineering, Stanford University, Stanford, CA, 94305-4040 ( April 2010 ) In experiments that involve contact with adhesion between two surfaces, as found in atomic force microscopy or nanoindentation, two distinct contact force (P ) vs. indentation-depth (h) curves are often measured depending on whether the indenter moves towards or away from the sample. The origin of this hysteresis is not well understood and is often attributed to moisture, plasticity or viscoelasticity. Here we report experiments that show that hysteresis can exist in the absence of these effects, and that its magnitude depends on surface roughness. We develop a theoretical model in which the hysteresis appears as the result of a series of surface instabilities, in which the contact area grows or recedes by a finite amount. The model can be used to estimate material properties from contact experiments even when the measured P -h curves are not unique. Keywords: atomic force microscopy, nanoindentation, surface roughness, adhesion, contact mechanics. 1. Introduction Adhesive contacts play a central role in many biological phenomena and engineered systems, such as in cell adhesion [1] and microdevices [2]. In particular, character- ization of materials using contact experiments, such as Atomic Force Microscopy (AFM), requires an understanding of adhesive contacts [3–5]. During adhesive con- tact the measured contact force vs. indentation-depth (P -h) curves often display a clear and repeatable hysteresis loop [4, 6–9] (Fig. 1(a)). These curves have two branches, one measured as the indenter moves towards the sample, and another one as it moves away. The area inside the hysteresis loop (H) measures the energy loss during a cycle. In some adhesive contact experiments [such as, 4, 6–9, and this study], H depends on the maximum indentation-depth, |h min |. We refer to this behavior as depth-dependent hysteresis (DDH). DDH cannot be explained by classical contact theories [10–13], which predict a P -h curve with a single branch in the regime of h< 0. Fitting experimental data displaying DDH to these theories leads to different estimates for material proper- ties depending on which branch of the curve is used [8, 9, 14, 15]. The mechanism of DDH is not well understood, but it has been attributed to several factors, such as material damage (plasticity) [16], ambient moisture [6, 17], viscoelasticity [18], and chemistry related mechanisms [7–9, 19]. Here, we report experiments in which the observed DDH cannot be explained by these factors alone. Furthermore, the observed DDH is found to depend on surface roughness. Thus, we hypothesize that * Corresponding author. Email: [email protected], Ph: +1 (650) 725-3585, Fax: +1 ( 650) 723-1778 ISSN: 0950-0839 print/ISSN 1362-3036 online c 2008 Taylor & Francis DOI: 10.1080/0950083YYxxxxxxxx http://www.informaworld.com
Transcript
August 26, 2010 12:6 Philosophical Magazine Letters hys˙PhilMagLett˙v09˙Revised
Philosophical Magazine LettersVol. 00, No. 00, January 2008, 1–11
Role of Surface Roughness in Hysteresis during Adhesive Elastic
Contact
Haneesh Kesaria, Joseph C. Dolla, Beth L. Pruitta, Wei Caia, and Adrian J. Lewa ∗
aDepartment of Mechanical Engineering, Stanford University, Stanford, CA, 94305-4040
( April 2010 )
In experiments that involve contact with adhesion between two surfaces, as found in atomicforce microscopy or nanoindentation, two distinct contact force (P ) vs. indentation-depth (h)curves are often measured depending on whether the indenter moves towards or away fromthe sample. The origin of this hysteresis is not well understood and is often attributed tomoisture, plasticity or viscoelasticity. Here we report experiments that show that hysteresiscan exist in the absence of these effects, and that its magnitude depends on surface roughness.We develop a theoretical model in which the hysteresis appears as the result of a series ofsurface instabilities, in which the contact area grows or recedes by a finite amount. The modelcan be used to estimate material properties from contact experiments even when the measuredP -h curves are not unique.
Keywords: atomic force microscopy, nanoindentation, surface roughness, adhesion, contactmechanics.
1. Introduction
Adhesive contacts play a central role in many biological phenomena and engineeredsystems, such as in cell adhesion [1] and microdevices [2]. In particular, character-ization of materials using contact experiments, such as Atomic Force Microscopy(AFM), requires an understanding of adhesive contacts [3–5]. During adhesive con-tact the measured contact force vs. indentation-depth (P -h) curves often displaya clear and repeatable hysteresis loop [4, 6–9] (Fig. 1(a)). These curves have twobranches, one measured as the indenter moves towards the sample, and anotherone as it moves away. The area inside the hysteresis loop (H) measures the energyloss during a cycle. In some adhesive contact experiments [such as, 4, 6–9, and thisstudy], H depends on the maximum indentation-depth, |hmin|. We refer to thisbehavior as depth-dependent hysteresis (DDH).
DDH cannot be explained by classical contact theories [10–13], which predict aP -h curve with a single branch in the regime of h < 0. Fitting experimental datadisplaying DDH to these theories leads to different estimates for material proper-ties depending on which branch of the curve is used [8, 9, 14, 15]. The mechanismof DDH is not well understood, but it has been attributed to several factors, suchas material damage (plasticity) [16], ambient moisture [6, 17], viscoelasticity [18],and chemistry related mechanisms [7–9, 19]. Here, we report experiments in whichthe observed DDH cannot be explained by these factors alone. Furthermore, theobserved DDH is found to depend on surface roughness. Thus, we hypothesize that
August 26, 2010 12:6 Philosophical Magazine Letters hys˙PhilMagLett˙v09˙Revised
2 H. Kesari et al.
surface roughness coupled with adhesion can give rise to DDH. We also present amodel for adhesive elastic contact between rough surfaces whose predictions areconsistent with our experiments. Most notably, it predicts different P -h branchesduring loading and unloading. Therefore, our model enables the estimation of ma-terial properties by simultaneously fitting both branches of the experimental P -hcurves, instead of having to choose among the two. The fitting also provides certaininformation about surface roughness of the contacting surfaces.
2. Materials and Methods
2.1. Hysteresis measurements
To investigate the mechanism of DDH we measured P -h curves on four Poly-dimethylsiloxane (PDMS) samples having varying roughness using both AFM andnanoindentation apparatus. The AFM tip was a spherical glass bead and thenanoindentation tip was a flat face of a truncated diamond cube. Details of PDMSsample preparation, AFM, and nanoindentation experiments are given in the fol-lowing sections.
On each sample we measured P -h curves at five different sample spots thatwere separated from one another by at least 200µm. We brought the tip intocontact with each sample spot several times (≈ 20); each time starting from a tip-sample separation where P = 0. The tip base was moved towards the samples untilthe tip was pushed into the sample by a predetermined amount—the maximumindentation-depth (|hmin|)—and then moved away until P = 0 again. We countedeach time the tip is brought into contact with the sample as a contact cycle. Thespeed of the tip’s base (d) was kept constant during the measurements. As stated,at each sample location we performed several contact cycles with |hmin| rangingfrom 0 to 1500 nm. For each |hmin|, we calculated the energy loss H by computingthe area enclosed within the corresponding contact cycle’s P -h loop.
For a given |hmin|, the H for a sample is the average of the data taken at the fivelocations. The error bars for H are the standard deviation of the data taken overthe five locations.
We fabricated PDMS samples having varying roughness but identical mechanicalproperties and surface chemistry using a soft-lithography technique [20], where thesame PDMS solution (base:crosslinker= 10:1, Sylgard 184, Dow Corning, Midland,MI) was cast onto different silicon (Si) molds (University Wafer, South Boston,MA). The Si molds were roughened to varying extents by exposing them to reactiveions in a parallel plate plasma etcher (RIE-100, Drytek) for durations ranging from30 seconds to 6 minutes. The gas flow rates (SF6/O2 = 90/25 sccm), RF power(200 W), and pressure (70 mTorr) were held constant for all etches. The PDMSsolution was well mixed and deaerated in a centrifugal mixer (AR-100, Thinky,Tokyo, Japan) to obtain a uniformly mixed prepolymer solution. The Si moldswere vapor coated with a releasing agent (Chlorotrimethylsilane, Sigma-Aldrich, St.Louis, MO) before casting a 5-10 mm thick prepolymer solution onto them. Vacuumwas applied to the casts for 15 minutes before curing them at room temperature(≈ 20◦C) for 48 hours.
We measured the Si molds topography by scanning their surfaces using a sharpSi tipped AFM operated in tapping mode. We performed these measurementsover 4µm2 scan areas at three different locations on each sample. From these
August 26, 2010 12:6 Philosophical Magazine Letters hys˙PhilMagLett˙v09˙Revised
Philosophical Magazine Letters 3
measurements, we observed that the Si molds RMS (root mean square) roughnessvaried from 0.65 to 1.52 nm. The number of asperities, which we determined bycounting the points where the topography had a local maxima, were 213 ± 10,99 ± 8, 98 ± 8, and 75 ± 4 per square micron on the Si wafers exposed to 0 sec,30 sec, 3 min, and 6 min of reactive ion etching respectively.
Because of the large compliance of PDMS (Young’s modulus∼ 1 MPa), we couldnot measure the PDMS sample roughness directly using an AFM. However, thesoft-lithography technique we used [20] is known to replicate features down to2 nm [21]. Thus, in this work we assume that the RMS roughness of our PDMSsamples is proportional to that of their respective Si molds on which they werecast. Furthermore, since the different PDMS samples were cast from the sameprepolymer solution we expect that all samples have the same bulk mechanicalproperties and surface chemistry.
2.3. Atomic Force Microscope (AFM) Contact Experiments
Indentation with soda lime glass beads (Duke Scientific, Palo Alto, USA) was per-formed in air at room temperature using an AFM (alpha300A, Witec Instruments,Ulm, Germany) operated in the contact mode. The beads had a diameter of 50µm,and a RMS roughness of 6 nm. They were attached onto an AFM cantilever (ArrowNCR, Nanoworld, Neuchatel, Switzerland) using epoxy resin. The spring constantof the cantilever was estimated to be 30 ± 6 N/m by measuring the resonant fre-quency, for details see [22].
Underwater measurements were performed by placing the samples in a containerfilled with deionized water. At the beginning of the experiment the AFM tip waslowered into the container such that it was completely under water .
2.4. Nanoindentation experiments
To estimate the viscoelasticity of our PDMS samples we also measured P -h curveson all our PDMS samples using a flat faced diamond tip. These measurementswere performed using a nanoindentation apparatus (Hysitron, Minneapolis, USA).The tip is a corner of a diamond cube whose apex has been flattened. The RMSroughness of the diamond tip measured through imprints on a gold surfaces was< 1 nm. The flat contacting face is an equilateral triangle with sides 10.5µm longand an area of 47µm2. The machine was operated in displacement control mode.
3. Results & Discussion
3.1. AFM Experiments
Fig. 1 (a) shows the P -h curves using an AFM during glass-PDMS contact at theloading rate d = 10 nm · s−1. Two distinct P -h branches are found for the loadingand unloading stages. Fig. 1(b) shows that the energy loss H of a contact cycleincreases with |hmin|, which is a signature of depth-dependent hysteresis (DDH).Fig. 1 (c) and (d) show that similar behavior is also observed at a faster loading rateof d = 1000 nm · s−1. For a given maximum indentation depth |hmin|, the energyloss is larger at the higher loading rate. This rate dependence will be discussedfurther in Sec. 3.2.
At the higher loading rate of d = 1000 nm · s−1, we measured the energy loss asa function of |hmin| on PDMS samples with different surface roughness but similarbulk properties and surface chemistry (see Sec 2.2). We chose to use the higher
August 26, 2010 12:6 Philosophical Magazine Letters hys˙PhilMagLett˙v09˙Revised
4 H. Kesari et al.
loading rate in order to expedite the experiments and reduce any instrumentationdrift errors in our measurements. Fig. 1 (d) shows that for a given maximumindentation depth,H increases as the sample RMS roughness grows from 0.65 nm to1.31 nm, but then decreases as RMS roughness increases further to 1.52 nm. Thesedata are also plotted in Fig. 2 (a) with RMS roughness as the x-axis. This behaviorof initial increase and then decrease of H with RMS roughness was observed usingtwo different sets of PDMS samples, AFM cantilevers, and glass beads on twodifferent days. The two sets of PDMS samples were prepared using the same set ofSi molds.
Ambient moisture can cause DDH because condensation of a liquid meniscus atthe contact periphery is known to change the contact forces [23, pp. 880]. To testthis possibility, we performed glass bead-PDMS contact experiments under water,where no meniscus can form. Fig. 1(e) and (f) show that DDH still appears inthis experiment. We estimated the contributions to DDH from water’s viscosity tobe negligible (∼ attojoules) for the loading rates used in our experiments. This isconfirmed by the flat region of the P -h curve in Fig. 1(e) at h > 0, which indicatesthat no appreciable force was measured while the cantilever moves in water be-fore touching the sample. Hence, we expect the same mechanisms causing DDH inthe in-air experiments are responsible for DDH in the under water experiments aswell. In addition, moisture contribution in our in-air AFM experiments, shown inFig. 1(a-d), should be negligible since PDMS is known to be hydrophobic [24], andthese experiments were performed at conditions (relative humidity 34% , temper-ature 23◦C) at which moisture condensation is estimated to be negligible. Hence,we can rule out the possibility of moisture as the main cause of DDH in the exper-iments shown in Fig. 1.
To test the possibility that the observed DDH may be instrumentation artifacts,we performed glass-on-glass indentation experiments both before and after the in-air and under water glass-PDMS experiments. No sign of DDH was observed in theglass-on-glass experiments, which rules out instrumentation artifacts as a cause ofthe observed DDH. Furthermore, successive P -h loops measured while indentingthe same sample spot to the same |hmin| always overlapped. We therefore excludematerial damage as a plausible cause of DDH in our experiments.
3.2. Nanoindentation Experiments
Viscoelasticity of the sample can cause DDH [25]. To test this possibility, we in-dented our PDMS samples with a flat tip so that the contact area remained constantduring the experiment. Flat faced tips are not standard for an AFM apparatus.However, a nanoindentation (NI) apparatus (see Sec. 2.4) with flat faced diamondtips was readily available. Although the glass-PDMS adhesion energy is differentfrom that of diamond-PDMS 1, when the contact area remains constant the ad-hesion energy should not affect the contact forces.
The maximum-indentation depth, indentation rates and size of contact region inthe NI experiments were chosen such that bulk deformation and deformation ratesin the NI and AFM experiments were comparable. The |hmin| in both the AFMand the NI experiments lay in the range of ∼ 250-1500 nm. The contact area inthe NI experiments remained constant at 47µm2, while that in the AFM experi-ments varied from 10 to 230µm2 as h went from 0 to 1000 nm. The loading rates,
1 In this work we estimate glass-PDMS adhesion energy to be 26 mJ/m2 (sec. 3.4). Cao et. al. report thediamond-PDMS adhesion energy to be 227 mJ/m2. However, from other sources the glass-PDMS adhesionenergy is seen to lie in the range 12–150 mJ/m2 [6, 26], and the diamond-PDMS adhesion energy is seento lie in the range 20–500 mJ/m2 [27–29].
August 26, 2010 12:6 Philosophical Magazine Letters hys˙PhilMagLett˙v09˙Revised
Philosophical Magazine Letters 5
d, in both AFM and NI experiments were varied in the range 10-1000 nm · s−1.Note however that the base-tip stiffness in the NI experiments is effectively infinitecompared to the stiffness of the AFM cantilever. Thus, the deformation rates inthe NI experiments are expected to be somewhat larger than those in the AFMexperiments for the same d.
At the loading rate d = 10 nm · s−1, the P -h measurements from our nanoinden-tation experiments did not display any appreciable hysteresis, with H < 0.03 pJ.At the higher loading rate of d = 1000 nm · s−1, hysteresis was observed and wasfound to increase with the maximum indentation depth |hmin|. However, this depth-dependent hysteresis (DDH) was insensitive to the sample roughness, as shown inFig. 2 (b). The NI P -h measurements were quite repeatable, i.e., repeatedly in-denting a sample spot to the same |hmin| gave indistinguishable P -h curves. Thus,material damage can be ruled out as playing any role in these experiments. In ad-dition, before indenting PDMS, indenting polycarbonate samples using the sameNI apparatus showed no hysteresis at all. This shows that the NI apparatus didnot have any intrinsic hysteresis associated with it. Thus, the DDH seen in the NIexperiments is likely due to the viscoelasticity of the PDMS samples.
Since the NI experiments at d = 10 nm · s−1 showed negligible viscoelasticityeffect, the DDH seen in the AFM experiments at the same low loading rate cannotbe explained by viscoelasticity. The NI experiments at d = 1000 nm · s−1 implythat some fraction of the DDH seen in the AFM experiments at this rate is due toPDMS’ viscoelasticity. However, since DDH in the NI experiments did not dependon the sample’s roughness, a fraction of the DDH seen in the AFM experiments atd = 1000 nm · s−1, specifically, the amount that varies with roughness, cannot beexplained solely by PDMS’ viscoelasticity.
Therefore, our study shows that there is an additional, yet unaccounted, source ofDDH in our AFM experiments. Because the primary difference between the AFMand NI experiments is whether the contact area changes or remains fixed, this un-accounted source of DDH suggests a surface-related mechanism that operates whenthe contact area changes. This hypothesis is reinforced from the observation thatH in the AFM experiments initially increases and then decreases with the sample’sroughness. In the next section, we explore this hypothesis in depth by developingan analytic model of adhesive contact that accounts for surface roughness.
3.3. Theory: A Model for Adhesive Elastic Contact between Rough Surfaces
The correlation between DDH and surface roughness suggests that DDH may beexplained in terms of surface roughness, in the absence of all the other aforemen-tioned factors such as moisture, plasticity, viscoelasticity, etc. In the following wedevelop such a theory, and answer the following two questions. First, how canroughness cause DDH? Second, why does the energy loss first increase and thendecrease with increasing RMS roughness?
To some extent, the effect of roughness on DDH is surprising, since the RMSroughness of the surfaces of the samples and the indenter (a few nm) is significantlysmaller than the radius of the contact region in our experiments (2 to 8.5µm). Inmany situations the effect of such small surface perturbations on H are negligible,such as in the NI experiments in Fig. 2(b) (see also [30]). As we discuss next,however, surface roughness can change how the contact area evolves with h, andhence exert a dramatic influence on H as shown in Fig. 2(a).
During a slow loading (unloading) process, the contact area grows (decreases)in a way that is always in equilibrium: changes in elastic and interfacial energiesinduced by small variations of the contact area exactly balance. When the surfaces
August 26, 2010 12:6 Philosophical Magazine Letters hys˙PhilMagLett˙v09˙Revised
6 H. Kesari et al.
are perfectly smooth, only one equilibrium contact area exists for each h. However,multiple equilibria can exist if the surfaces are rough. Among these equilibria, thosewith smaller contact areas are probed while loading, while equilibria with largercontact areas are explored during unloading. This leads to two different P -h curvesfor the loading and unloading phases, and is sufficient to cause DDH.
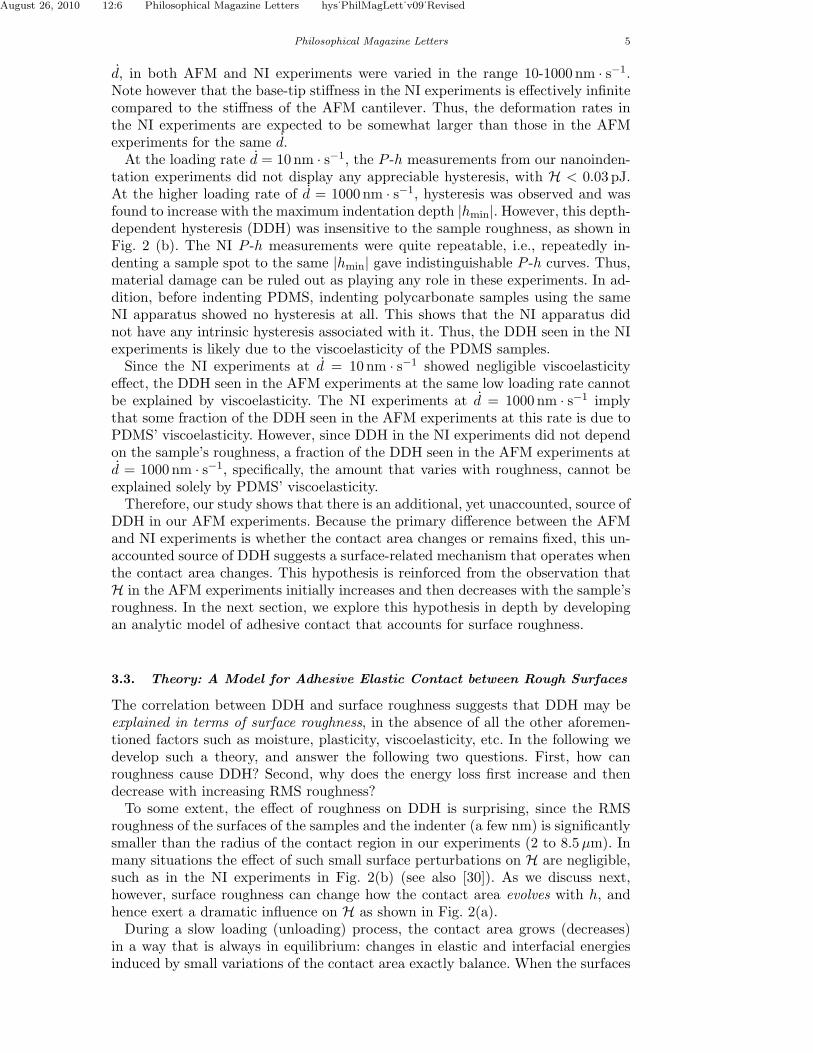
To quantify the magnitude of the energy loss due to roughness, we considerthe contact between a rigid spherical indenter with radius R and a wavy samplesurface with wave length λ and amplitude 2A (Fig. 3(c)). The RMS roughness ofthis model surface is proportional to A. In the following we find that, as A grows,H increases when A is small, and decreases when A is large, in agreement with ourexperimental observations.
We first assume that A is small enough such that the contact area between thetwo bodies is simply connected, i.e, within the contact area the surfaces adhereuniformly leaving no gaps (small roughness in Fig. 2 (a)). When the surface shapeof the sample is an axi-symmetric sinusoid, the equilibrium P–h curve has beenanalytically derived in [31], Eqs. (2), (3), in [14].
Examples of this equilibrium P–h curve are shown in Fig. 3 (a), (b), as solid graycurves. The equilibrium P–h curve has oscillations, or folds, owing to the sinusoidaltopography of the surfaces. In some cases (such as those shown in Fig. 3) theoscillations can be so pronounced that multiple values of P appear for each h, eachone the consequence of a different equilibrium contact area. This phenoemenon hasbeen discussed in [31], and explored experimentally at the macroscale (∼ 10−2 m)in [14].
We construct a model for roughness by first deriving asymptotic forms for Eqs.(2), (3), of [14] and then using them to derive the equations for the measured P–hcurve. Specifically, as we will show elsewhere, when λ/R � 1 and A/λ ∼ O(1),the P (h) curve is multiply valued. Consequently, the P–h curve measured in anexperiment does not follow the folds of the equilibrium P–h curve, but depends onthe loading history (e.g., the thin solid red curve in Fig .3 (a)). As λ/R decreases,the folds in Fig. 3 (a) get tighter, see Fig. 3 (b). Under these conditions, an ex-perimentally measured P–h loop will essentially follow the envelope of the foldedanalytic curve, given by 1,
P (a) =4E∗
3Ra3 −
√8πγE∗a
32 ± 2πE∗
A
λ1/2a
32 , (1a)
h(a) =1Ra2 −
√2πγE∗
a12 ± π A
λ1/2a
12 . (1b)
This envelope is parameterized by the radius a of the contact area. The shape of theenvelope depends on the adhesion energy between the bodies γ and the plain-strainYoung’s modulus E∗. The + and − signs corresponds to the loading and unloadingphases of the experiment, respectively. When unloading begins, the experiment willinitially sample a leg of the very last fold, which for λ � R becomes a straightline. An example of the envelope curve is shown in Fig. 3(b) (solid blue curve).
Notice that when A = 0, the loading and unloading branches in (1a) and (1b)collapse to a single curve, the equilibrium P–h curve given by the JKR contact
1The derivation of eqs. (1a) and (1b) requires considerable space to be properly explained, so it willbe published separately. Briefly, however, when λ/R � 1 and A/λ ∼ O(1), the equilibrium P–h curvegiven by Eqs. (2), (3) in [14], which are parametric equations of the form P (a), h(a), reduces to a formwhich contains terms given by the JKR contact theory and additional oscillatory terms arising due to thesinusoidal topography. We derive the equation for the envelope by replacing the oscillatory terms withtheir respective maximum and minimum values.
August 26, 2010 12:6 Philosophical Magazine Letters hys˙PhilMagLett˙v09˙Revised
Philosophical Magazine Letters 7
theory [10]. The JKR theory also considers adhesive contact between a paraboloidand a half-space, but ignores the roughness of the surfaces. Similarly, when both Aand γ are set to 0, Eqs. (1a) and (1b) reduce to the equilibrium P–h curve givenby Hertz contact theory [11], which ignores both adhesion and roughness.
3.4. Comparing Theory with AFM experiments
A comparison of the experimental results with a fitting to Eqs. (1a) and (1b)is shown as dashed lines in Fig. 1(a). For the fitting we used E∗ for PDMS as0.75 MPa, γ for glass-PDMS contact as 2.6 × 10⁻² J and A/
√λ = 9 × 10⁻⁶√m.
These values for E∗ and γ are very close to the reported values [5, 6, 32, 33] for thesame composition of PDMS and glass used in this work (Sec. 2.2). Additionally,the value of A/
√λ is commensurate with AFM scans of the glass bead, and the
Si mold surfaces, which revealed a combined RMS-roughness of the bead and thesamples of ∼ 10 nm (A) and feature sizes smaller than 1000 nm (λ).
It follows from Eqs. (1a) and (1b) that H scales as (γE∗/λ)1/2RA |hmin|. Thismeans that in the small roughness limit H increases with the roughness A, max-imum indentation depth |hmin|, and adhesion energy γ, all consistent with ourexperiments. First, Fig. 2(a) shows that H initially increases with RMS roughness.This finding contrasts the traditional viewpoint in which the pull-off adhesion forcedecreases with roughness [15]. It may also explain why rolling friction initially in-creases with roughness, as found by Briggs and Briscoe [34], and first noted in [31].Second, Fig. 1(b), (d), and (f) show that H increases linearly with |hmin| as pre-dicted by our model. Finally, Fig. 1(c) and (e) show that contact forces under waterare larger compared to in air, indicating that the glass-PDMS adhesion energy γis lower under water1. Based on this, our model would predict that the energy lossH is also lower under water than in air, which is consistent with Fig. 1(d) and (f).
We should not expect H to always increase with A, since for A large enough thecontact region ceases to be simply connected. The transition from a simply to amultiply connected contact region for a simpler geometry is known to depend on theparameter α =
√π2A2E∗/2λγ [30], with the contact region being simply connected
for α < 1 and multiply connected otherwise. Based on our fitted parameters, wefind α ≈ 0.1. Therefore, it is reasonable to speculate that the change in trend inDDH at the largest roughness shown in Fig. 2(a) is due to a transition from onlya few to many patches out of contact within the apparent contact region.
For A large enough, the two bodies are actually in contact only in small patcheswithin the contact region (large roughness in Fig. 2(a)), and the elastic interac-tions among them are negligible. Each patch then attaches/detaches through pull-in/pull-out instabilities, as predicted by classical contact mechanics theories [10].The value of H in this case is determined by the amount of energy lost at eachcontact patch, times the number of patches. For a sample surface shaped as a sinu-soidal egg box, H scales as2 (λ/E∗)2/3 γ5/3RA−4/3 |hmin|. This predicts that H isof the order of pJ, that it should decrease with A, and that it scales linearly with|hmin|, all consistent with our experiments.
1Reduced adhesion under water has also been observed between mica surfaces [35].2The derivation of this expression will be published elsewhere.
August 26, 2010 12:6 Philosophical Magazine Letters hys˙PhilMagLett˙v09˙Revised
8 REFERENCES
4. Conclusions
Our experiments and theoretical model suggest that in some experiments surfaceroughness alone coupled with adhesion can give rise to depth dependent hysteresis.A limitation of our work is that we did not have precise control of surface roughnesswhich we could vary only in an average way. For this reason we could not directlymeasure an effective A or λ for our surfaces. This is important, since it seemsunlikely that a single parameter, in this case the RMS roughness, would suffice tocompletely capture surface topography’s effect on the mechanics of contact. Thus,a useful direction to pursue would be to make samples with tailored topographiesand then study the effect of surface topography on contact phenomenon in moredetail. Nonetheless, the current study clearly demonstrates that surface topographycan give rise to depth dependent hysteresis during contact. Our study demonstratesthat when there is evidence to suggest that surface roughness is responsible for theobserved DDH, then materials properties, such as E∗ and γ, can be estimated bysimultaneously using both branches of the P -h curve. It is somewhat surprisingthat while the sample surfaces likely have complicated surface topographies, the fitto Eqs. (1a) and (1b), which are derived by assuming a sinusoidal surface shape,produces values for the mechanical properties that are in the range of expectedvalues. These results are encouraging, but further exploration and validation areneeded to test the robustness of this procedure to extract mechanical propertiesfrom AFM experiments. Our findings also demonstrate the possibility of extractinginformation about surface roughness at the nanoscale (the value of A/
√λ) even
from experiments employing micrometer-sized AFM probes.
Acknowledgements
This work is partly supported by the Center for Probing the Nanoscale (CPN), anNSF NSEC, NSF Grant No. PHY-0425897, by the NSF Career programs CMS-0547681, ECS-0449400 and CMMI-0747089, NIH R01-EB006745, and by the NSFaward CNS-0619926 for computer resources. J.C.D. is supported in part by NSFand NDSEG Graduate Research Fellowships. H. K. is supported by the HerbertKunzel Stanford Graduate Fellowship and he thanks Dr. Bjorn Backes for helpingperform the nanoindentation experiments.
References
[1] Y. Chu et al., Johnson-Kendall-Roberts theory applied to living cells, Physical review letters 94(2)(2005), p. 28102. 1
[2] F. DelRio et al., The role of van der Waals forces in adhesion of micromachined surfaces, NatureMaterials 4 (2005), pp. 629–634. 1
[3] E. Dimitriadis et al., Determination of elastic moduli of thin layers of soft material using the atomicforce microscope, Biophysical Journal 82(5) (2002), pp. 2798–2810. 1
[4] O. Sahin et al., An atomic force microscope tip designed to measure time-varying nanomechanicalforces, Nature 2 (2007), pp. 507–514. 1
[5] S. Park, M. Goodman, and B. Pruitt, Analysis of nematode mechanics by piezoresistive displacementclamp, Proceedings of the National Academy of Sciences 104(44) (2007), pp. 17376–17381. 1, 3.4
[6] J. Pickering, D. Van Der Meer, and G. Vancso, Effects of contact time, humidity, and surface rough-ness on the adhesion hysteresis of polydimethylsiloxane, Journal of Adhesion Science and Technology15(12) (2001), pp. 1429–1441. 1, 1, 3.4
[7] N. Maeda et al., Adhesion and Friction Mechanisms of Polymer-on-Polymer Surfaces, Science297(5580) (2002), pp. 379–382. 1
[8] Y. Chen, C. Helm, and J. Israelachvili, Molecular Mechanisms Associated with Adhesion and ContactAngle Hysteresis of Monolayer Surfaces, Journal of Physical Chemistry 95 (1991), pp. 10736–10746.1
[9] G. Choi, S. Kim, and A. Ulman, Adhesion Hysteresis Studies of Extracted Poly(dimethylsiloxane)Using Contact Mechanics, Languir 13 (1997), pp. 6333–6338. 1
August 26, 2010 12:6 Philosophical Magazine Letters hys˙PhilMagLett˙v09˙Revised
REFERENCES 9
[10] K.L. Johnson, K. Kendall, and A.D. Roberts, Surface Energy and the Contact of Elastic Solids,Proceedings of the Royal Society of London. Series A, Mathematical and Physical Sciences 324(1558)(1971), pp. 301–313. 1, 3.3, 3.4, 3
[11] H. Hertz, On the Contact of Elastic Solids, J. Reine Angew. Math. 92 (1881), pp. 156–171. 3.3[12] B.V. Derjaguin, V.M. Muller, and Y.P. Toporov, Effect of Contact Deformations on the Adhesion of
Particles, Journal of Colloid and Interface Science 53(2) (1975), pp. 314–326.[13] D. Maugis Contact Adhesion and Rupture of Elastic Solids, Solid State Sciences Springer, 2000. 1[14] P. Guduru and C. Bull, Detachment of a rigid solid from an elastic wavy surface: Experiments,
Journal of the Mechanics and Physics of Solids 55(3) (2007), pp. 473–488. 1, 3.3, 1[15] B. Zappone, K. Rosenberg, and J. Israelachvili, Role of nanometer roughness on the adhesion and
friction of a rough polymer surface and a molecularly smooth mica surface, Tribology Letters 26(3)(2007), pp. 191–201. 1, 3.4
[16] W. Oliver and G. Pharr, Improved technique for determining hardness and elastic modulus usingload and displacement sensing indentation experiments, Journal of Materials Research 7(6) (1992),pp. 1564–1583. 1
[17] J. Grobelny et al., Quantification of the meniscus effect in adhesion force measurements, AppliedPhysics Letters 88 (2006), p. 091906. 1
[18] M. Giri, D. Bousfield, and W. Unertl, Dynamic contacts on viscoelastic films: work of adhesion,Langmuir 17(10) (2001), pp. 2973–2981. 1
[19] H. She, D. Malotky, and M. Chaudhury, Estimation of Adhesion Hysteresis at Polymer/Oxide Inter-faces Using Rolling Contact Mechanics, Langmuir 14(11) (1998), pp. 3090–3100. 1
[20] Y. Xia and G. Whitesides, Soft lithography, Annual Review of Materials Science 28(1) (1998), pp.153–184. 2.2
[21] F. Hua et al., Polymer imprint lithography with molecular-scale resolution, Nano Lett 4(12) (2004),pp. 2467–2471. 2.2
[22] N. Burnham et al., Comparison of calibration methods for atomic-force microscopy cantilevers, Nan-otechnology 14(1) (2003), pp. 1–6. 2.3
[23] B. Bhushan Springer handbook of nanotechnology, Springer, 2006. 3.1[24] J. McDonald et al., Fabrication of microfluidic systems in poly (dimethylsiloxane), Electrophoresis
21(1) (1999), pp. 27–40. 3.1[25] Y.Y. Lin and C.Y. Hui, Mechanics of Contact and Adhesion between Viscoelastic Spheres: An Analy-
sis of Hysteresis during Loading and Unloading, Journal of Polymer Science: Part B: Polymer Physics40 (2002), pp. 772–793. 3.2
[26] A. Sofla et al., PDMS-Glass Interface Adhesion Energy Determined Via Comprehensive Solutionsfor Thin Film Bulge/Blister Tests, Journal of Applied Mechanics 77 (2010), p. 031007. 1
[27] C. Buchko et al., Mechanical properties of biocompatible protein polymer thin films, J. Mater. Res15(1) (2000), p. 231. 1
[28] L. Bes et al., Poly (methylmethacrylate-dimethylsiloxane) triblock copolymers synthesized by transi-tion metal mediated living radical polymerization: bulk and surface characterization, European Poly-mer Journal 39(1) (2003), pp. 5–13.
[29] A. Bietsch and B. Michel, Conformal contact and pattern stability of stamps used for soft lithography,Journal of Applied Physics 88 (2000), p. 4310. 1
[30] K. Johnson, The adhesion of two elastic bodies with slightly wavy surfaces, International Journal ofSolids and Structures 32(3) (1995), pp. 423–430. 3.3, 3.4
[31] P. Guduru, Detachment of a rigid solid from an elastic wavy surface: Theory, Journal of the Mechanicsand Physics of Solids 55(3) (2007), pp. 445–472. 3.3, 3.4
[32] F. Schneider et al., Mechanical properties of silicones for MEMS, Journal of Micromechanics andMicroengineering 18(6) (2008), p. 065008. 3.4
[33] X. Brown, K. Ookawa, and J. Wong, Evaluation of polydimethylsiloxane scaffolds with physiologically-relevant elastic moduli: interplay of substrate mechanics and surface chemistry effects on vascularsmooth muscle cell response, Biomaterials 26(16) (2005), pp. 3123–3129. 3.4
[34] G. Briggs and B. Briscoe, Effect of surface roughness on rolling friction and adhesion between elasticsolids, Nature 260(5549) (1976), pp. 313–315. 3.4
[35] H. Christenson, Adhesion and surface energy of mica in air and water, The Journal of PhysicalChemistry 97(46) (1993), pp. 12034–12041. 1
Figure captions
August 26, 2010 12:6 Philosophical Magazine Letters hys˙PhilMagLett˙v09˙Revised
10 REFERENCES
Figure 1. caption
(a) AFM contact force (P ) as a function of indentation-depth (h) during glass-PDMS contact in air at an indenting rate of d = 10 nm · s−1. The PDMS sample wascast on a Si wafer with an RMS roughness of 1.31 nm. The dashed lines in (a) arethe P -h curves predicted by Eqs. (1a) and (1b). (b) The energy loss H as a functionof the maximum indentation-depth |hmin| obtained from the P -h curves shown in(a). (c) AFM P -h curve during glass-PDMS contact in air at d = 1000 nm · s−1.The PDMS sample was cast on a Si wafer with an RMS roughness of 0.65 nm. (d)The energy lossH as a function of |hmin| for indentation conditions similar to (c) onseveral PDMS samples cast on Si wafers with different RMS roughness (indicatednext to each curve). Each curve corresponds to a different PDMS sample and wascomputed from measurements at five different locations on the sample. The shadedregion around each curve indicates the standard deviation of the measurementstaken at five locations on the PDMS samples. At each location H was measuredfor ≈ 20 different |hmin|, for additional details see 2.1. (e) AFM P -h curve duringglass-PDMS contact under water at d = 1000 nm · s−1. The PDMS sample wascast on a Si wafer with an RMS roughness of 0.65 nm. (f) The energy loss H as afunction of |hmin| obtained from (e).
Figure 2. caption
Energy loss H on different PDMS samples vs. the Si mold roughness on which thePDMS samples were cast, measured using (a) AFM and (b) Nanoindentation ap-paratus. The different curves correspond to different maximum indentation depths(|hmin|). For each |hmin|, the H for a sample is the average of the data taken overfive different locations separated by at least 200µm. The error bars for H are thestandard deviation of the data taken over the five locations. The error bars in (b)are not clearly visible as there are quite small (∼ 10−2 pJ). The loading rate d forboth (a) and (b) was 1000 nm · s−1. The insets in (a) show the qualitative natureof the contact region hypothesized in this work, in the small, and large roughnesslimits.
Figure 3. caption
(a) P -h curves predicted by a smooth-surface contact model [10] (dashed curve)and by the small roughness contact model studied in this paper (thick solid curve).Both curves are parameterized by the radius of the contact area. In an experimentin which h is prescribed, sudden changes in the contact area occur at the tip ofevery fold, such as from d to e. As a result, an experiment will measure only partsof its envelope (thin solid curve). (b) When the roughness length scale (λ) is muchsmaller than the radius of the indenter (R) the folds in the P -h curve are so closetogether that the envelope of the P -h curve can be described by Eqs. (1a) and (1b)(thick solid curve). (c)-(f) Contact shapes at different stages of loading/unloadingmarked in (a).


![Size and temperature effects on the fracture mechanisms of …micro.stanford.edu/~caiwei/papers/Kang10ijp-NWBDT-final.pdf · 2013. 3. 22. · fracture of [110]-oriented Si NWs at](https://static.documents.pub/doc/80x56/611ef295eef0ac1c72716444/size-and-temperature-effects-on-the-fracture-mechanisms-of-micro-caiweipaperskang10ijp-nwbdt-finalpdf.jpg)


