29
Role of the Customer in Energy Efficiency and Conservation Lisa Wood Montana’s Energy Future Helena, Montana January 7-8, 2011

Role of the Customer in Energy Efficiency and
Conservation
Lisa Wood
Montana’s Energy Future
Helena, Montana
January 7-8, 2011

Today’s breakfast talking points
What’s achievable with energy efficiency and
demand response?
– EE potential estimates
– DR potential estimates
What about low income customers?
Engaging the customer – what’s new?
Are we on cusp of the 2nd electric revolution?
2
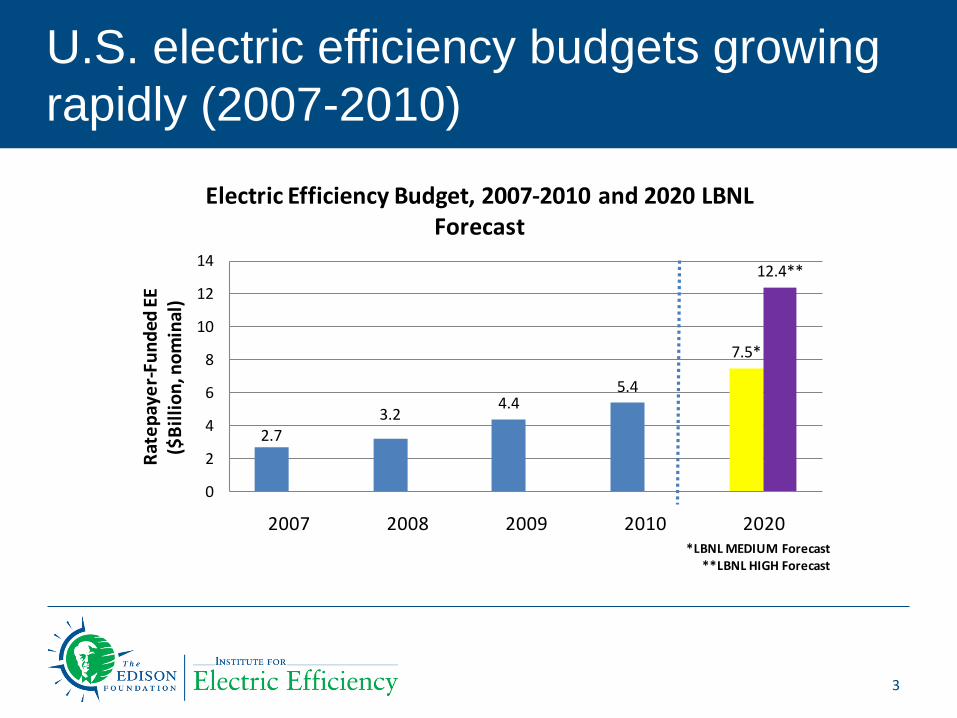
U.S. electric efficiency budgets growing
rapidly (2007-2010)
3
2.73.2
4.45.4
7.5*
12.4**
0
2
4
6
8
10
12
14
2007 2008 2009 2010 2020
Rat
ep
aye
r-Fu
nd
ed E
E($
Bil
lio
n, n
om
inal
)
*LBNL MEDIUM Forecast **LBNL HIGH Forecast
Electric Efficiency Budget, 2007-2010 and 2020 LBNL Forecast

Utilities play major role in ratepayer-funded
electric efficiency budgets in U.S.
4
Utility Non-Utility
Utility
Share of
Total
Percent
Increase
2007 $2,722,788,884 $2,413,639,443 $309,149,441 89%
2008 $3,165,329,920 $2,704,072,429 $461,257,491 85% 16%
2009 $4,370,445,097 $3,796,110,308 $574,334,789 87% 38%
2010 $5,433,087,642 $4,789,681,107 $643,406,535 88% 24%
Electric Efficiency 2007-2010 U.S. Budgets
Total
Source: IEE Brief. Summary of ratepayer-funded electric
efficiency impacts, expenditures, and budgets. January 2011.

U.S. electric efficiency savings projected to
exceed 100 TWh in 2010
5
69.2
85.3 92.6 100+*
0
20
40
60
80
100
120
2007 2008 2009 2010
TWh
* IEE Projection
U.S. Electric Efficiency Impacts (2007-2009 & 2010 Forecast)
Source: IEE Brief. Summary of ratepayer-funded electric
efficiency impacts, expenditures, and budgets. January 2011.

6
Energy efficiency
potential – programs
plus codes & standards

Energy efficiency savings growing rapidly but
significant potential for much more savings
7
85 TWh
represented
about 2% of
total usage in
2008.
293
CEE(Actual
Achieved)
85.3
372
1080
0
200
400
600
800
1000
1200
2008 2020
Ene
rgy
Effi
cie
ncy
Sav
ings
TWh
IEE (Codes and Standards Aggressive) - 2009EPRI (Maximum Achievable) - 2009McKinsey - 2009

How much EE can we expect by 2020?
Energy efficiency potential forecasts cover wide range – exact
number doesn’t really matter because there is so much left to do!
– EPRI predicts 372 TWh (maximum achievable potential) by 2020 (Jan. 2009)
– McKinsey: predicts 1,080 TWh “saved” by 2020 (July 2009)
In 2008, electric efficiency programs saved 85.3 billion kWh (CEE)
– Enough to power 7.4 million homes for one year
– 58 million metric tons of CO2 avoided
In 2009, electric efficiency programs save 92.6 billion kWh (CEE)
– Enough to power 8 million homes for one year
– 66 million tons of CO2 avoided
Plus – the potential savings due to codes and standards is huge
and very cost effective!
8
9
A few words on
demand response

Utility scale smart meter deployments, plans, and proposals –
about 65 million meters will be deployed (50% of US
households over next 5-7 years). Will this drive retail DR?
10
*This map represents smart meter deployments, planned deployments, and proposals by investor-
owned utilities and large public power utilities.
Deployment for
>50% of end-users
Deployment for
<50% of end-users
IEE: September 2010 update

Potential peak demand reduction due to demand
response – wide range of estimates. Expanded BAU
and MAP realistic in my view!
11
Baseline Forecast (NERC): 950 GW by 2019Baseline Forecast: 964 GW by 2020
(951 GW by 2019)
0
20
40
60
80
100
120
140
160
180
200
BAU Expanded BAU
Achievable Potential
Full Participation
38
82
138
188
GW
Sa
ve
d
FERC (June 2009): Peak Demand Savings due to Demand Response
0
20
40
60
80
100
120
140
160
180
200
RAP MAP Technical Potential
44
66
163
GW
Sa
ve
d
EPRI (January 2009): Summer Peak Demand Savings due to Demand Response
(4%) (9%) (14%) (20%) (4.6%) (6.8%) (16.9%)

Portfolio of DR sources for peak demand
savings
12
- 5,000 10,000 15,000 20,000 25,000
DLC-Cooling
Direct Control-Lighting
DLC-Other
Interruptible Demand
Price-Response
DLC-Process
Interruptible Demand
Price-Response
DLC-Central AC
DLC-Water Heating
Price-Response
Cumulative Summer Peak Demand Savings (MW)
2030
2020
2010
Co
mm
erc
ial
Ind
us
tria
l R
es
ide
nti
al
Source: EPRI Report #1016987. January 2009

We know customers respond to prices;
response even greater with technology
13
0%
10%
20%
30%
40%
50%
60%
1 2 3 4 5 6 7 8 9
10
11
12
13
14
15
16
17
18
19
20
21
22
23
24
25
26
27
28
29
30
31
32
33
34
35
36
37
38
39
40
41
42
43
44
45
46
47
48
49
50
51
52
53
54
55
56
57
58
59
60
61
62
63
64
65
66
67
68
69
70
Pricing Pilot
% R
ed
ucti
on
in
Pea
k L
oa
d
TOU TOU w/
TechPTR CPP CPP w/
Tech
RTP
RTP
w/
Tech
PTR
w/
Tech
Source: Ahmad Faruqui, Brattle.

Historical vs. projected U.S. summer peak load
reduction (GW) due to energy efficiency and demand
response (EIA and EPRI Report #1016987)
14
0
20
40
60
80
100
120
140
160
2007 2020 2030
30 GW
79 GW
157 GW
GW
Total U.S. Summer Peak Load Reduction due to EE and DRSources: EIA Form 861, EPRI, "Assessment of Achievable Potential from EE and DR Programs in
the U.S." (2009)
Actual Realistically Achievable Potential (EPRI, 2009)
Source: EPRI Report #1016987. January 2009

EPRI: EE and DR programs together can reduce 8% (RAP) to
15% (MAP) U.S. summer peak demand in 2020
15
2010
2020
2030
0%
2%
4%
6%
8%
10%
12%
14%
16%
18%
20%
Maximum Achievable Potential Realistic Achievable
Potential
4.9%
2.2%
15.3%
8.2%
19.5%
14.0%
Pe
rce
nt o
f S
um
me
r P
ea
k D
em
an
d
Split 7% from
DR and 7%
from EE
Source: EPRI Report #1016987. January 2009

16
What about impact on
low income customers?

Low income customers and dynamic pricing –
Two viewpoints
Low income customers have flatter load shapes than
average residential customers so would immediately
benefit from dynamic pricing.
Low income customers use less energy and therefore
have limited ability to shift load from peak to off peak
hours so would be harmed from dynamic pricing.
Empirical evidence from five studies shows the following:
– Many low income customers can benefit from dynamic prices
even without shifting load
– Low income customers do shift their energy usage in response
to price signals
17
Source: IEE Whitepaper, “The Impact of Dynamic
Pricing on Low Income Customers, September 2010
www.edisonfoundation.net/IEE

Low income customers benefit from smart
prices even without shifting load
18
51%
61%65%
79%
0%
10%
20%
30%
40%
50%
60%
70%
80%
90%
CPP Rate Design #1 CPP Rate Design #2
Per
cen
t o
f C
ust
om
ers
in S
am
ple
Percent of Sample with Immediate Bill Decreases on CPP Rates
(Even with No Load Shifting – i.e., No Demand Response)
Residential Low Income
Source: IEE Whitepaper, “The Impact of Dynamic
Pricing on Low Income Customers, September 2010
www.edisonfoundation.net/IEE

Low income customers do respond to smart prices –
the same as or less than other customers
19
Note: For the PepcoDC pilot, the average residential response excludes
low income customers that qualify for the RAD program
Program ResultsLow Income Peak
Reduction
Average Peak
Reduction
Low Income
vs. Average
BGE 2008: Known Low Income vs. Known
Average Customer
Varies depending on rate type; low income
customers respond similarly to average customer100%
CL&P's PWEP Program: Known Low Income
vs. Known Average Customer
Varies depending on rate type; low income
customers respond similarly to average customer100%
CL&P's PWEP Program (PTP high): Hardship
vs. Average 13% 20% 67%
Pepco DC (price only): Low Income vs.
Average Residential1 11% 13% 85%
PG&E SmartRate 2008: CARE vs. Average 11% 17% 66%
PG&E SmartRate 2009: CARE vs. Average 8% 15% 50%
California SPP: Low Income vs. Average 11% 13% 84%
California SPP: CARE vs. Average 3% 13% 22%

How do dynamic prices affect low income customers:
Conclusions based on 5 studies plus a load research
sample
Dynamic prices are not harmful to low income customers. In fact, just the opposite is true
– 65-79% are instant winners even without load shifting due to flatter-than-average load shapes.
– All five studies cited found that low income customers do respond to dynamic prices; evidence on the magnitude of their responsiveness is mixed.
The vast majority of low income customers are likely to benefit from dynamic pricing. Restricting access to dynamic rates may, in fact, be harmful to a large percentage of low income customers.
20
Source: IEE Whitepaper, “The Impact of Dynamic Pricing
on Low Income Customers, September 2010
www.edisonfoundation.net/IEE

21
Engaging the customer

What’s new in the EE space? Focus on
the customer
22

Educating and engaging the customer
23

Utilities are partnering with vendors and using home
energy reporting, goal setting, and rewards as
motivators to save
24
Large-Scale Customer
Engagement
Flagship Product –
Home Energy Report™
Efficiency Portal
Utility Partners:
Utilities send out monthly “Energy
Reports” to motivate customer action.
Make comparisons to neighbors
Results are measured and accepted as
an efficiency resource (average cost is
$0.03 per kWh saved).
Customers save energy (2-3%). Could
save a lot more if coupled with
technology.

Example: Commonwealth Edison launched major AMI
and rate pilot with customer centric design (2010)
Customer education innovations– Web energy management tools including
comparisons; educational modules; monthly updates
– In home displays, programmable communicating
thermostats
– Community support
Customer energy management assistance– Via bill comparisons, web tools, call center, monthly educational meetings
About 131,000 customers – 8,500 smart rates responders
– 120,000 smart energy managers
25

The customer’s energy management options
Demand response - smart rates– Many pilots but few smart (dynamic) rate “opt out” deployments
– In US, state regulators moving toward peak time rebate (PTR).
Demand response – direct load control – Decades of experience
– Move to measurable and verifiable DLC – DLC 2.0
Information induced conservation– Info alone or information with technology
PHEVs
Distributed generation
26

Big question: How will we motivate customers
to be smart energy managers?
We know customers benefit from smart rates on smart
meters
But, for those customers with smart meters but no smart
rates (i.e., the vast majority right now) or those without
smart meters, empowering customers to be smart
energy managers is the key
– Consumers are ready to be smart energy managers.
– Need to educate and engage the customer
– Technology can make a big difference
27

Smart meter platform will take EE and DR to
new levels – 2nd electric revolution!
28
HAN communication
SmartMeter communication
…It’s all about giving
customers the tools and
the know-how to be
smarter energy
consumers. Educate,
educate, educate!

For more information, contact:
Lisa Wood
Executive Director
Institute for Electric Efficiency
701 Pennsylvania Ave., N.W.
Washington, D.C. 20004-2696
202.508.5550
www.edisonfoundation.net/IEE


