American Journal of Epidemiology Copyright O 1999 by The Johns Hopkins University School of Hygiene and Public Health All rights reserved Vol. 150, No. 8 Printed In USA. Role of Transurethral Resection of the Prostate in Population-based Prostate Cancer Incidence Rates Ray M. Merrill, u Eric J. Feuer, 3 Joan L. Warren, 3 Nicki Schussler, 4 and Robert A. Stephenson 8 The extensive pool of asymptomatic prostate disease in the population, which increases substantially with age, suggests that the frequent use of transurethral resection of the prostate (TURP) in recent decades has had a large effect on prostate cancer incidence. The authors identified the effect of TURP-detected prostate cancer on the observed incidence rates between 1973 and 1993 for men aged 65 years and older. They linked population- based cancer registry data from the Surveillance, Epidemiology, and End Results Program to Medicare records between 1986 and 1993 to determine whether a TURP occurred sufficiently close to the time of a prostate cancer diagnosis for them to assume that it led to the diagnosis. TURP-detected cases prior to 1986 were calculated using an indirect method that involved multiplying the TURP procedure rate in the general population (from the National Hospital Discharge Survey) by estimates of the proportion of TURPs resulting in a prostate cancer diagnosis (from Medicare data and the literature). TURP explained much of the observed increase in overall prostate cancer incidence between 1973 and 1986 and possibly all of it in men aged 70 years and older. However, its influence on the trend and overall magnitude of the rates diminished between 1987 and 1993. The changing role of TURP in detecting prostate cancer is attributed to changes in medical technology and screening practices. The declining influence of TURP on prostate cancer incidence is likely to have continued beyond the study period due to the recent introduction and increasing use of medications for treating obstructive uropathy. Am J Epidemiol 1999; 150:848-60. Medicare; prostatectomy; prostate-specific antigen; prostatic neoplasms; SEER Program Prostate cancer is the most frequently diagnosed cancer among men in the United States (1). The reported incidence of this disease increased between 1973 and 1992, most strikingly between 1989 and 1992 (2). Incidence peaked in 1992 and has since declined (3-8). The annual age-adjusted (standardized to the 1970 population) rates increased about 2 percent between 1973 and 1986, 6 percent between 1986 and Received for publication June 11, 1998, and accepted for publi- cation February 8, 1999. Abbreviations: BPH, benign prostate hyperplasia; CPT-4, Current Procedural Terminology, Fourth Edition; FDA, Food and Drug Administration; HMO, health maintenance organization; ICD-9-CM, International Classification of Diseases, Ninth Revision, Clinical Modification; NHDS, National Hospital Discharge Survey; PSA, prostate-specific antigen; SEER, Surveillance, Epidemiology, and End Results; TURP, transurethral resection of the prostate. 1 Department of Health Science, Brigham Young University, Provo, UT. 2 Division of Epidemiology, Department of Family and Preventive Medicine, University of Utah School of Medicine, Salt Lake CHy, UT. 3 Applied Research Branch in the Division of Cancer Control and Population Sciences, National Cancer Institute, Bethesda, MD. 4 Information Management Services, Inc., Silver Spring, MD. 6 Division of Urology, University of Utah School of Medicine, Salt Lake City, UT. Reprint requests to Dr. Ray M. Merrill, Department of Health Science, Brigham Young University, Provo, UT 84602. 1989, and 20 percent between 1989 and 1992, and then decreased 13 percent between 1992 and 1994. These statistics reflect the most dramatic change in reported incidence witnessed for a given cancer site in a rela- tively short time interval. The extensive amount of asymptomatic prostate disease in the population sug- gests that changing patterns in the use of transurethral resection of the prostate (TURP) in recent decades to treat obstructive uropathy have made a substantial con- tribution to prostate cancer incidence rates and trends. Autopsy studies have identified a large pool of undi- agnosed prostate disease in the population, which increases as a function of age beginning in the third decade of life (9-15). The extent of disease that would never be detected clinically (latent) or would eventu- ally be detected clinically (preclinical) makes the reported incidence of prostate cancer particularly sus- ceptible to the increased use of medical interventions, such as transurethral resection or detection by the prostate-specific antigen (PSA) test. The sharp increase in prostate cancer incidence rates between 1990 and 1992 is due, in part, to a shift in the time of diagnosis resulting from the rapid introduction of PSA testing (16, 17). For the period prior to the widespread use of PSA testing, population-based studies have sug- gested an association between the use of TURP and 848
Transcript
American Journal of EpidemiologyCopyright O 1999 by The Johns Hopkins University School of Hygiene and Public HealthAll rights reserved
Vol. 150, No. 8Printed In USA.
Role of Transurethral Resection of the Prostate in Population-based ProstateCancer Incidence Rates
Ray M. Merrill,u Eric J. Feuer,3 Joan L. Warren,3 Nicki Schussler,4 and Robert A. Stephenson8
The extensive pool of asymptomatic prostate disease in the population, which increases substantially withage, suggests that the frequent use of transurethral resection of the prostate (TURP) in recent decades has hada large effect on prostate cancer incidence. The authors identified the effect of TURP-detected prostate cancer onthe observed incidence rates between 1973 and 1993 for men aged 65 years and older. They linked population-based cancer registry data from the Surveillance, Epidemiology, and End Results Program to Medicare recordsbetween 1986 and 1993 to determine whether a TURP occurred sufficiently close to the time of a prostatecancer diagnosis for them to assume that it led to the diagnosis. TURP-detected cases prior to 1986 werecalculated using an indirect method that involved multiplying the TURP procedure rate in the general population(from the National Hospital Discharge Survey) by estimates of the proportion of TURPs resulting in a prostatecancer diagnosis (from Medicare data and the literature). TURP explained much of the observed increase inoverall prostate cancer incidence between 1973 and 1986 and possibly all of it in men aged 70 years and older.However, its influence on the trend and overall magnitude of the rates diminished between 1987 and 1993. Thechanging role of TURP in detecting prostate cancer is attributed to changes in medical technology and screeningpractices. The declining influence of TURP on prostate cancer incidence is likely to have continued beyond thestudy period due to the recent introduction and increasing use of medications for treating obstructive uropathy.Am J Epidemiol 1999; 150:848-60.
Medicare; prostatectomy; prostate-specific antigen; prostatic neoplasms; SEER Program
Prostate cancer is the most frequently diagnosedcancer among men in the United States (1). Thereported incidence of this disease increased between1973 and 1992, most strikingly between 1989 and1992 (2). Incidence peaked in 1992 and has sincedeclined (3-8). The annual age-adjusted (standardizedto the 1970 population) rates increased about 2 percentbetween 1973 and 1986, 6 percent between 1986 and
Received for publication June 11, 1998, and accepted for publi-cation February 8, 1999.
Abbreviations: BPH, benign prostate hyperplasia; CPT-4, CurrentProcedural Terminology, Fourth Edition; FDA, Food and DrugAdministration; HMO, health maintenance organization; ICD-9-CM,International Classification of Diseases, Ninth Revision, ClinicalModification; NHDS, National Hospital Discharge Survey; PSA,prostate-specific antigen; SEER, Surveillance, Epidemiology, andEnd Results; TURP, transurethral resection of the prostate.
1 Department of Health Science, Brigham Young University,Provo, UT.
2 Division of Epidemiology, Department of Family and PreventiveMedicine, University of Utah School of Medicine, Salt Lake CHy, UT.
3 Applied Research Branch in the Division of Cancer Control andPopulation Sciences, National Cancer Institute, Bethesda, MD.
4 Information Management Services, Inc., Silver Spring, MD.6 Division of Urology, University of Utah School of Medicine, Salt
Lake City, UT.Reprint requests to Dr. Ray M. Merrill, Department of Health
Science, Brigham Young University, Provo, UT 84602.
1989, and 20 percent between 1989 and 1992, and thendecreased 13 percent between 1992 and 1994. Thesestatistics reflect the most dramatic change in reportedincidence witnessed for a given cancer site in a rela-tively short time interval. The extensive amount ofasymptomatic prostate disease in the population sug-gests that changing patterns in the use of transurethralresection of the prostate (TURP) in recent decades totreat obstructive uropathy have made a substantial con-tribution to prostate cancer incidence rates and trends.
Autopsy studies have identified a large pool of undi-agnosed prostate disease in the population, whichincreases as a function of age beginning in the thirddecade of life (9-15). The extent of disease that wouldnever be detected clinically (latent) or would eventu-ally be detected clinically (preclinical) makes thereported incidence of prostate cancer particularly sus-ceptible to the increased use of medical interventions,such as transurethral resection or detection by theprostate-specific antigen (PSA) test. The sharpincrease in prostate cancer incidence rates between1990 and 1992 is due, in part, to a shift in the time ofdiagnosis resulting from the rapid introduction of PSAtesting (16, 17). For the period prior to the widespreaduse of PSA testing, population-based studies have sug-gested an association between the use of TURP and
848
TURP-detected Prostate Cancer 849
prostate cancer incidence rates (18, 19). The highTURP procedure rates during this period further sug-gest that TURP-based detection of prostate cancer wascommon.
The purpose of this study is to determine the impactTURP has had on prostate cancer incidence before andduring the period of PSA testing. A refined methodol-ogy and use of Medicare records linked to population-based cancer registry data will be used to validate theresults of the earlier studies (18, 19) and extend theseresults to specific age groups and more recent years.Determining the influence of TURP on prostate cancerincidence rates provides a foundation from which wecan then show the impact PSA testing has had on therates since the late 1980s. It further provides an histor-ical record of the incidence of prostatic hyperplasia inthe population managed by TURP and the proportionof prostate cancer identified as a result.
The data used in this analysis include population-based cancer registry data linked to Medicare recordsfrom 1986 to 1993 to directly identify whether a TURPoccurred close enough to the time of diagnosis that wecould assume that it led to a prostate cancer diagnosis.For the years prior to 1986, when linked data were notavailable, we calculate TURP-detected prostate cancerby using an indirect method. This method involvesmultiplying the rate of TURP in the general populationby estimates of the proportion of TURPs resulting in aprostate cancer diagnosis. These methods provide animportant understanding of the effect TURPs have hadon the identification of prostate disease in the UnitedStates.
MATERIALS AND METHODS
Direct method: Identifying prostate cancerdiagnosed by TURP using linked Medicarecases, 198&-1993
Data sources. Prostate cancer case informationwas obtained from cancer registries in five states(Connecticut, Hawaii, Iowa, New Mexico, and Utah)and four metropolitan areas (Atlanta, Georgia; Detroit,Michigan; San Francisco-Oakland, California; andSeattle, Washington) between 1973 and 1993. Theseregistries are participants in the Surveillance,Epidemiology, and End Results (SEER) Program ofthe National Cancer Institute and represent approxi-mately 10 percent of the US population. The SEERProgram routinely collects and annually reports patientdemographic information, tumor characteristics, anddiagnostic and extent of disease information (20).
SEER data identify prostate cancer cases by themonth and year of diagnosis. The SEER Program alsocollects information on cancer surgery, but these data
are limited because only the most aggressive surgicalprocedure received by the patient is recorded. Forexample, if a man had a TURP and a radical prostatec-tomy, the hierarchical data set would record only theradical prostatectomy. On the other hand, the Medicaredata provide detailed person-level information for allsurgical procedures, including TURP, by day, month,and year. In general, Medicare data are available forabout 93 percent of persons with cancer aged 65 yearsor older who have been reported to the SEER Program(21). Ninety-seven percent of persons aged 65 or moreare eligible for Medicare.
Medicare records are collected by the Health CareFinancing Administration and include demographicand enrollment information (Part A, Part B, and healthmaintenance organization (HMO) enrollment) for eli-gible persons. The Medicare data also contain all billssubmitted for inpatient hospitalizations (Part A), out-patient hospital services (Part B), and services pro-vided by physicians (Part B). Procedures are reportedin the hospital inpatient data using InternationalClassification of Diseases, Ninth Revision, ClinicalModification (ICD-9-CM) codes (22), from the hospi-tal outpatient data utilizing ICD-9-CM codes andCurrent Procedural Terminology, Fourth Edition(CPT-4) codes (23), and from the physician data usingCPT-4 codes.
We used SEER registry data linked to Medicareclaims data for the years available, 1986 through 1993,to determine TURP-detected prostate cancer incidencerates. SEER data linked with the Medicare claims dataprovide a unique database, described in detail else-where (21). Hereafter, we refer to these Medicare ben-eficiaries as linked Medicare cancer cases.
There were 94,957 prostate cancer patients identi-fied by the SEER Program between 1986 and 1993who were aged 65 years or older at the time of theirdiagnosis. Of these men, 88,388 (93 percent) werelinked to Medicare. We excluded 6,562 (7 percent ofthe SEER Program total and 7 percent of Medicarecancer total) Medicare beneficiaries enrolled in anHMO because Medicare utilization data were notavailable for these patients. We also excluded 329cases with unknown month of diagnosis. This left81,497 cases for analysis.
Determining whether a TURP procedure led to aprostate cancer diagnosis. Since a TURP proceduremay follow a diagnosis of prostate cancer (to relievesymptoms when no further treatment is performed),we first needed to review the linked Medicare cancercases to identify whether a TURP procedure preceded,followed, or was concurrent with a prostate cancerdiagnosis. This required that we make certain assump-tions. If a man with prostate cancer had two or more
Am J Epidemiol Vol. 150, No. 8, 1999
850 Merrill et al.
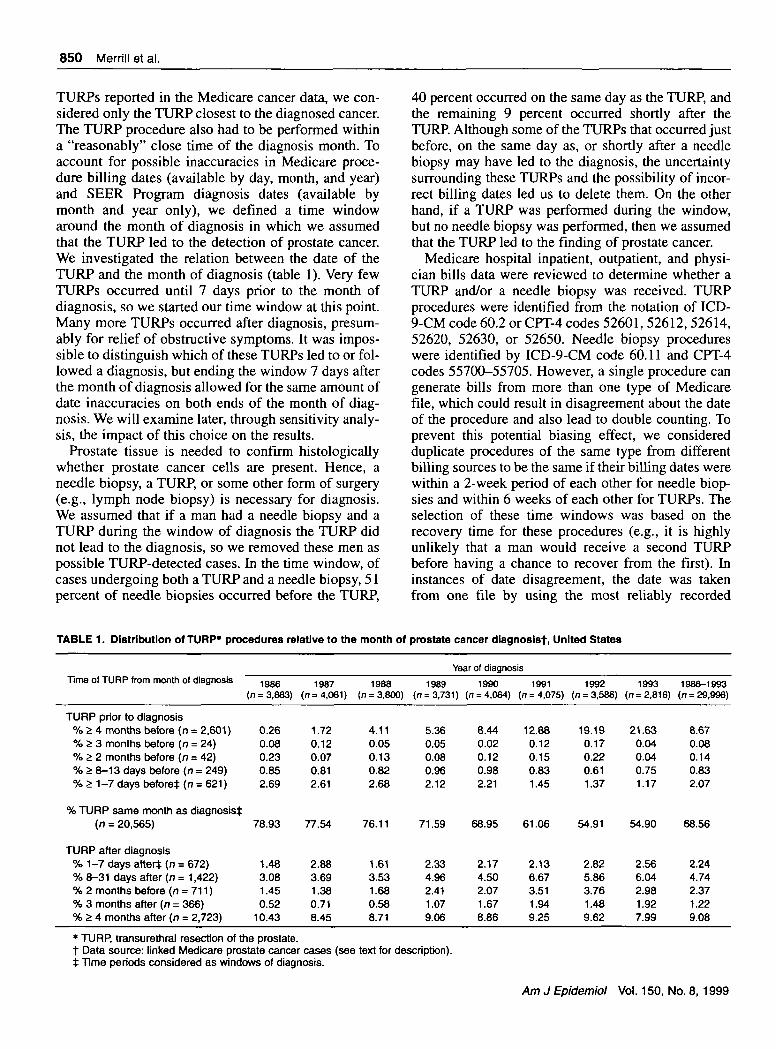
TURPs reported in the Medicare cancer data, we con-sidered only the TURP closest to the diagnosed cancer.The TURP procedure also had to be performed withina "reasonably" close time of the diagnosis month. Toaccount for possible inaccuracies in Medicare proce-dure billing dates (available by day, month, and year)and SEER Program diagnosis dates (available bymonth and year only), we defined a time windowaround the month of diagnosis in which we assumedthat the TURP led to the detection of prostate cancer.We investigated the relation between the date of theTURP and the month of diagnosis (table 1). Very fewTURPs occurred until 7 days prior to the month ofdiagnosis, so we started our time window at this point.Many more TURPs occurred after diagnosis, presum-ably for relief of obstructive symptoms. It was impos-sible to distinguish which of these TURPs led to or fol-lowed a diagnosis, but ending the window 7 days afterthe month of diagnosis allowed for the same amount ofdate inaccuracies on both ends of the month of diag-nosis. We will examine later, through sensitivity analy-sis, the impact of this choice on the results.
Prostate tissue is needed to confirm histologicallywhether prostate cancer cells are present. Hence, aneedle biopsy, a TURP, or some other form of surgery(e.g., lymph node biopsy) is necessary for diagnosis.We assumed that if a man had a needle biopsy and aTURP during the window of diagnosis the TURP didnot lead to the diagnosis, so we removed these men aspossible TURP-detected cases. In the time window, ofcases undergoing both a TURP and a needle biopsy, 51percent of needle biopsies occurred before the TURP,
40 percent occurred on the same day as the TURP, andthe remaining 9 percent occurred shortly after theTURP. Although some of the TURPs that occurred justbefore, on the same day as, or shortly after a needlebiopsy may have led to the diagnosis, the uncertaintysurrounding these TURPs and the possibility of incor-rect billing dates led us to delete them. On the otherhand, if a TURP was performed during the window,but no needle biopsy was performed, then we assumedthat the TURP led to the finding of prostate cancer.
Medicare hospital inpatient, outpatient, and physi-cian bills data were reviewed to determine whether aTURP and/or a needle biopsy was received. TURPprocedures were identified from the notation of ICD-9-CM code 60.2 or CPT-4 codes 52601, 52612, 52614,52620, 52630, or 52650. Needle biopsy procedureswere identified by ICD-9-CM code 60.11 and CPT-4codes 55700-55705. However, a single procedure cangenerate bills from more than one type of Medicarefile, which could result in disagreement about the dateof the procedure and also lead to double counting. Toprevent this potential biasing effect, we consideredduplicate procedures of the same type from differentbilling sources to be the same if their billing dates werewithin a 2-week period of each other for needle biop-sies and within 6 weeks of each other for TURPs. Theselection of these time windows was based on therecovery time for these procedures (e.g., it is highlyunlikely that a man would receive a second TURPbefore having a chance to recover from the first). Ininstances of date disagreement, the date was takenfrom one file by using the most reliably recorded
TABLE 1. Distribution of TURP* procedures relative to the month of prostate cancer diagnoslst, United States
Year of diagnosisTime of TURP from month of diagnosis
TURP prior to diagnosis% £ 4 months before (n = 2,601)% £ 3 months before [n = 24)% £ 2 months before (n = 42)% 5 8-13 days before (n = 249)% £ 1-7 days before* (n = 621)
% TURP same month as diagnosis*(n = 20,565)
TURP after diagnosis% 1-7 days after* (n = 672)% 8-31 days after (n = 1,422)% 2 months before (n = 711)% 3 months after (n = 366)% £ 4 months after (n = 2,723)
1986(n = 3,863)
0.260.080.230.852.69
78.93
1.483.081.450.52
10.43
1987(n= 4,061)
1.720.120.070.812.61
77.54
2.883.691.380.718.45
1988(n = 3,800)
4.110.050.130.822.68
76.11
1.613.531.680.588.71
1989(n = 3,731)
5.360.050.080.962.12
71.59
2.334.962.411.079.06
1990(n = 4,064)
8.440.020.120.982.21
68.95
2.174.502.071.678.86
1991(n = 4,075)
12.880.120.150.831.45
61.06
2.136.673.511.949.25
1992(n = 3,586)
19.190.170.220.611.37
54.91
2.825.863.761.489.62
1993(n = 2,816)
21.630.040.040.751.17
54.90
2.566.042.981.927.99
1986-1993(n = 29,996)
8.670.080.140.832.07
68.56
2.244.742.371.229.08
• TURP, transurethral resection of the prostate.t Data source: linked Medicare prostate cancer cases (see text for description).t Time periods considered as windows of diagnosis.
Am J Epidemiol Vol. 150, No. 8, 1999
TURP-detected Prostate Cancer 851
records first (i.e., inpatient, then outpatient, and thenphysician files).
From the 81,497 Medicare prostate cancer casesincluded in this study, 29,996 had at least one TURP.Of these, 21,858 cases occurred within the time win-dow of diagnosis (table 1). We deleted 2,198 of thesecases because they also had a needle biopsy within thiswindow. By considering only TURPs without a needlebiopsy within the selected window of diagnosis, wetagged 19,660 cases and used them to directly computethe magnitude and trend of TURP and non-TURP-detected prostate cancer incidence between 1986 and1993.
Indirect method. Identifying prostate cancerdiagnosed through TURP between 1973 and 1993
Because of the high occurrence of TURP proceduresin the 1970s and 1980s (16, 17), evaluating TURP-detected prostate cancer incidence during these yearsis of primary interest. However, Medicare cancer datawere available only for 1986 through 1993. Hence, adirect estimation of the influence of TURP procedureson prostate cancer incidence for the years prior to theSEER-Medicare linkage was not possible. Therefore,we applied an indirect method to estimate TURP-detected prostate cancer incidence.
Prostate cancer incidence rates detected by TURPcan be expressed as the product of two factors: theTURP procedure rate multiplied by the proportion ofTURPs leading to a prostate cancer diagnosis, that is,
TURP
Population•X
Prostate Cancer [Prostate Cancer 1
TURP L Population
Deriving TURP procedure rates. Population-basedTURP procedure rates were obtained for the period1973-1993 from the National Center for HealthStatistics-conducted National Hospital DischargeSurvey (NHDS) (figure 1) (24). From surveyed hospi-tal records, the NHDS provides a cross-sectionalweighted estimate of discharges in the United StatesThe survey uses ICD-9-CM codes for diagnoses, biop-sies, and surgical procedures. Age-specific informationis available only for all races combined. We used theNHDS to calculate population-based TURP rates for1973-1993.
We also obtained population-based TURP procedurerates for 1986-1993 from Medicare data. The Medicaredata include linked Medicare cancer cases, as previ-ously defined, as well as data for men who did not havecancer, whom we refer to as Medicare noncancer cases.The Medicare noncancer cases include a 5 percent sam-ple of Medicare-eligible men who were not enrolled in
an HMO who resided in the SEER Program areasbetween 1986 and 1993 and did not have cancer. Thesampled Medicare noncancer cases (weighted by 20)were combined with the linked Medicare cancer cases(weight of one) to create population-based annual ratesof TURP for 1986-1993. The TURP rates derived fromthe Medicare data were almost identical between whitemen and black men, which led us to utilize combinedrates. A comparison of the TURP procedure rate trendsin the years of overlap from the NHDS and Medicaredata shown in figure 1 suggest that TURP rates derivedfrom the Medicare data were similar to those obtainedfrom the NHDS. Therefore, we used NHDS TURPrates because they were available for a longer timeperiod.
Deriving the proportion of TURPs leading to a diag-nosis of prostate cancer. To compute the proportionof TURPs leading to a diagnosis of prostate cancerbetween 1986 and 1993, we divided the prostate can-cer cases tagged as being detected by TURP by thepopulation-based number of TURPs. From these com-bined data sources, the proportion of TURPs that led toa prostate cancer diagnosis was computed by age andyear (figure 2).
For the period prior to 1986, we did not have data onthe percent of TURPs that resulted in a prostate cancerdiagnosis. The results of three studies conducted in thelate 1970s (25, 26) and the 1980s (27) indicate that forthe period 1978-1985 the proportions of TURPs thatresulted in a prostate cancer diagnosis were similar tothose estimated in the late 1980s using the Medicaredata. Thus, we used the Medicare data from the com-bined period 1986-1990 as the estimated proportionsbetween 1978 and 1985 (figure 2). Prior to 1978, theproportion of TURPs leading to a prostate cancer diag-nosis may have been lower. A study by Newman et al.(25) of consecutive patients undergoing transurethralresection of clinically benign prostate glands at a singlehospital derived the proportion of TURPs leading todiagnosed prostate cancer in two time periods,1972-1973 (n = 500) and 1978-1979 (n = 500). Forages 60 years and older, the proportion was 57 percentlower in 1972-1973 compared with 1978-1979, 10.3 ±3.1 percent versus 18 ± 3.8 percent, respectively. Thischange is explained, at least in part, by a change in med-ical practice during the 1970s, in which fewer prostatechips were routinely examined in the earlier period (25).To account for the lower prostate cancer-to-TURP ratiobetween 1973 and 1977, we assumed that the change inproportion observed for ages 60 years and older in theNewman study applied to each age group and adjustedthe proportions derived from the 1986-1990 Medicaredata down in equal increments until, for 1973, theyreached 57 percent of the 1978 proportion.
Am J Epidemiol Vol. 150, No. 8, 1999
852 Merrill et al.
4000
3500
3000
2500-
1000 -
500
0
•Q
X Medicare Non-Cancer and Linked Cancer Cases
O National Hospital Discharge Survey
•+• •+• •+- •+• •+• •+- H h •+- H 1-
1973 1975 1977 19791981 1983 1985
Year of Procedure
1987 1989 1991 1993
FIGURE 1. TURP rates based on data from the NHDS (1973-1993) and Medicare data (1986-1993) by year of procedure and age. Rates forthose aged 80 years or more are age adjusted to the 1970 standard.
Although only one study could be identified toreport the change in the proportion of TURPs leadingto a prostate cancer diagnosis during the 1970s for allages combined and by age-specific groups (25), twoadditional studies (26, 27) reported very similar pro-portions for all ages combined to the proportion basedon the second data set collected in the late 1970s in thefirst study (i.e., about 14 percent). This gives us moreconfidence in the age-specific proportions used in ouranalysis. We later explore the sensitivity of our results
with respect to the estimated large change in the 1970sof the proportion of TURPs leading to diagnosedprostate cancer.
Statistical analysis of prostate cancer trends
Weighted least-squares regression coefficients werecalculated to estimate and test the significance of theannual percent changes in total, TURP-, and non-TURP-detected prostate cancer incidence rates. The estimated
Aw J Epidemiol Vol. 150, No. 8, 1999
TURP-detected Prostate Cancer 853
1973 1975 1977 1979 1987 1989
-Ages 65-69
1981 1983 1985
Year of Diagnosis
—Ages 70-74 Ages 75-79 Ages 80+
1991 1993
FIGURE 2. Estimated proportion of TURPs leading to a prostate cancer diagnosis In men aged 65 years and older, by year of diagnosis andage. Data sources: Medicare noncancer and linked cancer cases and Newman et al. (25).
annual percent change in trend was calculated byregressing the natural logarithm of the rates (r) on cal-ender year (y). We used weighted least squares, with theweights equal to the inverse of the variance. AssumingPoisson rates, the variance of the log rates equals I/casesby the delta method (28). The annual percent change isthen equal to 100 x (exp(/n) - 1), where m is the slopecoefficient in the regression. A confidence interval forthe estimated annual percent change was derived bytransforming the confidence interval for the slope coef-ficient m (29). The rates presented in this paper arereported per 100,000 person-years, with combined agegroup-specific rates adjusted to the 1970 standard.
RESULTS
Trend analysis
Trends in total, TURP-, and non-TURP-detected, age-adjusted prostate cancer incidence rates are presented(figure 3). The two lines with plus symbols will be dis-cussed later under the sensitivity analysis section. Forthe direct method, the cohort to be partitioned as TURPor non-TURP detected is the linked Medicare cancercases. Thus, the overall incidence rates for the period1986-1993 derived using these cases and a denominatorbased on the Medicare population are shown in figure 3.The indirect method uses two scaleless factors (i.e., the
Am J Epidemiol Vol. 150, No. 8, 1999
854 Merrill et al.
1600
1400
1200
1000
400
200-
- Total (Medicare Non-Oncer and Linked Cancer Cases 1986-1993; SEER 1973-1993)
FIGURE 3. Age-adjusted (1970 standard) prostate cancer incidence rates by year of diagnosis in patients aged 65 years and older. Datasources: NHDS, SEER Program, and Medicare noncancer and linked cancer cases.
TURP rate and the proportion of TURPs leading to adiagnosis of prostate cancer) from different data sourcesthat are applied to partition the overall SEER prostatecancer incidence rates from 1973 to 1993 into TURPand non-TURP detected. The trends for the age-adjustedrates in the years of overlap are similar. Both direct andindirect methods use the same prostate cancer-to-TURPratio in their calculations. Thus, the similar trend linesfrom 1986 to 1993 show that the results are comparablewhen using different TURP rates. The TURP-detectedrates steadily increased through 1987 and declinedthereafter. In contrast, the non-TURP-detected rateswere fairly flat through about 1986 and then sharplyincreased and peaked in 1992.
Using the indirect method, the partition of totalSEER prostate cancer incidence rates into TURP- andnon-TURP-detected prostate cancer incidence rates
are presented by year of diagnosis and age group (fig-ure 4). The trends in the age-specific rates are eachconsistent with those shown for the age-adjusted rates(figure 3), although rates increase with age, consistentwith age-related increases in both benign prostatichyperplasia and prostate cancer. TURP-detectedprostate cancer rates increased through the mid-1980sand then decreased. The non-TURP-detected ratesremained fairly flat through the mid 1980s and thensharply increased, peaking in 1992. The proportion ofprostate cancer incidence detected through TURP is afunction of age and calendar period, as evident in thesefigures and summarized in figure 5. TURP-detectedprostate cancer contributes between 18 and 53 percentof total prostate cancer incidence. The proportionstend to increase with age and rise steadily in each timeperiod until 1988-1993, when they fell dramatically.
FIGURE 4. Total, TURP-, and non-TURP-detected prostate cancer incidence rates in men aged 65 years and older, by year of diagnosis andage, 1973-1993. Data sources: NHDS, SEER Program, and Medicare noncancer and linked cancer cases.
Table 2 shows the annual percent change and 95percent confidence interval for total, TURP-, and non-TURP-detected prostate cancer incidence ratesbetween 1973 and 1986 by age group. This timeperiod reflects the period prior to widespread PSAtesting. We report this under the column subheading"Newman et al." to reflect our data source for the pro-portion of TURPs leading to a diagnosis of prostate
cancer in the 1970s. Given that these results are basedon a single study, an alternative assumption, denotedby the column subheading "flat," is reported in thenext section. The age-specific total and TURP-detected incidence trends are all significantly greaterthan zero, whereas the non-TURP-detected trends,except for those in ages 65-69 years, are either flat ordecreasing.
Aw J Epidemiol Vol. 150, No. 8, 1999
856 Merrill et al.
60.0
50.0
40.0
30.0
20.0 -
10.0
0.0
• Average 1973-77 Q Average 1978-82 • Average 1983-87 B Average 1988-93
65-69 70-74 75-79
Year of Diagnosis
80+ 65+
FIGURE 5. Estimated percent of prostate cancer cases detected by TURP according to year of diagnosis and age using Indirectiy computedestimates for men aged 65 years and older, 1973-1993. Data sources: NHDS, SEER, and Medicare noncancer and linked cancer cases.
TABLE 2. Annual percent change and 95% confidence Intervals for total, TURP-*, and non-TURP-detected prostate cancerIncidence rates for men aged 65 years and older In the years prior to PSA* screening, 1973-1986
* TURP, transurethral resection of the prostate; PSA; prostate-specific antigen; Cl, confidence interval; NHDS, National HospitalDischarge Survey.
t Based on NHDS* data and on the probability of TURP leading to a diagnosis of prostate cancer that assumes a 57% Increase from1973 to 1978 (25), as described in Materials and Methods.
$ Based on NHDS data and on the probability of TURP leading to a prostate cancer diagnosis derived from 1986 to 1990 Medicare non-cancer and linked cancer cases applied to the years 1973-1985.
§ Based on rates age-adjusted to the 1970 standard.
Am J Epidemiol Vol. 150, No. 8, 1999
TURP-detected Prostate Cancer 857
Distribution of TURP and non-TURP cases
Table 3 shows the distribution of cases (percent)over the levels of historic stage and grade according toTURP and non-TURP status. TURP cases displayedearlier stage and lower grade than did non-TURP cases.TURP-detected tumors have low biologic potentialand may not be surgically treated. This may explainwhy only 3.5 percent of the TURP-detected cases and22.5 percent of non-TURP-detected cases had a radicalprostatectomy (data not shown). The relatively lowlevels of radical prostatectomy among TURP casesmay also be due to more comorbid disease.
Sensitivity analysis
To account for possible inaccuracies in Medicareprocedure billing dates and SEER Program diagnosisdates, we assumed TURPs occurring within 7 days ofthe month of diagnosis with prostate cancer were asso-ciated with the diagnosis. Reducing the time windowin which a TURP procedure was associated with aprostate cancer diagnosis from the month of diagnosis±7 days to just the month of diagnosis made littlechange in the results. For example, the proportion ofTURP-detected prostate cancer changed from 48 per-cent (figure 5) to 47 percent in cases diagnosedbetween 1983 and 1987 and from 25 percent (figure 5)to 24 percent for cases diagnosed between 1988 and1993. Changes in the earlier two periods were less than1 percent.
Because of uncertainty about whether a TURP or aneedle biopsy led to a diagnosis, the results reflectcases that had a TURP but no needle biopsy within theselected time window. Yet the choice to delete casesthat had both a TURP and a needle biopsy during thetime window likewise had little effect on the results.When these cases were included, the proportion of
TABLE 3. Distribution of cases (percent) over the levels ofhistoric stage and grade for TURP* and non-TURP-detectedprostate cancer cases, United States, 1986-1993
prostate cancer detected through TURP increased min-imally from 48 to 49 percent for cases diagnosed in1983-1987 and from 25 to 27 percent for cases diag-nosed between 1988 and 1993. There was less than 1percent change in the earlier two periods.
We based our results on the dramatic increase in theproportion of TURP leading to a prostate cancer diag-nosis reported by Newman et al. (25). As an alternativeto these estimates, a reasonable upper bound on theproportion of TURP leading to a prostate cancer diag-nosis in 1973-1977 was assumed to be the same pro-portion as that used in 1978-1985. In table 2 under thesubheading flat, we present the annual percent changein TURP and non-TURP-detected prostate cancer inci-dence by age group, assuming that the proportions ofTURP leading to a prostate cancer diagnosis were thesame in 1973-1977 as those we used in 1978-1985.The annual percent changes for TURP-detected casesin each age group remains significantly greater thanzero, and the non-TURP-detected cases are not signif-icantly positive for ages 75-79 and 80 years and older.Hence, even in the case of the upper bound, we stillfind that TURP explains some of the increase inprostate cancer incidence rates for each age group andperhaps all of it for ages 75-79 and 80 years and older.The two lines with plus symbols in figure 3 reflect theTURP and non-TURP-detected, age-adjusted prostatecancer incidence rates for men aged 65 years and olderwhen the proportion of TURPs leading to a diagnosisis assumed to be flat between 1973 and 1977.
DISCUSSION
This study has assessed the changing role of TURPin prostate cancer diagnosis. TURPs have had an influ-ence on both the level and the trend in prostate cancerincidence. In men aged 65 years and older, between 20and 50 percent of incident cases of prostate cancer arediagnosed through a TURP. It is difficult to assess howmany of these cancers would have gone undetected orbeen detected through other methods. Nevertheless, ifwe assume that most of the TURP-detected cancerswould not have been detected otherwise, then most ofthe increase in incidence from 1973 through 1986 canbe attributed to TURPs.
Symptoms for prostate cancer are similar to thosecaused by less serious, yet more common, health prob-lems, such as benign prostate hyperplasia (BPH) orurinary tract infection. The method of medical man-agement for men presenting with obstructive symp-toms has evolved with changes in medical technologyand improvements in the medication or treatment ofBPH. Throughout the study period, pivotal changes inmedical and screening practices help to explain theresults we observe in this study.
Am J Epidemiol Vol. 150, No. 8, 1999
858 Merrill et al.
Endoscopic techniques for relieving obstructiveeffects of an enlarged prostate were first developed inthe 1930s (30). However, limitations of the equipmentinhibited wide acceptance of the TURP procedure untilthe early 1970s, when rod-lens telescopes andimproved endoscopic illumination transformed theTURP procedure into a treatment thought by manyurologists to be ideal for relieving symptoms accom-panying an enlarged prostate (30). In the 1970s, sus-pected prostate cancer was usually diagnosed byextracting prostate tissue using a core biopsy, a painfulprocedure with potential complications. Digital rectalexamination, with sensitivity of only 50 percent andspecificity of 94 percent (31), was the major clinicaldiagnostic tool used to make a differential diagnosisbetween BPH and prostate cancer. Improvements inTURP technology in tandem with the potential dis-comfort and complications of a core needle biopsymay have led physicians to consider TURP as both adiagnostic and a therapeutic procedure, particularly formen who were not considered candidates for more rad-ical procedures. This may have contributed to theobserved increase in TURP procedure rates, particu-larly in older men who have higher prevalence ofsymptomatic BPH.
In addition to an increased use of TURP, weobserved that the proportion of TURPs leading to aprostate cancer diagnosis between 1973 and 1978increased. This rise in the prostate cancer-to-TURPratio may have resulted from an increase in the num-ber of prostatic chips routinely examined by patholo-gists during this time (25).
Starting in the mid-1980s, several developments ledto a decline both in the TURP rate and the proportionof TURPs leading to a diagnosis of prostate cancer.First, in 1985, the Food and Drug Administration(FDA) approved PSA testing for monitoring possiblerecurrence of prostate cancer in men being treated forthe disease (32). However, a sharp increase in prostatecancer incidence rates between 1989 and 1992 sug-gests that PSA procedures were also being used toassist in detecting prostate cancer (2), although theFDA did not approve PSA for that purpose untilAugust 1994 (32). The rapid increase in use of PSAhas been reported for men aged 65 years and older,from 1,430 to 18,000 per 100,000 men between 1988and 1991 (17). Second, the fine-needle, spring-drivenbiopsy gun under transrectal ultrasound guidance andthe fine-needle aspiration biopsy also gained wide-spread acceptance in the United States in the late1980s (33-38). Reasons for acceptance of fine-needlebiopsy include greater ease in performance, includingthe ability to be done in an outpatient setting withoutanesthesia, and lower rates of complications than typi-
cally result from standard core biopsy (33-38).Between 1986 and 1991, use of needle biopsy morethan tripled in men aged 65 years and older, from 685to 2,600 per 100,000 men (17). This increase may, inpart, reflect that the ease of biopsy had resulted in alower threshold for proceeding with a biopsy, even ifthe prior test indicated only a possibility of prostatecancer. Furthermore, the greater reach of needle biopsymay have been preferred, with the improved under-standing that the majority of prostate cancers are foundin the peripheral zone closest to the rectal wall (70-75percent) compared with the transitional zone surround-ing the urethra (about 20 percent) or the central zone(5-10 percent), from which TURP tissue is taken (39,40).
PSA testing and needle biopsy had a major impacton the frequency of TURP as well as on changing thecomposition of the clinical characteristics of menundergoing TURP. As more men underwent PSA test-ing and needle biopsy, more men with concurrent pro-static hypertrophy and prostate cancer were identifiedas having prostate cancer without undergoing a TURP.The majority of these men underwent curative localtherapy, such as radical prostatectomy or radiationtherapy. As a result of the removal of cancer casesfrom the potential pool of TURP candidates, theremaining group of men who underwent TURP weremore likely to have BPH without a simultaneous can-cer diagnosis, resulting in a lower prostate cancer-to-TURP ratio.
In the early 1990s, new drug therapy (e.g., finas-teride) was developed as an alternative to TURP fortreating BPH. The efficacy and safety of finasteride(marketed as Proscar, manufactured by Merck & Co.,Inc., West Point, Pennsylvania) as an inhibitor of thehormone that is involved with prostate enlargementwas established in controlled studies in the early 1990s(41-43) and approved by the FDA in 1992 (43). Twoother drugs, known as alpha blockers, were laterapproved by the FDA for relieving bladder outletobstruction (terazosin, marketed as Hytrin and manu-factured by Abbot Laboratories, Abbott Park, Illinois,in 1993, and doxazosin, marketed as Cardura, manu-factured by Roche Laboratories, Nutley, New Jersey,in 1995 (43)). While we can only speculate about theimpact of medical treatment on the TURP procedurerate and on the proportion of TURPs leading to aprostate cancer diagnosis, it seems reasonable toexpect that both declined as a result.
Between 1993 and 1995, SEER-based prostate cancerincidence rates fell in a similar fashion across all stagecategories (on a relative scale), but most among well-differentiated tumors (44). The changes in the earlystage and well-differentiated tumors may be attributed,
Am J Epidemiol Vol. 150, No. 8, 1999
TURP-detected Prostate Cancer 859
in part, to decreased use of TURP, since TURP-detectedcases tend to be early stage and well differentiated.
Potential biases may result from the exclusions madein our study. Recall that exclusions were made of caseswho had no match to Medicare data, were enrolled in anHMO, or had no known month of diagnosis. We have noreason to believe that those without linked records weremore or less likely to be diagnosed through a TURP. Inaddition, the small number deleted because of missingmonth of diagnosis wih1 not have a statistical impact onour sample. Of the excluded Medicare beneficiariesenrolled in an HMO, it is difficult to draw conclusionsfrom the literature about whether they are more or lesslikely to be diagnosed through a TURP. Two surveystudies have shown that Medicare HMO enrollees com-pared with the fee-for-service population tend to behealthier, with slightly better overall and functionalhealth status, fewer limiting physical activities, andfewer serious chronic conditions, such as cardiovasculardisease (45, 46). These findings suggest that men inHMOs may be better candidates for more radicalsurgery as their underlying health status is better thanthat for men in the fee-for-service setting. Older menwith significant comorbid conditions may choose tohave a TURP because they are unable to undergo moreradical surgery. However, a study by Greenwald andHenke (47) involving care provided from 1980 to 1982in a single HMO showed that men diagnosed withprostate cancer were less likely to have surgery,although the type of surgery, whether prostatectomy orTURP, is not reported in the analysis.
In conclusion, the data from this study have applica-tion for cancer surveillance. An important part of can-cer surveillance is to understand factors that influencechanges in cancer trends. From our analysis, it is clearthat TURP has played an important role in prostatecancer detection in the 1970s and 1980s, explainingmuch of the increase in rates between 1973 and 1986.In more recent years, with the availability of PSA andthin-needle biopsy, the importance of TURP inprostate cancer detection declined, helping to explainsome of the decrease in incidence. This decline willlikely continue in future years as medical treatment ofBPH improves. In the most recent years, PSA has con-tributed to the changing trend in prostate cancer inci-dence rates. An understanding of the background trend(including TURP-detected prostate cancer) is neces-sary to isolate the impact of PSA on the trends.
ACKNOWLEDGMENTS
The authors thank April Fritz, Technical InformationSpecialist in the SEER Program of the National Cancer
Institute, and Arnold Potosky, Health Service Researcher inthe Applied Research Branch of the National CancerInstitute, for their thoughtful comments on this manuscript.
REFERENCES
1. Parker SL, Tong T, Bolden S. Cancer statistics, 1997. CACancer J Clin 1997;47:5-27.
2. Merrill RM, Brawley OW. Prostate cancer incidence and mor-tality rates among white and black men. Epidemiology 1997,8:126-31.
3. Gilliland FD, Welsh DJ, Hoffman RM, et al. Rapid rise andsubsequent decline in prostate cancer incidence rates for NewMexico, 1989-1993. Cancer Epidemiol Biomarkers Prev1995;4:797-800.
4. Stephenson RA, Smart CR, Mineau GP, et al. The fall in inci-dence of prostate carcinoma. On the down side of prostate spe-cific antigen induced peak in incidence-data from the UtahCancer Registry. Cancer 1996;77:1342-8.
5. Stanford JL, Wicklund KG, Blumenstein BA. The changingepidemiology of prostate cancer in Seattle-Puget sound region,1974-1993. (Abstract). J Urol 1995;153:504.
6. Merrill RM, Potosky A, Feuer E. Changing trends in U.S.prostate cancer incidence rates. J Natl Cancer Inst 1996;88:1683-5.
7. Polednak AP. Trends in prostate carcinoma incidence inConnecticut (1988-1994) by age and race. Cancer 1997;79:99-103.
8. Ries L, Kosary C. Prostate cancer incidence, 1973-1994: NCIreleases new cancer statistics (Stat Bite). J Natl Cancer Inst1997;89:6O9.
9. Andrews GS. Latent carcinoma of the prostate. J Clin Pathol1949;2:197.
10. Edwards CN, Steinthorsson E, Nicholson D. An autopsy oflatent prostatic cancer. Cancer 1953;6:531.
11. Hirst, AE Jr, Bergman RT. Carcinoma of the prostate in men 80or more years old. Cancer 1954;7:136.
12. Whitmore WF Jr. Symposium of hormones and cancer therapyhormone therapy in prostatic cancer. Am J Med 1956;21:295.
13. Scott R Jr, Mutchnik DL, Laskowski TZ, et al. Carcinoma ofthe prostate in elderly men: incidence, growth characteristicsand clinical significance. J Urol 1969:101:602-7.
14. Breslow N, Chan CW, Dhom G, et al. Latent carcinoma of theprostate at autopsy in seven areas. Int J Cancer 1977;20:680-8.
15. Carter HB, Piantadosi S, Isaacs JT. Clinical evidence for andimplications of the multistep development of prostate cancer. JUrol 1990:143:742-6.
16. Catalona WJ, Smith DS, Ratliff TL, et al. Detection of organ-confined prostate cancer is increased through prostate-specificantigen-based screening. JAMA 1993;270:948-54.
17. Potosky AL, Miller BA, Albertsen PC, et al. The role ofincreasing detection in the rising incidence of prostate cancer.JAMA 1995:273:548-52.
18. Potosky AL, Kessler L, Gridley G, et al. Rise in prostatic can-cer incidence associated with increased use of transurethralresection. J Natl Cancer Inst 1990:82:1624-8.
19. Levy IG, Gibbons L, Collins JP, et al. Prostate cancer trends inCanada: rising incidence or increased detection? Can MedAssocJ 1993:149:617-23.
21. Potosky AL, Riley GF, Lubitz JD, et al. Potential for cancerrelated health services research using a linked MEDICARE-tumor registry database. Med Care 1993:31:732-48.
22. National Center for Health Statistics. International classifica-tion of diseases, Ninth Revision. Clinical Modification. 3rd ed.Vol. 1. Hyattsville MD: National Center for Health Statistics,1989. (DHHS publication no. (PHS) 89-1260).
Am J Epidemiol Vol. 150, No. 8, 1999
860 Merrill et al.
23. Physicians' Current Procedural Terminology. 4th ed.Department of Coding and Nomenclature. Chicago, IL:American Medical Association, 1991.
24. Simmons WR. Development of the design of the NCHSHospital Discharge Survey. Hyattsville, MD: National Centerfor Health Statistics, 1970. (Vital and Health Statistics Series2-39) Washington, DC: US GPO. (DHHS publication no.(PHS) 1000-).
25. Newman AJ Jr, Graham MA, Carlton CE Jr, et al. Incidentalcarcinoma of the prostate at the time of transurethral resec-tion: importance of evaluating every chip. J Urol 1982;128:948-50.
26. Sheldon CA, Williams RD, Fraley EE. Incidental carcinoma ofthe prostate: a review of the literature and critical reappraisalof classification. J Urol 1980;124:626-31.
27. Rohr LR. Incidental adenocarcinoma in transurediral resec-tions of the prostate. Partial versus complete microscopicexamination. Am J Surg Pathol 1987; 11:53-8.
28. Bishop YMM, Fienberg SE, Holland PW. Discrete multivari-ate analysis. Cambridge, MA: MIT Press, 1975.
29. Kleinbaum DG, Kupper LL, Muller KE. Applied regressionanalysis of other multivariable methods. North Scituate, MA:Duxbury Press, 1988:266-8.
35. Walsh PC. Fine needle aspiration of the prostate—Why has ittaken so long to accept? J Urol 1996;135:334-5.
36. Casey JH, Silenieks Al. Fine-needle aspiration cytology of theprostate: experience in a nonacademic practice. Semin DiagnPathol 1988;5:294-300.
37. Drago JR. The role of new modalities in the early detection anddiagnosis of prostate cancer. CA Cancer J Clin 1989;39:326-36.
38. Benson MC. Fine-needle aspiration of the prostate. NatlCancer Inst Monogr 1988;7:19-24.
39. Bissada NK. Accuracy of transurethral resection of the prostateversus transrectal needle biopsy in the diagnosis of prostaticcarcinoma. J Urol 1977;118:61.
40. Oesterling JE, Fuks Z, Lee CT, et al. Cancer of the prostate. In:DeVita VT, Hellman S, Rosenberg SA, eds. Cancer principlesand practice of oncology. 5th ed. Vol. 1. Philadelphia, PA:Lippincott-Raven, 1997:1323.
41. Gormley GJ, Stoner E, Bruskewitz RC, et al. The effect offinasteride in men with benign prostatic hyperplasia. TheFinasteride Study Group. N Engl J Med 1992;327:1185-91.Finasteride Study Group. Finasteride (MK-906) in the treat-42
43ment of benign prostatic hyperplasia. Prostate 1993;22:291-9.Prostate enlargement: benign prostatic hyperplasia. Bethesda,MD, National Institutes of Health,1996. (NTH publication no.91-3012).
44. SEER*Stat for Windows 95/NT Version 1.1. SEER cancerincidence public-use database, 1973-1995. Silver Spring, MD:Information Management Services, Inc., 1998.
45. Brown RS, Bergeron JW, Clement DG, et al. The Medicarerisk program for HMOs—final summary report on findingsfrom the evaluation. Final report under HCFA contract number500-8-0006. Princeton, NJ: Mathematica Policy Research,Inc., 1993.
46. Riley G, Tudor C, Chiang YP, et al. Health status of Medicareenrollees in HMOs and fee-for-service in 1994. Health CareFinance Rev 1996; 17:65-76.
47. Greenwald HP, Henke CJ. HMO membership, treatment, andmortality risk among prostatic cancer patients. Am J PublicHealth 1992;82:1099-104.