Roles of default-mode network and supplementary motor area in humanvigilance performance: evidence from real-time fMRI
Oliver Hinds,1 Todd W. Thompson,1 Satrajit Ghosh,2 Julie J. Yoo,1 Susan Whitfield-Gabrieli,1,3
Christina Triantafyllou,3 and John D. E. Gabrieli1,3
1Department of Brain and Cognitive Sciences, Massachusetts Institute of Technology, Cambridge, Massachusetts;2Research Laboratory of Electronics, Massachusetts Institute of Technology, Cambridge, Massachusetts;and 3A. A. Martinos Brain Imaging Center at the McGovern Institute for Brain Research, MassachusettsInstitute of Technology, Cambridge, Massachusetts
Submitted 30 June 2011; accepted in final form 7 December 2012
Hinds O, Thompson TW, Ghosh S, Yoo JJ, Whitfield-Gabrieli S,Triantafyllou C, Gabrieli JD. Roles of default-mode network andsupplementary motor area in human vigilance performance: evidencefrom real-time fMRI. J Neurophysiol 109: 1250–1258, 2013. Firstpublished December 12, 2012; doi:10.1152/jn.00533.2011.—We usedreal-time functional magnetic resonance imaging (fMRI) to determinewhich regions of the human brain have a role in vigilance as measuredby reaction time (RT) to variably timed stimuli. We first identifiedbrain regions where activation before stimulus presentation predictedRT. Slower RT was preceded by greater activation in the default-mode network, including lateral parietal, precuneus, and medial pre-frontal cortices; faster RT was preceded by greater activation in thesupplementary motor area (SMA). We examined the roles of thesebrain regions in vigilance by triggering trials based on brain statesdefined by blood oxygenation level-dependent activation measuredusing real-time fMRI. When activation of relevant neural systemsindicated either a good brain state (increased activation of SMA) or abad brain state (increased activation of lateral parietal cortex andprecuneus) for performance, a target was presented and RT wasmeasured. RTs on trials triggered by a good brain state were signif-icantly faster than RTs on trials triggered by a bad brain state. Thushuman performance was controlled by monitoring brain states thatindicated high or low vigilance. These findings identify neural sys-tems that have a role in vigilance and provide direct evidence that thedefault-mode network has a role in human performance. The ability tocontrol and enhance human behavior based on brain state may havebroad implications.
fMRI; state; behavior; control; human; attention; parietal; motor cortex
HUMANS EXHIBIT ALTERNATING periods of enhanced and degradedbehavioral performance (Verplank et al. 1952; Gilden et al.1995), which can partly be attributed to fluctuations in vigi-lance or general alertness (Warm and Parasuraman 2007). Theneural mechanisms of performance fluctuations are largelyunknown, but one factor influencing performance may be thebrain state that precedes action. Neuroimaging studies havefound correlation between prestimulus brain activation andperformance on subsequent trials (Fernández et al. 1999;Weissman et al. 2006; Fox et al. 2007; Boly et al. 2008; Leberet al. 2008), suggesting that the neural state before trial pre-sentation influences performance. These findings raise thepossibility that performance can be controlled by restrictingtrial presentation to times when the participant is most or leastprepared to perform.
We aimed to identify neural systems that underlie vigilancetask performance. In two experiments, we measured vigilance asreaction time (RT) to a temporally sparse and unpredictable cue.In experiment 1, we used functional magnetic resonance imaging(fMRI) to measure precue blood oxygenation level-dependent(BOLD) activations correlated with faster or slower RT to asubsequent target to define anatomically specific brain statesthat may enhance or degrade vigilance. We hypothesized thatgreater activation in motor-task planning regions (those exhib-iting premovement electrophysiological or neuroimaging ac-tivity) would be associated with enhanced vigilance and thusfaster RT. One such region is supplementary motor area(SMA) (Deecke and Kornhuber 1978; Cunnington et al. 2002).We also hypothesized that greater activation in brain regions ofthe default-mode network, a network more active during restthan during performance (Raichle et al. 2001), would beassociated with degraded vigilance. The default-mode networkhas been interpreted as mediating greater attention to internalthoughts relative to external percepts (Greicius et al. 2003;Weissman et al. 2006), although some studies argue thatportions of the default-mode network mediate stimulus-depen-dent thought (Gilbert et al. 2006).
In experiment 2, we aimed to determine whether prestimulusactivation in brain regions predictive of RT in experiment 1could be used to manipulate vigilance task performance. Weasked whether we could control performance by presentingtask cues only during brain states that were predicted to eitherfacilitate or degrade performance. Target presentation wasautomatically triggered by brain states (activation in regionspredictive of performance in experiment 1) measured continu-ously by real-time fMRI (rtfMRI). The key question waswhether human performance could be controlled by presentingstimuli during brain states associated with superior relative toinferior performance.
Previous research has shown that BOLD magnitude in task-relevant areas predicts behavioral performance (Brewer et al.1998; Wagner et al. 1998; Fernández et al. 1999; Ress et al.2000). In addition, studies of brain regulation have shown thattask performance can be affected (Rockstroh et al. 1990;Weiskopf et al. 2004; DeCharms et al. 2005; Caria et al. 2010).Our goal was to show that performance can be controlled bymanipulating trial presentation based on a real-time monitoringof brain state.
The use of rtfMRI to enhance human performance hasimplications beyond this vigilance task. First, such a discovery
Address for reprint requests and other correspondence: O. Hinds, 77 Mas-sachusetts Ave., 46-4033, Cambridge, MA 02139 (e-mail: [email protected]).
J Neurophysiol 109: 1250–1258, 2013.First published December 12, 2012; doi:10.1152/jn.00533.2011.
would open a new frontier for enhancing human performancethrough measurement of brain preparedness for optimal per-formance. Second, fMRI would become a method for manip-ulating human behavior based on activation, rather than merelycorrelating activation and behavior.
EXPERIMENT 1
Materials and Methods
Participants. Participants were healthy young adults who gaveinformed written consent as approved by the Massachusetts Instituteof Technology human participants committee (COUHES). There were15 participants (mean age: 26.3 yr; range: 21–34 yr; 6 females).
Vigilance task. Participants performed a classical vigilance task(Sturm et al. 1999) while in an MR scanner. The stimulus displayconsisted of a central fixation cross that transformed into a target(filled disk) upon trial presentation. Participants responded to thetarget by pressing a button with the right index finger (Fig. 1).Instructions were to stay alert and to respond to the target as quicklyas possible. No performance feedback or indication of experimentalcondition was provided to the participant.
fMRI acquisition. All scans were performed using a 3T Trio MRSystem and a 32-channel, phased-array head coil (Siemens Health-care, Erlangen, Germany). Structural scans were acquired using athree-dimensional T1-weighted MP-RAGE pulse sequence with avoxel size of 1 � 1 � 1 mm3, flip angle � 7°, echo time (TE) � 3.48ms, inversion time (TI) � 1,100 ms, repitition time (TR) � 2,530 ms,and GRAPPA in the phase encode direction with an accelerationfactor of 2. For functional scans, the BOLD signal was measuredusing a single shot gradient echo, echo-planar imaging (EPI) pulsesequence with imaging parameters: TR � 2,000 ms, TE � 30 ms,bandwidth � 2298 Hz, and flip angle � 90°. Thirty-two 3.5-mm thickslices (plus a 10% slice gap) were acquired during each TR within-plane resolution � 3.125 � 3.125 mm2.
The purpose of experiment 1 was to identify brain regions in whichactivation before target presentation predicted RT and to do so in arapid way so that these regions could be identified in each participantin experiment 2 as regions of interest (ROIs) in a localizer for rtfMRImonitoring of brain states. In experiment 1, each participant under-went an initial functional localizer scan to locate ROIs in default-mode and motor planning and performance brain regions. The local-izer task had three conditions: passive viewing of a fixation cross tolocate default-mode regions, performance from memory of a simple
Fig. 1. Schematic demonstrating the vigilance task and brain-state triggering experimental process. During scans for the study to determine brain regionspredictive of vigilance state, no real-time functional magnetic resonance imaging (fMRI) component was used, and the participant performed the vigilance taskdepicted at bottom with target appearance following a random schedule (between 16 and 26 s between trials). During scans for the study to control performance,vigilance brain state was monitored using real-time fMRI, as shown at top. If real-time fMRI analysis of supplementary motor area (SMA) and default-modeindicated a difference of �1SD for any measurement, a vigilance task trial was triggered (top right).
1251NEURAL BASIS OF VIGILANCE PERFORMANCE MEASURED WITH rtfMRI
sequence of button presses (AABABBAAABBB) with the right index(A) and middle (B) fingers to locate motor planning and performancebrain regions, and continuous tapping of the right index finger at a rateof about 1 Hz (data not used in this study). A complete cycle of thethree conditions lasted 48 s (16 s for each block). Six block cycleswere presented for a total imaging time of 4 min 48 s (144 measure-ments) for the functional localizer.
To image brain states predictive of vigilance performance, partic-ipants then underwent eight runs while performing the vigilance task.Vigilance trials were presented based on a predetermined stimulusschedule that was the same for every participant. There were between16 and 26 s separating task trials, with the schedule randomized andbalanced to cancel any consistent effect of lingering hemodynamicresponse from previous trials. Each vigilance task run lasted 5 min(150 measurements).
Defining default-mode and motor task-related ROIs. To defineROIs for individual participants, we first performed an fMRI analysison the functional localizer. Preprocessing was accomplished usingSPM5 (www.fil.ion.ucl.ac.uk/spm/). The localizer scan was motioncorrected by alignment to the temporal mean of the time series. Eachvolume was then spatially smoothed via convolution with an isotropicGaussian kernel of full-width at half-maximum of 6.25 mm in eachdimension, and voxel timeseries were temporally demeaned and highpass filtered with a cutoff period of 96 s.
To determine the average magnitude of BOLD activation duringthe sequence condition of the localizer task, we fit a general linearmodel (GLM) to each voxel time course. The GLM design matrixincluded a column representing hypothesized BOLD activation, whichwas generated by convolving a boxcar timeseries constructed of onesduring periods of motor sequence performance and zeros otherwisewith an estimate of the hemodynamic impulse response function (sumof 2 Gamma functions). This column of interest was accompanied bydesign matrix columns to account for signal components of no interest toour experiment, such as participant head motion parameters, the meanintensity over the time course, the temporal derivative of the column ofinterest (included to account for slight deviations from the model hemo-dynamic response), and BOLD activation during the continuous fingertapping condition.
We examined motor control activation (sequence � fixation) anddefault activation (fixation � sequence) via t-tests in a set of prede-termined motor performance-related and default-mode brain regions,respectively. Group-averaged ROI masks are shown in Fig. 2. ROIsfor each region were chosen from individual participant t maps, whichwere initially thresholded at t127 � 3.0 (P � 0.005, uncorrected for themultiple ROIs tested), and then the threshold was increased untilclusters of suprathreshold voxels separated between adjacent brainregions. This approach was necessary because we required a preciselydefined ROI and there is substantial individual variation in BOLDactivation strength among people. Although this process was observerdependent, in no case were subthreshold voxels included in an ROI. Ineach participant, we identified four ROIs more active during thesequence condition than during rest in motor control regions: primarymotor cortex, SMA, and bilateral cerebellum. We also identified fourROIs less active during the sequence condition than during rest: leftand right parietal lobes, medial prefrontal cortex (MPFC), and precu-neus. SMA, MPFC, and precuneus ROIs were bilateral, spanning theinterhemispheric fissure. Motor cortex ROIs were left-hemisphereonly (all participants were right handed).
All vigilance task functional scans were motion corrected to thesame target used for the functional localizer scan. Voxel time courseswere extracted from each ROI mask and then high-pass filtered witha cutoff period of 104 s (run specific) and converted to percent signalchange by subtracting the mean signal level over all collected timepoints within a particular voxel from each voxel time point, thendividing the result by the mean signal, and multiplying the result by100. The spatial mean signal of these preprocessed voxel time courses
was computed to yield a participant specific ROI time course over theeight runs of the vigilance experiment.
Correlation between pretrial BOLD and RT. The correlation be-tween RT and pretrial BOLD signal within each ROI for eachparticipant was computed via linear regression for independent sam-ples (custom analysis software implemented in MATLAB 7.5; Math-works, Natick, MA). Linear regression is sensitive to outliers becausea few extreme values can disproportionally affect regression modelparameters. This is potentially problematic in the context of vigilancebecause trials with long (or absent) RTs may represent a fundamen-tally different brain state than other slower than average trials andcould potentially dominate the regression. To minimize the influenceof outlier trial RTs on BOLD/RT correlations, we estimated theprobability density of the RT for each participant and derived anoutlier threshold that separated trials where the participant had im-probably long RT from “normal” responses. Local likelihood densityestimation (Loader 1999) (bin width � 0.01 ms, h � 0.025 ms) wasused to estimate the probability density function of RT for eachparticipant. The RT outlier threshold was then computed by estimat-ing the time separating the first (dominant) mode of the density from
Fig. 2. Experiment 1: group-averaged region of interest (ROI) masks derivedfrom the sequence condition of the functional localizer. ROIs were projectedonto individual participant brain surfaces, which were registered to a surfacetemplate to determine the average ROIs.
1252 NEURAL BASIS OF VIGILANCE PERFORMANCE MEASURED WITH rtfMRI
later (secondary) modes by computing the derivative of the densityand locating the first rising zero crossing using the same parametersused for estimating the density itself. Trials where RT exceeded thisthreshold (or were absent) were discarded. Over the whole group only4.1 � 3.9 (mean � SD) trials were discarded.
For each participant, the time course of BOLD/RT correlationswere computed at several lags relative to trial onset to produce a resultsimilar to a peristimulus-time correlation diagram. Over individuallags of between four TRs before and eight TRs after trial presentation,ROI BOLD measurements at that lag were correlated with RT on theassociated trial using linear regression. Pearson correlation coeffi-
cients r were converted into z-scores by z � log�1�r
1�r. The mean
BOLD/RT correlation across participants (within ROI) was tested forbeing different from zero using a one-tailed t-test based on directionof the functional localizer activation. The threshold was P � 0.05 forall analyses. In addition to the correlations between prestimulusactivation and RT, we examined the effects sizes of the ROI correla-tions, temporal evolution of the BOLD signal, and BOLD/RT corre-lations in each ROI and whether the level of spontaneous BOLDsignal just before trial presentation effected the degree of the evokedresponse.
Results
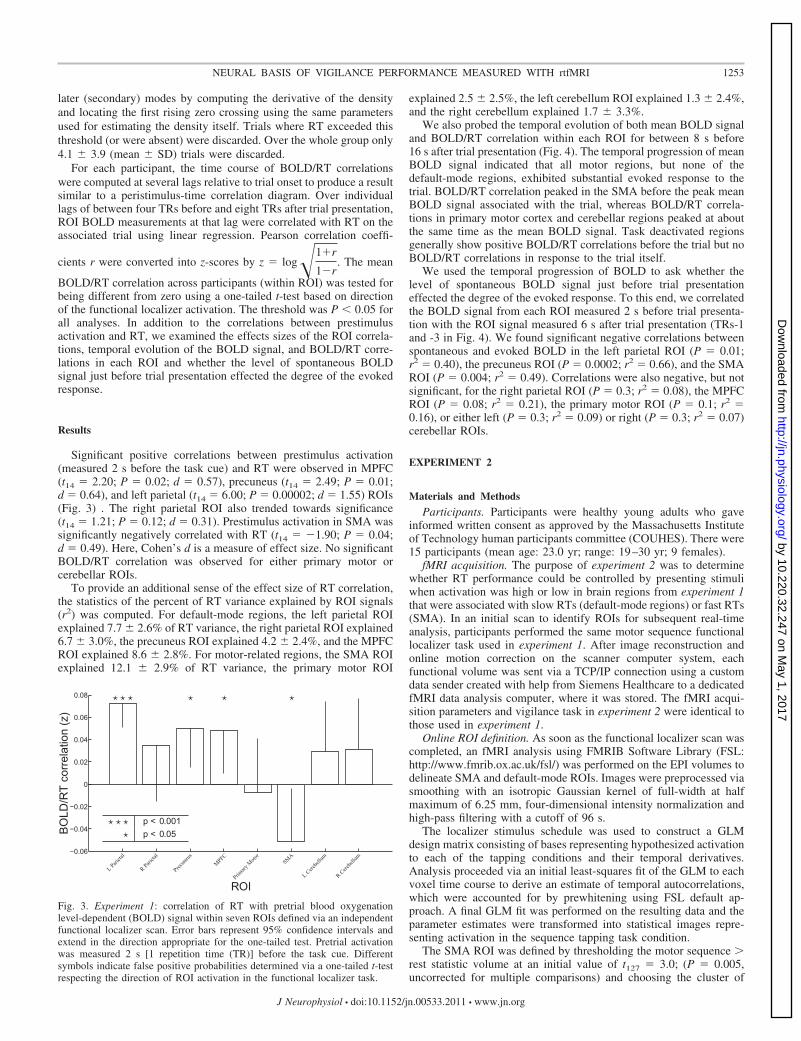
Significant positive correlations between prestimulus activation(measured 2 s before the task cue) and RT were observed in MPFC(t14 � 2.20; P � 0.02; d � 0.57), precuneus (t14 � 2.49; P � 0.01;d � 0.64), and left parietal (t14 � 6.00; P � 0.00002; d � 1.55) ROIs(Fig. 3) . The right parietal ROI also trended towards significance(t14 � 1.21; P � 0.12; d � 0.31). Prestimulus activation in SMA wassignificantly negatively correlated with RT (t14 � �1.90; P � 0.04;d � 0.49). Here, Cohen’s d is a measure of effect size. No significantBOLD/RT correlation was observed for either primary motor orcerebellar ROIs.
To provide an additional sense of the effect size of RT correlation,the statistics of the percent of RT variance explained by ROI signals(r2) was computed. For default-mode regions, the left parietal ROIexplained 7.7 � 2.6% of RT variance, the right parietal ROI explained6.7 � 3.0%, the precuneus ROI explained 4.2 � 2.4%, and the MPFCROI explained 8.6 � 2.8%. For motor-related regions, the SMA ROIexplained 12.1 � 2.9% of RT variance, the primary motor ROI
explained 2.5 � 2.5%, the left cerebellum ROI explained 1.3 � 2.4%,and the right cerebellum explained 1.7 � 3.3%.
We also probed the temporal evolution of both mean BOLD signaland BOLD/RT correlation within each ROI for between 8 s before16 s after trial presentation (Fig. 4). The temporal progression of meanBOLD signal indicated that all motor regions, but none of thedefault-mode regions, exhibited substantial evoked response to thetrial. BOLD/RT correlation peaked in the SMA before the peak meanBOLD signal associated with the trial, whereas BOLD/RT correla-tions in primary motor cortex and cerebellar regions peaked at aboutthe same time as the mean BOLD signal. Task deactivated regionsgenerally show positive BOLD/RT correlations before the trial but noBOLD/RT correlations in response to the trial itself.
We used the temporal progression of BOLD to ask whether thelevel of spontaneous BOLD signal just before trial presentationeffected the degree of the evoked response. To this end, we correlatedthe BOLD signal from each ROI measured 2 s before trial presenta-tion with the ROI signal measured 6 s after trial presentation (TRs-1and -3 in Fig. 4). We found significant negative correlations betweenspontaneous and evoked BOLD in the left parietal ROI (P � 0.01;r2 � 0.40), the precuneus ROI (P � 0.0002; r2 � 0.66), and the SMAROI (P � 0.004; r2 � 0.49). Correlations were also negative, but notsignificant, for the right parietal ROI (P � 0.3; r2 � 0.08), the MPFCROI (P � 0.08; r2 � 0.21), the primary motor ROI (P � 0.1; r2 �0.16), or either left (P � 0.3; r2 � 0.09) or right (P � 0.3; r2 � 0.07)cerebellar ROIs.
EXPERIMENT 2
Materials and Methods
Participants. Participants were healthy young adults who gaveinformed written consent as approved by the Massachusetts Instituteof Technology human participants committee (COUHES). There were15 participants (mean age: 23.0 yr; range: 19–30 yr; 9 females).
fMRI acquisition. The purpose of experiment 2 was to determinewhether RT performance could be controlled by presenting stimuliwhen activation was high or low in brain regions from experiment 1that were associated with slow RTs (default-mode regions) or fast RTs(SMA). In an initial scan to identify ROIs for subsequent real-timeanalysis, participants performed the same motor sequence functionallocalizer task used in experiment 1. After image reconstruction andonline motion correction on the scanner computer system, eachfunctional volume was sent via a TCP/IP connection using a customdata sender created with help from Siemens Healthcare to a dedicatedfMRI data analysis computer, where it was stored. The fMRI acqui-sition parameters and vigilance task in experiment 2 were identical tothose used in experiment 1.
Online ROI definition. As soon as the functional localizer scan wascompleted, an fMRI analysis using FMRIB Software Library (FSL:http://www.fmrib.ox.ac.uk/fsl/) was performed on the EPI volumes todelineate SMA and default-mode ROIs. Images were preprocessed viasmoothing with an isotropic Gaussian kernel of full-width at halfmaximum of 6.25 mm, four-dimensional intensity normalization andhigh-pass filtering with a cutoff of 96 s.
The localizer stimulus schedule was used to construct a GLMdesign matrix consisting of bases representing hypothesized activationto each of the tapping conditions and their temporal derivatives.Analysis proceeded via an initial least-squares fit of the GLM to eachvoxel time course to derive an estimate of temporal autocorrelations,which were accounted for by prewhitening using FSL default ap-proach. A final GLM fit was performed on the resulting data and theparameter estimates were transformed into statistical images repre-senting activation in the sequence tapping task condition.
The SMA ROI was defined by thresholding the motor sequence �rest statistic volume at an initial value of t127 � 3.0; (P � 0.005,uncorrected for multiple comparisons) and choosing the cluster of
−0.06
−0.04
−0.02
0
0.02
0.04
0.06
0.08
L Parietal
R Parietal
Precuneus
MPFC
SMA
PrimaryMotor
L Cerebellum
R Cerebellum
BO
LD/R
Tco
rrel
atio
n(z
)
ROI
p < 0.001p < 0.05
Fig. 3. Experiment 1: correlation of RT with pretrial blood oxygenationlevel-dependent (BOLD) signal within seven ROIs defined via an independentfunctional localizer scan. Error bars represent 95% confidence intervals andextend in the direction appropriate for the one-tailed test. Pretrial activationwas measured 2 s [1 repetition time (TR)] before the task cue. Differentsymbols indicate false positive probabilities determined via a one-tailed t-testrespecting the direction of ROI activation in the functional localizer task.
1253NEURAL BASIS OF VIGILANCE PERFORMANCE MEASURED WITH rtfMRI
above threshold voxels on the midline near the border of the frontaland parietal lobes. Default-mode ROIs were defined by thresholdingthe rest � motor sequence statistic volume and choosing threeclusters: one in the precuneus on the midline near the border of theparietal and occipital lobes, and one each in the right and left parietalcortex. The three separate default-mode ROIs were combined andtreated as a single ROI during the rtfMRI analysis. MPFC was notincluded in the default-mode ROI for real-time use because this brainregion exhibits substantial BOLD signal artifacts related to its prox-imity to the sinuses and mouth. Commonly, these artifacts are ac-counted for during data analysis post hoc, which is not possible in realtime.
To visualize the group ROIs, we used spatial normalization avail-able as part of the SPM5 software package to spatially warp the meanfunctional image of the localizer scan into Montreal NeurologicalInstitute (MNI) space. The resulting transformation was applied to theSMA and default-mode ROIs for each participant, resulting in ROIs inMNI space. The ROIs were then averaged across participants to createa map of the average location of SMA and default-mode ROIs. Forvisualization, this map was projected onto a surface representation ofthe cortex generated automatically by the FREESURFER softwarepackage (http://surfer.nmr.mgh.harvard.edu/) from a single participantstructural MRI scan (in MNI space) available as part of the MRICRONsoftware package (http://www.sph.sc.edu/comd/rorden). The SMA anddefault-mode ROI masks that were used to define brain state are shown(averaged over participants on a group average surface) in Fig. 5.
Controlling performance based on brain state. Participants under-went eight brain-state triggering fMRI scans, each lasting 6 min, whileBOLD fluctuations were measured using rtfMRI analysis as describedin Hinds et al. (2010). During triggering, functional runs of incoming
images from the scanner were analyzed to estimate activation levels inthe SMA and default-mode ROIs. To accomplish this, we performeda voxelwise incremental GLM fit where the design matrix includedbases to account for the mean voxel signal and linear trends. Also,
time relative to trial onset (TR)
RO
I BO
LD/R
T co
rrel
atio
n (z
)
−0.1
0
0.1left parietal
−0.1
0
0.1right parietal
−0.1
0
0.1precuneus
−0.1
0
0.1medial prefrontal cortex
−0.2
−0.1
0
0.1
primary motor
−0.2
−0.1
0
0.1
SMA
−0.2
−0.1
0
0.1
left cerebellum
−4 −3 −2 −1 0 1 2 3 4 5 6 7 8−0.2
−0.1
0
0.1
right cerebellum
time relative to trial onset (TR)
BOLD
sig
nal m
agni
tude
(%)
−0.8−0.4
00.40.8
left parietal
−0.8−0.4
00.40.8
right parietal
−0.8−0.4
00.40.8
precuneus
−0.8−0.4
00.40.8
medial prefrontal cortex
−0.40
0.40.81.2
primary motor
−0.40
0.40.81.2
SMA
−0.40
0.40.81.2
left cerebellum
−4 −3 −2 −1 0 1 2 3 4 5 6 7 8−0.4
00.40.81.2
right cerebellum
Fig. 4. Experiment 1: temporal progression of BOLD/RT correlation (left) and mean ROI BOLD %signal change (right) relative to trial onset in the vigilancetask. Error bars for BOLD/RT correlation (left) represent the 95% confidence interval for the one-tailed t-test based on the direction of ROI activation in theindependent functional localizer scan. Stars indicate a significant difference from zero after correction for comparison of multiple time points. Error bars forBOLD % signal change (right) are presented for reference only, and represent 99.9% confidence intervals for a two-tailed t-test after correcting the temporalprogression of each participant to the value at the time of trial onset.
Fig. 5. Experiment 2: regions that defined brain state. Group SMA (red) anddefault-mode (blue) ROIs after spatial normalization, group averaging, andprojection onto a cortical surface in Montreal Neurological Institute (MNI)space. Mean MNI coordinates of the ROIs were SMA: [�0.7, �2.2, 59.5],precuneus: [�0.4, �50.1, 31.3], left parietal: [�43.6, �64.3, 33.2], and rightparietal [48.4, �63.8, 27.3].
1254 NEURAL BASIS OF VIGILANCE PERFORMANCE MEASURED WITH rtfMRI
additional GLM bases were added in real time to account for theevoked hemodynamic response related to vigilance task trials.
To discount components of the voxel signal due to nuisancesources (e.g., low-frequency signal drifts), the GLM reconstruction ofthe expected voxel intensity at time t was subtracted from themeasured voxel intensity at time t, leaving a residual signal that hascomponents due to two sources: BOLD signal fluctuations and un-modeled fMRI noise. This residual was scaled by an estimate of voxelreliability, which was computed as the average GLM residual over thefirst 20 functional images, during which time no task trials werepresented. This analysis results in an estimate of the strength ofactivation at each voxel at time t in units of standard deviation (SD).
Activations in SMA and default-mode ROIs were computed as themedian SD of the voxels in each ROI. Brain state was defined as thedifference between SMA and default-mode ROI activations, with agood brain state defined by SMA activation greater than default-modeactivation by at least 1SD and a bad brain state defined by default-mode activation greater than SMA activation by at least 1SD. Ondetection of a brain state predictive of performance (good or a bad),a vigilance task 12 trials was triggered. To accomplish this, a signalwas sent to the stimulus computer via a TCP/IP connection, where thestimulus program received this signal and triggered a trial presenta-tion, to which RT was measured. To allow the BOLD responseresulting from a triggered target to return to baseline, no triggers werepossible during a 20-s window following a triggered trial. The timedelay between collection of a complete EPI volume and trial triggerwas �0.5 s. A schematic depicting the brain state monitoring and trialtriggering process is shown in Fig. 1.
Performance analysis. We assessed whether performance wassuccessfully controlled by examining the difference in speed ofperformance between trials triggered by good vs. bad brain states. Toevaluate behavioral control over the group, the mean RT differencefor each participant was entered into a t-test to determine whethergood state RT was faster than bad state RT. We computed thebehavioral difference between RT on trials triggered in good vs. badbrain state by first computing the within run difference between meanRT in each condition and then computing the mean difference acrossruns. We chose this approach because 1) the rtfMRI analysis treatseach run separately and therefore splitting the behavioral data intoruns accounts for potential differences in trigger criteria among them(e.g., due to run-specific noise factors), and 2) participant performancevaries over the course of the experiment and comparing behavioraldata collected nearby in time factors out global performancevariations.
This approach of computing behavioral difference in RT betweenconditions has the potential drawback that runs with relatively fewtrials will be weighted identically to runs with many trials. Todetermine if this was an issue, we computed the total number of trialsin each run for each participant and then computed the coefficient ofvariation of number of trials in a run over the eight runs. The numberof trials in each run was remarkably consistent within participant, witha mean (�SD) coefficient of variation of just 0.13 (�0.06).
We hypothesized that RTs on trials triggered by greater activationin default than SMA regions would be significantly slower than RTson trials triggered by greater activation in SMA than default regions(P � .05, paired t-test). We also performed additional analyses tocompare results from experiments 1 and 2, and to verify that findingswere not secondary to other factors, such as outlier behavioral values,sizes of individual ROIs, and ordering of good-state or bad-state trials,and that ROIs were similar, on average, across experiments 1 and 2.
Results
Mean vigilance task RT was significantly faster for trials triggeredby good brain states than by bad brain states: the means (�SE)difference in RT was 22 � 11 ms (t14 � �2.05; P � 0.03; d � 0.51,one-tailed, paired t-test; Fig. 6). Good-state trials were also signifi-
cantly faster than bad-state trials if overall means were analyzedindependent of runs (t14 � �2.07; P � 0.029) or after regressing outRT-interstimulus interval via standard linear regression (W� � 24;P � 0.021). Among participants, 73% (11/15) exhibited faster meanRT in good vs. bad brain state. On average, there were 46 � 2.1 goodand 41 � 1.9 (mean � SE) bad trials per participant over the wholeexperiment. There were 11.2 � 0.85 trials per run, and the averageinterstimulus interval was 32.3 � 2.5 s.
A post hoc analysis on the data collected in experiment 2 wasperformed using the same methods used for experiment 1. Theprogression of brain state relative to trial presentation was computedfor both good and bad brain states separately (Fig. 7A). Good and badbrain states are significantly different only at the time of trial presen-tation (P � 0.05, after correction for the 10 time points tested). Theprogression of the SMA and default-mode ROI signals were alsocomputed for both good and bad trials (Fig. 7B). The default-modeROI drives good brain states, while both ROIs contribute strongly tobad brain states.
To address the possibility that outlier participants drove the ob-served RT differences, we performed a post hoc analysis leaving outthe three participants who exhibited mean RT differences �1SD fromthe mean difference (�19.2 ms or �64.6 ms). After outlier participantexclusion, the good brain state RT was still significantly faster thanbad brain state RT (t11 � 2.5; P � 0.015), indicating that outlierbehavioral performance was not influencing the outcome.
The sizes of the ROIs used to trigger trials varied across individ-uals, but there was no significant relation between the size of any ROIand either mean RT difference or mean overall RT for any of the brainregions that were used for brain state monitoring (P � 0.1 for eachregion). Also, there was no significant difference between the numberof good and bad trials over participants (t14 � 1.72; P � 0.11), nocorrelation between the balance of good and bad trials and RTdifference between conditions (r2 � 0.002; P � 0.87), no temporaltrend in RT across the experimental session (t14 � 0.98; P � 0.34),and no relationship between interstimulus interval and RT (t14 � 0.78;P � 0.45).
An analysis of the asymmetry of the interstimulus interval betweengood and bad conditions (performed identically to the analysis of RTdifferences between conditions) revealed no significant differencebetween the interval preceding good and bad trials (mean within rundifference � SD � 0.3 � 2.7s; t14 � 0.38; P � 0.71). The mean �SD interstimulus interval preceding was 33.6 � 3.6 s for good trialsand 31.0 � 2.0 s for bad trials.
good bad300
350
400
450
RT
(ms)
Fig. 6. Experiment 2: group average reaction time (RT) data when trials weretriggered by detection of a good or bad brain state. RT was significantly fasterfor good than bad brain state trials (signed-rank test for good RT � bad RT:t14 � 2.05; P � 0.03). Error bars represent 95% confidence intervals computedconsidering the within participants nature of these comparisons (Cousineau2005).
1255NEURAL BASIS OF VIGILANCE PERFORMANCE MEASURED WITH rtfMRI
We verified that the ROIs used in experiment 1, which were definedafter the scanning, matched those used in experiment 2, which had tobe defined instantly during the scanning session. Group-normalizedparietal, precuneus, and SMA ROIs that were used to determinepredictive brain state in experiment 1 were plotted on an inflatedrepresentation of the cortical surface, and related to the ROIs used tomeasure brain state in experiment 2. Qualitatively, there was a highdegree of similarity in the ROIs (Fig. 8).
DISCUSSION
We found evidence for brain states in brain regions thatmodulate vigilance task performance as measured by RT tosparse and unpredictable visual targets. In experiment 1,greater activation in SMA and lesser activation in multipledefault-mode regions (MPFC, precuneus, and lateral parietal)predicted superior vigilance. In experiment 2, the roles ofactivation in SMA and precuneus and lateral parietal regionswere determined by evidence that vigilance performance couldbe controlled by triggering trials based on ongoing brain states.These findings help define neural systems important for vigi-lance and also show that rtfMRI can be used to monitor brainstates and alter human performance.
Brain Activation and Performance Fluctuations
This study relates separate lines of evidence for low-fre-quency fluctuations in task performance (Gilden et al. 1995)and low-frequency fluctuations in regional BOLD signal (Fox
et al. 2005). Our results demonstrate that these fluctuations arerelated for vigilance, while prior studies have shown relationsof such fluctuations to human performance. Variability inbutton press force correlated with BOLD fluctuations in pri-mary motor cortex across two TRs after trial presentation (Foxet al. 2007). We observed a similar effect in SMA, butcorrelation between RT and SMA BOLD was observed soonerand over a longer period, from between one TR before to threeTRs after trial presentation. Our findings that BOLD magni-tude and RT correlations peaked after stimulus presentation inprimary motor cortex are similar to the timing of the correla-tion between primary motor cortex and button press force (Foxet al. 2007). BOLD in cerebellar ROIs significantly correlatedwith RT two and three TRs after trial presentation. Prestimulusdefault-mode activation has also been associated with slowerRT (or “lapses of attention”) on a complex cognitive task(Weissman et al. 2006).
There is debate regarding the degree to which BOLD fluc-tuations reflect fluctuations in neural activity. Generally, stud-ies using “resting state” fMRI (Biswal et al. 1995; Greicius etal. 2003; Fox et al. 2005) assume that low-frequency BOLDfluctuations reflect fluctuations in the activity level of neuralpopulations. However, fluctuations in the BOLD signal couldinstead be attributable to the low-pass characteristics of thehemodynamic response to neural activity (Smith et al. 2008). Aprimate study using simultaneous fMRI and electrophysiologyreported that resting BOLD fluctuations were closely linked toneural processes (Shmuel and Leopold 2008). These findings,however, were subsequently interpreted as fluctuations evokedby unintended stimuli (Logothetis et al. 2009). Whereas theseprimate studies found strong empirical relations between neu-ral and BOLD fluctuations, another primate study reported thatunder periodic stimulus conditions the relationship betweenneural activity and the BOLD signal breaks down (Sirotin andDas 2008). Thus, even with invasive neural recordings inprimates, the precise relations between BOLD fluctuations andneural activity remain difficult to characterize.
The present findings, however, provide strong evidence thatlow-frequency BOLD fluctuations reflect neural and psycho-logical processes. Not only did the BOLD fluctuations in SMA
Fig. 8. Agreement between the parietal, precuneus, and SMA ROIs used inexperiment 1 and the default-mode and SMA ROIs used in experiment 2.Group-normalized and surface-projected ROIs for experiment 1 are shown inred (SMA) and blue (parietal and precuneus) and for experiment 2 in yellow(SMA) and cyan (default-mode). Regions of overlap are indicated in green.
−5 0 5 10 15
−0.5
0
0.5
BOLD signal progression for good vs. bad trials
post−stimulus time (s)BO
LD(%
sign
alch
ange
)
goodbad
−5 0 5 10 15
−0.5
0
post−stimulus time (s)
BO
LD(%
sign
alch
ange
)
SMADefault
−0.5
0
0.5
0.5
good trials
bad trials
ROI BOLD progression for good and bad trialsB
A
Fig. 7. Experiment 2: A: peristimulus-time diagram showing the progression ofbrain state (SMA minus default-mode ROI BOLD signal) relative to trialpresentation separated by trial type. Good trial brain state (dashed line) and badtrial brain state (solid line) are significantly different from one another only at thetrigger time. A substantial evoked response to the trial peaks at 6 s after trialpresentation for both good and bad trials. B: peristimulus-time diagram of theSMA and default-mode ROI signals for good trials (top) and bad trials (bottom).In both A and B, stars represent significant differences between the dashed andsolid lines after correction for comparison over the 10 time points.
1256 NEURAL BASIS OF VIGILANCE PERFORMANCE MEASURED WITH rtfMRI
and default-mode regions correlate with RT (experiment 1) butalso those fluctuations could be used with rtfMRI to controlvigilance task performance (experiment 2). There may well becircumstances where BOLD fluctuations do not reflect neuralactivity, but BOLD fluctuations in experiment 2 could only berelated to performance if they reflected neural activity and themental processes mediated by that activity. An interestingquestion that will be left as future work is the relationshipbetween the BOLD fluctuations we harnessed and the fluctu-ations that are commonly observed at rest.
Neuroanatomy of Vigilance in the Human Brain: SMA andDefault-Mode Network
The present study provided support for SMA and the pos-terior (parietal and precuneus) components of the default-modenetwork as important components of the vigilance system. Inexperiment 1, SMA was the only motor region in whichprestimulus activation correlated with faster RT, and the role ofprestimulus activation for faster RT was demonstrated in ex-periment 2. Such a prestimulus role for SMA is consistent withelectrophysiological and neuroimaging evidence about the roleof SMA in motor planning (Tanji 1994). Electrophysiologystudies in primates have found SMA neurons that fire preced-ing externally cued movements [reviewed in Nachev et al.(2008)]. In humans, electrical activity in SMA increases lead-ing up to the execution of self-initiated movements [the Bere-itschafts potential (Deecke and Kornhuber 1978)]. Neuroim-aging studies have also revealed activation in SMA beforeexternally cued movements such as those used in the presentstudy (Jahanshahi et al. 1995; Cunnington et al. 2002). Pre-stimulus warnings that decrease RT activate pre-SMA (Yanakaet al. 2010). Activation in the present study included both thepre-SMA and SMA proper, so we are unable to relate ourfindings to distinctions between pre-SMA and SMA. SMA isassociated with midbrain and thalamic circuits implicated inattention and vigilance (Sturm and Willmes 2001), but we didnot observe a predictive effect in any subcortical region.
In the present study, participants could not predict exactlywhen a stimulus would appear, but over time on a given trial itis likely that they increasingly anticipated stimulus arrival.This may have induced a Bereitschafts potential, which wedetected using rtfMRI, by presenting a target to allow comple-tion of this quasi-internally generated movement. Alterna-tively, the SMA signal we measured could be unrelated to theBereitschafts potential and simply indicate the degree of pre-paredness to respond to the cue in the absence of intentionality.
Experiment 2 provides evidence that activation in the de-fault-mode network can be used to manipulate human behav-ior. There is interest in understanding the function of thedefault-mode network, but such an understanding has relied onindirect measures because activation occurs in the absence ofbehavior; indeed the default-mode network is defined by brainregions showing greater activation during rest than duringactive performance. Two kinds of indirect evidence havesupported the hypothesis that the default-mode network medi-ates introspection rather than attention to the external environ-ment (Raichle et al. 2001; Greicius et al. 2003). First, activetasks requiring introspection activate components of the de-fault-mode network (Gusnard et al. 2001). The limitation ofsuch studies is that performing a task dictates that the default-
mode network is not in a default state. A second argumentcomes from studies showing that default-mode activation hasbeen associated with easier tasks (McKiernan et al. 2003),worse memory formation (Daselaar et al. 2004), attentionlapses (Weissman et al. 2006), more frequent mind wandering(Mason et al. 2007), and worse working memory performance(Whitfield-Gabrieli et al. 2009). In these studies, the behaviorsmeasured were thought to be mediated by other brain regionsthat mediate attention, memory, or skill learning, rather thanthe default-mode network. Indeed, the ambiguity in interpret-ing psychological functions of the default-mode network due toabsence of direct behavioral measurement is evident in analternative interpretation of these data: that default-mode re-gions mediate stimulus-dependent thought rather than stimu-lus-independent thought (Gilbert et al. 2006). Specifically,MPFC and posterior cingulate were associated stimulus-depen-dent task conditions.
The results of experiment 2, however, argue that the default-mode network is associated with stimulus-independentthought, because triggering stimulus presentation via activationin the default-mode network resulted in slower RTs (e.g.,worse stimulus-dependent performance). This is evidence thatactivation in the default-mode network is anticorrelated withthe efficiency of simple RT. We did not include MPFC inexperiment 2 for concerns about the ability to measure real-time BOLD in the region, but greater prestimulus activation inMPFC correlated with slower RTs in experiment 1, and low-frequency fluctuations during rest are highly correlated in thedefault-mode network (Fox et al. 2005), so it is likely that thefluctuations that drove stimulus presentation in experiment 2from the precuneus and parietal regions were highly correlatedwith MPFC activations. Therefore, although it appears thatthere are conditions during which default-mode activation maybe associated with stimulus-dependent thought (Gilbert et al.2006), the present findings provide direct evidence that default-mode activation is associated with worse stimulus-dependentperformance in the simplest behavioral case.
Controlling Human Performance
Controlling performance by monitoring brain states in spe-cific neural systems has potential applications in behaviorintervention and for testing neuroscientific hypotheses. Theability to objectively measure specific brain states makes en-hancement of performance or learning by presenting informa-tion during optimal brain states possible. Learning has beenenhanced in animals by triggering trials via invasively mea-sured theta activity (Seager et al. 2002; Griffin et al. 2004).Here we show that network-specific activation reflecting brainstates can be measured by rtfMRI and used to control perfor-mance noninvasively. Detection of brain states signaling po-tential subsequent performance errors can be used to remindthe participant to maintain vigilance, to modify task demandsonline, to assess the reliability of behavioral responses, or tohalt tasks altogether. Practical application of such knowledgewill demand translation of this method to more portable tech-nologies. Performance control via brain state monitoring mayalso have practical applications for testing novel neuroscien-tific hypotheses. Although fMRI is commonly used as amethod for correlating BOLD with behavior, brain state-trig-gering transforms fMRI into a method for manipulating behav-
1257NEURAL BASIS OF VIGILANCE PERFORMANCE MEASURED WITH rtfMRI
ior. Such a use of fMRI may provide a new method forcharacterizing the functions of regions in the human brain.
DISCLOSURES
No conflicts of interest, financial or otherwise, are declared by the author(s).
REFERENCES
Biswal B, Yetkin F, Haughton V, Hyde J. Functional connectivity in themotor cortex of resting human brain using echo-planar. Magn Reson Med34: 537, 1995.
Boly M, Phillips C, Balteau E, Schnakers C, Degueldre C, Moonen G,Luxen A, Peigneux P, Faymonville M, Maquet P, Laureys S. Conscious-ness and cerebral baseline activity fluctuations. Hum Brain Map 29: 868–874, 2008.
Brewer J, Zhao Z, Desmond J, Glover G, Gabrieli J. Making memories:brain activity that predicts how well visual experience will be remembered.Science 281: 1185, 1998.
Caria A, Sitaram R, Veit R, Begliomini C, Birbaumer N. Volitional controlof anterior insula activity modulates the response to aversive stimuli. Areal-time functional magnetic resonance imaging study. Biol Psychiatr 68:425–432, 2010.
Cousineau D. Confidence intervals in within-subject designs: a simpler solu-tion to Loftus and Masson’s method. Tutorial Quant Methods Psych 1:42–45, 2005.
Cunnington R, Windischberger C, Deecke L, Moser E. The preparation andexecution of self-initiated and externally-triggered movement: a study ofevent-related fMRI. Neuroimage 15: 373–385, 2002.
Daselaar S, Prince S, Cabeza R. When less means more: deactivations duringencoding that predict subsequent memory. Neuroimage 23: 921–927, 2004.
DeCharms R, Maeda F, Glover G, Ludlow D, Pauly J, Soneji D, GabrieliJ, Mackey, S. Control over brain activation and pain learned by usingreal-time functional MRI. Proc Natl Acad Sci USA 102: 18626–18631,2005.
Deecke L, Kornhuber H. An electrical sign of participation of the mesialsupplementary motor cortex in human voluntary finger movement. BrainRes 159: 473–476, 1978.
Fernández G, Brewer J, Zhao Z, Glover G, Gabrieli D. Level of sustainedentorhinal activity at study correlates with subsequent cued-recall perfor-mance: a fMRI study with high acquisition rate. Hippocampus 9: 35–44,1999.
Fox M, Snyder A, Vincent J, Corbetta M, Van Essen D, Raichle M. Thehuman brain is intrinsically organized into dynamic, anticorrelated func-tional networks. Proc Natl Acad Sci USA 102: 9673–9678, 2005.
Fox M, Snyder A, Vincent J, Raichle M. Intrinsic fluctuations within corticalsystems account for intertrial variability in human behavior. Neuron 56:171–184, 2007.
Gilden D, Thornton T, Mallon M. 1/f noise in human cognition. Science 267:1837–1839, 1995.
Greicius M, Krasnow B, Reiss A, Menon V. Functional connectivity in theresting brain: a network analysis of the default mode hypothesis. Proc NatlAcad Sci USA 100: 253–258, 2003.
Griffin A, Asaka Y, Darling R, Berry S. Theta-contingent trial presentationaccelerates learning rate and enhances hippocampal plasticity during traceeyeblink conditioning. Behav Neurosci 118: 403- 411, 2004.
Gusnard D, Akbudak E, Shulman G, Raichle M. Medial prefrontal cortexand self-referential mental activity: relation to a default mode of brainfunction. Proc Natl Acad Sci USA 98: 4259–4264, 2001.
Hinds O, Ghosh S, Thompson TW, Yoo JJ, Whitfield-Gabrieli S, Trian-tafyllou C, Gabrieli JD. Computing moment to moment bold activation forreal-time neurofeedback. Neuroimage 54: 361–368, 2011.
Jahanshahi M, Jenkins I, Brown R, Marsden C, Passingham R, Brooks D.Self-initiated versus externally triggered movements: I. An investigation
using measurement of regional cerebral blood flow with PET and move-ment-related potentials in normal and parkinson’s disease subjects. Brain118: 913–933, 1995.
Leber A, Turk-Browne N, Chun M. Neural predictors of moment-to-momentfluctuations in cognitive flexibility. Proc Natl Acad Sci USA 105: 13592–13597, 2008.
Loader C. Local Regression and Likelihood. New York: Springer, 1999.Logothetis, NK, Murayama, Y, Augath, M, Steffen, T, Werner, J, Oelter-
mann A. How not to study spontaneous activity. Neuroimage 45: 1080–1089, 2009.
Mason M, Norton M, Van Horn J, Wegner D, Grafton S, Macrae C.Wandering minds: the default network and stimulus-independent thought.Science 315: 393–395, 2007.
McKiernan K, Kaufman J, Kucera-Thompson J, Binder J. A parametricmanipulation of factors affecting task-induced deactivation in functionalneuroimaging. J Cogn Neurosci 15: 394–408, 2003.
Nachev P, Kennard C, Husain M. Functional role of the supplementary andpre-supplementary motor areas. Nat Rev Neurosci 9: 856–869, 2008.
Raichle M, MacLeod A, Snyder A, Powers W, Gusnard D, Shulman G. Adefault mode of brain function. Proc Natl Acad Sci USA 98: 676–682, 2001.
Ress D, Backus B, Heeger D. Activity in primary visual cortex predictsperformance in a visual detection task. Nature Neurosci 3: 940–945, 2000.
Rockstroh B, Elbert T, Birbaumer N, Lutzenberger W. Biofeedback-produced hemispheric asymmetry of slow cortical potentials and its behav-ioural effects. Int J Psychophysiol 9: 151–165, 1990.
Seager M, Johnson L, Chabot E, Asaka Y, Berry S. Oscillatory brain statesand learning: impact of hippocampal theta-contingent training. Proc NatlAcad Sci USA 99: 1616–1620, 2002.
Shmuel A, Leopold D. Neuronal correlates of spontaneous fluctuations infMRI signals in monkey visual cortex: implications for functional connec-tivity at rest. Hum Brain Map 29: 751–761, 2008.
Sirotin Y, Das A. Anticipatory haemodynamic signals in sensory cortex notpredicted by local neuronal activity. Nature 457: 475–479, 2008.
Smith S, Niazy R, Beckmann C, Miller K. Resting state networks-neitherlow frequency nor anticorrelated? Neuroimage 41, Suppl 1: S181–S227,2008.
Sturm W, de Simone A, Krause BJ, Specht K, Hesselmann V, Raderm-acher I, Herzog H, Tellmann L, Muller-Gartner HW, Willmes K.Functional anatomy of intrinsic alertness: evidence for a frontoparietal-thalamic-brainstem network in the right hemisphere. Neuropsychologia 37:797–805, 1999.
Sturm W, Willmes K. On the functional neuroanatomy of intrinsic and phasicalertness. NeuroImage 14: 76–84, 2001.
Tanji J. The supplementary motor area in the cerebral cortex. Neurosci Res19: 251–268, 1994.
Verplank W, Collier G, Cotton J. Nonindependence of successive responsesin measurements of the visual threshold. Exp Psychol 44: 273–282, 1952.
Wagner A, Schacter D, Rotte M, Koutstaal W, Maril A, Dale A, Rosen B,Buckner R. Building memories: remembering, and forgetting of verbalexperiences as predicted by brain activity. Science 281: 1188–1191, 1998.
Warm J, Parasuraman R. Cerebral hemodynamics and vigilance. In: Neu-roergonomics: The Brain at Work, edited by Parasuraman R, Rizzo M.Oxford, UK: Oxford Univ. Press, 2007, p. 147–158.
Weiskopf N, Scharnowski F, Veit R, Goebel R, Birbaumer N, Mathiak KSelf-regulation of local brain activity using real-time functional magneticresonance imaging (fMRI). J Physiol 98: 357–373, 2004.
Weissman D, Roberts K, Visscher K, Woldorff M. The neural bases ofmomentary lapses in attention. Nat Neurosci 9: 971–978, 2006.
Whitfield-Gabrieli S, Thermenos H, Milanovic S, Tsuang M, Faraone S,McCarley R, Shenton M, Green A, Nieto-Castanon A, LaViolette P.Hyperactivity and hyperconnectivity of the default network in schizophreniaand in first-degree relatives of persons with schizophrenia. Proc Natl AcadSci USA 106: 1279–1284, 2009.
Yanaka H, Saito D, Uchiyama Y, Sadato N. Neural substrates of phasicalertness: a functional magnetic resonance imaging study. Neurosci Res 68:51–58, 2010.
1258 NEURAL BASIS OF VIGILANCE PERFORMANCE MEASURED WITH rtfMRI