Page 1
Rolling Therapy Groups 1
Running head: ROLLING THERAPY GROUPS
Analytic Methods for Modeling Longitudinal Data from Rolling Therapy Groups with
Membership Turnover
Antonio A. Morgan-Lopez
RTI International
William Fals-Stewart
University of Rochester
Address correspondence to: Antonio A. Morgan-Lopez, Ph.D. Behavioral Health and Criminal Justice Research Division RTI International 3040 Cornwallis Road Marcus Hobbs Rm. 209 Research Triangle Park, NC 27709 919.541.1246 [email protected]
8 March 2007 (in press, appearing in the August 2007 issue (75(4)) of Journal of Consulting and Clinical Psychology)
Page 2
Rolling Therapy Groups 2
Abstract
Interventions for a variety of emotional and behavioral problems are commonly delivered
in the context of treatment groups, with many using rolling admission to sustain
membership (i.e., admission, dropout and discharge from group is perpetual and
ongoing). We present an overview of the analytic challenges inherent in rolling group
data and outline commonly-used (but flawed) analytic and design approaches used to
address (or sidestep) these issues. Moreover, we propose latent class pattern mixture
modeling (LCPMM) as a statistically and conceptually defensible approach for modeling
treatment data from rolling groups. The LCPMM approach is illustrated with rolling
group data from a group-based alcoholism pilot treatment trial (N = 128). Different
inferences were made with regard to treatment efficacy under LCPMM versus the
commonly used standard group-clustered latent growth model (LGM); coupled with other
preliminary findings in this area, inferences from LGMs may be overly liberal when
applied to data from rolling groups. Continued work on data analytic difficulties in
groups with membership turnover is critical for furthering the ecological validity of
research on behavioral treatments.
Key Words: group therapy; rolling admissions; group membership; missing data; pattern mixtures
Page 3
Rolling Therapy Groups 3
Psychosocial treatments for a variety of emotional and behavioral problems are
very commonly delivered by providers to patients in the context of treatment groups.
Indeed, many types of interventions, ranging from purely process-oriented approaches to
highly structured manualized treatments are delivered in the group therapy context (for a
review, see Fehr, 2003). For certain conditions, such as alcoholism and substance abuse,
delivery of treatment in groups has far surpassed the use of individual-based treatments
(e.g., a single patient and a single counselor meeting one-on-one for a therapeutic hour)
in community practice (NIAAA/NIDA, 2003).
Both therapeutic and economic factors account for the widespread use of group
therapy. From a clinical perspective, many authors have argued that the primary curative
mechanisms of group therapy are the interactions and interdependence of group members
(e.g., Fehr, 2003; Yalom, 1995). Therapeutically, group therapy (a) provides participants
with a safe context for observing and practicing interpersonal skills, (b) exposes
participants to immediate feedback from members and leaders about their behavior, and
(c) replaces or otherwise augments participants’ social networks with individuals (i.e.,
group leaders and members) who promote change by providing positive psychosocial
support. Fiscally, the cost profile of group therapy is superior to traditional individual-
based treatment because many more patients can be treated per investment of provider
time in a group therapy context (Rounsaville & Carroll, 1997; Weiss, Jaffe, de Menil &
Cogley, 2004).
Group Therapy: The Disconnect Between Community Practice and Research
Despite the widespread use of group therapy in community practice, the vast
majority of federally-funded research has focused on the development and empirical
Page 4
Rolling Therapy Groups 4
evaluation of individual-based treatments (e.g., NIAAA/NIDA, 2003). For example, a
recent meta-analytic review of substance abuse treatment outcome studies, covering the
last 30 years, found only 24 studies comparing group therapy to other conditions (Weiss
et al., 2004). As stated by Weiss and colleagues (2004), “The discrepancy between the
widespread use of group therapy in clinical practice and the paucity of research on this
topic stems, in part, from the inherent difficulties in conducting meaningful research on
group therapy” (p. 348). Many of the “inherent difficulties” which Weiss et al. allude to
include (a) difficulties in evaluating and assigning what occurs during the course of a
therapy group (i.e., group process); (b) limitations in the control over various elements of
treatment delivery; and (c) feasibility issues (e.g., time required to recruit a sufficient
number of participants for a cohort).
Our focus in this article is on one specific problem that has arguably been one of
the more vexing analytic challenges in the pursuit of ecological validity (i.e., matching
treatment research with treatment practice): namely, how is group interdependence
modeled when the treatment group membership itself changes over time (i.e., turnover) in
therapeutic contexts that incorporate an open enrollment for group members. This
paradigm is more commonly referred to as “rolling admission” (i.e., treatment group
members continually dropping out, terminating and/or joining the group after it initiates).
Rolling admission groups are very common in community practice, since this enrollment
strategy allows for providers to replenish groups when members drop out prematurely or
successfully complete treatment, thereby allowing the group to continue indefinitely
(Coviello et al., 2001).
Page 5
Rolling Therapy Groups 5
Proper modeling of group interdependence in data generated from clinical trials is
critical for two primary reasons, one of which is more conceptual and the other more
practical. First, accurate modeling of member interdependence can begin to capture and
evaluate, in a data analytic framework, the essence of what many have argued to be the
primary curative mechanism of positive therapeutic change. Second (and relatedly),
modeling group interdependence allows for an accurate accounting of group-level
variance components in an effort to illustrate the ratio of group-level variability to total
variability in the outcome (i.e., group-level intraclass correlation) and maintain the
nominal Type I error rate (e.g., p = .05) for treatment effect detection (Barcikowski,
1981; Hox, 2002).
Turnover in Rolling Groups
Although the analysis of longitudinal data from closed groups presents challenges
of its own, rolling groups present a much greater set of conceptual and methodological
complexities. For example, closed groups are dynamic to a certain extent because
members dropout during the course of the group. However, closed groups end at a
specified point in time and then are started anew with new members. Conversely, when
rolling groups are considered, there is added complexity to handling group
interdependence because of ongoing membership additions, terminations and dropouts.
Moreover, the life of these groups can be virtually unending; even when members of a
given group have changed entirely over time, the group itself retains, to a greater or lesser
extent, the history of the group, which, in turn, is likely to influence its process.
Unfortunately, models for analysis of data derived from groups with rolling
membership have not been fully explicated. Because group membership gradually or
Page 6
Rolling Therapy Groups 6
abruptly changes over time (e.g., new members are added to the group intermittently
while other members drop out or are removed), participants are not, in an analytic sense,
consistently nested within a given group because it is not the same “group” over time (at
least in terms of member composition).
Common Strategies Used to Analyze Data from Group Therapy Trials
As part of what is fast-becoming conventional practice, nearly all modern
analyses of longitudinal data from group-based treatment trials use some variant of the
longitudinal growth model (LGM) (e.g., random coefficient models in the mixed
modeling framework or structural equation modeling with individually-varying growth
parameters as latent variables), used to capture differences in changes over time on
outcomes as a function of treatment conditions while accounting for individual- and(/or)
group-level clustering of observations (Curran & Hussong, 2003; Fals-Stewart, Birchler,
& O’Farrell, 2003). However, there is one primary limitation with most approaches under
the generalized linear mixed modeling family (i.e., models that handle non-independence
and non-normal outcomes) with respect to changes in group membership over time: an
inherent assumption that the composition of the treatment group itself does not change1
(Morgan-Lopez & Fals-Stewart, 2006a). To date, there have not been satisfactory
analytic options to handling changes over time in treatment group membership in the
analysis of data from rolling groups.
Morgan-Lopez and Fals-Stewart (2006a) identified four common analytic and/or
design strategies that investigators have used to deal with difficulties posed by
conducting group therapy research: (a) include therapy groups in a study, but ignore the
dependencies among members and treat the resulting data from participants as if they
Page 7
Rolling Therapy Groups 7
were not nested in a group; (b) include group as a level in the analysis, but ignore the
changing group membership resulting from rolling admission; (c) design studies that use
closed-enrollment groups of a fixed duration so as to avoid the potentially dramatic
changes in membership often observed in rolling admission groups; or (d) avoid the
problem completely by designing investigations that simply do not use therapy groups.
Although these approaches sidestep certain problems inherent in studies that use rolling
groups, they have the potential to either lead to results and conclusions that are faulty
(approaches a and b above) or have contributed to a disconnect between how clinical
trials are conducted and how treatment is most commonly delivered in community
settings (approaches c and d above).
Given the interest in making treatment research more ecologically valid (NIDA,
2003), federal funding agencies have called for more research on group therapy and have
specifically highlighted the need to address the analytic complexities that we have
described thus far. It appears that there may be two generally viable approaches that have
potential for handling incomplete nesting in therapy groups. One such approach that has
emerged in behavioral genetics, and may have some potential utility in modeling therapy
group turnover, involves weighted random coefficient modeling among individuals
nested within groups (e.g., families). The strength of genetic dependencies will vary
within a family (e.g., monozygotic twins versus first cousins) and, as such, weights are
assigned to individuals within families to capture the differences in the relative
proportion of shared and unshared genotypic information (Guo & Wang, 2002; McArdle
& Prescott, 2005). In this case, the contribution to non-independence of observations
within a family will be weaker among family members that have less common genetic
Page 8
Rolling Therapy Groups 8
information. Although similar weighing approaches have been proposed for group
therapy research to accommodate group turnover (e.g., Morgan-Lopez & Fals-Stewart,
2006a) these approaches are underdeveloped outside of behavioral genetics; the analog in
group therapy research may likely be to weight individuals in the therapy group based on
a) the length of time individuals remain in the treatment group and/or b) the level of
turnover occurring in the group during the period the individual is a member of the group.
In this article, we examine the utility of latent class pattern mixture modeling
(LCPMM; Lin, McCulloch & Rosenheck, 2004; Muthén, Jo & Brown, 2003; Roy, 2003)
as a conceptually appealing and statistically defensible alternative to commonly used
approaches in the analysis of group therapy trials (e.g., ignoring dependencies among
members, failing to model changes in group membership). We describe the theoretical
underpinnings of LCPMM and how this emerging framework may be one of the more
theoretically attractive approaches presently available to handling session-to-session
changes in treatment group membership over time, taking into account differences in
treatment group attendance patterns and the point of the calendar year at which the
individual enters treatment. We then illustrate differences in results from the analysis of
longitudinal data from a group-based alcoholism treatment trial currently using a rolling
admission paradigm (Fals-Stewart, Birchler, O’Farrell, Klostermann & Evans, 2005)
under LGM for group cluster-correlated data2 and group cluster-correlated LCPMM.
Method
Participants
Participants were men (N = 128) entering outpatient treatment for an alcohol use
disorder. To be eligible, male participants had to (a) be married to a non-substance
Page 9
Rolling Therapy Groups 9
abusing female partner for at least one year or cohabiting with a non-substance abusing
female partner for at least two years; (b) meet current alcohol dependence criteria
according to the Diagnostic and Statistical Manual of Mental Disorders (4th ed., DSM-IV;
American Psychiatric Association, 1994); and (c) have alcohol as their primary drug of
abuse based on criteria described in Fals-Stewart (1996). Male participants were excluded
if their female partner met DSM-IV criteria for a current substance use disorder (except
for nicotine). Individuals seeking treatment in this outpatient study were not eligible for
admission if they displayed evidence of schizophrenia, delusional (paranoid) disorder, or
evidence of other psychotic disorders (on the basis of results of an initial brief screening
interview). All eligible participants were given an overview of the project and signed a
consent form indicating their understanding of the study and willingness to participate.
The project was approved by the Institutional Review Board of RTI International.
Measures
Alcohol use. The Timeline Followback Interview (TLFB; Sobell & Sobell, 1996)
uses a calendar and other memory aids to determine alcohol use over a specified period.
In this investigation, the TLFB was administered each week during the course of
treatment to determine days of alcohol use during the previous seven days (excluding the
day of the interview); for analyses in this article, alcohol use was converted to a binary
measure (yes/no) of any alcohol use in the past week.
Admission and therapy attendance dates. Log books maintained by the treatment
program were used to determine the dates when participants entered the trial and attended
sessions. These were cross-validated by examining session notes; there was complete
agreement between these sources. This information was used to determine the (a) week of
Page 10
Rolling Therapy Groups 10
the trial that the individual began treatment (referred to hereafter as “trial” week) and (b)
attendance patterns from weeks 2 through 12 for each individual regardless of what point
during the trial they began treatment (referred to hereafter as “person” week).
Procedure
Married and cohabiting men entering treatment for an alcohol use disorder (N =
163) were asked, along with their female partners, to participate in an extensive interview
to determine eligibility for the study. Of these, 16 (9.8%) male participants declined to
participate in the study. Of the remaining couples who agreed to be interviewed (n =
147), 19 (12.9%) met one or more exclusion criteria (e.g., couples with female partners
who met abuse or dependence criteria on alcohol or an illicit drug, alcohol not the
primary drug of abuse). Thus, 128 couples were included in the final sample.
Participants were then randomly assigned to one of two conditions: (a) Getting Along
(GA; Fals-Stewart, Nottingham, Skibicki & Birchler, 2004), a group therapy approach
designed to address marital and relationship problems, or (b) individual-based treatment
(IBT). Participant flow into the trial is illustrated in Figure 1. Restricted randomization
(i.e., blocking), using a computer program, was used to balance the groups in terms of
size. Condition assignment was concealed from participants until they arrived for their
first intervention session.
Description of Treatments
GA. For the 32 sessions conducted as part of this condition, male partners were
scheduled to attend twelve 90-minute group therapy sessions that focused on relationship
problems and enhancement. In this rolling group, session content focused on (a)
identifying relationship factors that might contribute to continued use or relapse; (b)
Page 11
Rolling Therapy Groups 11
problem-solving and negotiation strategies designed to help participants address
identified relationship problems; (c) teaching effective communication skills, such as
‘active listening’ and expressing feelings directly; and (d) enhancing relationship
satisfaction and increasing positive behavioral exchanges, encouraging participants to
acknowledge pleasing behaviors by their intimate partners and engaging in shared
recreational activities with their significant others. GA group session content was drawn
largely from that of Behavioral Couples Therapy (BCT) for alcoholism (see Fals-Stewart,
Birchler, & O’Farrell, 2003) and was adapted and manualized for therapy with male
partners-only groups (Fals-Stewart et al., 2004).
The group was conducted weekly during a 68-week period. As with any group
with rolling admission, group membership and size varied throughout the trial, with the
number of members in the group ranging from three to ten. To describe change in group
membership composition from week-to-week, we derived a Percentage of Group Change
Index (PGCI), which was calculated as 1 – ([number of members who remained the same
from the previous week] / [number of members who remained the same from the
previous week + the number of members who were present in the group that were not
present the previous week + the number of members from the previous week who were
missing compared to the previous week]) x 100. The mean (SD) PGCI for the GA group
was 40.2 (16.5), with a range of 0.0 (i.e., no change in membership from one week to the
next) to 80.0
In the remaining twenty 60-minute sessions, male participants attended one-on-
one therapy sessions with a counselor. The content of these individual sessions was the
same as that used for the IBT condition (see below).
Page 12
Rolling Therapy Groups 12
IBT. The 32 sessions conducted as part of this condition were 60-minute one-on-
one sessions between a provider and a patient. Individual session content was drawn from
the Individual Drug Counseling manual (Mercer & Woody, 1999), which was slightly
modified to focus on alcohol dependence; as noted in the manual, such modification is
acceptable due to the generic nature of the intervention itself. The treatment is founded
on the concept that alcoholism is a spiritual and medical disease, consistent with the
philosophy espoused by Alcoholics Anonymous (AA). Participants are encouraged not
only to achieve and maintain abstinence from alcohol and other psychoactive substances,
but also to attend Alcoholics Anonymous self-help support groups.
Analytic Approach
In the following section, we provide some background on latent class pattern
mixture models, a promising analytic approach for handling data from therapy groups
with changing membership. We do, however, presume some familiarity with longitudinal
growth models. For readers who are not familiar with longitudinal growth models, an
excellent, minimally-technical introduction to the basic LGM can be found in Curran and
Hussong (2003). For an introduction to LGM for longitudinal data nested within groups,
see Muthén (1997); for an example from the substance abuse treatment literature, see
Fals-Stewart, O’Farrell and Birchler (2004).
Missing data theory and rolling group structure. In many research contexts, the
impact of dropout has been accounted for in standard group cluster-correlated models
under the missing-at-random (MAR) assumption (Muthén & Muthén, 1998-2006;
Schafer & Graham, 2002). Under MAR, the probability of attendance3 may depend on
data that are observed but do not depend on data that are missing (Rubin, 1976; Schafer
Page 13
Rolling Therapy Groups 13
& Graham, 2002). If the MAR assumption holds then, as a consequence, the relations of
interest (e.g., treatment condition → growth in the outcome) will not differ as a function
of the cause of missingness (Hedeker & Mermelstein, 2000).
But in practice, there is a non-trivial likelihood that the MAR assumption will be
violated in the context of substance abuse treatment research. For example, Schafer and
Graham (2002) suggest that the MAR assumption is most likely to be violated in “clinical
studies in which reasons for dropout are closely related to the outcomes being measured”
(p.172); dropout may be directly related to the value that would have been observed (e.g.,
failing to attend group due to substance abuse relapse; see also Hedeker & Gibbons,
1997). It may also be unreasonable to expect that the treatment effect will not vary across
the cause of missingness. In the context of treatment research under rolling group
structure, this would be analogous to assuming that individuals who enter the treatment
group late (i.e., roll-ins) or who drop out of treatment early come from the same
population as individuals who stay in the treatment group consistently (Morgan-Lopez &
Fals-Stewart, 2006a); this also assumes that the treatment effect will be consistent across
each of these “sub-groups” (Hedeker & Gibbons, 1997; Hedeker & Mermelstein, 2000).
By not making any provision for differences in treatment efficacy among these sub-
groups (e.g., completers, early dropouts, late roll-ins, sporadic attendees) standard
longitudinal approaches may not properly account for sub-groups for whom the treatment
is less effective, particularly those that drop out of treatment early.
Pattern Mixture Approaches. Pattern mixture models (Hedeker & Gibbons, 1997;
Muthén, Kaplan & Hollis, 1987; Little, 1993) are an approach used to handle data that are
not-missing at-random (i.e., when the probability of missingness does depend on data that
Page 14
Rolling Therapy Groups 14
are missing). In pattern mixture models, individuals are classified by their patterns of
missing data and the parameters of interest are estimated separately across missing data
patterns; this has been done either through multiple-group approaches in structural
equation modeling (Allison, 1987; Muthén et al., 1987), modeling of missing data pattern
by predictor (i.e., treatment) interaction terms in the random coefficient modeling
framework (Hedeker & Gibbons, 1997) or more recent multiple imputation (MI)
approaches (Demirtas & Schafer, 2003; Schafer, 2003).
In the estimation of pattern mixture models, the interest is usually on a single set
of estimates that are averaged across the missing data patterns, with the pattern-specific
estimates weighted by sizes of the missing data patterns in the sample. This averaging is
done either through equality constraints (in the conventional multiple-group SEM
approach; Allison, 1987; Bollen, 1989; Muthén et al., 1987), matrix manipulation of
group-specific estimates (in random coefficient models; Hedeker & Gibbons, 1997) or by
including the missing data pattern indicators in the imputation model but excluding them
from the analysis model in MI (Demirtas & Schafer, 2003; Schafer, 2003).
However, the primary limitation on pattern mixture models under all of the
above-mentioned frameworks is that, as the number of missing data patterns become
large (and the number of observations within each pattern become sparse), it may become
impractical and/or impossible to identify and model all of the parameters within each
missing data pattern (Hedeker & Rose, 2000). A second limitation of conventional
pattern mixture models is that individuals with the same patterns of missing data are
treated as though they have equivalent probabilities of being from the same population,
but this has been shown to be untenable in practice (Roy, 2003).
Page 15
Rolling Therapy Groups 15
Latent class pattern mixture models (LCPMMs; see Lin, McCulloch &
Rosenheck, 2004; Muthén, Jo & Brown, 2003) are both an extension of conventional
pattern mixture models and a special case of the general latent variable model which can
simultaneously incorporate both continuous and categorical latent variables (Muthén,
2002). LCPMMs extend conventional pattern mixture models by incorporating a finite
number of underlying latent attendance classes (as opposed to subsetting across all
observed attendance patterns) (Muthén et al., 2003) which allows for probabilistic
membership of being in a particular attendance class (Muthén et al., 2003; Roy, 2003)
(See figure and captions under Figure 2). LCPMMs also allow differences in the
probability of attendance class membership for individuals with the same observed
pattern of missingness given the attendance patterns and the outcome trajectories are
modeled as indicators of class membership (Roy, 2003).
For practical purposes, the LCPMM has great potential for handling data from
rolling groups because, in addition to modeling a finite number of latent attendance
classes (e.g., people who attend most every session, dropouts, late-comers, irregular
attendees) within and across treatment groups in a trial, LCPMMs also allow for (a)
variability in the treatment effect across attendance patterns even for individuals in the
same treatment group and (b) modeling the point of treatment entry and attendance
pattern jointly as functions of latent attendance class membership. The key to the utility
of LCPMM for rolling group data is that, during any given point in the life of the trial, the
proportions of different types of attendance patterns (and, therefore, different subtypes of
patients) can vary at any given slice in time at which the trial is running. Moreover, as
Page 16
Rolling Therapy Groups 16
group composition changes (e.g., the proportion of dropouts decreases over time), it can
impact differences in treatment efficacy across any given snapshot of the group.
This approach may be critical in increasing the accuracy of inferences made from
treatment trial data with rolling groups. Preliminary simulation work has suggested that
standard group-clustered LGMs may increase the nominal Type I error rate to .20 or
greater when modeling data from rolling groups, while the nominal (i.e., p = .05) Type I
error rate was maintained under (weighted averaging of parameters across latent
attendance groups in) LCPMM analysis (Morgan-Lopez & Fals-Stewart, 2006b). Thus,
conventional methods may increase the likelihood that significant treatment effects are
detected in a sample when there are no differences in the population in analytic
frameworks where turnover is not explicitly modeled (Morgan-Lopez & Fals-Stewart,
2006a, 2006b).
Results
Sample Characteristics
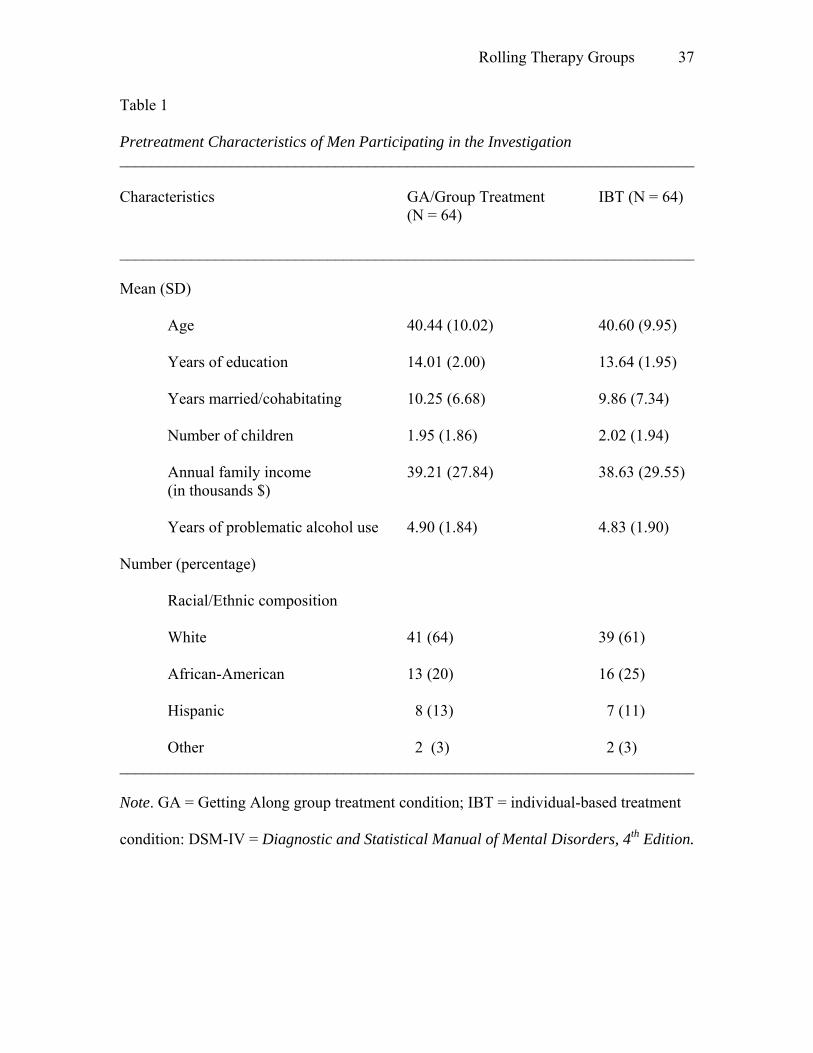
The pretreatment characteristics of participants assigned to the two conditions are
presented in Table 1. Random assignment was effective; comparisons of background
characteristics of participants assigned to GA or IBT revealed no significant differences
(i.e., all ps > .25).
Preliminary Identification of Functional Form
The group cluster-correlated finite mixture model within Mplus 4 (Muthén &
Muthén, 1998-2006) was used for all analyses under maximum likelihood estimation for
non-normal data (i.e., Mplus “MLR” estimation; see Yuan & Bentler, 2000). Prior to
fitting the models of interest, the observed alcohol use proportions across the 12 person-
Page 17
Rolling Therapy Groups 17
weeks were plotted in order to get a sense of the optimal functional form; assessing the
correct latent variable structure a priori also minimizes the likelihood of overextraction of
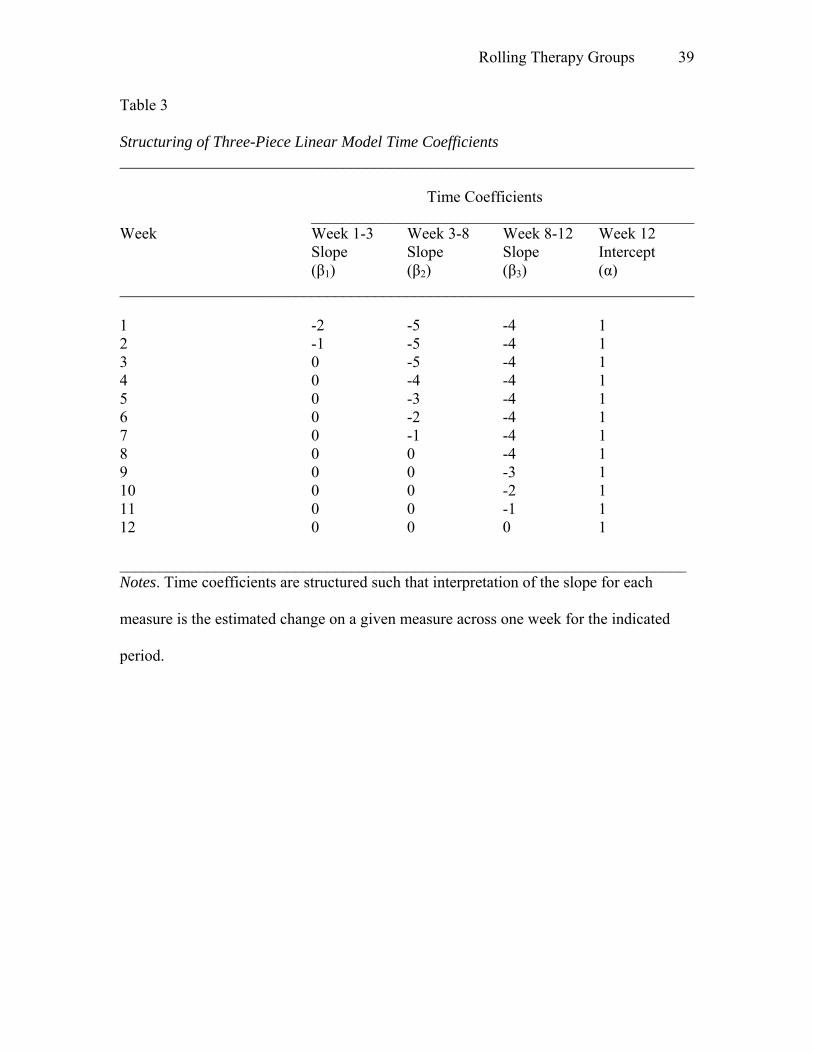
latent classes (Bauer & Curran, 2004). It was concluded that the optimal functional form
was piecewise linear with three distinct periods of growth: growth from weeks 1-3,
growth from weeks 3-8 and growth from weeks 8-12; the timesteps for each of these
three growth parameters (see Table 3) were structured such that the intercept was set at
the 12th person week (i.e., estimated level probability of use in the week prior to the
participant’s last treatment session). These periods of growth directly correspond to the
three distinct stages of treatment (initial evaluation, treatment of identified problems, and
planning for post-treatment) described recently by Fals-Stewart and Birchler (2006).
Graphical analyses were supplemented by a series of unconditional growth models (with
probit link functions for categorical outcomes for this and all subsequent analyses)
examined under various functional forms. Using the likelihood ratio χ2, the fit of the
above-described unconditional three-piece piecewise linear model (χ2(4064) = 169.917,
p=1.0) provided a significant improvement in fit over a conventional linear model (Δχ2(2)
= 23.26, p<.0001) and a quadratic model (Δχ2(1) = 9.153, p=.002) and was used as the
functional form of choice for all subsequent analyses.
Identification of Optimal Number of Attendance Classes
Next, a series of three-piece linear probit LCPMMs, with varying numbers of
latent attendance classes, was fit to determine the optimal number of classes4. As shown
in Table 2, global fit statistics (i.e., Bayesian Information Criterion (BIC), Entropy)
suggested that a 3-class solution was optimal.
Outcome Analysis 1: Standard LGM
Page 18
Rolling Therapy Groups 18
The first set of outcome analyses were conducted under group cluster-correlated
piecewise-linear LGM with four growth parameters (i.e., three individually-varying
slopes and an intercept at Week 12). These analyses are conducted and presented in order
to illustrate results from an analysis that represents the current standard for handling
longitudinal treatment data from individuals nested within treatment group(s) (e.g., Fals-
Stewart et al., 2004). More importantly, this first outcome analysis serves as the basis for
comparison against outcome analyses under the latent class pattern mixture framework.
Measures of effect size from both sets of analyses were calculated by converting t-test
values to r2s as recommended by Rosenthal and Rosnow (1991).
Conditional means of the growth parameters. The conditional means of the
growth parameters correspond to the growth parameter means for the IBT condition.
There were significant decreases in the probability of early alcohol use in the IBT
condition (from Weeks 1-3), b = -.590(.101), t = -5.844, p<.0001, r2 = .210); however the
decrease in alcohol use during the intermediate (Weeks 3-8; b = -.064(.044), t = -1.448, p
=.15, r2 = .016) and late periods (Weeks 8-12; b = -.089(.055), t = -1.634, p =.104, r2 =
.019) was non-significant.
Treatment effects. Differences in changes over time in the probability of alcohol
use across the Group Treatment versus IBT conditions from Weeks 1-3 were non-
significant, b = .114(.101), t = 1.12, p>.25, r2 = .009. Differences in changes over time in
the probability of alcohol use from Weeks 3-8 approached significance, b = .086(.044), t
= 1.954, p =.052, r2 = .028. Plots of the predicted probabilities of use across each
treatment condition based on the probit regression parameters showed participants in the
Group Treatment condition showed slight increases (from .22 in week 3 to .24 in week 8)
Page 19
Rolling Therapy Groups 19
in the probability of alcohol use while participants in the IBT condition showed decreases
(from .39 in week 3 to .31 in week 8) during the intermediate period of treatment.
Differences in changes over time in the probability of alcohol use from Weeks 8-12 were
significant, b = -.167(.055), t = 3.04, p=.002, r2 = .067. Predicted probability plots
suggested that the decreases in alcohol use from weeks 8 to 12 were steeper among
Group Treatment participants (.24 to .11) than among IBT participants (.31 to .27).
Finally, the difference between IBT participants (.27) and Group Treatment participants
(.11) at week 12 termination (intercept) was significant, b = -1.024(.225), t = -4.55,
p<.0001, r2 = .139.
Outcome Analysis 2: Three-Class LCPMM
A second outcome analysis was conducted under a three-class (group-cluster
correlated) LCPMM which, in contrast to Analysis 1, takes into account latent attendance
sub-groups (based on attendance probabilities from weeks 2-12) and the point of
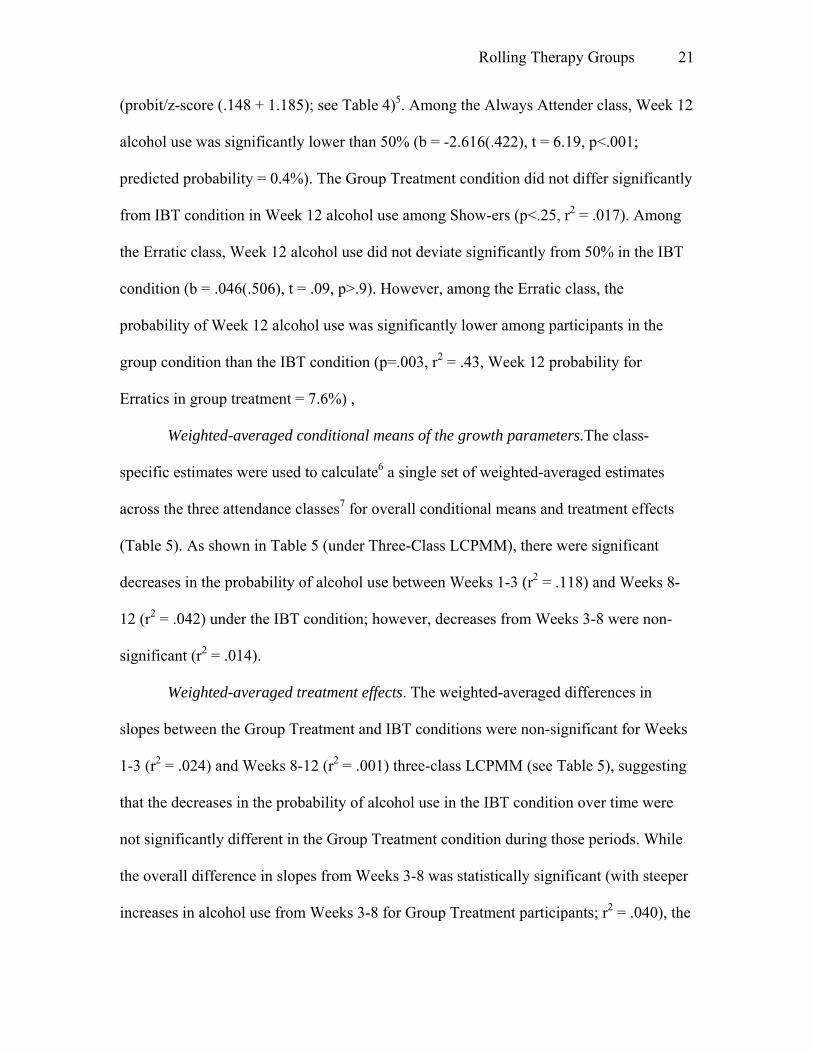
treatment group entry. The probabilities of attendance for each class are shown in Figure
3. Class 1 (Droppers) never exceeded a 42% percent probability of showing up for
treatment and by Week 10 were likely to have dropped out of the study entirely. Class 2
(Show-ers) never dropped below a 75% probability of showing up for treatment. Class 3
(Erratics) had a very erratic pattern of attendance, ranging from a high of 77% and a low
of 25% between weeks 2-9; however, this group had a very high likelihood of attending
treatment (>80%) the last three weeks. The probabilities of class membership in the
attendance pattern groups did not differ across the treatment conditions (ps>.071).
Distributions of the week of trial entry. Initial examination of the distributions of
the week of trial entry suggested that there were no differences between attendance
Page 20
Rolling Therapy Groups 20
groups in when individuals joined the trial. The mean and variance of starting week for
Droppers were 24.19 and 237.21. For Show-ers, the mean and variance were 26.33 and
272.91. For the Erratic class, the mean and variance were 24.75 and 304.55.
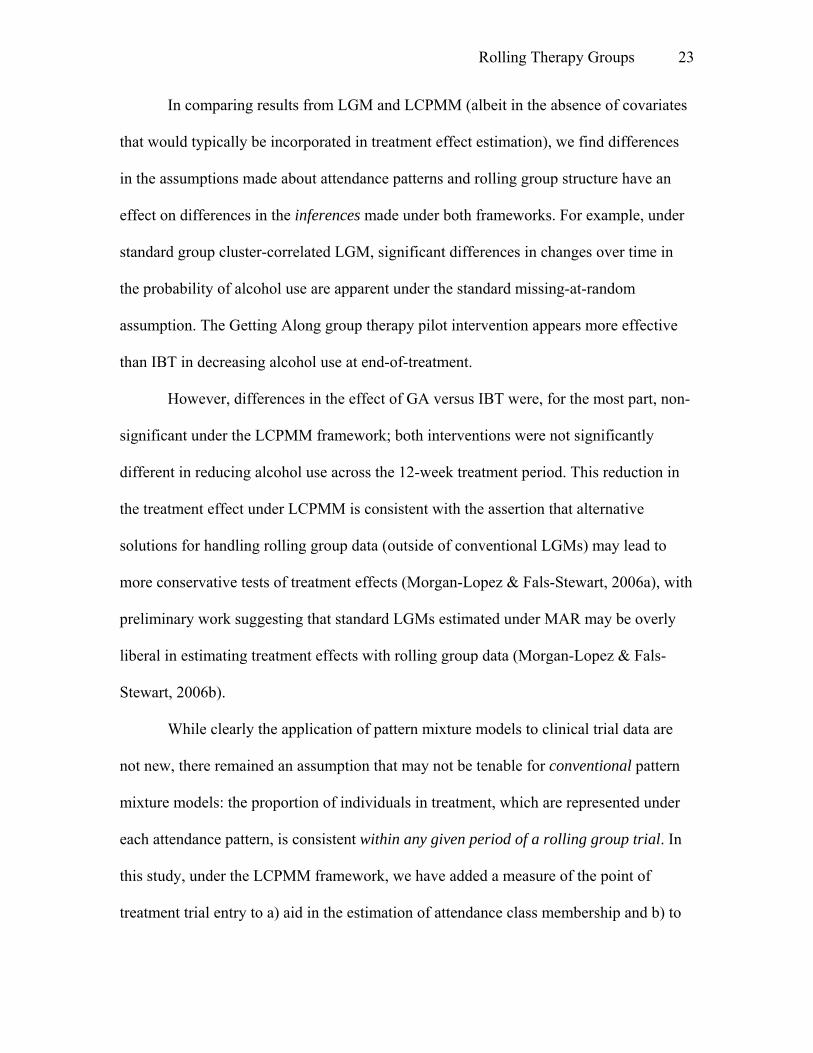
However, graphical analyses (i.e., histograms) and formal univariate tests of normality of
the starting week distributions (i.e., Shapiro-Wilks tests) suggested that the means and
variances were not sufficient to characterize these distributions (i.e., significant deviation
from normality; See Figure 4). While it appears that the proportion of Droppers and
Show-ers is fairly uniform across Weeks 1-56 of the trial (no new participants began
treatment after Trial Week 56), 50% of the participants that had Erratic attendance
patterns entered treatment between Weeks 1-5 of the trial or Weeks 41-45 of the trial.
This finding is key because the trial began in late November 2004 (i.e. the week before
Thanksgiving 2004), which suggests that (a) the Erratic attendance pattern was most
likely to occur among participants who would have been in treatment during the 2004
Winter holiday season (i.e., Thanksgiving through New Year’s) or mid-to-late August
2005 (i.e., End-of-Summer through Labor Day weekend) and (b) the proportions of
people (and thus the differential treatment effects) from each latent attendance class
depended on which part of the calendar year the trial was taking place.
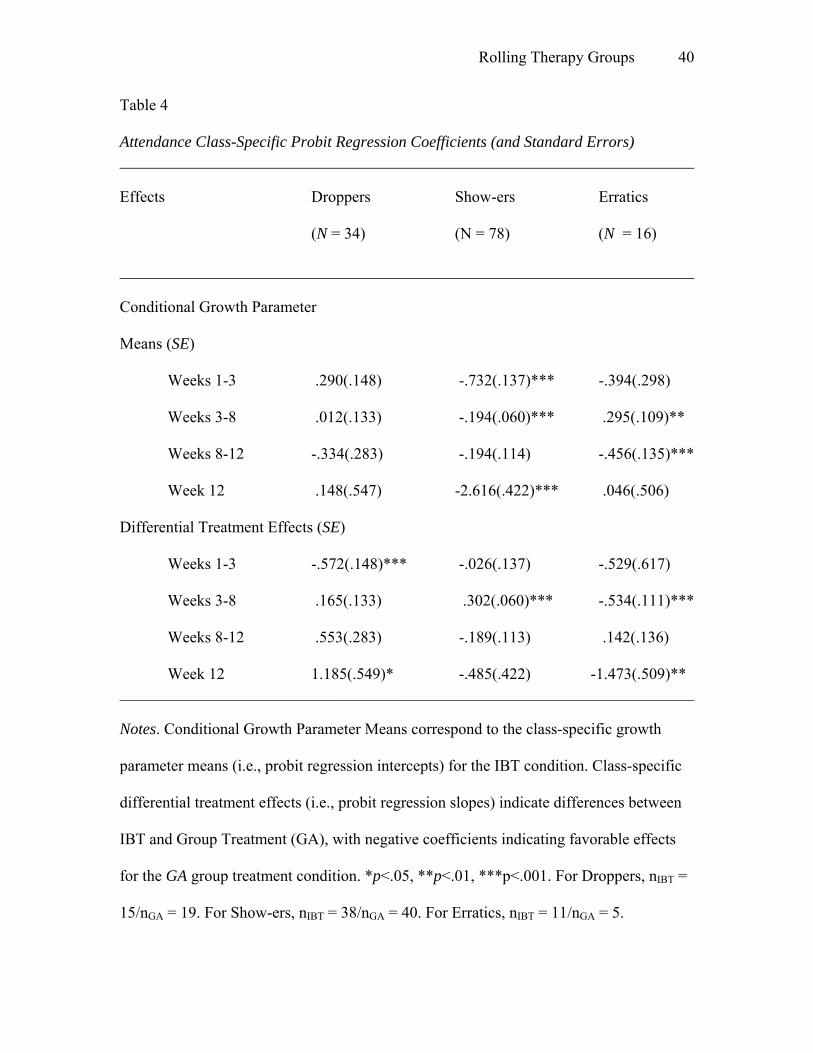
Class-Specific Parameter Estimates. Attendance class-specific growth parameter
and differential treatment effect estimates are shown in Table 4. For the Droppers class,
the Week 12 drinking probabilities did not deviate significantly from 50% in the IBT
condition (b = .148(.547), t = .27, p>.8). The difference between the group treatment
condition and IBT was significant among Droppers (r2 = .142) with the predicted
probability of Week 12 drinking among Droppers in the Group condition of 90.9%
Page 21
Rolling Therapy Groups 21
(probit/z-score (.148 + 1.185); see Table 4)5. Among the Always Attender class, Week 12
alcohol use was significantly lower than 50% (b = -2.616(.422), t = 6.19, p<.001;
predicted probability = 0.4%). The Group Treatment condition did not differ significantly
from IBT condition in Week 12 alcohol use among Show-ers (p<.25, r2 = .017). Among
the Erratic class, Week 12 alcohol use did not deviate significantly from 50% in the IBT
condition (b = .046(.506), t = .09, p>.9). However, among the Erratic class, the
probability of Week 12 alcohol use was significantly lower among participants in the
group condition than the IBT condition (p=.003, r2 = .43, Week 12 probability for
Erratics in group treatment = 7.6%) ,
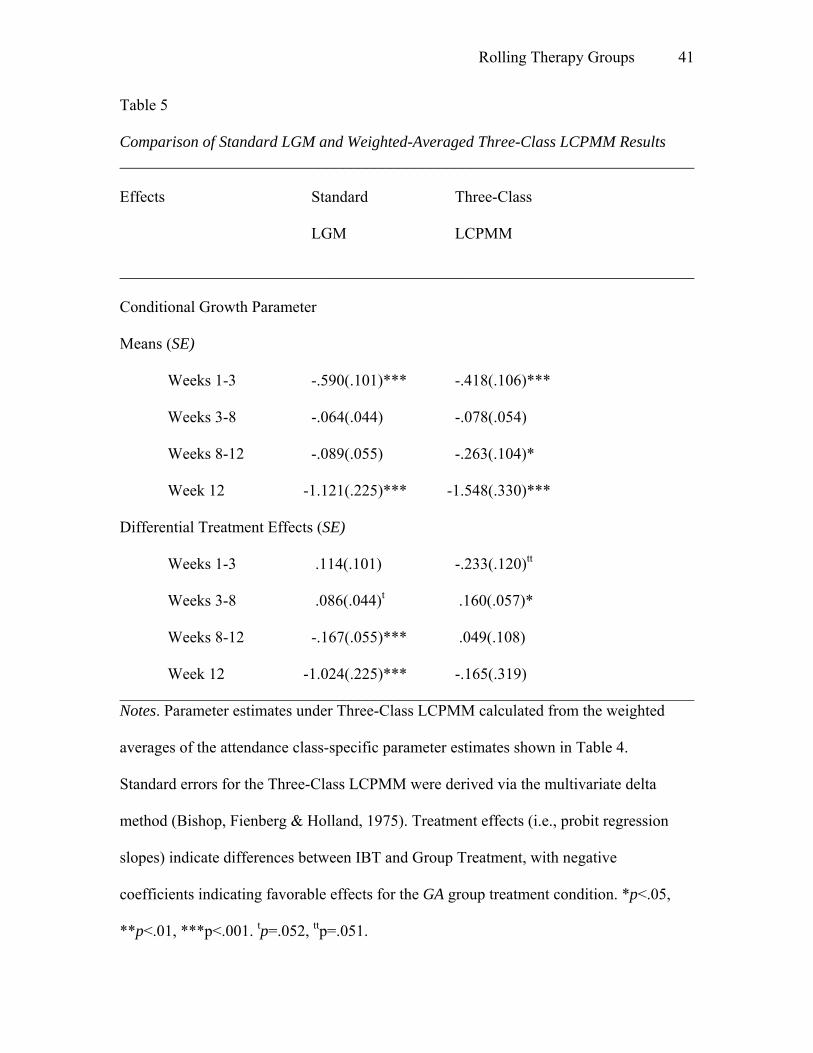
Weighted-averaged conditional means of the growth parameters.The class-
specific estimates were used to calculate6 a single set of weighted-averaged estimates
across the three attendance classes7 for overall conditional means and treatment effects
(Table 5). As shown in Table 5 (under Three-Class LCPMM), there were significant
decreases in the probability of alcohol use between Weeks 1-3 (r2 = .118) and Weeks 8-
12 (r2 = .042) under the IBT condition; however, decreases from Weeks 3-8 were non-
significant (r2 = .014).
Weighted-averaged treatment effects. The weighted-averaged differences in
slopes between the Group Treatment and IBT conditions were non-significant for Weeks
1-3 (r2 = .024) and Weeks 8-12 (r2 = .001) three-class LCPMM (see Table 5), suggesting
that the decreases in the probability of alcohol use in the IBT condition over time were
not significantly different in the Group Treatment condition during those periods. While
the overall difference in slopes from Weeks 3-8 was statistically significant (with steeper
increases in alcohol use from Weeks 3-8 for Group Treatment participants; r2 = .040), the
Page 22
Rolling Therapy Groups 22
overall difference at termination (i.e., Week 12) between the IBT and Group Treatment
conditions was non-significant (r2 = .002). These results suggest that under the LGM
framework, Group Treatment appears more efficacious than IBT; however, under the
LCPMM framework, Group Treatment was not differentially efficacious from IBT.
Discussion
The goals of this article were to (a) highlight the complexities of modeling
member interdependence in the presence of continual turnover in group therapy contexts
that have rolling admissions, (b) describe methods typically used to address these issues
and their limitations, and (c) present a more defensible approach to model data drawn
from trials that use rolling groups. We have drawn from recent advances in missing data
theory and modeling of unobserved categorical latent variables to make the case that
LCPMM is a defensible (and possibly necessary) alternative to standard Longitudinal
Growth Modeling approaches for this particular (and fairly common) clinical situation,
both of which were compared in this article. LCPMMs handle differences in attendance
that are attributable to data that are missing (i.e., non-ignorable missingness) in addition
to variability in treatment effects across attendance patterns for individuals within and
across treatment groups (Hedeker & Gibbons, 1997; Schafer & Graham, 2002) but does
so with a finite set of latent attendance patterns (Lin et al., 2004; Muthén et al, 2003). In
this study, we have added a measure of the point of treatment trial entry to aid in the
estimation of attendance class membership to allow for the possibility that the
“composition” of the treatment group (i.e., differences in the proportion of people from
each latent attendance class) varies at different points of the trial.
Page 23
Rolling Therapy Groups 23
In comparing results from LGM and LCPMM (albeit in the absence of covariates
that would typically be incorporated in treatment effect estimation), we find differences
in the assumptions made about attendance patterns and rolling group structure have an
effect on differences in the inferences made under both frameworks. For example, under
standard group cluster-correlated LGM, significant differences in changes over time in
the probability of alcohol use are apparent under the standard missing-at-random
assumption. The Getting Along group therapy pilot intervention appears more effective
than IBT in decreasing alcohol use at end-of-treatment.
However, differences in the effect of GA versus IBT were, for the most part, non-
significant under the LCPMM framework; both interventions were not significantly
different in reducing alcohol use across the 12-week treatment period. This reduction in
the treatment effect under LCPMM is consistent with the assertion that alternative
solutions for handling rolling group data (outside of conventional LGMs) may lead to
more conservative tests of treatment effects (Morgan-Lopez & Fals-Stewart, 2006a), with
preliminary work suggesting that standard LGMs estimated under MAR may be overly
liberal in estimating treatment effects with rolling group data (Morgan-Lopez & Fals-
Stewart, 2006b).
While clearly the application of pattern mixture models to clinical trial data are
not new, there remained an assumption that may not be tenable for conventional pattern
mixture models: the proportion of individuals in treatment, which are represented under
each attendance pattern, is consistent within any given period of a rolling group trial. In
this study, under the LCPMM framework, we have added a measure of the point of
treatment trial entry to a) aid in the estimation of attendance class membership and b) to
Page 24
Rolling Therapy Groups 24
allow for the possibility that the “composition” of the treatment group (i.e., differences in
the proportion of people from each latent attendance class) varies at different points of
the trial.
We found certain patterns of attendance8 (i.e., erratic) do not occur with
consistency throughout the life of the trial as do other latent attendance patterns (i.e.,
always attenders, dropouts). This erratic group is most interesting, particularly because
50% of the people in this group either entered the group during Weeks 1-5 of the trial or
between Weeks 41-45 of the trial. In mapping the trial weeks back to calendar dates,
these weeks correspond to the Winter holiday season and the end-of-summer/Labor
Day/Start-of-School. As a result, incorporation of the week of trial entry as part of
modeling attendance class membership may allow for the estimation (and incorporation
into overall treatment effects) of “holiday effects”, treatment effects and attendance
patterns that may only occur during certain predictable periods during the calendar year.
It is also interesting to note that, of all three attendance pattern groups, the erratic group
had the largest difference in treatment effects in the desired direction (See Table 4),
though caution is warranted as this group does have the smallest sample of all the
attendance groups.
These class-specific results may also suggest that individuals with different
patterns of treatment attendance may benefit from different modes of treatment delivery.
For example, individuals who stayed in alcoholism treatment seemed to benefit from
either treatment condition, regardless of the mode of delivery (group or individual).
Those who seek alcoholism treatment but may not be motivated to remain in treatment
seem to have worse outcomes in group settings, though outcomes from individual therapy
Page 25
Rolling Therapy Groups 25
are not ideal either. Finally, patients with erratic patterns of attendance have significantly
better treatment outcomes when the treatment is delivered in a group setting. This may
have implications for matching the mode of delivery to the patients’ potential likelihood
of engagement and retention in treatment, provided we could reasonably predict which
type or attendance pattern will unfold for individuals over time within treatment.
Although we have noted the methodological implications of this article, the
clinical implications are far more important and critical. In this illustration, we have made
different inferences concerning (lack of) differences in the efficacy of two approaches to
treating alcoholism from a pilot study with a rolling admission structure. This raises at
least two questions; the first question is “Which results are we to believe?” In asking this
question, we are essentially asking the question “Which set of assumptions of each
analytic approach (LGM, LCPMM) are closest to the reality of how rolling treatment
groups work?” Experts on missing data have weighed in and suggested that the
assumptions of standard LGMs (i.e., missing-at-random) may not be sufficient in the case
of treatment outcome studies in general (Hedeker & Mermelstein, 2000; Schafer &
Graham, 2002) much less trials with rolling group structure. Results from preliminary
simulation work on analytic approaches for rolling treatment groups are in line with this
thinking (Morgan-Lopez & Fals-Stewart, 2006b).
If it is indeed the case that LCPMMs give a more accurate picture of how rolling
treatment groups work and should be modeled, then the second question is “What are the
implications of these results for the treatment research community?” Given the ubiquity
of group therapy in general, and open enrollment paradigms in particular, it is incumbent
upon the research community to apply an analytic model that will lead to defensible
Page 26
Rolling Therapy Groups 26
inferences. The failure to do so can have substantial consequences, leading to advocacy
of interventions that appear more effective than alternatives when, in fact, they are not.
With federal agencies promoting and more research funds being directed toward
group therapy research, more and more clinical trials will appear in the empirical
literature that use rolling groups. Of course, this is a welcomed occurrence in that clinical
trials will more accurately reflect clinical practice. However, investigators are cautioned
to apply analytic models that can adequately capture the changing membership structure
of groups so as to avoid important inferential errors. If the LCPMM approach we are
advocating is used as defensible alternative to the more standard LGM, it is important to
emphasis that it is comparatively conservative. As such, larger samples will likely be
needed under LCPMM versus LGM for adequate statistical power, though work on
required sample sizes for adequate power in the case of rolling therapy groups is very
much in its infancy (e.g., Morgan-Lopez & Fals-Stewart, 2006b). The differences in the
methodologies must also take into account the differences in effect sizes across
approaches, such as the differences we have observed in this study.
We also recognize that many clinical investigators are not versed in LCPMM and
may avoid it use despite its validity in this situation. This is not so dissimilar to the
introduction of multilevel and standard latent growth models over a decade ago, which
were initially resisted due to what was viewed as their complexity, but are now fairly
commonplace in the empirical clinical research. Although LCPMM may be complex
analytically, it is an approach that is readily accessible to applied researchers8. It is also
an approach that can be used for different types of treatment trial designs (e.g., group
treatment v. no-treatment comparison conditions - provided contact during data collection
Page 27
Rolling Therapy Groups 27
can be reasonably considered a “session”); also, additional procedures for weighted
averaging of parameters across classes can be done when the treatment condition is
related to class membership (see the technical appendix; see also Hedeker & Gibbons,
1997, p.74-76).
Categorical versus Continuous Latent Attendance
With recent advances in latent variable modeling, there now exists the possibility
of modeling interactions with continuous latent variables (Mushin & Muthén, 1998-
2006); there may be interest in modeling treatment effect differences across a continuous
latent attendance construct as opposed to a categorical latent construct as we have
examined in this study9. However, our concern about proposing a continuous form of
latent attendance (i.e., a “regular” latent variable for “attend”) is two-fold: first, such an
approach would force an assumption of a constant linear increase or decrease in the
strength of the treatment effect across this continuous latent attendance variable (e.g., as
you move up the continuum from “dropout” to “full attender”, there is a constant shift in
the treatment effect). If this was the case, then we would have expected to see this
tendency in our data manifest itself in the rank-ordering of treatment effects from the
three classes, with the estimates from the erratic group in the middle of the rank-ordering
from largest-to-smallest (e.g., attenders → erratics → droppers) or smallest-to-largest
(e.g., droppers → erratics → attenders). Such an approach also runs counter to the way
missing data experts have conceptualized missing data patterns under NMAR (i.e.,
categories), either through observed missing data groupings (Demirtas & Schafer, 2003;
Hedeker & Gibbons, 1997) or latent missing data groupings (Lin et al, 2004; Muthén et
al., 2003).
Page 28
Rolling Therapy Groups 28
Conclusion
Treatment researchers wish to examine the therapeutic effects of rolling groups,
but have not had the necessary analytic tools to model the resulting data in a statistically
valid fashion. This has placed investigators in the untenable position of either using
analytic approaches that may be more likely to lead to incorrect inferences, in spite of
“doing the best they can with what they have” in many cases (e.g. Fals-Stewart et al.,
1993, 2004), or avoiding the problem altogether by not including rolling therapy groups
in their designs. Thus, despite the call from federal agencies and community treatment
providers for more research on group therapy, the lack of a solution to analytic challenges
of rolling group data has had a stifling effect on this area of research (NIDA, 2003).
Although it would be naïve to suggest that analytic barriers are the only ones hindering
group therapy research, it has be recognized as a major hurdle (Morgan-Lopez & Fals-
Stewart, 2006a; NIDA, 2003; Weiss et al., 2004) and, as such, a concerted effort to
address these problems is clearly needed. Ultimately, it is our hope that work on this
approach for handling data from substance abuse treatment trials with turnover resulting
from open enrollment (along with work on promising approaches from other areas) will
spur continued discussion and thought about issues surrounding open enrollment
paradigms among treatment researchers and methodologists alike. Such a dialogue will
hopefully help move treatment research and treatment-in-practice closer together in terms
of ecological validity (NIDA, 2003).
Page 29
Rolling Therapy Groups 29
References
Allison, P. D. (1987). Estimation of linear models with incomplete data. In K. Schuessler
(Ed.), Sociological Methodology 1987 (pp. 71–103). San Francisco: Jossey-Bass.
Barcikowski, R. S. (1981). Statistical power with group mean as the unit of analysis.
Journal of Educational Statistics, 6, 267–285.
Bauer, D.J., & Curran, P.J. (2004). The integration of continuous and discrete latent
variable models: Potential problems and promising opportunities. Psychological
Methods, 9, 3-29.
Bishop, Y., Fienberg, S. & Holland, P. W (1975). The delta method for calculating
asymptotic distributions. Discrete Multivariate Analysis: Theory and Practice
(pp. 487-500). Cambridge, MA: MIT Press.
Blalock, H. M. (1990). Auxiliary measurement theories revisited. In J. J. Hox & J. De
Jong-Gierveld (Eds.), Operationalization and research strategy. Amsterdam:
Swets & Zeitlinger.
Bollen, K.A. (1989) Structural equations with latent variables. New York: John Wiley &
Sons.
Coviello, D. M., Alterman, A. I., Rutherford, M. J., Cacciola, J. S., McKay, J. R., Zanis,
D. A. (2001). The effectiveness of two intensities of psychosocial treatment for
cocaine dependence. Drug and Alcohol Dependence, 61, 145–154.
Curran, P.J., & Hussong, A.M. (2003) The use of latent trajectory models in
psychopathology research. Journal of Abnormal Psychology, 112, 526-544.
Demirtas, H. & Schafer, J.L. (2003) On the performance of random-coefficient pattern-
mixture models for non-ignorable drop-out. Statistics in Medicine, 22, 2553-2575.
Page 30
Rolling Therapy Groups 30
Fals-Stewart, W. (1996). Intermediate length neuropsychological screening of
impairment among psychoactive substance-abusing patients: A comparison of two
batteries. Journal of Substance Abuse, 8, 1-17.
Fals-Stewart, W., Bircher, G. R., O’Farrell, T. J., Klostermann, K., & Evans, D. (2005,
August). Learning sobriety together: Fellows presentation. Paper presented at the
Annual Convention of the American Psychological Association, Washington, DC.
Fals-Stewart, W., Marks, A.P., & Schafer, J. (1993) A comparison of behavioral group
therapy and individual behavior therapy in treating obsessive-compulsive
disorder. Journal of Nervous and Mental Disease, 181, 189–193.
Fals-Stewart, W., O’Farrell, T. J., & Birchler, G. R. (2004) Behavioral Couples Therapy
for substance abuse: Rationale, methods, and findings. Science and Practice
Perspectives, 2, 30–41.
Fehr, S. S. (2003). Introduction to group therapy: A practical guide. New York: Haworth
Press. Flores, P. (1988). Group psychotherapy with addicted populations. New York: The
Haworth Press.
Guo, G. & Wang, J. (2002). The mixed or multilevel model for behavior genetic
analysis. Behavior Genetics, 32, 37-49.
Hedeker, D., & Gibbons, R. D. (1997). Application of random-effects pattern-mixture
models for missing data in longitudinal studies. Psychological Methods, 2, 64–78.
Hedeker D. & Mermelstein, R. (2000) Analysis of longitudinal substance use outcomes
using ordinal random-effects regression models. Addiction, 95, S381-S394.
Page 31
Rolling Therapy Groups 31
Hedeker, D. & Rose, J.S. (2000) The natural history of smoking: a pattern-mixture
random-effects regression model. In Rose, J.S., Chassin, L., Presson, C.C., &
Sherman. S.J. (Eds). Multivariate Applications in Substance Use Research (pp.
79-112); Hillsdale, NJ: Erlbaum.
Hox, J. (2002). Multilevel analysis. Techniques and applications. Mahwah, NJ: Erlbaum.
Lin, H.Q., McCulloch, C.E., & Rosenheck, R.A. (2004) Latent pattern mixture model for
informative intermittent missing data in longitudinal studies. Biometrics, 60, 295-
305.
Little, R. J. A. (1993). Pattern-mixture models for multivariate incomplete data. Journal
of the American Statistical Association, 88, 125–134.
McArdle, J. J., & Prescott, C. A. (2005). Mixed-effects variance components models
for biometric family analyses. Behavior Genetics, 35, 631-652.
Morgan-Lopez, A.A. & Fals-Stewart, W. (2006a) Analytic complexities associated with
group therapy in substance abuse treatment research: Problems,
recommendations, and future directions. Experimental & Clinical
Psychopharmacology, 14, 265-273.
Morgan-Lopez, A.A. & Fals-Stewart, W. (2006b) The utility of latent class pattern
mixture modeling in handling data from substance abuse treatment trials with
rolling admissions. Paper presented at the UCLA Center for Advancing
Longitudinal Drug Abuse Research (CALDAR) Summer Research Institute, Los
Angeles, August 14, 2006.
Muthén, B. (1997). Latent variable modeling of longitudinal and multilevel data. In A.
Raftery (Ed.), Sociological methodology (pp. 453–480). Boston, MA: Blackwell.
Page 32
Rolling Therapy Groups 32
Muthén, B. (2002). Beyond SEM: General latent variable modeling. Behaviormetrika, 29,
81–117.
Muthén, B., Kaplan, D., & Hollis, M. (1987). On structural equation modeling with data
that are not missing completely at random. Psychometrika, 52, 431–462.
Muthén, B.O., Jo, B. & Brown, C.H. (2003) Comment on the Barnard, Frangakis, Hill &
Rubin article, Principal stratification approach to broken randomized experiments:
A case study of school choice vouchers in New York City. Journal of the
American Statistical Association, 98, 311-314.
Muthén, L.K. & Muthén, B.O. (1998-2006) Mplus Users Guide (Fourth Edition). Los
Angeles: Muthén & Muthén.
National Institute on Drug Abuse (2003, April) Group therapy research. Workshop
sponsored by the NIDA Behavioral Treatment Branch. Meeting summary
available via World Wide Web at
http://www.drugabuse.gov/whatsnew/meetings/grouptherapy.html.
National Institute on Alcohol Abuse and Alcoholism & National Institute on Drug Abuse
(2003) Request for applications for group therapy for individuals in drug abuse
and alcoholism treatment (RFA-DA-04-008). Washington, DC: Department of
Health and Human Services.
Rosenthal, R. & Rosnow, R. L. (1991). Essentials of behavioral research: Methods and
data analysis (2nd ed.). New York: McGraw Hill.
Rounsaville, B. J., & Carroll, K. M. (1997). Individual psychotherapy. In. J. H.
Lowinson, P. Ruiz, R. B. Millman, & J. G. Langrod (Eds.), Substance abuse: A
comprehensive textbook (3rd ed., pp. 430–439). Baltimore: Williams & Wilkins.
Page 33
Rolling Therapy Groups 33
Roy, J. (2003). Modeling longitudinal data with nonignorable dropouts using a latent
dropout class model. Biometrics, 59, 829–836.
Rubin, D. B. (1976). Inference and missing data. Biometrika, 63, 581–592.
Schafer, J.L. (2003). Multiple imputation in multivariate problems where the imputer's
and analyst's models differ. Statistica Neerlandica, 57, 19-35.
Schafer J. L, & Graham, J. W. (2002). Missing data: Our view of the state of the art.
Psychological Methods, 7, 147–177.
Weiss, R. D., Jaffe, W. B., de Menil, V. P., Cogley, C. B. (2004). Group therapy for
substance use disorders: What do we know? Harvard Review of Psychiatry, 12,
339–350.
Yalom, I. (1995). The theory and practice of group psychotherapy (4th ed.). New York:
Basic Books.
Yuan, K.H., & Bentler, P. M. (2000). Three likelihood-based methods for mean and
covariance structure analysis with nonnormal missing data. Sociological
Methodology 2000 (pp. 165-200). Washington, DC: American Sociological
Association.
Page 34
Rolling Therapy Groups 34
Author Note
Antonio A. Morgan-Lopez, Ph.D., RTI International, Behavioral Health and Criminal
Justice Research Division, Research Triangle Park, North Carolina 27709. William Fals-
Stewart, Ph.D., School of Nursing and Department of Psychiatry, University of
Rochester, Rochester, New York, 14642. This project was supported by the National
Institute on Drug Abuse through grant R21DA021147 awarded to Antonio A. Morgan-
Lopez (AM-L). This project was also supported by the following NIDA grants awarded
to William Fals-Stewart (BF-S): R01DA012189, R01DA014402, R01DA014402-SUPL,
R01DA015937, R01DA016236 and R01DA016236-SUPL. Support of this project by the
National Institute on Alcohol Abuse and Alcoholism comes through grant R21AA016543
(AM-L, PI). Additional support for this project comes from a grant from the Alpha
Foundation (BF-S, PI). We wish to acknowledge the comments and contributions of
Bengt O. Muthén (via the Mplus discussion board) and Joseph L. Schafer to this work.
Portions of this work were presented at the UCLA CALDAR Summer Research Institute
(14 August 2006), the UNC-Chapel Hill Quantitative Psychology Forum (2 October
2006) and the Penn State Methodology Center Seminar Series (25 January 2007).
Correspondence concerning this article should be addressed to Antonio A. Morgan-
Lopez, Ph.D., RTI International, 3040 Cornwallis Road, Hobbs 209, RTP, NC 27709.
Electronic mail may be sent to [email protected] .
Page 35
Rolling Therapy Groups 35
Footnotes
1 More specifically, if there is change in group membership composition (i.e., due to
dropout) the changes have negligible impact because the probability of missingness is
fully accounted for by non-missing variables and, as a consequence, a single treatment
effect is estimated for the entire population (conditional on missingness), regardless of
when or if they dropped out (Hedeker & Mermelstein, 2000). This assumption is likely
untenable in practice for clinical trials (Schafer & Graham, 2002) and specifically for
rolling group trials (Morgan-Lopez & Fals-Stewart, 2006a).
2 For the purposes of this article, group cluster-correlated LGM refers to LGM for
longitudinal data within groups with the sole purpose of standard error adjustment for
non-independence of repeated measures among individuals within groups without an
explicit growth model for the group-level. This is in contrast to models where there is an
explicit model for the group-level (i.e., an explicit “three-level” model).
3We use “missingness” and “attendance” synonymously, at the risk of overlooking one
clear case where they are not synonymous: namely, the condition where individuals show
up for group but do not respond to a particular item (i.e., item-level missingness when
they did show up). However, within a given attendance pattern, item-level missingness is
assumed to be missing-at-random, even under models that handle non-ignorable
missingness (see Lin, McCulloch & Rosenheck, 2004).
4The single-class (group cluster-correlated) LCPMM and standard (group cluster-
correlated) LGM under the assumption of data missing-at-random produce equivalent
results (Muthén, B.O., personal communication, 17 March 2006). However, single-class
LCPMM was used as the standard LGM analog in order to preserve the same number of
Page 36
Rolling Therapy Groups 36
variables (i.e., retaining the missing data/attendance indicators that are unnecessary, and
thus “ignorable”, under standard LGM under ignorability of missingness) in all models
for the purpose of comparing Bayesian Information Criterion (BIC) values across models
with varying numbers of classes.
5Caution is warranted in interpreting growth parameters from missing data classes with
very low proportions of data. The parameters that coincide with extremely low
proportions of missing data (i.e., Week 12 intercept and Week 8-12 slope for the
Droppers class) are based on extrapolation from other data points, under the assumption
that the estimated trajectory based on non-missing data reasonably represents the
projected trend for data points that are missing (Schafer, J.L., personal communication,
25 January 2007).
6Weighted averages of the attendance class-specific growth parameters must be
calculated external to the analysis, as there are no current alternatives to represent
mixtures of parameter estimates within the analysis in LCPMMs (Muthén, B.O., personal
communication, 21 March 2006).
7Overall class proportions are used for weighted averaging since the proportions do not
differ significantly across treatment conditions. However this approach can accommodate
differences in class proportions across treatment conditions (see Hedeker & Gibbons,
1997, p.73-74; see also the SAS Proc IML program in the technical appendix)
8Mplus v4 code for this analysis available upon request.
9As suggested by an anonymous reviewer.
Page 37
Rolling Therapy Groups 37
Table 1 Pretreatment Characteristics of Men Participating in the Investigation ________________________________________________________________________ Characteristics GA/Group Treatment IBT (N = 64)
(N = 64) ________________________________________________________________________ Mean (SD)
Age 40.44 (10.02) 40.60 (9.95)
Years of education 14.01 (2.00) 13.64 (1.95)
Years married/cohabitating 10.25 (6.68) 9.86 (7.34)
Number of children 1.95 (1.86) 2.02 (1.94)
Annual family income 39.21 (27.84) 38.63 (29.55) (in thousands $)
Years of problematic alcohol use 4.90 (1.84) 4.83 (1.90) Number (percentage)
Racial/Ethnic composition White 41 (64) 39 (61)
African-American 13 (20) 16 (25) Hispanic 8 (13) 7 (11) Other 2 (3) 2 (3) ________________________________________________________________________ Note. GA = Getting Along group treatment condition; IBT = individual-based treatment condition: DSM-IV = Diagnostic and Statistical Manual of Mental Disorders, 4th Edition.
Page 38
Rolling Therapy Groups 38
Table 2 Latent Class Pattern Mixture Model Global Fit Statistics ________________________________________________________________________ Classes BIC Entropy ________________________________________________________________________ One 3942 - Two 3398 .973 Three 3382 .991 Four 3409 .944 ________________________________________________________________________ Notes. BIC = Bayesian Information Criterion; smallest BIC value is favored. Entropy =
summary measure of the average probability of each individual being in the latent class in
which they were ultimately classified. Values of 1.0 indicate “perfect” certainty in latent
class membership.
Page 39
Rolling Therapy Groups 39
Table 3
Structuring of Three-Piece Linear Model Time Coefficients ________________________________________________________________________ Time Coefficients ________________________________________________ Week Week 1-3 Week 3-8 Week 8-12 Week 12 Slope Slope Slope Intercept
(β1) (β2) (β3) (α) ________________________________________________________________________ 1 -2 -5 -4 1 2 -1 -5 -4 1 3 0 -5 -4 1 4 0 -4 -4 1 5 0 -3 -4 1 6 0 -2 -4 1 7 0 -1 -4 1 8 0 0 -4 1 9 0 0 -3 1 10 0 0 -2 1 11 0 0 -1 1 12 0 0 0 1 _______________________________________________________________________ Notes. Time coefficients are structured such that interpretation of the slope for each
measure is the estimated change on a given measure across one week for the indicated
period.
Page 40
Rolling Therapy Groups 40
Table 4 Attendance Class-Specific Probit Regression Coefficients (and Standard Errors) ________________________________________________________________________ Effects Droppers Show-ers Erratics (N = 34) (N = 78) (N = 16) ________________________________________________________________________ Conditional Growth Parameter Means (SE) Weeks 1-3 .290(.148) -.732(.137)*** -.394(.298) Weeks 3-8 .012(.133) -.194(.060)*** .295(.109)** Weeks 8-12 -.334(.283) -.194(.114) -.456(.135)*** Week 12 .148(.547) -2.616(.422)*** .046(.506) Differential Treatment Effects (SE) Weeks 1-3 -.572(.148)*** -.026(.137) -.529(.617) Weeks 3-8 .165(.133) .302(.060)*** -.534(.111)*** Weeks 8-12 .553(.283) -.189(.113) .142(.136) Week 12 1.185(.549)* -.485(.422) -1.473(.509)** ________________________________________________________________________ Notes. Conditional Growth Parameter Means correspond to the class-specific growth
parameter means (i.e., probit regression intercepts) for the IBT condition. Class-specific
differential treatment effects (i.e., probit regression slopes) indicate differences between
IBT and Group Treatment (GA), with negative coefficients indicating favorable effects
for the GA group treatment condition. *p<.05, **p<.01, ***p<.001. For Droppers, nIBT =
15/nGA = 19. For Show-ers, nIBT = 38/nGA = 40. For Erratics, nIBT = 11/nGA = 5.
Page 41
Rolling Therapy Groups 41
Table 5 Comparison of Standard LGM and Weighted-Averaged Three-Class LCPMM Results ________________________________________________________________________ Effects Standard Three-Class LGM LCPMM ________________________________________________________________________ Conditional Growth Parameter Means (SE) Weeks 1-3 -.590(.101)*** -.418(.106)*** Weeks 3-8 -.064(.044) -.078(.054) Weeks 8-12 -.089(.055) -.263(.104)* Week 12 -1.121(.225)*** -1.548(.330)*** Differential Treatment Effects (SE) Weeks 1-3 .114(.101) -.233(.120)tt Weeks 3-8 .086(.044)t .160(.057)*
Weeks 8-12 -.167(.055)*** .049(.108) Week 12 -1.024(.225)*** -.165(.319) ________________________________________________________________________ Notes. Parameter estimates under Three-Class LCPMM calculated from the weighted averages of the attendance class-specific parameter estimates shown in Table 4. Standard errors for the Three-Class LCPMM were derived via the multivariate delta method (Bishop, Fienberg & Holland, 1975). Treatment effects (i.e., probit regression
slopes) indicate differences between IBT and Group Treatment, with negative
coefficients indicating favorable effects for the GA group treatment condition. *p<.05,
**p<.01, ***p<.001. tp=.052, ttp=.051.
Page 42
Rolling Therapy Groups 42
Figure Captions
Figure 1.Flow diagram through phases of the trial. Follow-up data not relevant to the
current analysis.
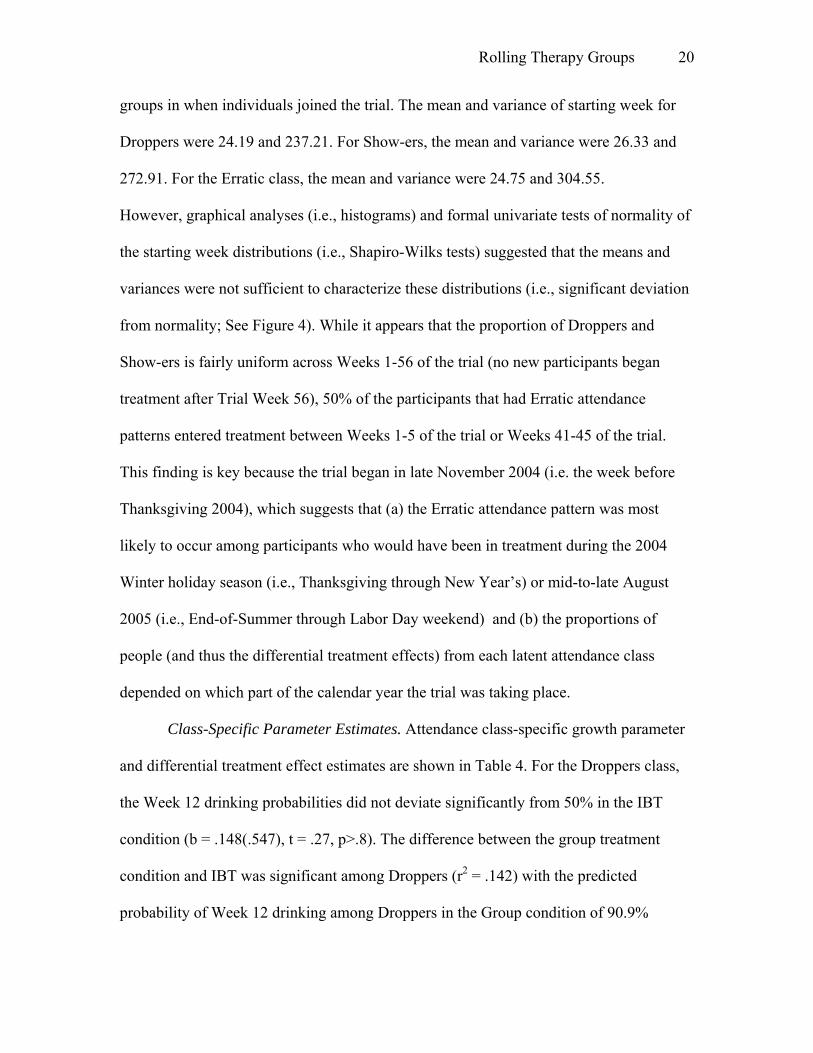
Figure 2. Latent Class Pattern Mixture Model. Attend = Latent Attendance Class
Variable. d1-d12 = Observed past week drinking from person weeks 1-12. a2-a12 = Binary
indicators of treatment group attendance from weeks 2-12. StartWk = The week that the
trial was in when individual i joined the trial (range from trial week 1 to trial week 56).
GA = Treatment condition (Getting Along = 1; IBT = 0). β1GI = estimated rate of per
week change in drinking from weeks 1-3. β2GI = estimated rate of per week change in
drinking from weeks 3-8. β3GI = estimated rate of per week change in drinking from
weeks 8-12. αGI = estimated rate of drinking at treatment termination (i.e., week 12).
Paths from “Attend” to the growth parameters (i.e., β1GI, β2GI, β3GI, αGI) indicate that the
conditional means of the growth parameters vary across attendance class. Paths from
“Attend” to the GA → growth parameter links (as connected by the “dots”) indicate that
the differential treatment effects vary across attendance class.
Figure 3. Week-to-Week Treatment Attendance Probabilities by Latent Attendance
Classes.
Figure 4. Distributions of the Week of Trial Entry by Latent Attendance Classes.
The distributions of the proportions for each attendance class sum to 100% across the
weeks of trial entry. For example, of the participants that were classified in the Erratic
class (n = 16), 50% of these 16 participants began treatment between Weeks 1-5 (25%) or
Weeks 41-45 (25%) with the remaining bars accounting for the remaining 50% of the
Erratic class.
Page 43
Rolling Therapy Groups 43
Assessed for eligibility (N = 163)
Excluded (N = 35) Refused to participate (N = 16) Not eligible (N = 19)
Randomized (N = 128)
Assigned to Group Treatment (N = 64)
Assigned to Individual Treatment (N = 64)
Lost to follow-up (N = 0)*
Lost to follow-up (N = 0)*
Analyzed (N = 64) Analyzed (N = 64)
Page 44
αGIβ1GI
d1 d3d2 d4 d5 d10 d12d11
β2GI
………………………..
a2 a4a3 a5 a6 a10 a12a11a7 a9a8StartWk
AttendGA
β3GI
Page 45
0
0.1
0.2
0.3
0.4
0.5
0.6
0.7
0.8
0.9
1
2 3 4 5 6 7 8 9 10 11 12
Person Week
Prob
abili
ty o
f Tre
atm
ent A
ttend
ance
DroppersAlways AttendersErratics
Page 46
0
5
10
15
20
25
30
Weeks1-5
Weeks6-10
Weeks11-15
Weeks16-20
Weeks21-25
Weeks26-30
Weeks31-35
Weeks36-40
Weeks41-45
Weeks46-50
Weeks51-55
Week 56
Week of Trial Entry
Prop
ortio
n of
Eac
h C
lass
Droppers
Always Attenders
Erratics
Page 47
Appendix: Weighted Averaged Standard Errors via the Delta Method
Delta method. The delta method is used to derive the variance of functions (e.g.,
sums, products, sums of products) of normally distributed random variables (e.g.,
regression coefficients). The asymptotic distribution of the estimator (i.e., f(θ')) is given
by (Bishop et al., 1975, p.493):
L[n1/2 (f(θ') - f(θ))] → N {θ, ((∂f/∂θ) Σ(θ) (∂f/∂θ)')} (1)
Where f(θ') is a single function of interest, ∂f/∂θ is an n x q matrix of partial derivatives
where n = the number of functions and q = the total number of elements that appear at
least once within any of the n functions (i.e., a Jacobian matrix). Σ(θ') is a q x q
covariance matrix among the parameters. The functions of interest in the present case are
the weighted averages of parameters (i.e., conditional mean growth parameters, treatment
effects) across the three attendance classes; let our functions of interest replace θ':
γπθ K
K
KK∑
=
=1
' (2)
where:
πK = proportion for attendance class K (where K = 3; Droppers, Always Attenders
(aka Show-ers) and Erratics respectively)
γK = parameter of interest (i.e., conditional growth parameter means (α, β1, β2, β3),
differential treatment effects (Tα, Tβ1, Tβ2, Tβ3)) within class K
Deriving the variance of the weighted averages of each parameter requires a) the
Jacobian matrix of partial derivatives with respect to fn(θ') (i.e., ∂fn/∂θ' ) and the
covariance matrix among the parameters (i.e., Σ(θ')), the estimates of which come
directly from the Latent Class Pattern Mixture Modeling output.
Page 48
The partitioned Jacobian matrix is:
[ ]ZYXW
Where:
W = γ D
Nf∂
∂ (8 x 8 sub-matrix of partial derivatives (for the 8 functions with respect to
the 8 parameters) for the Droppers class)
X= γ S
Nf∂
∂ (8 x 8 sub-matrix of partial derivatives for the Show-ers class)
Y = γ E
Nf∂
∂ (8 x 8 sub-matrix of partial derivatives for the Erratics class)
Z = π K
Nf∂
∂ (8 x 3 sub-matrix of partial derivatives for estimated class proportions)
The covariance matrix among the estimates is pre- and post-multiplied by the
matrix of partial derivatives of the functions of interest.
[ ]ZYXW
⎥⎥⎥⎥⎥
⎦
⎤
⎢⎢⎢⎢⎢
⎣
⎡
∑∑∑∑∑∑∑∑∑∑
K
EESED
SESSD
DEDSD
πγγγγγγγγγγγγγγγ
000000
⎥⎥⎥⎥
⎦
⎤
⎢⎢⎢⎢
⎣
⎡
ZYXW
The square root of the diagonal elements of this new 8 x 8 matrix are the standard errors
for the corresponding effect denoted for the function fN (i.e., the 8 weighted-averaged
parameters). (Additional detail and SAS Proc IML code available by contacting the first
author or downloading the technical supplement from www.addictionandfamily.org).