25
Romaguera D, Vergnaud AC, Peeters PH, Chan D, Riboli E, van Gils C (PI), Norat T (PI) On behalf of EPIC investigators Funding: WCRF International Grant Programme (No: 2009/44)
| Date post: | 02-Feb-2019 |
| Category: |
Documents |
| Upload: | hoangkhanh |
| View: | 216 times |
| Download: | 0 times |
Romaguera D, Vergnaud AC, Peeters PH, Chan D, Riboli E, van Gils C (PI), Norat T (PI)
On behalf of EPIC investigators
Funding: WCRF International Grant Programme (No: 2009/44)
• Composite measure of diet quality based on prior knowledge of the associa9on between diet and health outcomes
• Need to be: – Objec9ve – Reproducible – Valid
• Examples: Healthy Ea9ng Index (HEI), Healthy Diet Indicator (HDI), Mediterranean Diet Score (MDS)
o To develop an scoring system to assess the degree of concordance with the WCRF/AICR recommenda9ons in epidemiological studies
o To assess the construct validity of the score in the European Prospec9ve Inves9ga9on into Cancer and Nutri9on (EPIC) study
o To ascertain whether adherence to the WCRF / AICR recommenda9ons reduces the risk of developing cancer in the EPIC cohort
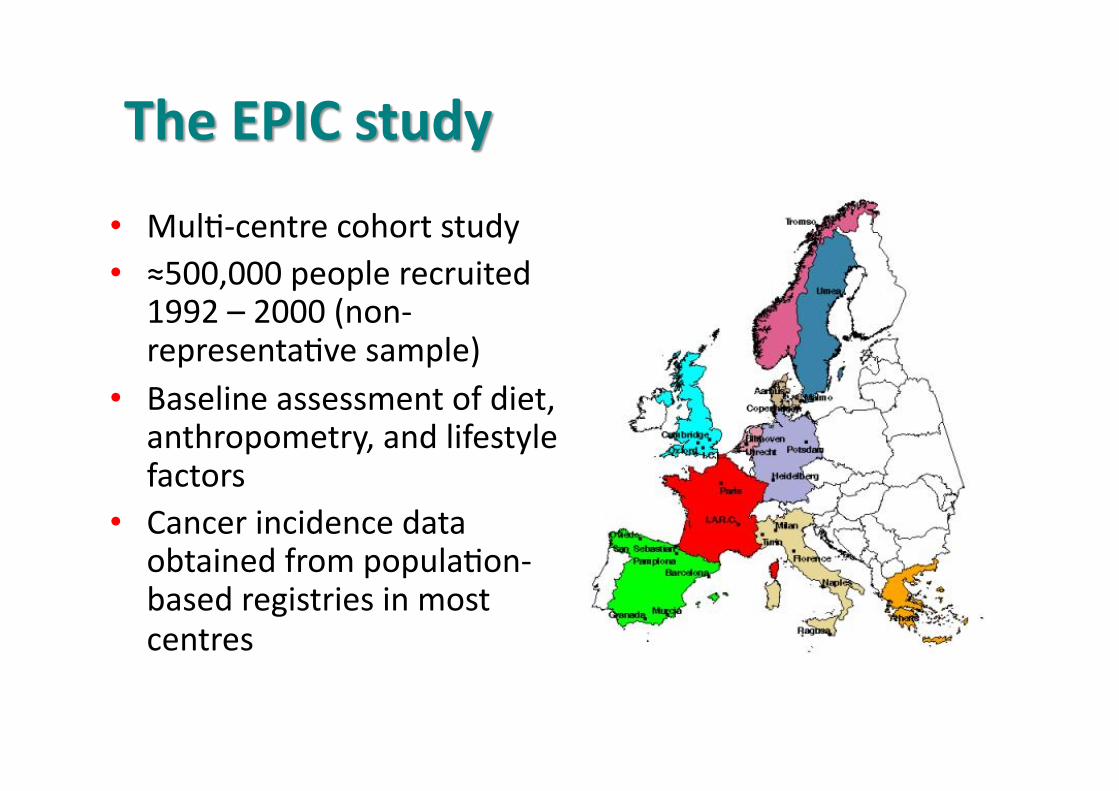
• Mul9-‐centre cohort study • ≈500,000 people recruited
1992 – 2000 (non-‐representa9ve sample)
• Baseline assessment of diet, anthropometry, and lifestyle factors
• Cancer incidence data obtained from popula9on-‐based registries in most centres
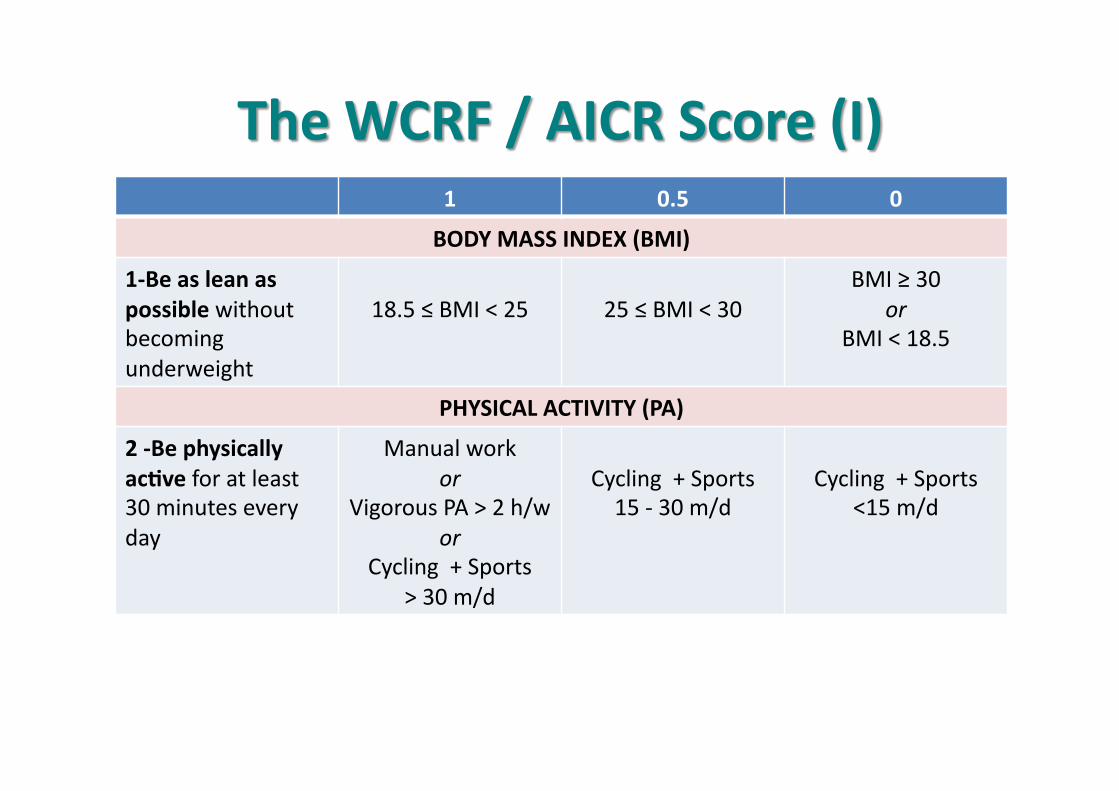
1 0.5 0
BODY MASS INDEX (BMI)
1-‐Be as lean as possible without becoming underweight
18.5 ≤ BMI < 25 25 ≤ BMI < 30 BMI ≥ 30
or BMI < 18.5
PHYSICAL ACTIVITY (PA)
2 -‐Be physically acGve for at least 30 minutes every day
Manual work or
Vigorous PA > 2 h/w or
Cycling + Sports > 30 m/d
Cycling + Sports 15 -‐ 30 m/d
Cycling + Sports <15 m/d
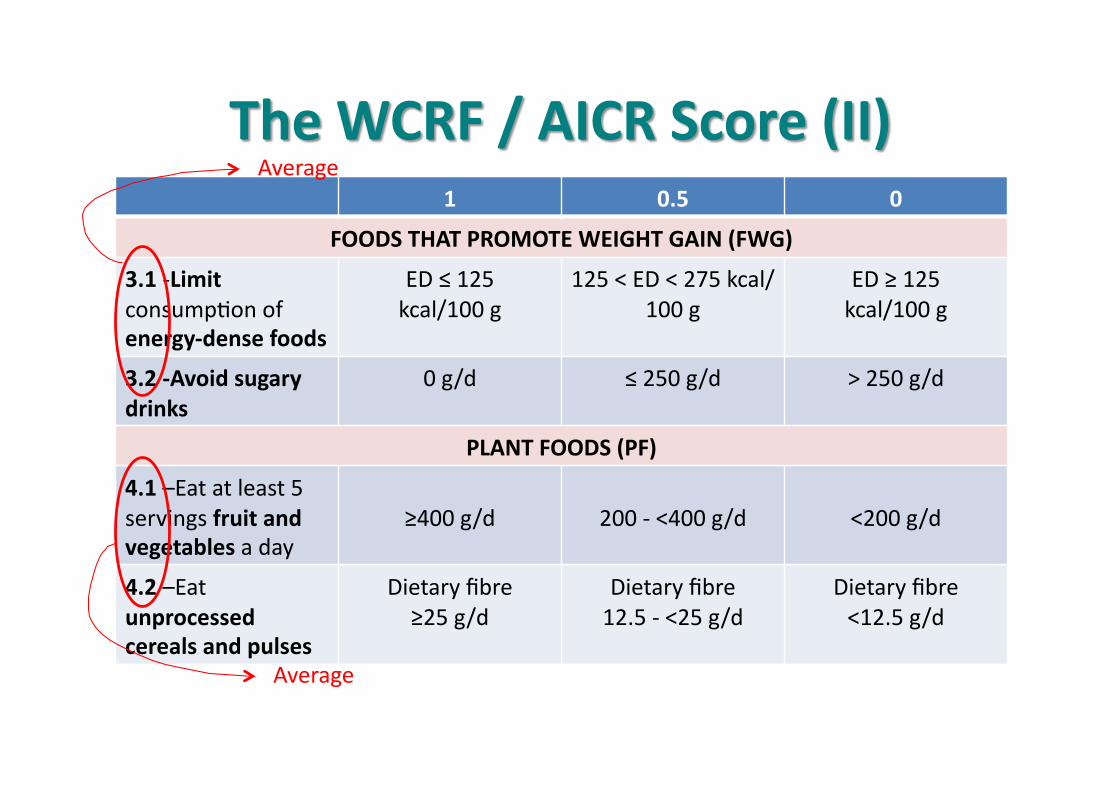
1 0.5 0
FOODS THAT PROMOTE WEIGHT GAIN (FWG)
3.1 -‐Limit consump9on of energy-‐dense foods
ED ≤ 125 kcal/100 g
125 < ED < 275 kcal/100 g
ED ≥ 125 kcal/100 g
3.2 -‐Avoid sugary drinks
0 g/d ≤ 250 g/d > 250 g/d
PLANT FOODS (PF)
4.1 –Eat at least 5 servings fruit and vegetables a day
≥400 g/d 200 -‐ <400 g/d <200 g/d
4.2 –Eat unprocessed cereals and pulses
Dietary fibre ≥25 g/d
Dietary fibre 12.5 -‐ <25 g/d
Dietary fibre <12.5 g/d
Average
Average
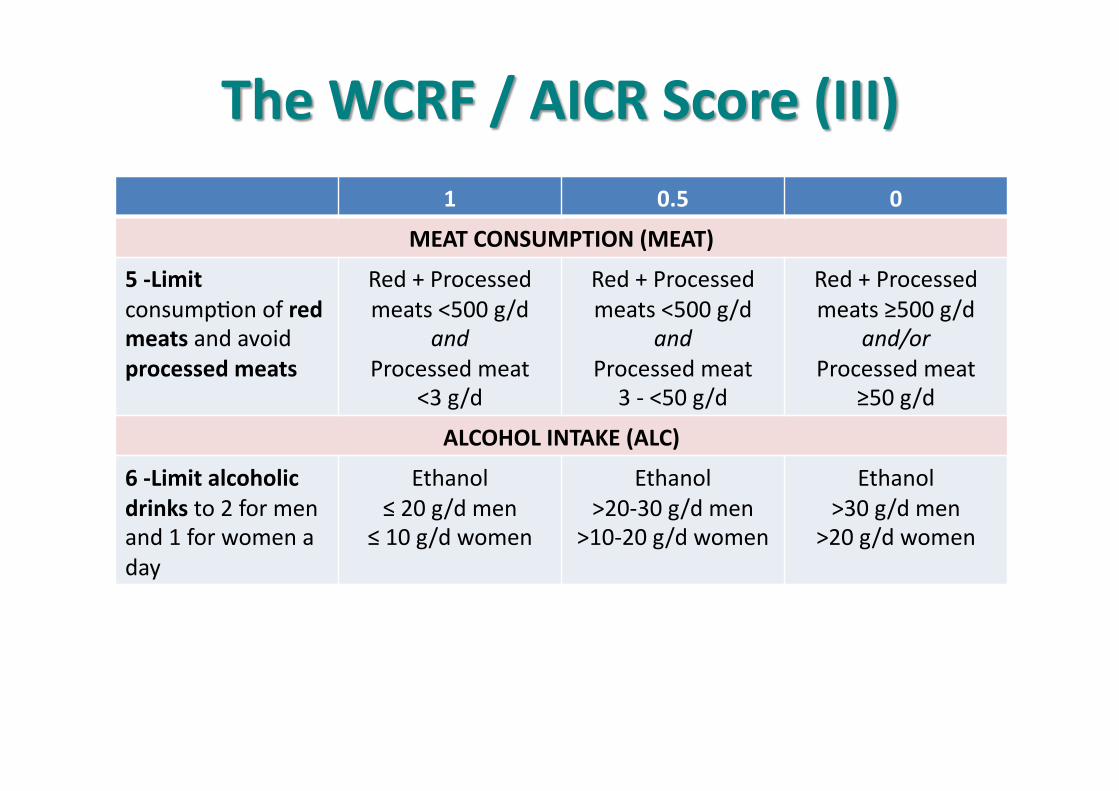
1 0.5 0
MEAT CONSUMPTION (MEAT)
5 -‐Limit consump9on of red meats and avoid processed meats
Red + Processed meats <500 g/d
and Processed meat
<3 g/d
Red + Processed meats <500 g/d
and Processed meat 3 -‐ <50 g/d
Red + Processed meats ≥500 g/d
and/or Processed meat
≥50 g/d
ALCOHOL INTAKE (ALC)
6 -‐Limit alcoholic drinks to 2 for men and 1 for women a day
Ethanol ≤ 20 g/d men
≤ 10 g/d women
Ethanol >20-‐30 g/d men
>10-‐20 g/d women
Ethanol >30 g/d men
>20 g/d women

1 0.5 0
7 -‐Limit consump9on of salty foods Insufficient data avaible
8 -‐Don´t use supplements to protect against cancer
Not applicable
BREAST FEEDING (BF)
9 -‐Breas^eed exclusively for up to 6 months
Cumula9ve BF ≥ 6 months
Cumula9ve BF >0 -‐ <6 months
Cumula9ve BF 0 months
10 -‐Cancer survivors should follow the recommendaGons
Not applicable
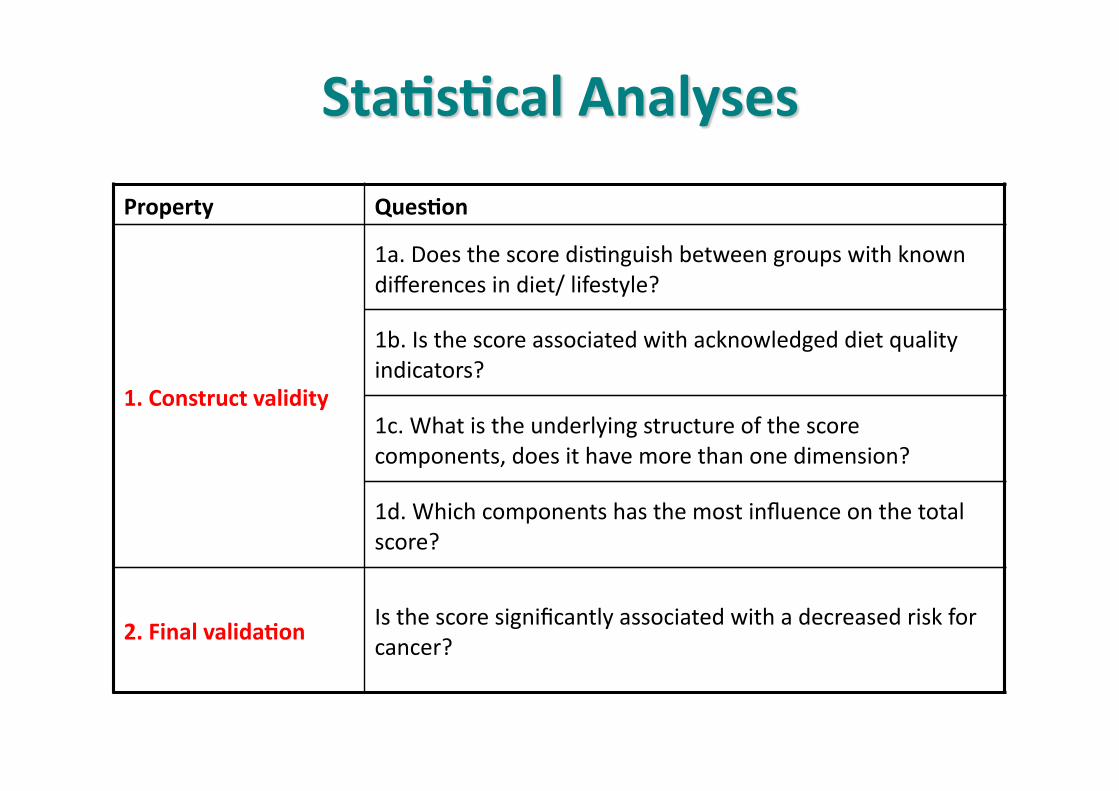
Property QuesGon
1. Construct validity
1a. Does the score dis9nguish between groups with known differences in diet/ lifestyle?
1b. Is the score associated with acknowledged diet quality indicators?
1c. What is the underlying structure of the score components, does it have more than one dimension?
1d. Which components has the most influence on the total score?
2. Final validaGon Is the score significantly associated with a decreased risk for cancer?
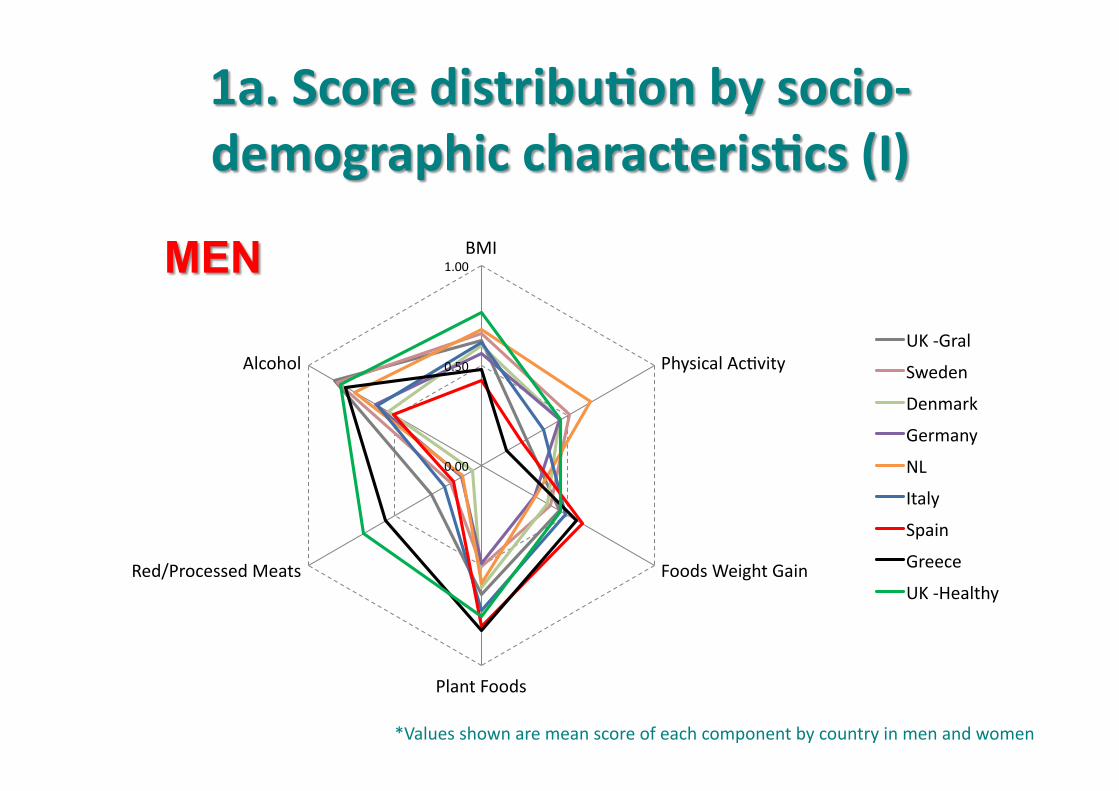
*Values shown are mean score of each component by country in men and women
0.00
0.50
1.00 BMI
Physical Ac9vity
Foods Weight Gain
Plant Foods
Red/Processed Meats
Alcohol UK -‐Gral
Sweden
Denmark
Germany
NL
Italy
Spain
Greece
UK -‐Healthy
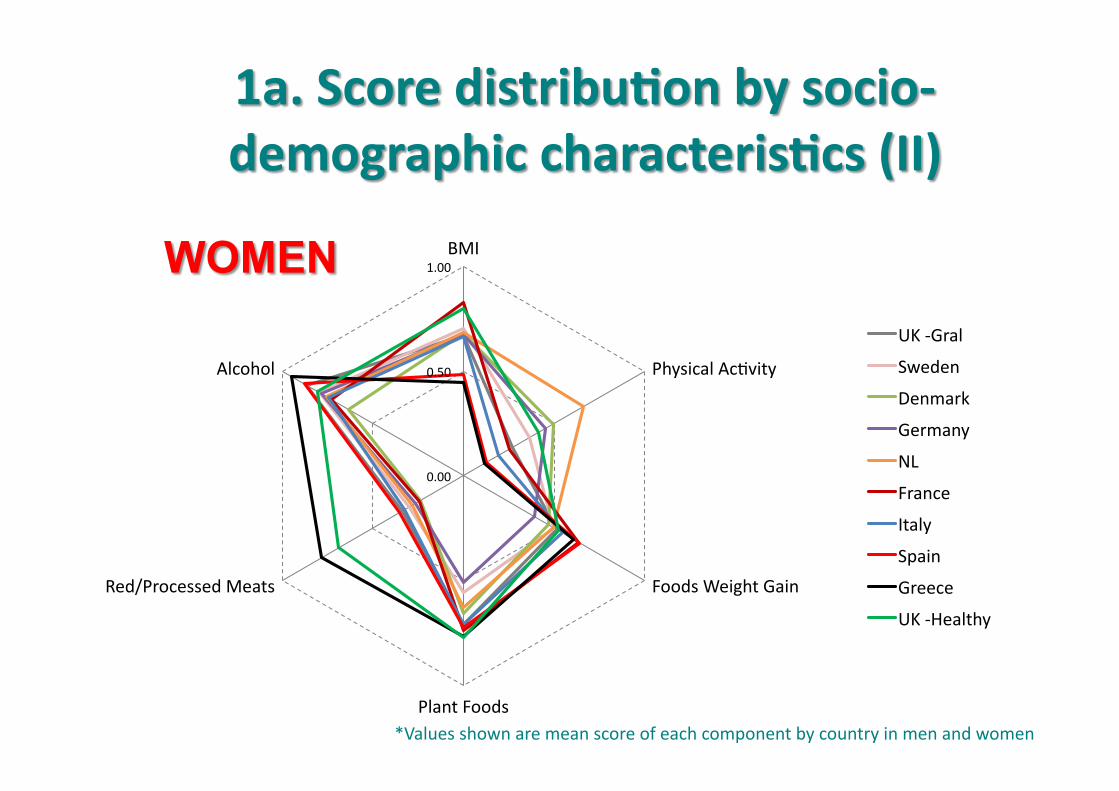
0.00
0.50
1.00 BMI
Physical Ac9vity
Foods Weight Gain
Plant Foods
Red/Processed Meats
Alcohol
UK -‐Gral
Sweden
Denmark
Germany
NL
France
Italy
Spain
Greece
UK -‐Healthy
*Values shown are mean score of each component by country in men and women
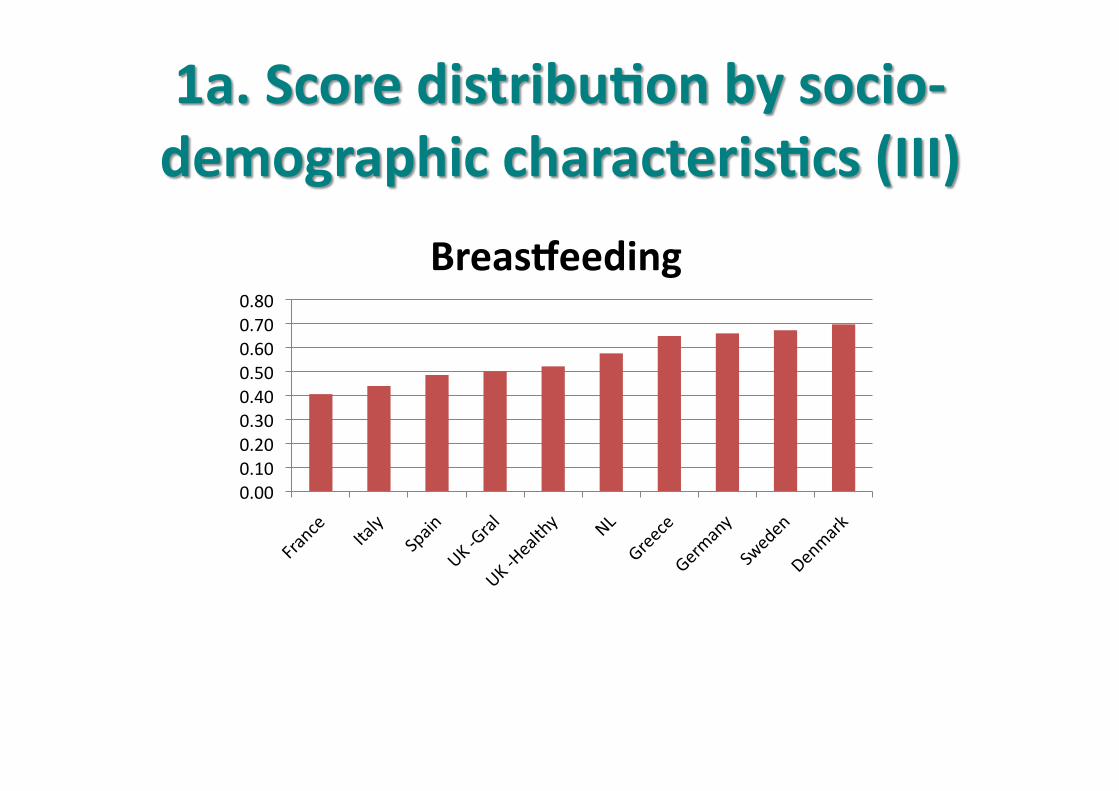
0.00 0.10 0.20 0.30 0.40 0.50 0.60 0.70 0.80
Breas^eeding
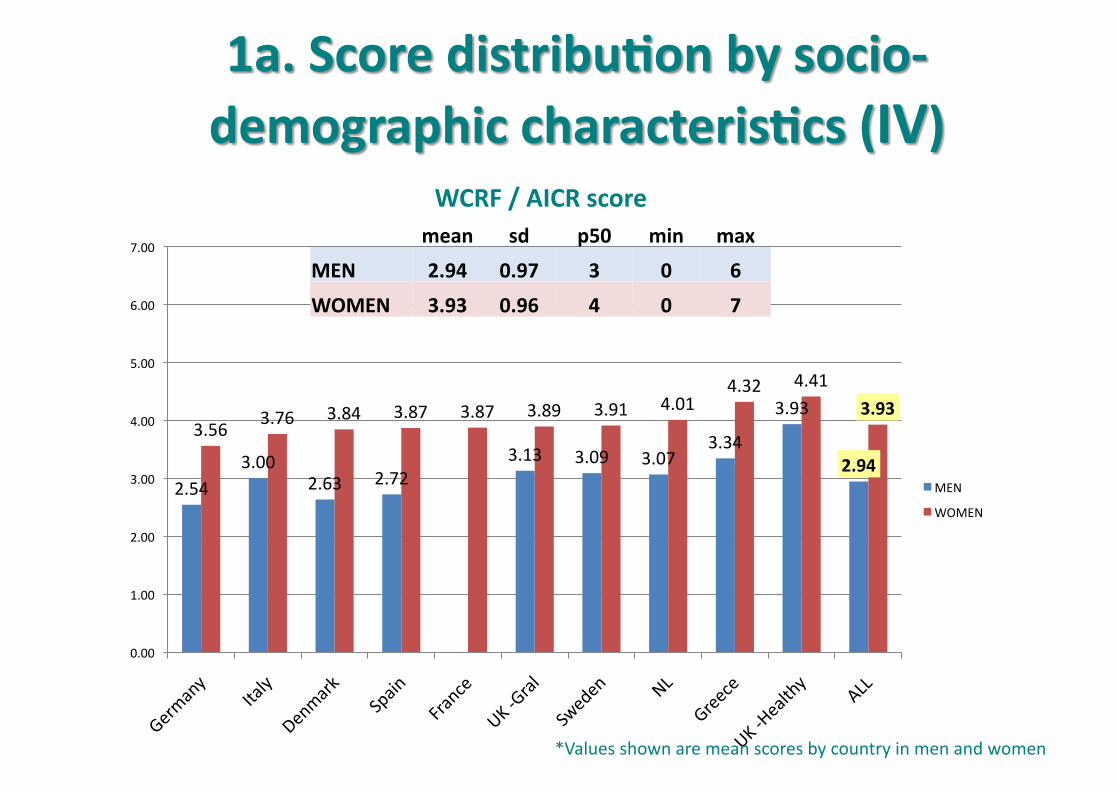
2.54 3.00
2.63 2.72 3.13 3.09 3.07
3.34
3.93
2.94
3.56 3.76 3.84 3.87 3.87 3.89 3.91 4.01
4.32 4.41
3.93
0.00
1.00
2.00
3.00
4.00
5.00
6.00
7.00
MEN
WOMEN
*Values shown are mean scores by country in men and women
WCRF / AICR score mean sd p50 min max
MEN 2.94 0.97 3 0 6
WOMEN 3.93 0.96 4 0 7
*Values shown are mean scores
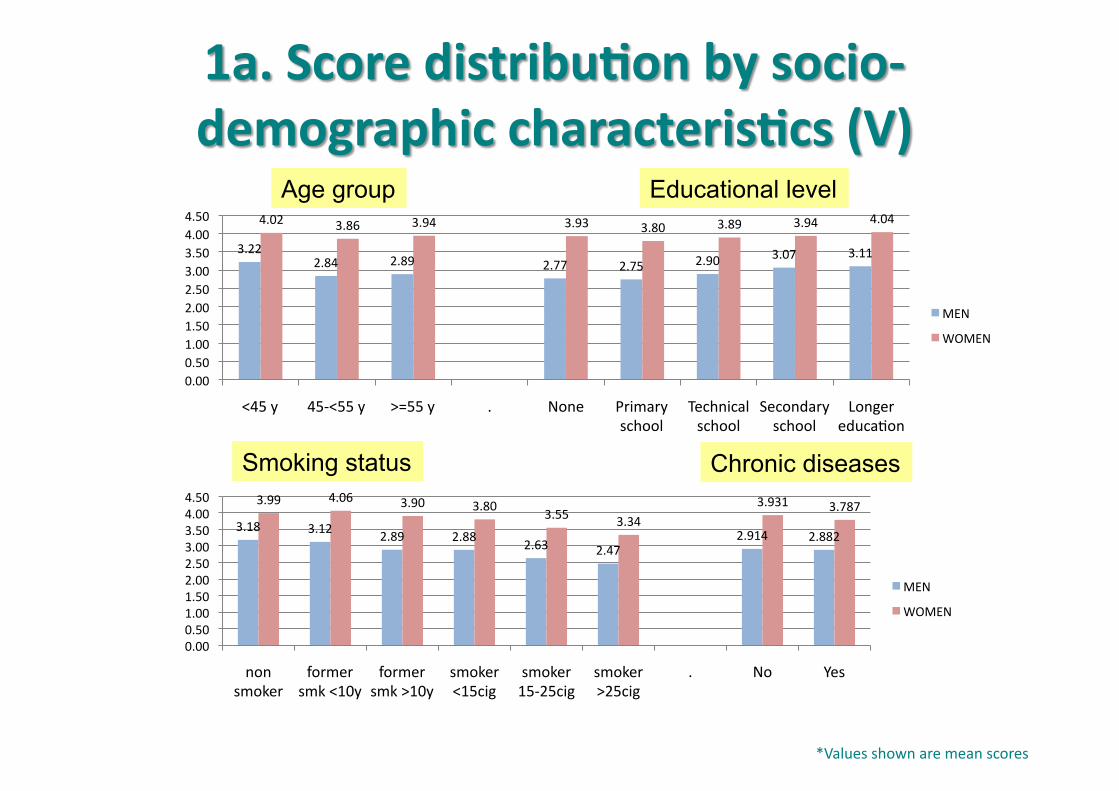
3.22 2.84 2.89 2.77 2.75 2.90 3.07 3.11
4.02 3.86 3.94 3.93 3.80 3.89 3.94 4.04
0.00 0.50 1.00 1.50 2.00 2.50 3.00 3.50 4.00 4.50
<45 y 45-‐<55 y >=55 y . None Primary school
Technical school
Secondary school
Longer educa9on
MEN
WOMEN
3.18 3.12 2.89 2.88 2.63 2.47
2.914 2.882
3.99 4.06 3.90 3.80 3.55 3.34
3.931 3.787
0.00 0.50 1.00 1.50 2.00 2.50 3.00 3.50 4.00 4.50
non smoker
former smk <10y
former smk >10y
smoker <15cig
smoker 15-‐25cig
smoker >25cig
. No Yes
MEN
WOMEN
Age group Educational level
Smoking status Chronic diseases
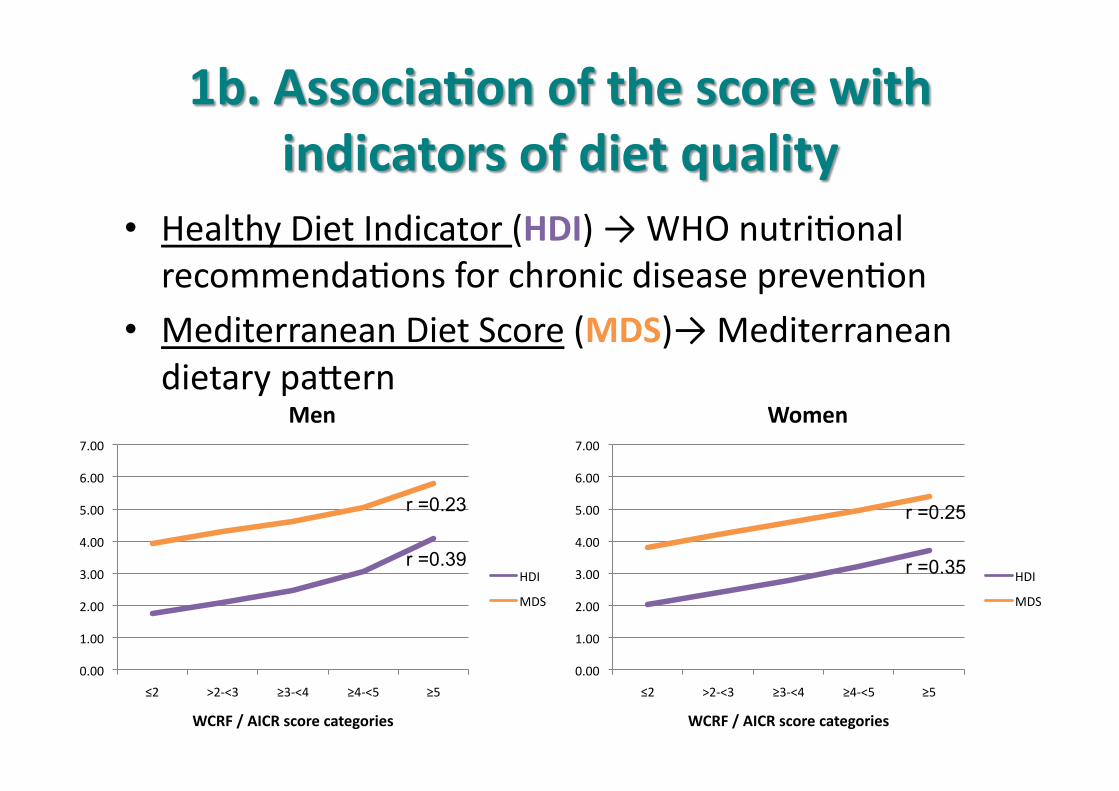
• Healthy Diet Indicator (HDI) → WHO nutri9onal recommenda9ons for chronic disease preven9on
• Mediterranean Diet Score (MDS)→ Mediterranean dietary paqern
0.00
1.00
2.00
3.00
4.00
5.00
6.00
7.00
≤2 >2-‐<3 ≥3-‐<4 ≥4-‐<5 ≥5
WCRF / AICR score categories
Men
HDI
MDS
0.00
1.00
2.00
3.00
4.00
5.00
6.00
7.00
≤2 >2-‐<3 ≥3-‐<4 ≥4-‐<5 ≥5
WCRF / AICR score categories
Women
HDI
MDS
r =0.23
r =0.39
r =0.25
r =0.35
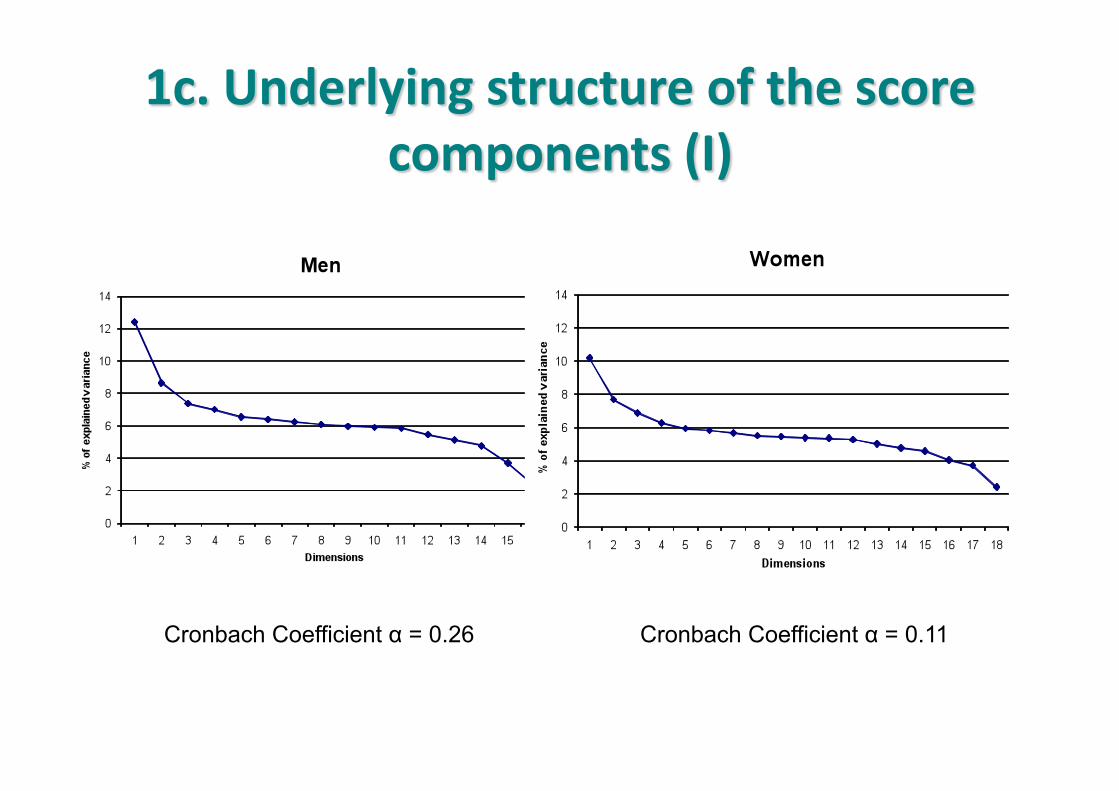
Cronbach Coefficient α = 0.26 Cronbach Coefficient α = 0.11
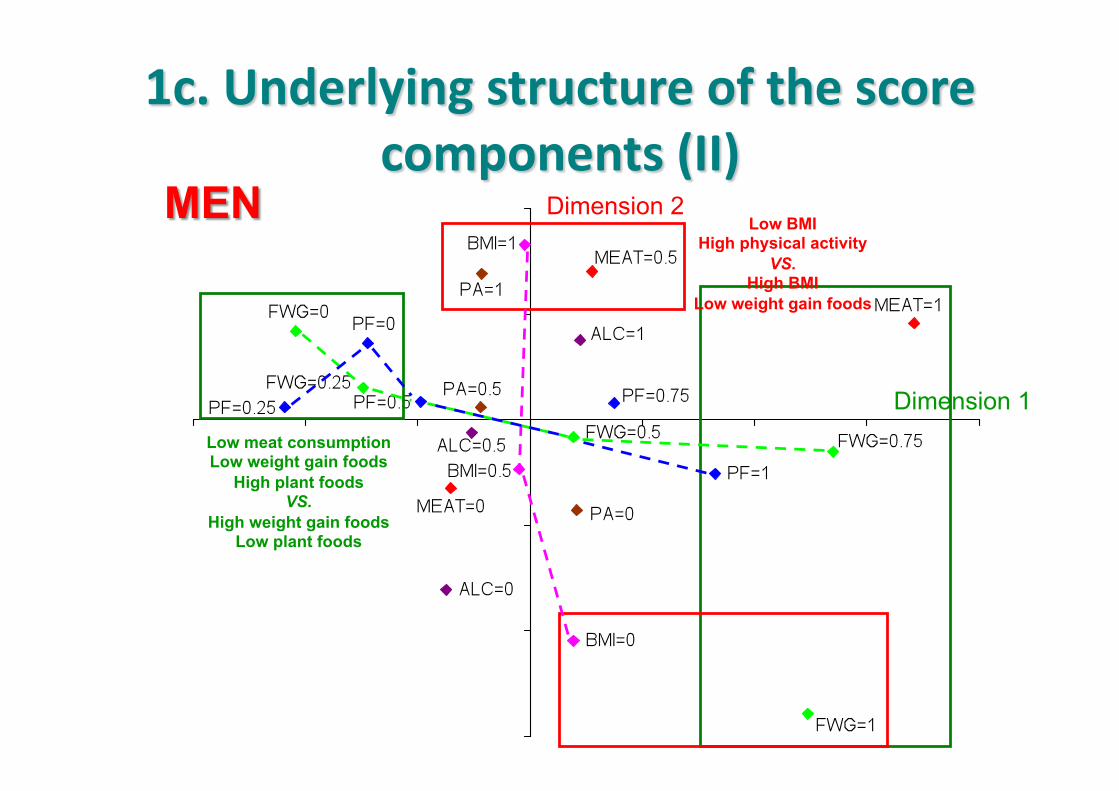
Dimension 1
Dimension 2
Low meat consumption Low weight gain foods
High plant foods VS.
High weight gain foods Low plant foods
Low BMI High physical activity
VS. High BMI
Low weight gain foods
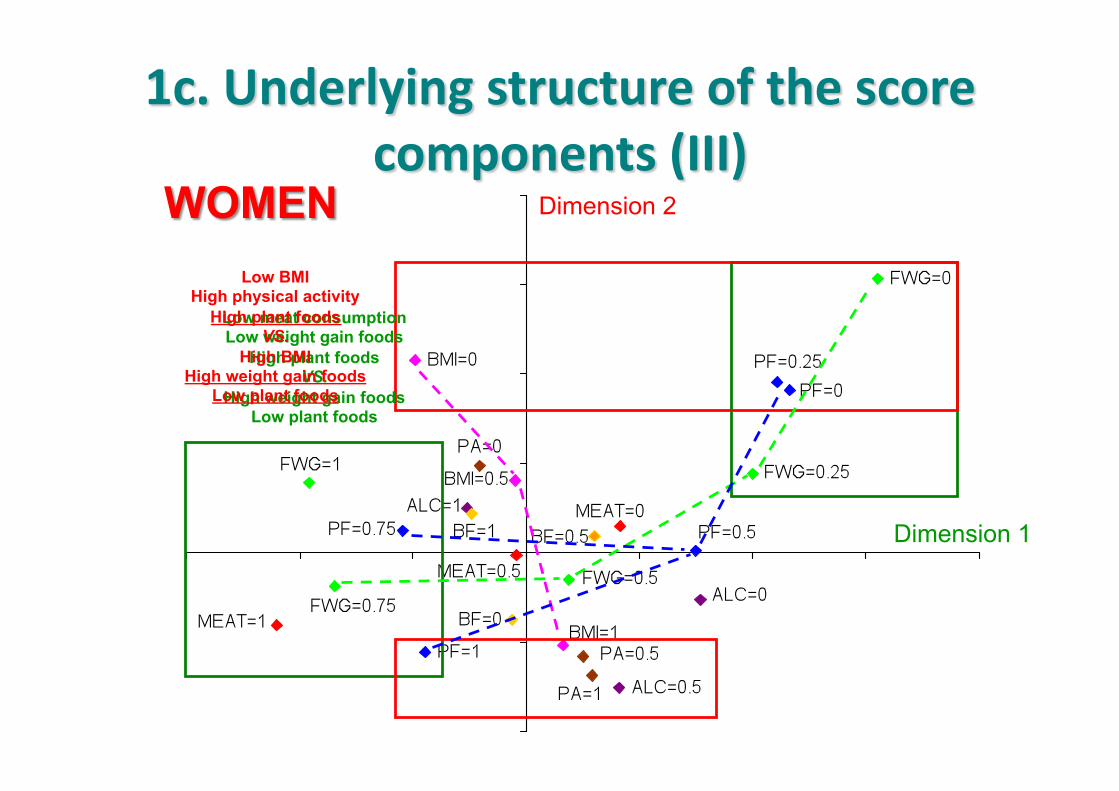
Dimension 1
Dimension 2
Low meat consumption Low weight gain foods
High plant foods VS.
High weight gain foods Low plant foods
Low BMI High physical activity
High plant foods VS.
High BMI High weight gain foods
Low plant foods
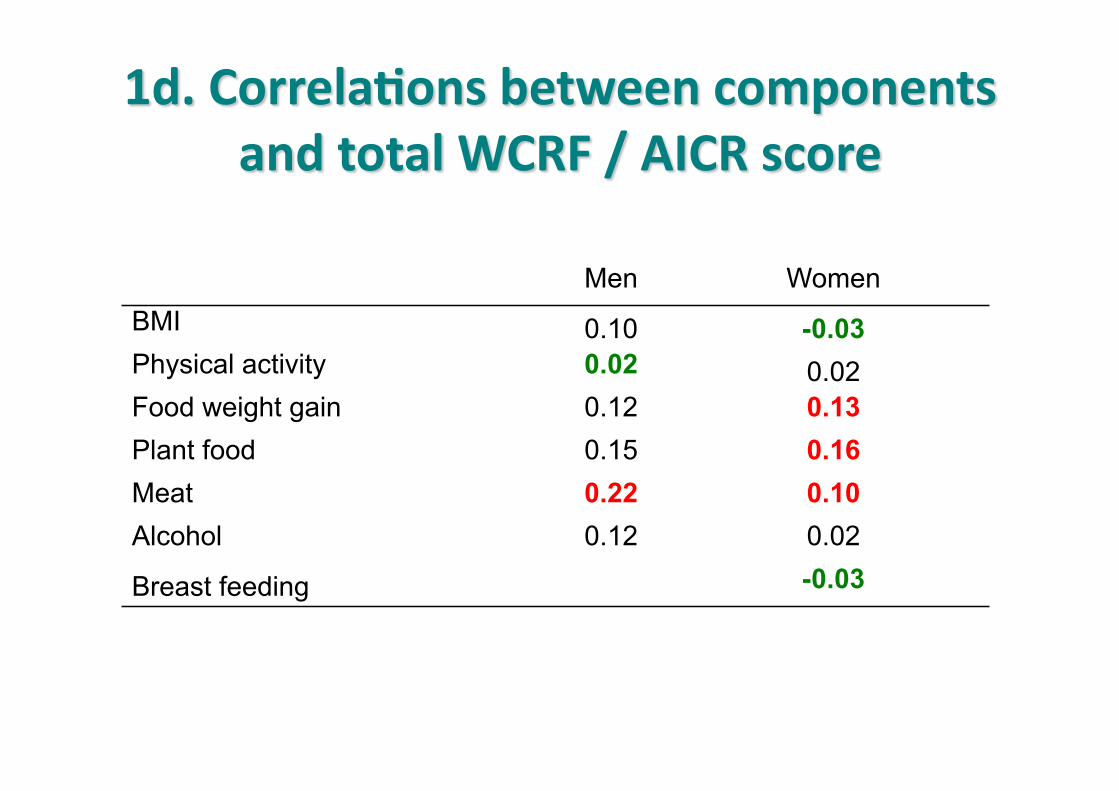
Men Women BMI 0.10 -0.03 Physical activity 0.02 0.02 Food weight gain 0.12 0.13 Plant food 0.15 0.16 Meat 0.22 0.10 Alcohol 0.12 0.02
Breast feeding -0.03
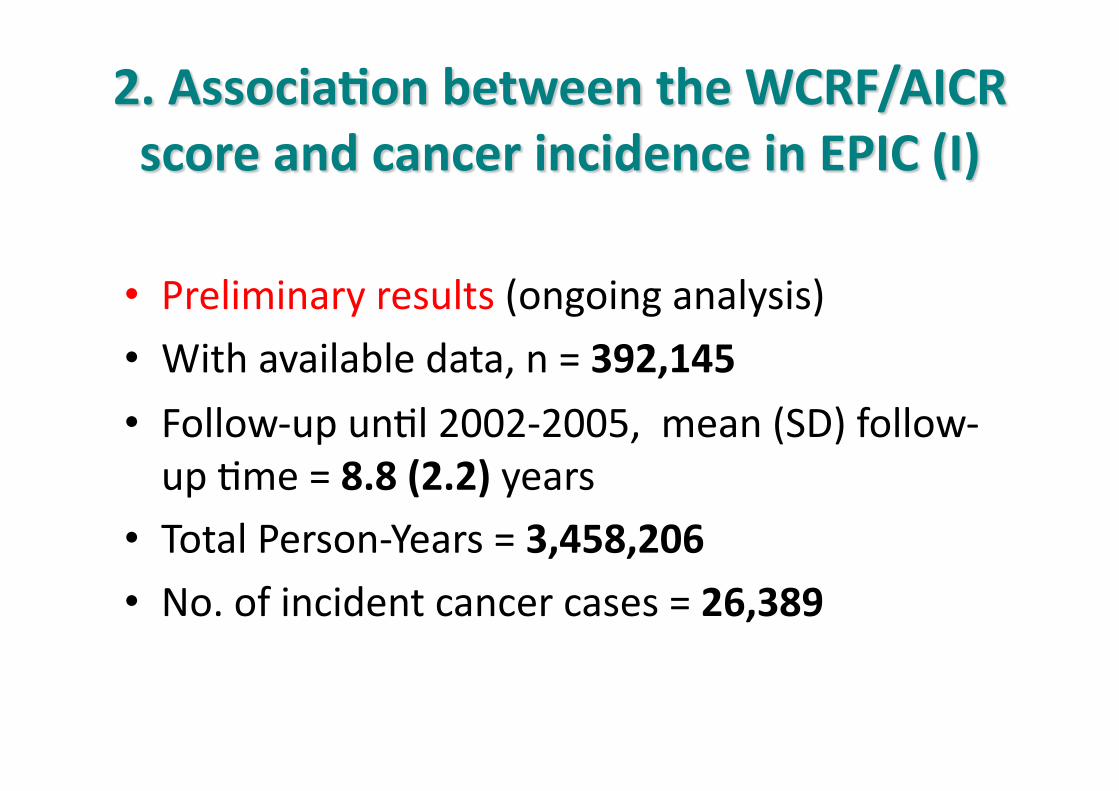
• Preliminary results (ongoing analysis)
• With available data, n = 392,145
• Follow-‐up un9l 2002-‐2005, mean (SD) follow-‐up 9me = 8.8 (2.2) years
• Total Person-‐Years = 3,458,206 • No. of incident cancer cases = 26,389
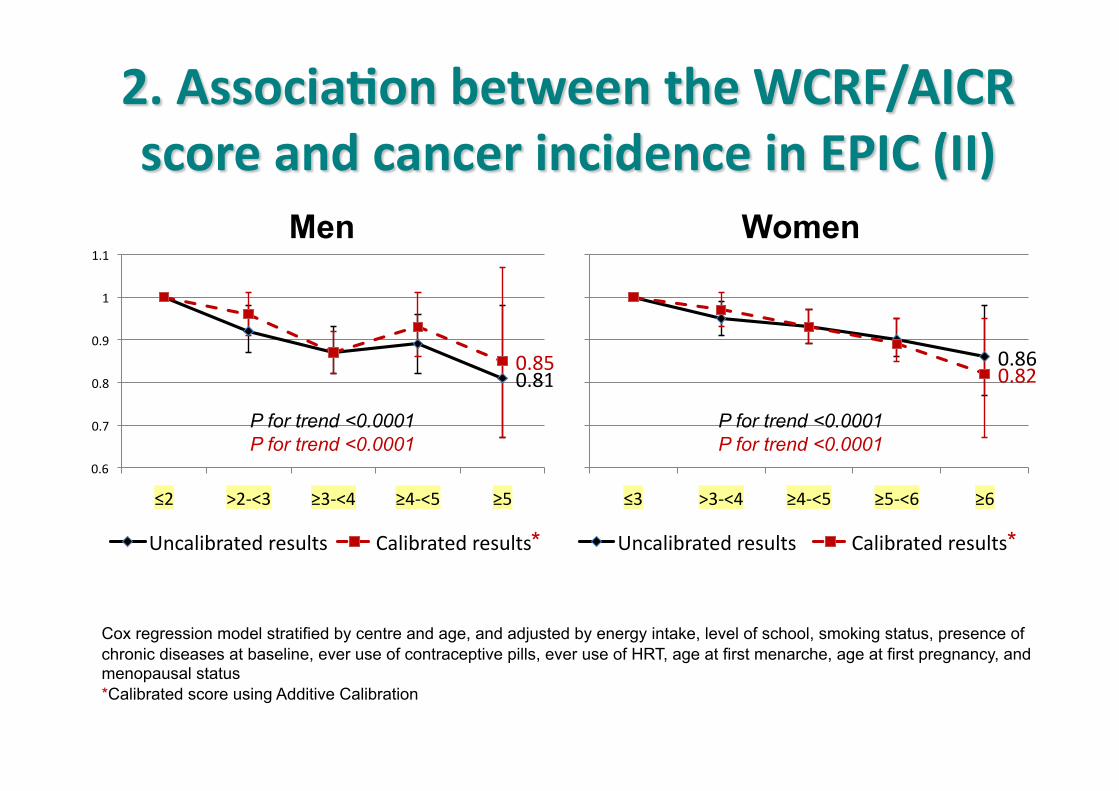
0.81 0.85
0.6
0.7
0.8
0.9
1
1.1
≤2 >2-‐<3 ≥3-‐<4 ≥4-‐<5 ≥5
Uncalibrated results Calibrated results
0.86 0.82
0.60
0.70
0.80
0.90
1.00
1.10
≤3 >3-‐<4 ≥4-‐<5 ≥5-‐<6 ≥6
Uncalibrated results Calibrated results
Men Women
Cox regression model stratified by centre and age, and adjusted by energy intake, level of school, smoking status, presence of chronic diseases at baseline, ever use of contraceptive pills, ever use of HRT, age at first menarche, age at first pregnancy, and menopausal status *Calibrated score using Additive Calibration
P for trend <0.0001 P for trend <0.0001
P for trend <0.0001 P for trend <0.0001
* *
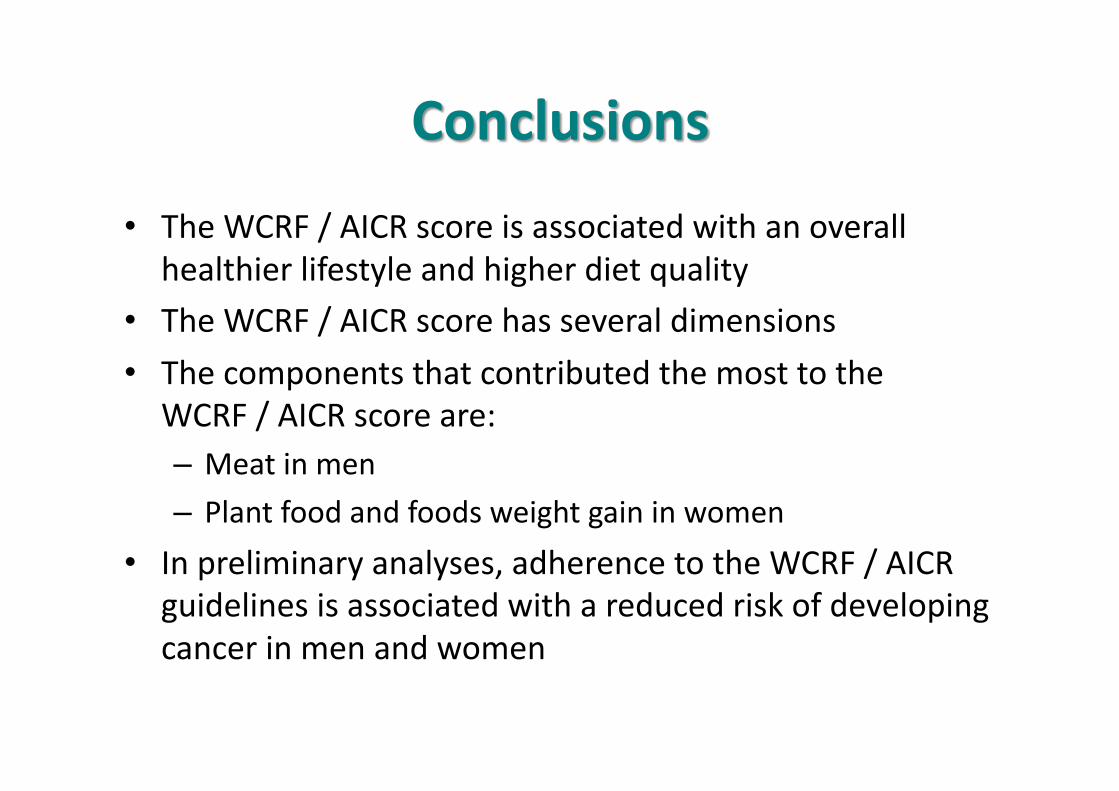
• The WCRF / AICR score is associated with an overall healthier lifestyle and higher diet quality
• The WCRF / AICR score has several dimensions
• The components that contributed the most to the WCRF / AICR score are: – Meat in men
– Plant food and foods weight gain in women
• In preliminary analyses, adherence to the WCRF / AICR guidelines is associated with a reduced risk of developing cancer in men and women

• To inves9gate the associa9on between the WCRF / AICR score and:
– Specific cancer sites (i.e. Colon and rectum, breast, lung, prostate)
– Total and cause-‐specific mortality (i.e. Cancer and CVD)
– Cancer survival
Contributors:
Anne-Claire Vergnaud Petra H Peeters Doris Chan Elio Riboli Carla van Gils (PI) Teresa Norat (PI)
EPIC investigators
Acknowledgments:
This work was funded by the World Cancer Research Fund (WCRF) International Grant Programme (No: 2009/44)


