EditorTraian Rotariu - Babeş-Bolyai University, Romania
Deputy Editor: Mihaela Hărăguş, Centre for Population Studies
Advisory Board:Tamás Faragó - Corvinus University of Budapest, Hungary Antoinette Fauve-Chamoux - L'École des Hautes Études en Sciences Sociales, France Vasile Gheţău - ”Vladimir Trebici” Centre for Demographic Research, Romanian Academy Harriet Presser - University of Maryland, USA Gianpiero dalla Zuanna - University of Padua, Italy
Editorial BoardJozsef Benedek - Babeş-Bolyai University, Romania Ioan Bolovan - Babeş-Bolyai University, Romania Anuţa Buiga - Babeş-Bolyai University, RomaniaLuminita Dumănescu - Centre for Population StudiesCornelia Mureşan - Babeş-Bolyai University, Romania
The Problem of Accuracy of Historical Sources: Mortality in the Polish Territories under Russian Rule
5
Levente Pakot Households and Families in Rural Transylvania. A Case Study of Vlăhiţa and Căpâlniţa, 1868
21
Bogdan Crăciun Families in the War: the Impact of First World War on the Demographic Behaviour in the Rural World of Transylvania
43
Alexander Pinwinkler “Historical Demography”/“Population History” in Germany, c. 1950-1980
63
Contemporary Population
Cristian Pop Social Classes in Romania. A New Class Schema 75
Alina Toader La présence des Roumains dans les flux et stocks migratoires en France de 1990 à 2007: une mise en parallèle des statistiques roumaines et françaises
103
Mimoza Dushi Determinants of Using Contraceptives: Evidence from Kosovo
127
Book Reviews 141
Luminiţa Dumănescu. (2012). Familia românească în comunism [The Romanian Family under Communism]. Cluj-Napoca: Cluj University Press (reviewed by Roxana Dorina Pop)
Erik Beekink and Evelien Walhout (eds.). (2012). Frans van Poppel: A sort of farewell: Liber amicorum. Hague: Nederlands Interdisciplinair Demografisch Instituut, Ando (reviewed by Patricia Ioana Şuleap)
Luminita
Typewritten Text
Households and Families in Rural Transylvania. A Case Study of Vlăhiţa and Căpâlniţa, 1868
Levente Pakot
Hungarian Central Statistical Office–Demographic Research Institute, 1024 Buday László út 1-3, Budapest, Hungary, 0036-13-45-68-43, [email protected]
Abstract: The present study examines marriage behaviour, household patterns and living arrangements prevailing in the population of two Transylvanian mountain communities in the second half of the 19th Century. The cross-sectional data of two Status Animarum (“lists of souls”) from 1868 show that the prevailing pattern can be characterized by a low age at marriage and the dominance of simple family households. Using a life course perspective, the synthetic cohort analysis, however, revealed that the size and structure of peasant households varied over the family life cycle, and a complex phase of households was common in these regions too. Servants lived seldom in the households but it was quite common during the first 10-15 years of family life cycle that stem and other kins (usually the head’s siblings) helped to cover the households’ labour-force demand. As the number of children increased the inclination and perhaps the capability of maintaining other kins decreased. The study confirmed the validity of Chayanov’s model. The living standard of the households expressed by the producer-consumer ratio followed the same cyclical pattern over the family life course as in the Russian case.
Keywords: household structure, family structure, individual life-cycle, family life cycle, historical demography, Transylvania, Chayanov model
1. IntroductionThe original goal of researches on family and household structure of the 1970-1980’s1 was to define the territorial differences in Europe2. Due the first critics (Berkner 1972), which required the involvement of family cycles and demographic factors (age at marriage, fertility, life expectancy, migration), the further studies aimed at comprehending the dynamics of households, and,1 The most important studies on the subject: Burguière et al. 1986, Laslett 1972, Laslett 1983, Hajnal 1983, Wall, Robin, Laslett 1983.2 For a review of the development of family history and historical demography as separate disciplines, see Oris 2003.
22 ● Romanian Journal of Population Studies ● Vol. VII, No. 2
moreover, their social and economical functioning in general. The new method was based on the breaking down the households by type, size and the age of head of household3.
The Hungarian social historians joined to the studies at a relatively early stage (see for example Andorka, Faragó 1983). The project, however, remained a minor one due to two reasons: the early international critics of the method and the weak position of social history in general in the country4. Researches on family and household structure carried out during the 1970-1980’s in Hungary remained within the contemporary political borders. These studies did not cover Transylvania and especially the region of Szeklerland. Therefore, one may clearly state that the Hungarian and Romanian social history has a due debt on the topic5. Lack of information about family and household conditions, marriage customs of the peasants inhabiting the mountainous areas, the Szeklers, Slovakians, Poles (Gorals) and Rusyns, has been articulated by Tamás Faragó (Faragó 2003: 171).
In parallel with discovering historical census data and computer processing, investigating on the historical living arrangements has gained momentum6.
The aim of the preset paper is to introduce the noteworthy aspects of the family and household structure by analyzing the Status Animarum (“lists of souls”) compiled in 1868 of two settlements, Vlăhiţa and Căpâlniţa (Harghita County, Romania).
3 For a good illustration of the method, see David Reher’s work (Reher 1997).4 Some results of Hungarian family and household structure researches based on micro-analysis: Andorka 1975, Andorka, Faragó 1983, Balázs, Katus 1983, Bácskai 1992, Benda 2002, Faragó 1985, Faragó 2005, Heilig 2000, Husz 2002, Kocsis 1992, Melegh 1987, Pozsgai 2000, Pozsgai 2001, Őri 2005. For results of researches based on macro-analysis see: Faragó 1977, Őri 2005, 2007, 2008, 2009.5 The research, however, carried out by the HCSO–Demographic Research Institute within the framework of the MOSAIC project is relevant here. This part of the project follows two objectives: 1. to create a detailed inventory of the available sources on historical censuses of the historical Hungary (Őri–Pakot 2012); 2. to create a historical database from the material of census 1869 that will be representative for the territory of historic Hungary. The material of the census 1869 contains great amount of data on Szolnok and Maros-Torda counties from the present-day Transylvania (Őri, Pakot 2012). This database is currently under construction.6 Three international projects have to be mentioned: IPUMS (Integrated Public Use Microdata Series) and the North Atlantic Population Project is lead by Minnesota Population Center (www.ipums.org). Both include individual level data of historical censuses gathered from Canada, Great Britain, Norway, Sweden, Iceland, the United States. Regarding Eastern Europe of primary importance is the MOSAIC project, launched in 2010 lead by the Max Planck Institute for Demographic Research, Rostock, Germany (www.censusmosaic.org).
Population in History ● 23
In the first part of the paper I shall examine the size and structure of the households. A separate part will be dedicated to the analysis of relationship between marriage and household formation. In the third part of the paper I shall describe the life cycles of individuals in the household according to their relationship to the head of the household. At the end of the paper, I am going to focus on the examination of application of Chayanov’s model.
2. The area under study: Vlăhiţa and CăpâlniţaSzentegyházasfalva (Vlăhiţa) and Kápolnásfalva (Căpâlniţa) are neighbouring settlements. They are located along the southern skirts of Harghita Mountains, in the eastern part of Inner Transylvania, present-day Romania, at about 860 metres above sea level (see Figure 1). The villages lay on the frontier, far from the economic centres of Transylvania. The majority of their inhabitants belonged to the Roman Catholic Church. Due to their geographical proximity (2 km) and the joint privileges received from the Princes of Transylvania, the history of the two villages was closely interlocked: they formed one parish until 1838 and one administrative unit until 18767.
According to the data of census 1869 the total number of inhabitants was 3512 who lived in 859 houses (Census 1869). The literacy among males and females above age 6 was 25% and 13%, respectively. This value, however, remained under the average of the Udvarhely district (35% and 16%). Occupational data reveal a moderately homogenous society, dominated by those make their living from the agriculture.
Information on households was gained from individual lists preserved in parochial archives8. The starting date of these lists is the beginning of year 1868 and can be related with the registration of parishioners. The clear goal was to register the Roman Catholic inhabitants of the settlements. The introductory titles of the individual lists reinforce this assumption as they read “General Census of the Congregation”. The priests of the neighboring parishes applied the same method: they registered the number of people by street number. The whole data was registered in a book of 100 X 297 mm size.
7 For a history of the privileges of the communities, see Hermann 1999. For a detailed account of public administration changes and the process of losing the privileges in the 1870s, see Pál 2003.8A Kápolnás Oláhfalvi hívek lakhely és szám szerinti általános összeírása 1868-ban január elsejétől kezdve. [List of souls in Căpâlniţa by place and street number from 1st of January 1868]. Kápolnásfalvi Római Katolikus Plébánia Levéltára. [Roman Catholic Parish Archive, Căpâlniţa]; Megnyitása a Szentegyházas Oláhfalvi hívek általános összeírásának Bálint Ignác plébános által az 1868-dik évben. [List of souls in Vlăhiţa made by the priest Ignác Bálint in 1868]. Szentegyházasfalvi Római Katolikus Plébánia Levéltára. [Roman Catholic Parish Archive, Vlăhiţa].
24 ● Romanian Journal of Population Studies ● Vol. VII, No. 2
Figure 1. The area under study
The house(hold)s were separated from each other by a horizontal line. Data of persons living in the household was carefully recorded in a table: name, surname, date of birth and the remarks. In all cases, the top line contained information on the head of family followed by spouse and children. If other relatives (siblings of head of household or his spouse, illegitimate child, etc.)
Population in History ● 25
lived in the family, their data was also registered in the same box, however, a little further from the core data. Upon concluding the census, the recorders did not terminate their work as they strived for recording the possible modifications (migration, death, birth, marriage). This act is probably due to the fact that the priests wished to have access to an up-to-date database on the exact number of followers and households. To carry out this task accurately and meticulously, it required a great amount of energy besides their routine activities. Moreover, space left for changes in the household was limited. When processing the data, I found that the information of the first years were accurate, however, regarding later entries, it became unreliable. It is very likely that the restricted space provided by the “family books” led to the introduction to the new and printed family books in 18819.
One of the disadvantages of individual lists is that they contain no data on socioeconomic status of head of household. Therefore, I shall disregard the examination of one of the most important factor of household structure–the social status and wealth. Although the individual lists made clear distinction between holders and “landless and other shady characters”, the latter category only included a few households. Thus it is plausible to suppose that there was a real division between the local smallholders and the fluctuating number of landless people present at the settlements. However, the figure is small, hence I shall omit their examination.
3. Household size and structureTable 1 contains the division of households and individuals by household size. The average size of households was 5.4 members in the two parishes. However, data was rather scattered around the median. Normally, households consisted of 3-6 people–it is true for the 59% of all households. 15% of them was two-people and 7% of them was solitary household. The ratio of household with many members –7-8 and 9 or more – was 19%. The individual perspective reduces the weight of persons living alone or in small households whereas increases the weight of persons in large households. According to this perspective, 58% of people lived in households consisting of 3-6 members. 2% of individuals lived in one-person-household, while 7% of them lived in two-people-households. 34% of the inhabitants existed in large households (7 or more members). Therefore, a conclusion can be drawn that the majority of people, more than 90%, lived in households of at least four members.
9 However, these “family books” did not survive.
26 ● Romanian Journal of Population Studies ● Vol. VII, No. 2
Table 1. Distribution of households and persons by household size in the two examined villages in 1868
9 and more persons 39 5,28 371 11,34Total 739 100,00 3271 100,00
Source: see note 8.
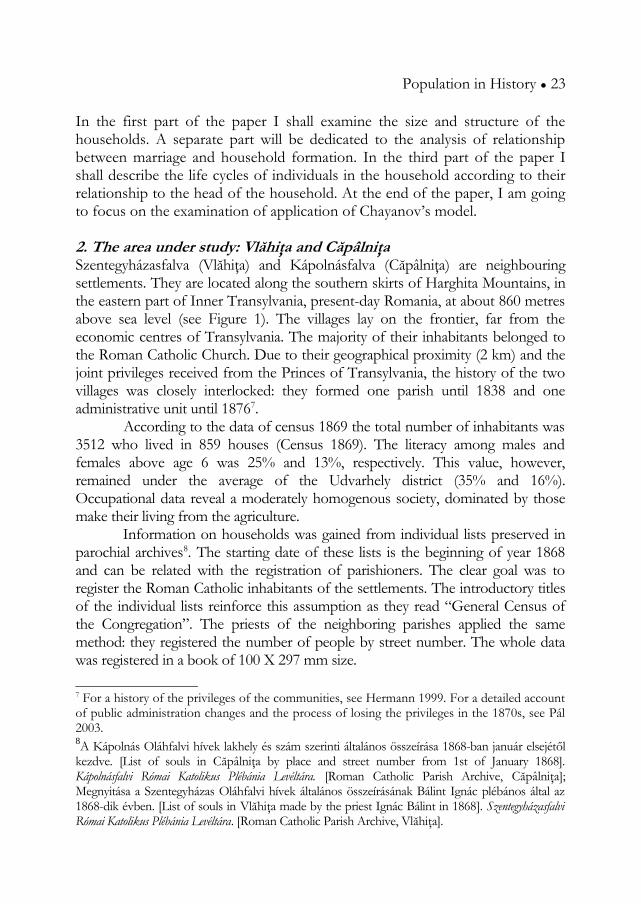
Figure 2 describes the modification of household size during their life course. In the beginning of the life cycle, individuals tend to live in large households, whereas the opposite process carries on in parallel with aging. Curves broken down by sex reflect two well-defined cycles. The first longer cycle covered the period from birth to marriage. In this period, the household size was around 6-7, with the highest peak at 10-14 years of age of the individual. In this age, the majority of the young lived with their parents and siblings. Upon reaching age 15, however, the size of parental household started to reduce. This decrease was due to the marriage and separation of older siblings and the termination of childbearing period and death of parents.
In parallel with childbearing and establishing of family by the individual, the household size rises again. The first significant divergence between males and females may be observed in this period: the rise is launched at an earlier stage in case of women. This may be due to the fact that the majority of females tend to marry 4-5 years earlier than males and then establish or join to family of their older spouse. On the contrary, young men stay in their parents’ or siblings’ households as bachelors. At the age of 35-39, in correspondence with giving birth to children, the average number of members of households again reached 6. In the case of individuals ten years older, the size of household started to reduce and the earlier divergences by gender were resumed, however, now favoring males. From age 45-49, the average number of households of men is one member higher than that of women. Regarding very old people, differences by gender starts to reconcile again.
Population in History ● 27
Figure 2. Mean household size by age-group and sex in the two villages, 1868
Source: see note 8.
Table 2 contains the structure of households in accordance with Laslett-Hammel typology (Laslett 1972). Seven households out of ten in the two parishes were nuclear family households; that is, couples living with or without their unmarried children or widows and widowers cohabitating with unmarried children. The ratio of nuclear family households is lower (70.2%) in Vlăhiţa than in Căpâlniţa (74.5%), however, it exceeds two thirds regarding both settlements. Almost 65% of all households consisted of parents living with unmarried children or childless couples. Ratio of widows or widowers living with unmarried children was 7%.
It was rather rare that other people lived in the household besides the core family and the close relatives (maiden/bachelor siblings, parents, spouse of child). 13% of the total household was an extended household, namely, one parent, grandchild, sibling or other relative of the head of family or his spouse cohabitated with them. These extended households frequently consisted of widower father or widow mother of head of family or his spouse (family household extended upward), or unmarried siblings of head of family or his spouse (family household extended laterally) or any combination of these.
28 ● Romanian Journal of Population Studies ● Vol. VII, No. 2
Table 2. Household structure in the two villages, 1868 (%)
Categories Szentegyházasfalva Kápolnásfalva The two village Households Individuals Households Individuals Households Individuals
In most of the cases, upward and lateral extensions of households were due to economic and demographic needs and, at the same time, were a particular form of mutual help. It is very likely that the cohabitation of various generations led to a special network of relationships that was aimed at helping family members facing difficulties–disabled parents or orphaned siblings under working age. Older widow or widower parent scarcely fulfilled the position of head of household: this is why the ratio of households extended downward is lower. However, we might not be fully aware of the fact that whether this small proportion is explained by the real norms in the community or the subjectivity of the person compiling the data.
Multiple family households comprised 8% of the total number of the households. The most frequent types are the cohabitation of couples of different generation, that is to say, the married parents and the family of one of the married children. The form cohabitation of married siblings–couples belonging to the same generation –is very rare. In Vlăhiţa, however, the compiler of the data listed the brothers’ family in the same household in some cases (Frérèches-type household).
Cohabitation of different generations was normal. Upward and downward extended secondary family units well represent the process of transition of property and status as the head of household. This latter type reflects on the fact that, subsequent to marriage, one of the brothers often continued to live in his parents’ household. Upward extended households and multiple family households including various generations reinforce the perception that big family household and family organization are in operation. This type of organization is closely related to the inheritance of farming from generations to generations.
Households without family make up 2% of the total number of households. These are households where siblings having lost their parents cohabitated. The ratio of households of people living alone is 4%, consisting of widows or widowers in general.
If we consider the individual as the basic unit of the analysis, namely, defining the individuals living in particular households, the result will be similar to the above-mentioned. In this case, the dominance of people living in simple family households is even more emphasized. Ratio of individuals from simple family households is rather significant (57%). It became clear that almost one third of the surveyed population lived in complex–extended or multiple family–households. In parallel, the ratio of individuals living alone or non-family households significantly dropped to 1-2%.
30 ● Romanian Journal of Population Studies ● Vol. VII, No. 2
The above table only provides a cross-sectional view and hides the dynamics embedded in the real operation of household organizing. Since Lutz Berkner’s criticism (Becker 1972), it is widely accepted that the European stem family households–at least one parent besides the head of household and his family –were dominant prior to the industrialization, however, cross-sectional examinations have not reinforced this assumption.
Figure 3. The proportion of simple and complex family households and those of solitaries by the age of household heads in the two villages, 1868
Source: see note 8.
Figure 3 contains households by the age of head of household so development stages of households may be well observed. To provide a clear view, I examined three types of household. I contracted the extended and multifamily households and assigned them to the “complex” category. Besides these, Figure 3 also includes the simple households and those containing solitaries.
Young heads tended to control a complex household than the older. More than one third of heads of household between ages 21-35 lead a complex family household. The proportion of complex households among heads between ages 30-34 reached 40%. Above age 35, however, the simple household became dominant. Ratio of nuclear family households was the highest in case of heads between age 45-49: 90% of households led by such people belonged to this category. Considering heads above age 50, the proportion of complex households and households including solitaries
Population in History ● 31
gradually increases. In the case of heads above age 60, the ratio of these two types of household was 40%.
A significant share of young heads leads households including at least one of the parents and/or siblings of head or his wife besides the head, his spouse and children. It seems that the older found support in the households of their married children. Similar to the results of the Hungarian researches (Andorka, Faragó 1983), a proportion of young and married adults lived in extended or complex household for a few years, mainly with parents or widowed parent or with married or unmarried siblings.
4. Age at marriage and household formationAge at marriage is regarded as the key variable of the household establishing process. In the western countries, establishing independent household was one of the prerequisites of marriage (Hajnal 1965, 1983).
In the examined communities, average age of first marriage conclusion was rather low concerning other European countries. Based on the individual lists of parishioners, females were more likely getting married at a younger age than males: age 25-26 for the latter whereas age 20-21 for women. It is worth examining that at what age the single, married and widowed males and females fulfilled the position of head of household, since this information is useful for guessing the patterns of establishing household. In the subsequent part, I summarized data mainly on males as the head of households were man in most cases.
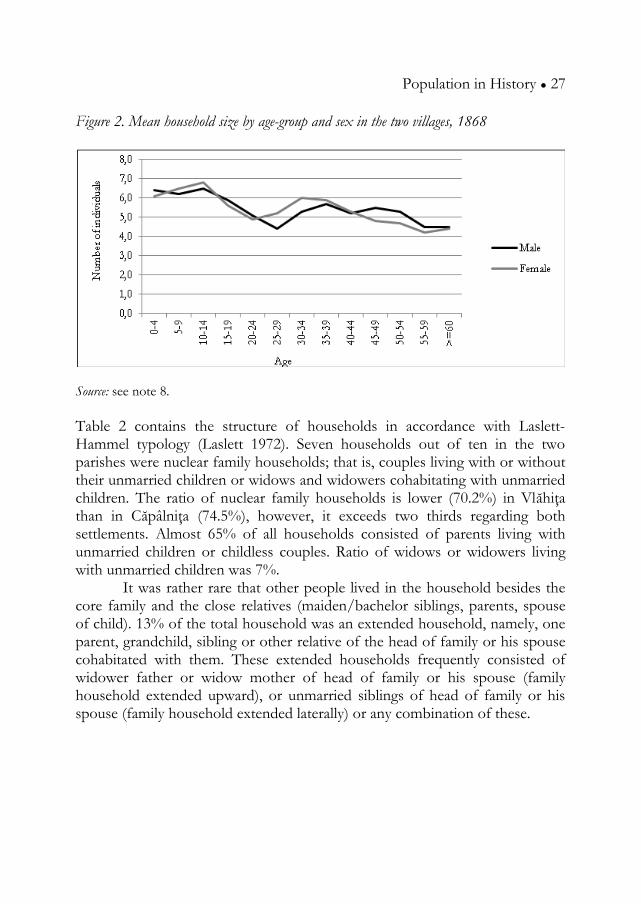
Figure 4 shows the frequency of ever married men and the role of head of household in the different age groups of males. The two curves individually demonstrate the ratio of males of different age group fulfilling husband role or both husband and head of household role. The results reinforce my assumption, namely, the majority of males also became head of household upon marriage. When reaching the normative age of getting married (age 25-26), proportion of those fulfilling husband and head of household role significantly increased. The data also reveal that a small group of men started their married life as son, son-in-law or sibling of a head of household.
The fulfilling the two roles at the same time, as head of household and husband, characterizes males in age groups 40-54; supposedly upon the death/retirement of the father. An increasing proportion of men above age 55 pass on the position of head of family to the younger generation. This process, however, may not be generalized as almost 60% of males above age 60 (N=61) remained in this position despite their age.
32 ● Romanian Journal of Population Studies ● Vol. VII, No. 2
Figure 4. Relationship between entry into marriage and into headship among males in the two villages, 1868
Source: see note 8.
5. The life cycle of the individuals in the householdImpact of human life span on family was in central position regarding individual experience. This life span may be broken down to separate sections from infancy through adulthood to old age. These sections were characterized by the biological and physiological development of the individual and his/her different roles in the family.
To describe the phenomenon, the role of members of household was described how they were related to the head of household. Eight categories were created by sex. Regarding males, the following categories were constructed: unmarried and married sons, unmarried, married and widowed heads, fathers of heads, other relatives (sibling, cousin, nephew, etc.), persons in unknown or unrelated relations to the head. Categories of females are as follows: daughters, wives, unmarried and widowed heads, mothers of heads, other relatives, persons in unknown relation to the head (for a comparison, see Sovi 2005).
Figure 5 demonstrates the role of males and females in the household throughout their life. Living arrangements patterns of men reveal the significance of family relations. Other family roles (grandchild, brother, son-in-law, etc.) characterized 5–15% of men between age 0–50. While underage sons
Population in History ● 33
were normally grandchildren in this category, men between age 25–39 with other family roles lived in the household as unmarried or married brother of the head. Transition from single son to husband and/or head of household was a gradual one: it began around age 20 and finished in the low 40’s.
Figure 5. The relationship to the household head over the individual life-cycle by age-group and sex in the two villages, 1868
Source: see note 8.
34 ● Romanian Journal of Population Studies ● Vol. VII, No. 2
As we have seen, the majority of married males also became head of household upon marriage. This process, however, was not generally applicable to all men. A small proportion of married males, around 5% of them, lived in their parents’ household as married son of the head in their twenties and low thirties. They became head of household in the second half their thirties. Passing on head of household position was very rare under age 55. Widowers not yet in old age firmly lead their household. It is also likely that they shortly re-married after the death of their wife. Retirement from head of household position normally took place above age 55. 33% of males above age 60 were in the father of head of household category. 56% and a further 8% of them remained in the head position as married male or widower.
The category of other relative of the head was rather significant regarding females. Single women in age groups 15–34 were sisters of the head, and the married ones in similar age were daughter-in-law or sister-in-law of the head. Marriage and the taking up wife role started at an early stage, around age 15–19, and this process grew mature around age 25–29. Almost 90% of women in age groups 30–39 cohabitated as wives, daughter-in-laws or sister-in-laws of the head. At an older age, the number of widow(er) heads gradually grew.
Share of widow heads is very low and the majority of them are above age 40. This low proportion can be explained by the fact that this role was temporary for them. Mainly females above age 50 belong to the category of mothers of head, which may be due to the coerced retirement upon the death of her husband. Only 40% of females above age 60 were wives, since widow heads, mothers and other relatives (mother-in-law) statuses were predominant in such age. Therefore, my assumption, namely, a significant proportion of women find support in the household of her married child, is confirmed.
An important factor of households of the two settlements was almost the total absence of servants and non-relatives. It seems that the close relatives, dominantly the unmarried siblings of the head, did tasks that were normally carried out by servants and non-relatives in other societies.
6. Household as production and consumption unitHousehold was the place of production, consumption and demographic reproduction in most pre-industrial peasant economies. According to A. V. Chayanov, the Russian economist, the intensity of production and the demographic cycle of household are in a strong relationship that is well described by the labour/consumption ratio of the household (Chayanov 1966). Based on Chayanov’s theory, I shall reconstruct the modifications of
Population in History ● 35
workforce of household and consumption need during family life cycle. I applied the method suggested by Christer Lundh (Lundh 1995) for estimating workforce capacity of the family farm. In accordance with this, I supposed that adult males worth one labour unit; children in age group 0–8 did not work at all; children in age group 9–15 and males above age 55 totaled up to 50% of workforce of adults; due to constant pregnancy and nursing, adult females are considered as 80% of the workforce of adults10.
Calculation of consumption needs can be carried out in various methods11. In this paper, I apply the system elaborated by the United Nations. Based on this, I suppose that the consumption need varies with age and gender of the individuals. Consumption of adult males in age groups 15–59 is regarded as 1 consumption unit. Considering children in age groups 0–14, I assumed that their consumption gradually increases: one fifth of 1 consumption unit between age 0–1, while above age 14 it equals with the consumption of adult males. Adult females in age groups 14–59 and old people above age 60 totaled up to 80% of 1 consumption unit12.
Figure 6 demonstrates the quotient of consumption need and workforce by the age of head of household. Value of rate fluctuates between 0 and 1: 1 means perfect balance of production and consumption, namely, workforce capacity of members of household was in total correspondence with the total consumption need. Value under 1 reveals the vulnerability of households from an economic perspective and, moreover, which of them are characterized by relatively good living conditions.
Our results reinforce the validity of the model elaborated by Chayanov. According to this, lifespan of households are characterized by particular cycles: the living standard by consumption needs/workforce capacity decreased in the first 10–15 years subsequent to marriage, then a slow increase is observed. In parallel with child-bearing, the consumption needs of households raised, while the potential workforce capacity remained in a lower level.
10 Christer Lundh assumed that grown men and women represent 1 working unit. Using longitudinal data he made exception in the case of pregnant and breastfeeding women, in this latter case assuming 0.5 work unit. Our data provided no information on child-bearing period of women. Therefore I modified the scale proposed by Lundh, assuming 0.8 workforce capacity in the case of adult women. Muriel Neven adopted a similar approach (Neven 2003: 137–138). 11 For a review see Henderson, Wall 1994: 7, Neven 2003: 135–136.12 The United Nations scale in detail: children in age group 0–1 = 0.2; children in age group 2–3: 0.3; children in age group 4–5: 0.4; children aged 6–7: 0.5; children in age group 8–9: 0.6; children in age group 10–11: 0.7; children in age group 12–13: 0.8; women in age group 14–59: 0.8; men in age group 14–59: 1.0; persons above age 60: 0.8.
36 ● Romanian Journal of Population Studies ● Vol. VII, No. 2
Figure 6. Changes in the producer/consumer ratio by the age of household head in the two villages, 1868
Source: see note 8.
In the next phase of family life cycle, when children reach the age in which they are available for working, the workforce capacity and the consumption needs leveled off with each other and the living standard reached, indeed exceeded what it was upon marriage. In households lead by heads above age 60, however, the living standards decreases again.
The issue of living standard of households may be investigated from another perspective. Based on David Reher’s method (Reher 1997: 91–92), I calculated how the number and age of children of the household was affected by the age of head (Figure 7)13.
In the beginning of the family life cycle, the average number of children above age 2 in the household was one. 20 years later, the average number of children is 3.1 and the average age of children is 12 years. This latter category reached 14 years in households where the head was between age 50–54, that is to say, the oldest child was grown up enough to increase family’s work force capacity. This period, however, also meant the decrease of average number of children for households, since the older children, mainly the daughters, left the family upon concluding marriage.
13 The method is used also by Muriel Neven (Neven 2003: 141).
Population in History ● 37
Figure 7. The number and mean age of children by household and the age of household heads in the two villages in 1868
Source: see note 8.
All in all, the living standard of households in the two settlements strongly corresponds with the process of family cycle. The decrease of living standard characterizes the initial and the final stage of family cycle. Consequently, the youngest and the oldest members of household were affected by the negative consequences of the process. A relatively balanced state and the increase in the living standard were observed in households and their members in the midst of the family cycle. It is also important to note that households could be able to modify the forms of the above family transfer by involving underage children and grandparents in the family work.
7. ConclusionsIn this paper, I investigated the family and household structure of the two mountains communities, Vlăhiţa and Căpâlniţa, by analyzing the data of individual lists of parishioners from 1868. I applied synthetic cohort approach, that is, characteristics of individuals of different age comprising cross-sectional data were regarded as cohort effect. During the analysis of living arrangements, I tried to maintain an individual perspective besides family and household effect. The results reinforced the conclusions of the previous Hungarian studies on the same subject.
38 ● Romanian Journal of Population Studies ● Vol. VII, No. 2
Analysis of cross-sectional data revealed the dominance of simple family household. Data arranged by the age of head of household, however, reflected the fact that the size and structure of peasant households varied over the family life cycle, and a complex phase of households was common in these regions too.
A very significant factor of the households was the almost total lack of servants and non-relatives. The close relatives–siblings and stem family members of head of household–carried out those tasks that normally servant and/or non-relatives did in other societies. For the majority of males, the chores as head of household and husband corresponded. However, a small group of them started their family life in households lead by their father or brother.
The last part of this paper focused on the micro-economical analysis of households. Based on Chayanov’s model, I estimated the work/consumption quotients during the family cycle. My results corresponded with the Russian data, namely, economic circumstances of households vary in accordance with the family lifecycle. A further study may investigate to what extent the effects of family cycle influenced the demographic decisions of households, and, moreover, how the tight network of relatives crossing the boundaries of households reduce the negative effects of family cycle.
References
Primary Sources
A Kápolnás Oláhfalvi hívek lakhely és szám szerinti általános összeírása 1868-ban január elsejétől kezdve. [List of souls in Căpâlniţa by place and street number from 1st of January 1868]. Kápolnásfalvi Római Katolikus Plébánia Levéltára. [Roman Catholic Parish Archive, Căpâlniţa].
Megnyitása a Szentegyházas Oláhfalvi hívek általános összeírásának Bálint Ignác plébános által az 1868-dik évben. [List of souls in Vlăhiţa made by the priest Ignác Bálint in 1868]. Szentegyházasfalvi Római Katolikus Plébánia Levéltára. [Roman Catholic Parish Archive, Vlăhiţa].
Census 1869. Az 1870. év elején végrehajtott népszámlálás eredményei. [Results of the census 1870]. Budapest, 1871.
Population in History ● 39
Secondary Sources
Andorka, R. (1975). “Paraszti családszervezet a 18–19. században. Alsónyék és Kölked adatai nemzetközi összehasonlításban”. [Peasant family organization in 18-19th centuries. The data of Alsónyék and Kölked in international comparison]. Ethnographia 2–3: 340–367.
Andorka, R and Faragó, T. (1984).“Az iparosodás előtti (18–19. századi) család- és háztartásszerkezet vizsgálata”. [Pre-industrial Household Structure in Hungary]. Agrártörténeti Szemle 26 (3–4): 402–437.
Andorka, R and Faragó, T. (1983).“Pre-industrial Household Structure in Hungary”. In Wall, R., Robin, J., Laslett, P. (eds.). Family Forms in Historic Europe. Cambridge: Cambridge University Press, pp. 281–307.
Balázs, M. and Katus, L. (1983).“Közép-Dunántúli paraszti háztartások a XVIII. században”. [Peasant households from Central Transdanubia in 18th centuries]. Történelmi Szemle 1: 159–171.
Bácskai, V. (1992). Család, háztartás, társadalom Budán a 19. század elején. [Families, households and society in Buda, first decades of 19th century]. Budapest: KSH Könyvtár és Dokumentációs Szolgálat.
Benda, Gy. (2002). “A háztartások nagysága és szerkezete Keszthelyen, 1757–1851”. [The household size and structure in Keszthely, 1757–1851]. KSH NKI Történeti Demográfiai Évkönyve [HCSO DRI Historical Demographic Yearbook] 3: 109–141.
Burguière, A. et al. (eds.). (1986). Histoire de la famille. Paris: Armand Collin.Chayanov, V. A. 1966 [1925]. The Theory of Peasant Economy. Homewood, IL: R.
D. Irwin.Faragó, T. (1977). “Háztartásszerkezet és falusi társadalomfejlődés
Magyarországon, 1787-1828”. [Household structure and the development of rural society in Hungary, 1787–1828]. Történeti Statisztikai Tanulmányok 3: 105-214.
Faragó, T. (1985). Paraszti háztartás- és munkaszervezet-típusok Magyarországon a 18. század közepén. Pilis-Buda környéki birtokos paraszti háztartások 1745–1770 között. [Peasant households and work-organization types in Hungary, landholder peasant households from Pilis-Buda, 1745–1770]. (Történeti statisztikai füzetek 7.). Budapest: KSH Könyvtár és Dokumentációs Szolgálat.
Faragó, T. (1997). “Család és háztartás Magyarországon a 18. században”. [Families and households in 18th century Hungary]. In Kovacsics, J. (ed.): Magyarország történeti demográfiája [896–1995]. Budapest: KSH, pp. 217–239.
40 ● Romanian Journal of Population Studies ● Vol. VII, No. 2
Faragó, T. (2000).“Nemek, nemzedékek, rokonság, család”. [Gender, generation, kinship and family]. In Sárkány, M. and Szilágyi, M. (eds.). Magyar Néprajz VIII. Társadalom. Budapest: Akadémiai K., pp. 393-483.
Faragó, T. (2003).“Different Household Formation Systems in Hungary at the End of the 18th Century: Variations on John Hajnal's Thesis”. Demográfia. English Edition 46: 95–136.
Faragó, T. (2005).“Életciklusok és családmodellek egy magyarországi városban a 18–19. században”. [Life cycles and family models in a hungarian town, 18-19th centuries]. Demográfia 48 (4): 415–435.
Gruber, S. and Szoltysek, M. (2012).“Stem Families, Joint Families, and the European Pattern: What kind of a Reconsideration Do We Need?”. Journal of Family History 37 (1): 105–125.
Hajnal, J. (1965). “European marriage patterns in perspective”. In Glass, V. David and Eversley, E. C. David (eds.). Population in History. London: Edward Arnold, pp. 101–143.
Hajnal, J. (1983). “Two kinds of preindustrial household formation systems”. In Wall, R., Robin, J., Laslett, P. (eds.). Family forms in historic Europe. Cambridge: Cambridge University Press, pp. 65–104.
Heilig, B. (2000).“Paraszti háztartások és háztartásciklusok Szőlősardón a 19. század második felében”. [Peasant households and household cycles in Szőlősardó, second half of the 19th century]. KSH NKI Történeti Demográfiai Évkönyve [HCSO DRI Historical Demographic Yearbook] 1: 225–265.
Henderson, J.and Wall, R. (1994). “Introduction”. In Henderson, J.and Wall, R. (eds.). Poor women and children in the European Past. London: Routledge, pp.1–28.
Hermann, G. M. (1999). “Az udvarhelyszéki Havasalja kiváltságos települései: a két Oláhfalu és Zetelaka”. [The privilegious settlements in Havasalja, Udvarhelyszék district]. In Kiss, A., Kovács Kiss, Gy., Pozsony F. (eds.). Emlékkönyv Imreh István nyolcvanadik születésnapjára. [István Imreh memorial volume in honor of his 80th birthday]. Kolozsvár: Erdélyi Múzeum-Egyesület, pp. 138–198.
Husz, I. (2002). Család és társadalmi reprodukció a 19. században. Történeti-szociológiai tanulmány egy Buda-környéki mezőváros társadalmáról a családszerkezet változásának tükrében. [Family and social reproduction in 19th century]. Budapest: Osiris.
Kocsis, Gy. (1992). “Ceglédi katolikusok többcsaládos háztartásai a XVIII. század második felében”.[Multiple family households of Roman Catholics from Cegléd in the second half of the 19th century]. In Mohay, T. (ed.). Közelítések: néprajzi, történeti, antropológiai tanulmányok Hofer Tamás 60. születésnapjára. [Ethnographical, historical and anthropological studies in honor of Tamás Hofer 60th birthday]. Debrecen: Ethnica, pp.187–198.
Population in History ● 41
Laslett, P. (ed.). (1972). Household and Family in Past Time. Cambridge: Cambridge University Press.
Lundh, C. (1995). “Households and families in pre-industrial Sweden”. Continuity and Change 10 (1): 33–68.
Melegh, A. (1987). “A tizenkilencedik század eleji városi háztartások Buda Újlakon”. [Urban households from the first decades of 19th century in Buda Újlak] In Lengyel, Gy. (ed.). Történeti szociológiai tanulmányok a 19–20. századi magyar társadalomról. [Historical sociology studies of the 19-20th century Hungarian society]. Budapest: Marx Károly Közgazdaságtudományi Egyetem Szociológiai Tanszék, pp. 135–178.
Neven, M. (2003). Individus et familles: Les dynamiques d’une société rurale. Le pays de Herve dans la seconde moitié du XIXe siècle. Liège: Bibliothèque de la Faculté de Philosophie et Lettre de l’Université de Liège.
Oris, M. (2003).“Demografia storica e storia della famiglia. Due genealogie intellettuali”. In Breschi, M., Derosas, R., Viazzo, P. P. (eds.). Piccolo è bello. Approcci microanalitici nella ricerca storico-demografica. Udine: Forum, pp. 13–36.
Őri, P. (2005).“Kiskunhalas népessége 1869-ben”.[Population of Kiskunhalas in 1869] In Ö. Kovács, J., Szakál, A. (eds.). Kiskunhalas története 3. Tanulmányok Kiskunhalasról a 19. század közepétől a 20. század közepéig. [The history of Kiskunhalas]. Kiskunhalas, pp. 269–292.
Őri, P. (2007).“Család és házasodás a 18–19. századi Magyarországon. Pest–Pilis–Solt–(Kiskun) megye, 1774–1900”. [Families and marriage in Hungary, 18-19th centuries]. Korall 30 (8): 61–98.
Őri, P. (2008).“A háztartások struktúrája a 18. század végi Magyarországon. Elemzési kísérlet”. [Household structure in Hungary at the end of the 18th century]. KSH NKI Történeti Demográfiai Évkönyve [HCSO DRI Historical Demographic Yearbook] 2006–2008: 41–80.
Őri, P. (2009). “Marriage Customs and Household Structure in Hungary at the end of the 18th Century. The Case of County Pest-Pilis-Solt (1774–1785)”. In Fauve-Chamoux, A., Bolovan, I. (eds.). Families in Europe between the 19th and 21st Centuries. From the the Traditional Model to the Contemporary PACS. (Supplement of the Romanian Journal of Population Studies). Cluj-Napoca: Cluj University Press, pp. 167–192.
Őri, P., Pakot, L. (2012). Census and census-like material preserved in the archives of Hungary, Slovakia and Transylvania (Romania), 18–19th centuries. Mosaic Working Paper WP-2012-002. Rostock: Max Planck Institute for Demographic Research.
42 ● Romanian Journal of Population Studies ● Vol. VII, No. 2
Pál, J. (2003). Városfejlődés a Székelyföldön, 1750–1914. [The urban development in Szeklerland, 1750–1914]. Csíkszereda: Pro-Print,
Pozsgai, P. (2000).“Család, háztartás és tulajdon Torna vármegyében a 19. század második felében”. [Families, households and propriety in county Torna int he second half of the 19th century]. KSH NKI Történeti Demográfiai Évkönyve [HCSO DRI Historical Demographic Yearbook] 1: 166–224.
Pozsgai, P. (2001).“Család- és háztartásciklusok vizsgálatának eredményei a történeti demográfiai kutatásokban”. [Results of the family- and household cycle studies] KSH NKI Történeti Demográfiai Évkönyve [HCSO DRI Historical Demographic Yearbook] 2: 265–281.
Reher, S. D. (1997). Perspectives on the family in Spain, past and present. New York: Clarendon Press.
Sovič, S. (2005). “Families and households of the poor: The 19th century Slovenian gostači. ”. The History of the Family 10: 161–182.
Wall, R., Robin, J., Laslett, P. (eds.). (1983). Family forms in historic Europe. Cambridge: Cambridge University Press.