18
Ron Harbour President Harbour Consulting
| Date post: | 29-Dec-2015 |
| Category: |
Documents |
| Upload: | denis-stewart |
| View: | 222 times |
| Download: | 1 times |
Ron HarbourPresident
Harbour Consulting
Flexible Manufacturing
© 2005 Harbour Consulting. All Rights Reserved
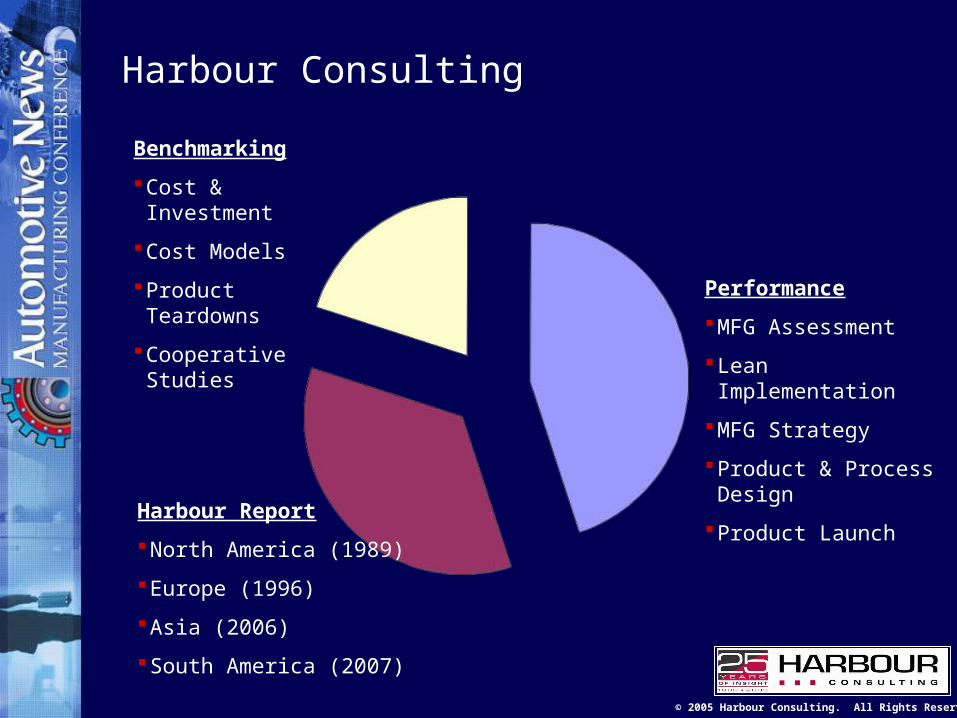
Harbour Consulting
Benchmarking
Cost & Investment
Cost Models
Product Teardowns
Cooperative Studies
Harbour Report
North America (1989)
Europe (1996)
Asia (2006)
South America (2007)
Performance
MFG Assessment
Lean Implementation
MFG Strategy
Product & Process Design
Product Launch
© 2005 Harbour Consulting. All Rights Reserved
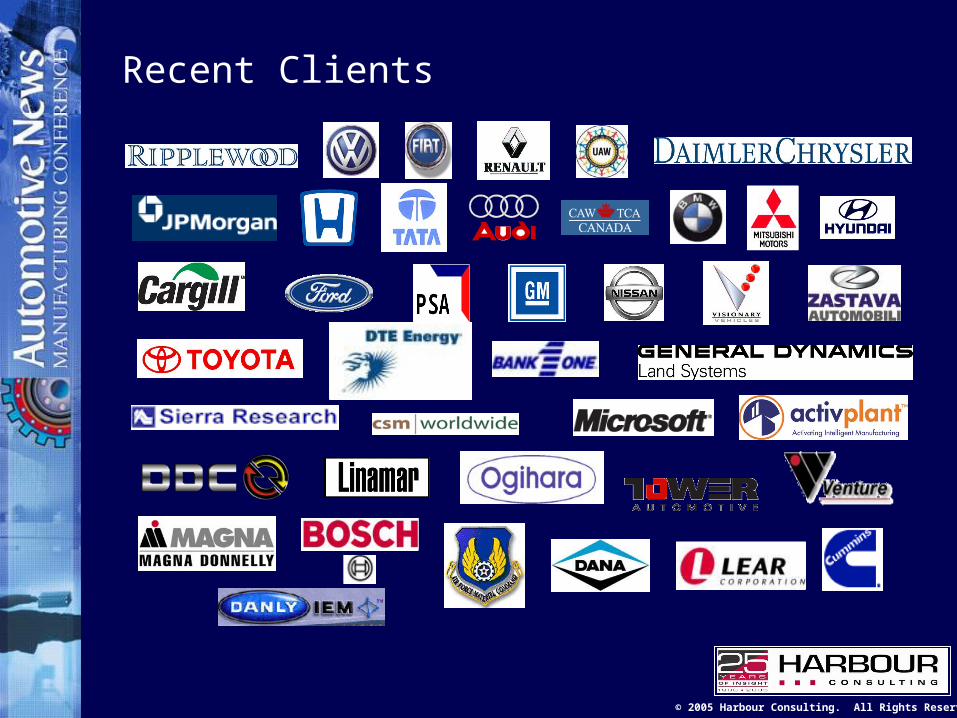
Recent Clients
© 2005 Harbour Consulting. All Rights Reserved
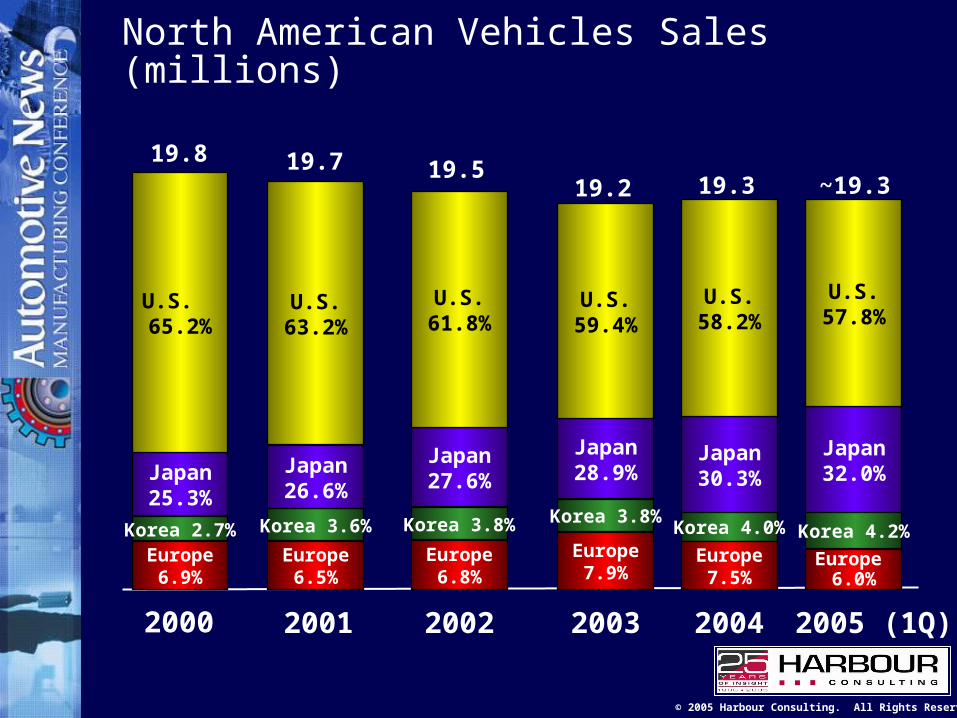
2000
Korea 2.7% Korea 3.6%
19.8 19.7
Europe6.9%
Japan25.3%
U.S. 65.2%
Europe6.5%
Japan26.6%
U.S.63.2%
Korea 3.8%
Europe6.8%
Japan27.6%
U.S.61.8%
19.5
2001 2002
Korea 3.8%
Europe7.9%
Japan28.9%
U.S.59.4%
19.2
2003 2005 (1Q)
North American Vehicles Sales (millions)
Korea 4.0%
Europe7.5%
Japan30.3%
U.S.58.2%
19.3
2004
Korea 4.2%
Europe 6.0%
Japan32.0%
U.S.57.8%
~19.3
© 2005 Harbour Consulting. All Rights Reserved
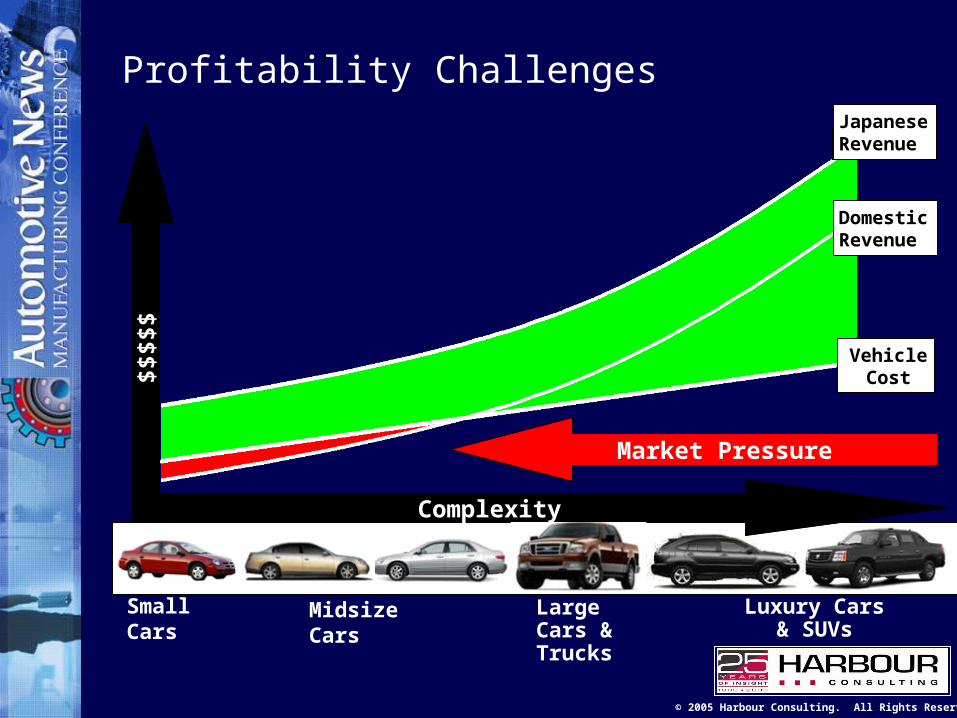
VehicleCost
Revenue
Domestic Revenue
Japanese Revenue
Market Pressure
Small Cars Midsize Cars Large Cars & Trucks
Luxury Cars & SUVs
$$$$
$
Complexity
Profitability Challenges
© 2005 Harbour Consulting. All Rights Reserved
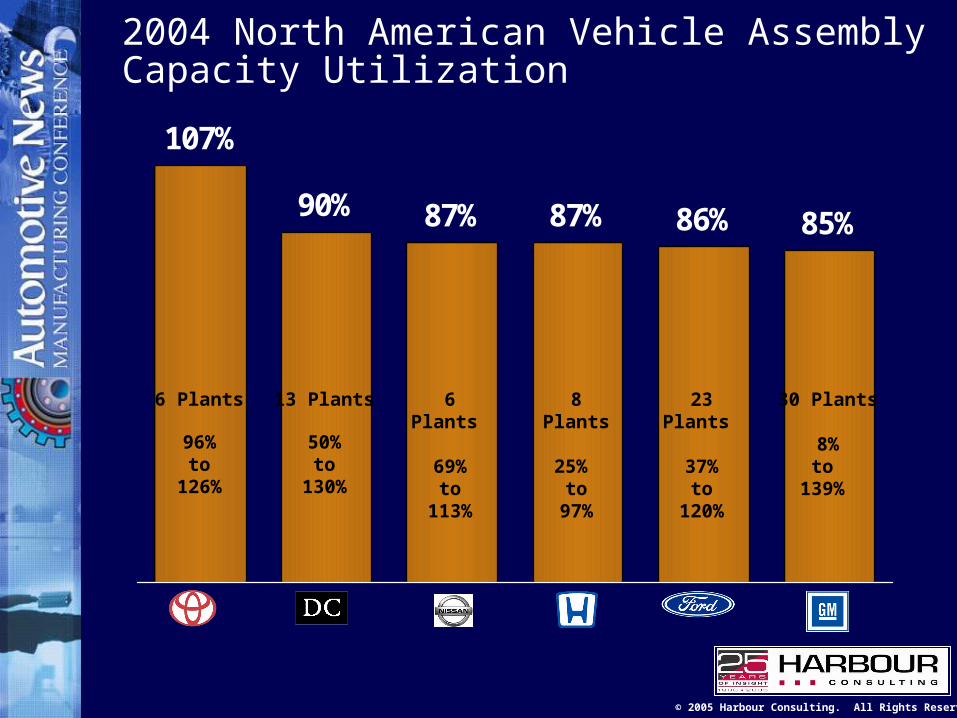
2004 North American Vehicle Assembly Capacity Utilization
107%
90% 87% 87% 86% 85%
8 Plants
25% to
97%
6 Plants
69%to
113%
23 Plants
37%to
120%
30 Plants
8%to
139%
6 Plants
96%to
126%
13 Plants
50%to
130%
© 2005 Harbour Consulting. All Rights Reserved
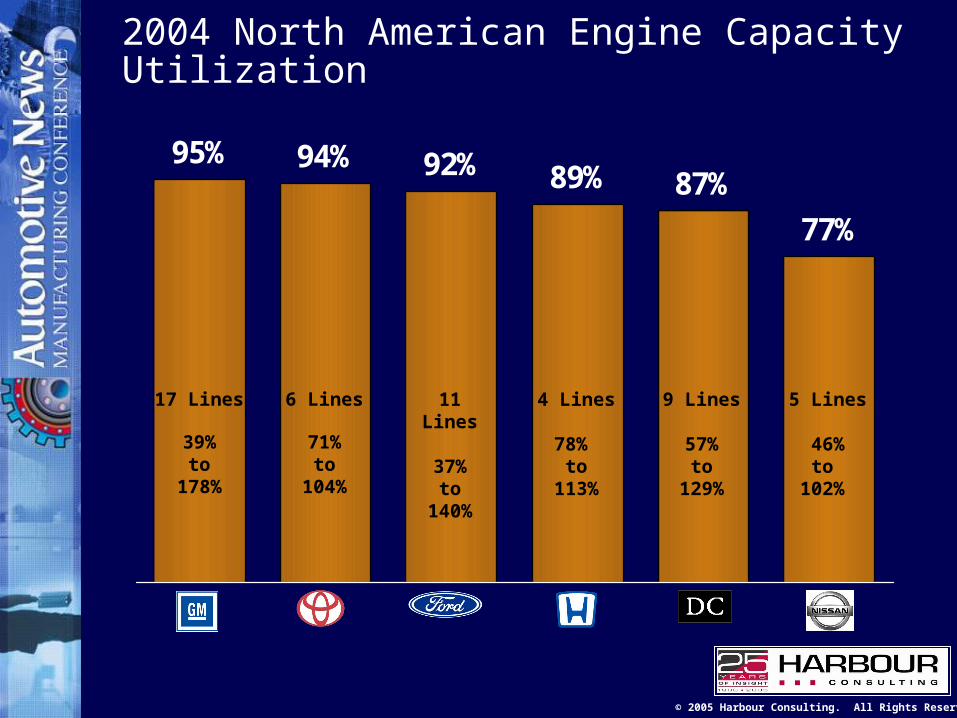
2004 North American Engine Capacity Utilization
95% 94% 92% 89% 87%
77%
4 Lines
78% to
113%
11 Lines
37%to
140%
9 Lines
57%to
129%
5 Lines
46%to
102%
17 Lines
39%to
178%
6 Lines
71%to
104%
© 2005 Harbour Consulting. All Rights Reserved
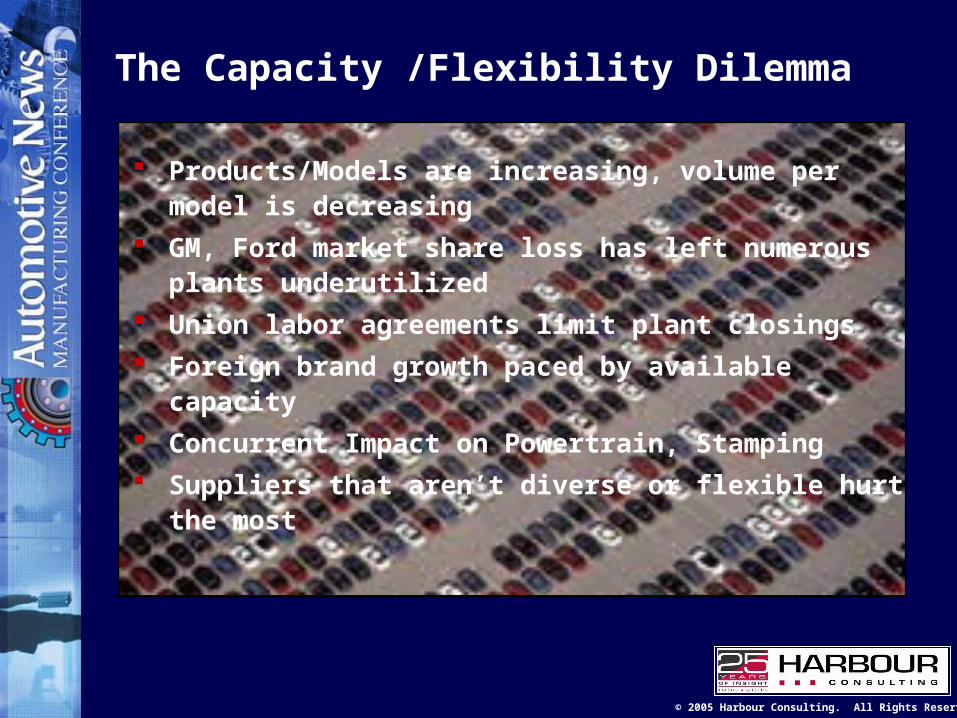
The Capacity /Flexibility Dilemma
Products/Models are increasing, volume per model is decreasing
GM, Ford market share loss has left numerous plants underutilized
Union labor agreements limit plant closings
Foreign brand growth paced by available capacity
Concurrent Impact on Powertrain, Stamping
Suppliers that aren’t diverse or flexible hurt the most
© 2005 Harbour Consulting. All Rights Reserved
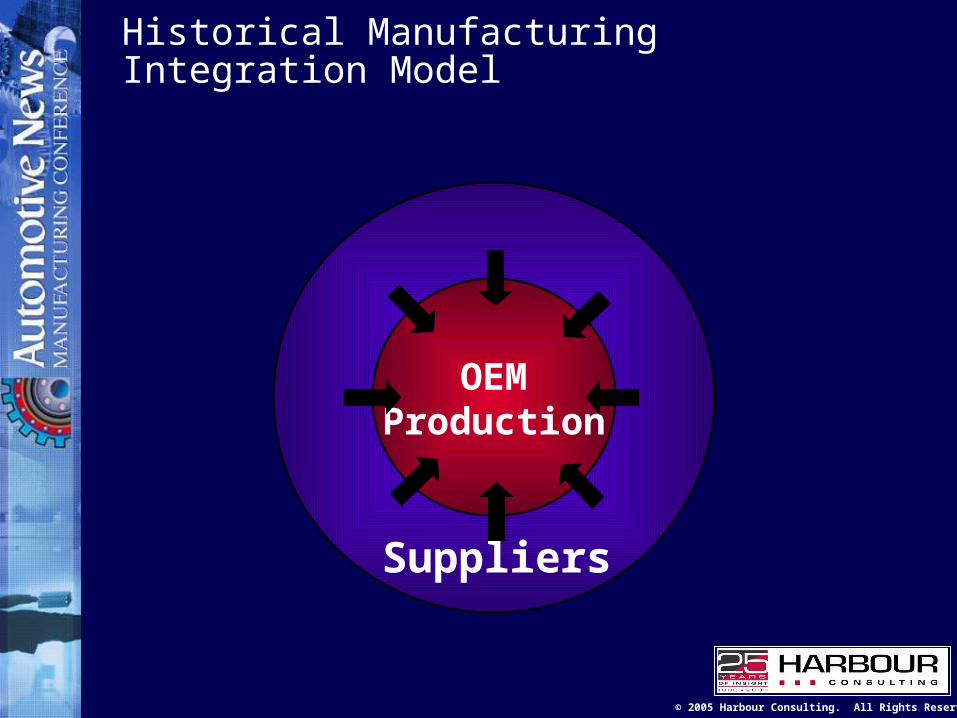
Historical ManufacturingIntegration Model
OEMProduction
Suppliers
© 2005 Harbour Consulting. All Rights Reserved
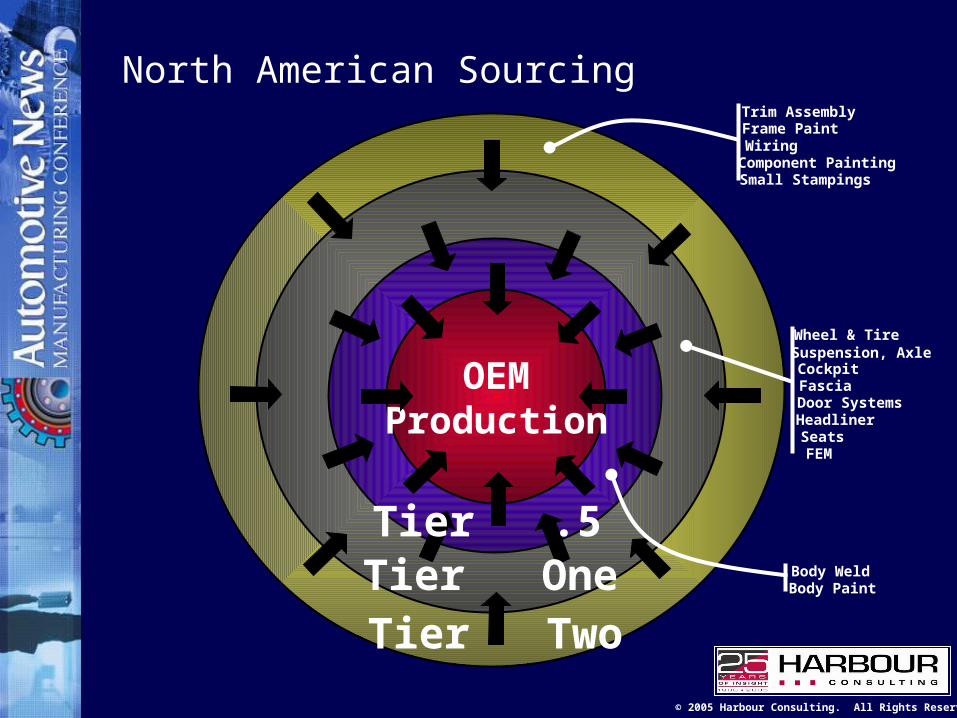
North American Sourcing
OEMProduction
Tier .5
Tier TwoTier One
Trim AssemblyFrame PaintWiringComponent PaintingSmall Stampings
Wheel & TireSuspension, AxleCockpitFasciaDoor SystemsHeadlinerSeatsFEM
Body Weld Body Paint
© 2005 Harbour Consulting. All Rights Reserved
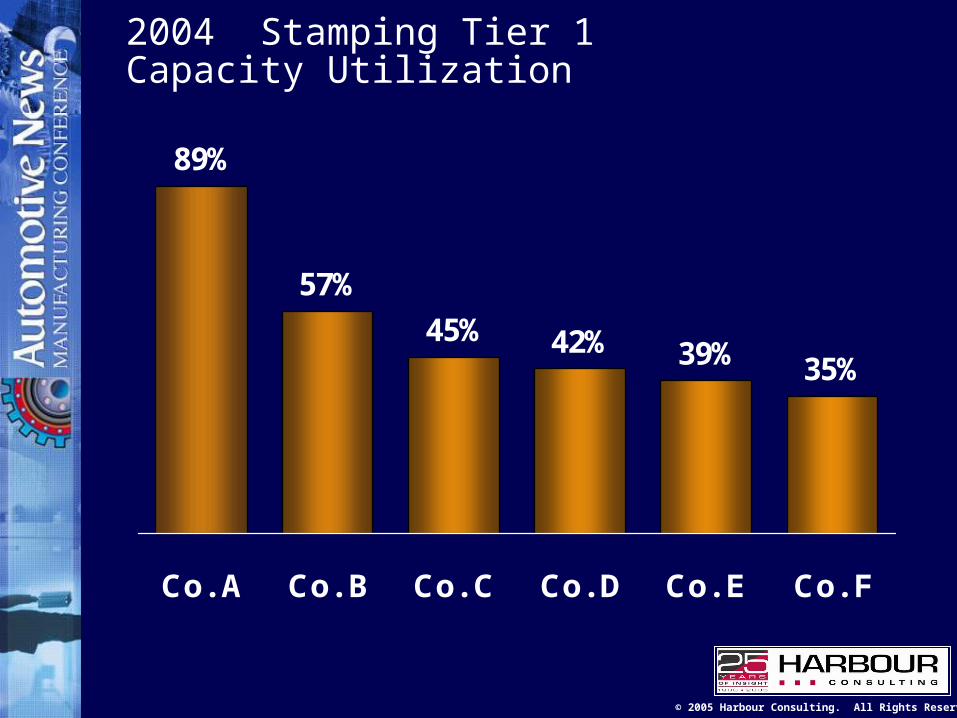
2004 Stamping Tier 1 Capacity Utilization
89%
57%
45% 42% 39% 35%
Co. A Co. B Co. C Co. D Co. E Co. F

© 2005 Harbour Consulting. All Rights Reserved
What is Manufacturing Flexibility?
Capable of Building numerous models in one process
Capable of producing multiple architectures/platforms all in a single process
Ability to add a product with minimal disruption, cost, and time
Rapid product mix change Quick new product launch

© 2005 Harbour Consulting. All Rights Reserved
Flexibility Enablers
Similar architecture Common build sequence Layout for “flex” manning Well trained, rotating workforce Quick part switch Responsive Suppliers
Capacity must be generic
© 2005 Harbour Consulting. All Rights Reserved
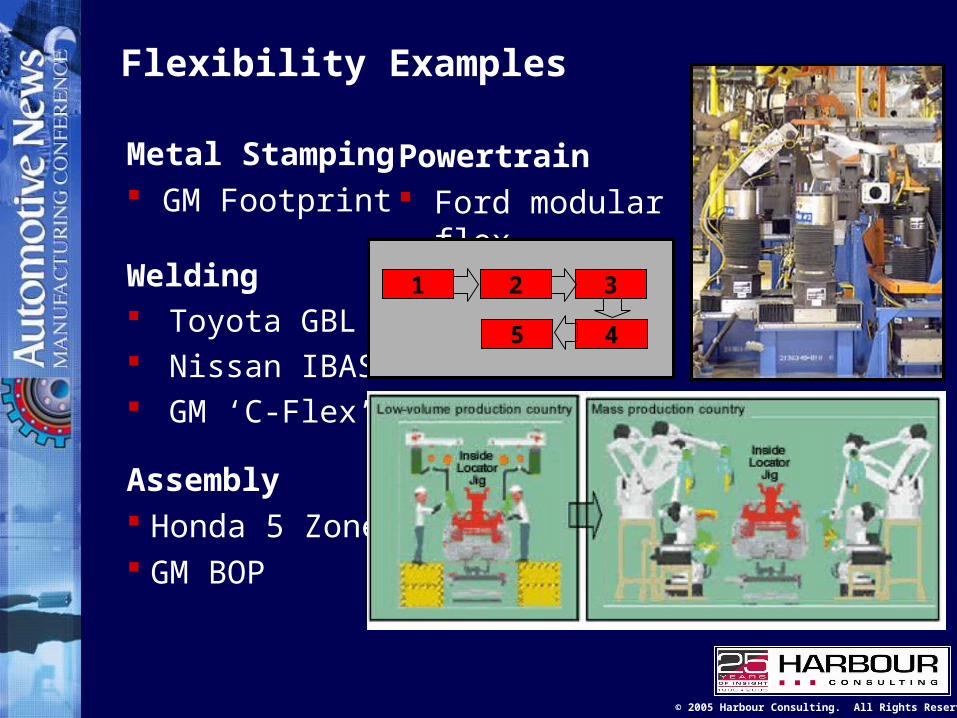
Flexibility Examples
Welding Toyota GBL Nissan IBAS GM ‘C-Flex’
Metal Stamping GM Footprint
Powertrain Ford modular flex
Assembly Honda 5 Zone GM BOP
1 2 3
45
© 2005 Harbour Consulting. All Rights Reserved
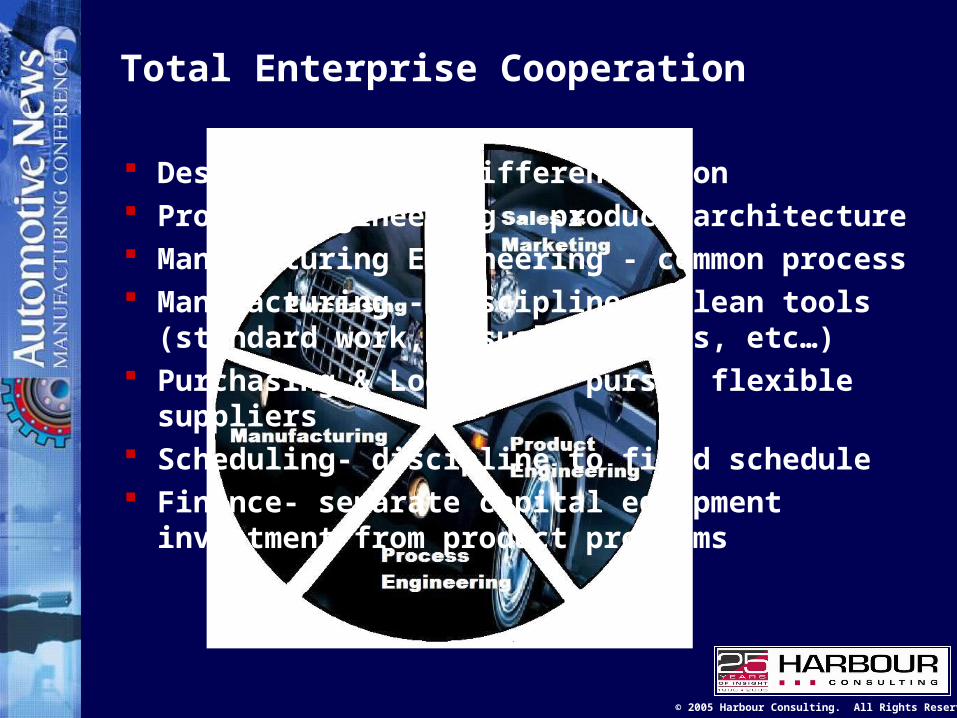
Total Enterprise Cooperation
Design- focus on differentiation Product Engineering - product architecture Manufacturing Engineering - common process Manufacturing - discipline to lean tools (standard
work, visual controls, etc…) Purchasing & Logistics- pursue flexible suppliers Scheduling- discipline to fixed schedule Finance- separate capital equipment investment
from product programs
© 2005 Harbour Consulting. All Rights Reserved
The Bottom Line
Flexibility is important for all plants but even more critical for suppliers
Some manufacturers are more effective at low cost flexibility than others- a significant competitive differentiator
Flexibility does not have to cost more money The winners will be the plants that can handle
variety and change quickly from old to new

Ron HarbourPresident
Harbour Consulting


