38
Room acoustic modelling techniques: A comparison of a scale model and a computer model for a new opera theatre ISRA 2010, Melbourne, Australia Jens Holger Rindel Odeon A/S
Room acoustic modelling techniques: A comparison of a scale model and a computer model for a new opera theatre
ISRA 2010, Melbourne, Australia
Jens Holger Rindel
Odeon A/S

Outline
• The project• Computer model • Results from computer simulations• Scale model and measurement technique
ISRA Melbourne 2010 2
• Scale model and measurement technique• Materials and adjustment of absorption• Results from scale model measurements• Comparison of results and methods• Conclusion

The project
Ankara Congress and Cultural Centre
Opera theatre with approx 1400 seats
Architect: Özgür Ecevit, Turkey
Acoustic consultant: Jordan Akustik and J.H. Rindel
ISRA Melbourne 2010 3

Design goals
ISO 3382 parameters (with full audience)
ISRA Melbourne 2010 4

Computer model – room modelModel in the final phase 3. Design and materials were adjusted according to results from the previous phases.
ISRA Melbourne 2010 5
2 source positions stagepit
7 receiver positionsmain floorbalconies
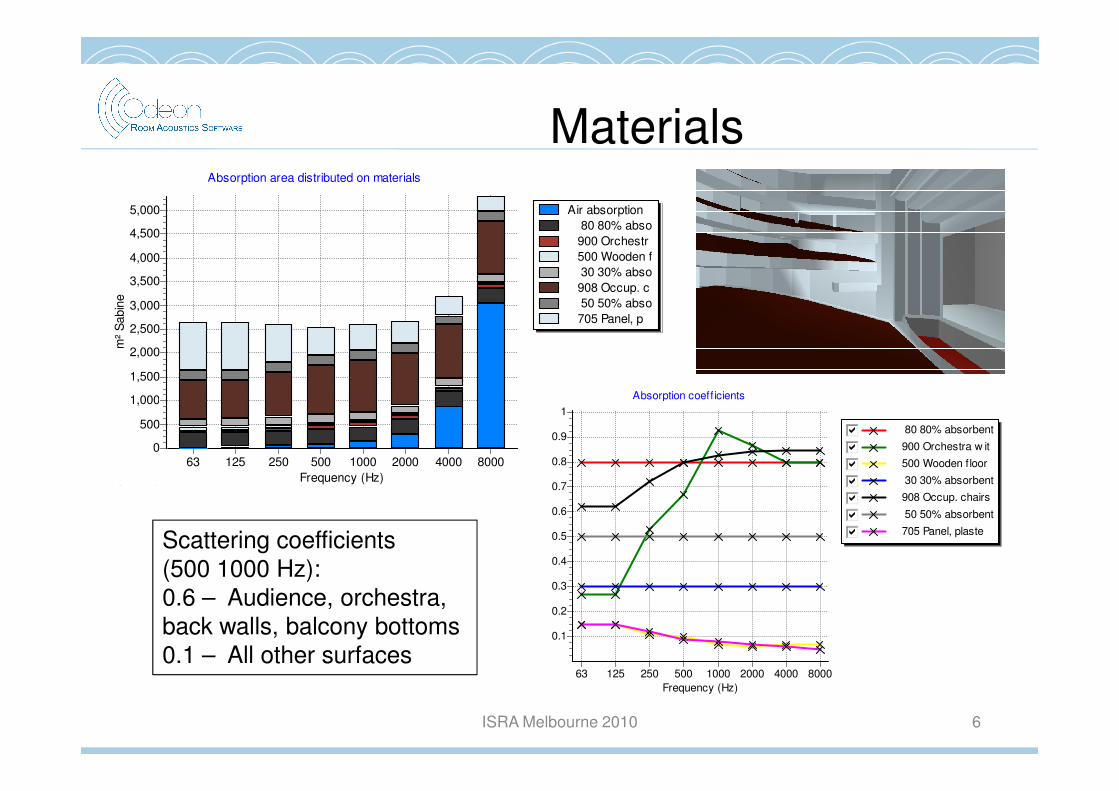
Materials
Air absorption 80 80% abso 900 Orchestr 500 Wooden f 30 30% abso 908 Occup. c 50 50% abso 705 Panel, p
Absorption area distributed on materials
m²
Sab
ine
5,000
4,500
4,000
3,500
3,000
2,500
2,000
1,500
1,000 Absorption coeff icients
ISRA Melbourne 2010 6
Frequency (Hz)63 125 250 500 1000 2000 4000 8000
1,000
500
0
Odeon©1985-2010 Licensed to: Odeon A/S Restricted version - research and teaching only!
80 80% absorbentgfedcb 900 Orchestra w itgfedcb 500 Wooden f loor gfedcb 30 30% absorbentgfedcb 908 Occup. chairsgfedcb 50 50% absorbentgfedcb 705 Panel, plastegfedcb
Absorption coeff icients
Frequency (Hz)63 125 250 500 1000 2000 4000 8000
1
0.9
0.8
0.7
0.6
0.5
0.4
0.3
0.2
0.1
Odeon©1985-2010 Licensed to: Odeon A/S Restricted version - research and teaching only!
Scattering coefficients (500 1000 Hz):0.6 – Audience, orchestra, back walls, balcony bottoms0.1 – All other surfaces

Calculation results
ISRA Melbourne 2010 7
Average of 7 receiver positions
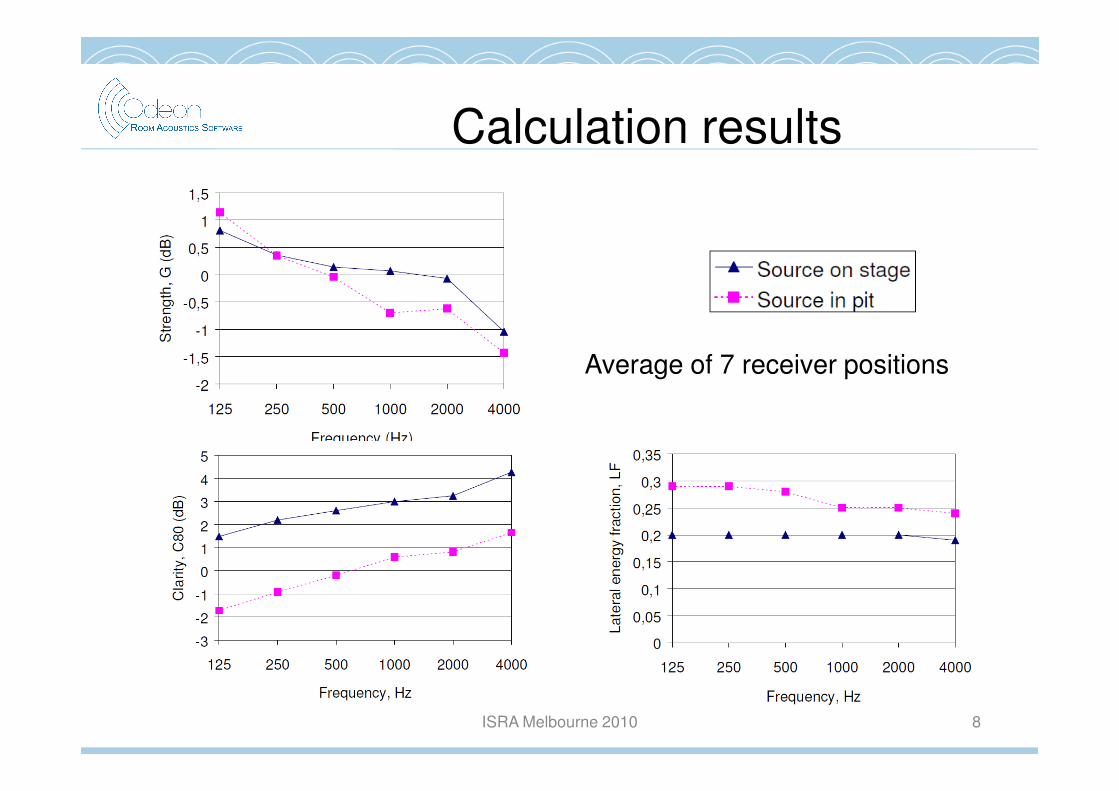
Calculation results
Average of 7 receiver positions
ISRA Melbourne 2010 8
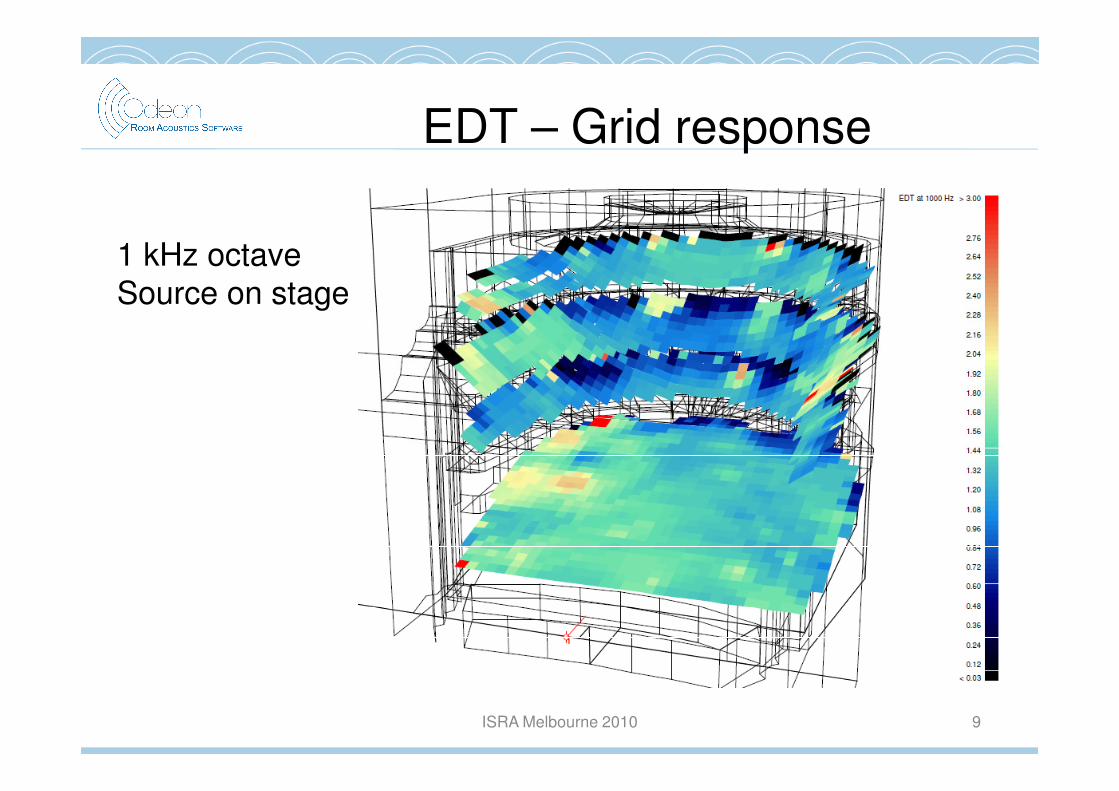
EDT – Grid response
1 kHz octaveSource on stage
ISRA Melbourne 2010 9

Strength G – Grid response
1 kHz octaveSource on stage
ISRA Melbourne 2010 10

Clarity C80 – Grid response
1 kHz octaveSource on stage
ISRA Melbourne 2010 11

LF – Grid response
1 kHz octaveSource on stage
ISRA Melbourne 2010 12
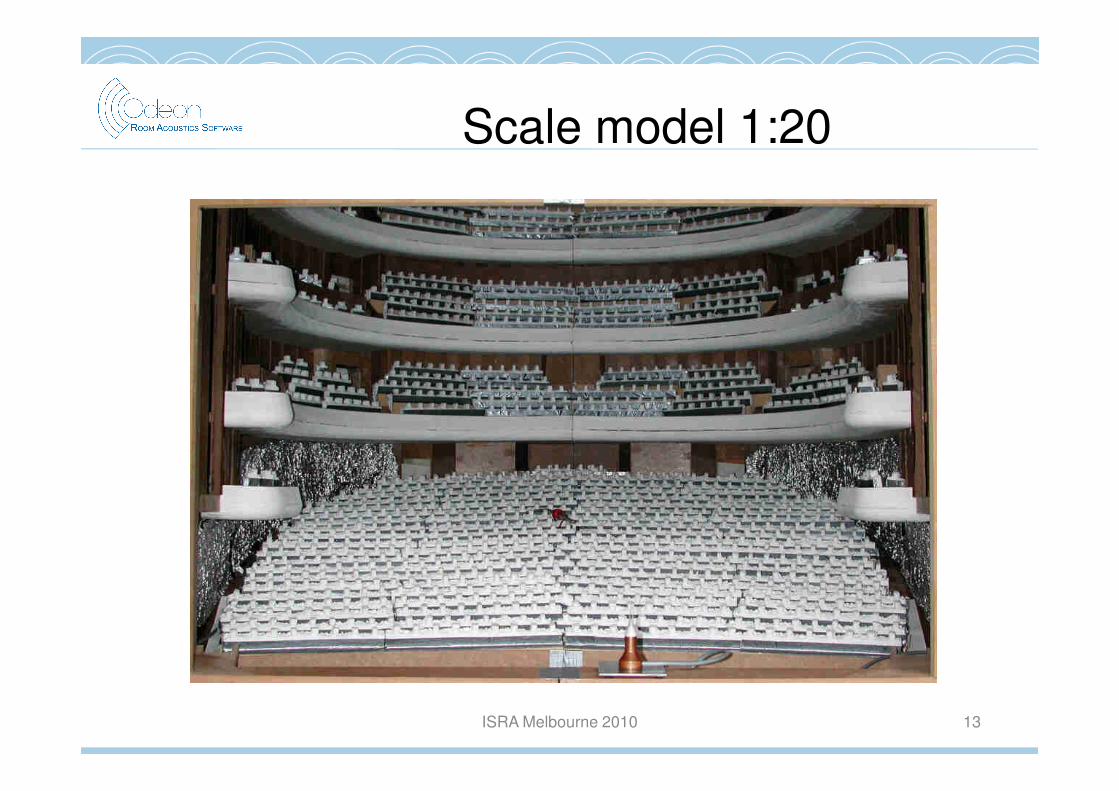
Scale model 1:20
ISRA Melbourne 2010 13
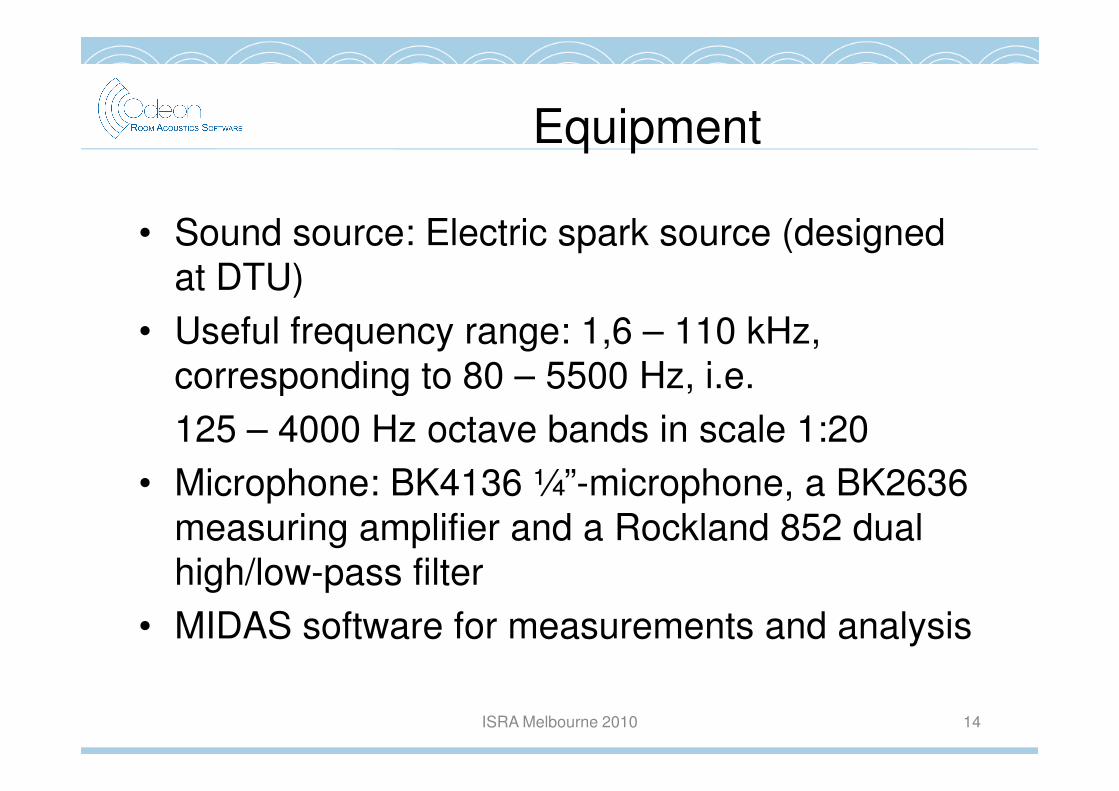
Equipment
• Sound source: Electric spark source (designed at DTU)
• Useful frequency range: 1,6 – 110 kHz, corresponding to 80 – 5500 Hz, i.e.
ISRA Melbourne 2010 14
corresponding to 80 – 5500 Hz, i.e.
125 – 4000 Hz octave bands in scale 1:20
• Microphone: BK4136 ¼”-microphone, a BK2636 measuring amplifier and a Rockland 852 dual high/low-pass filter
• MIDAS software for measurements and analysis

Measurement setup
ISRA Melbourne 2010 15

Spectrum of spark source (Frequency / 20)
ISRA Melbourne 2010 16

Air conditions
• Temperature and humidity was kept very stable. RH around 60%
• The MIDAS measurement system adjusted the impulse response to compensate for the excessive air attenuation at the high frequencies
ISRA Melbourne 2010 17
attenuation at the high frequencies

Audience
• Wooden fibre plate glued to a styrofoam back, in which the shapes of the “heads” of
ISRA Melbourne 2010 18
the “heads” of the audience are cut out.
Some of the surfaces of the front and back were covered with a layer of tape, in order to adjust the absorption.

Absorption of model audienceAudience on occupied chairs, medium upholstered
0,8
1
1,2
1,4
Abs
orpt
ion
B. & H.
Model 1
ISRA Melbourne 2010 19
0
0,2
0,4
0,6
125 250 500 1000 2000 4000
Frequency, Hz
Abs
orpt
ion
Model 1
Model 2
Ref: Beranek & Hidaka, J. Acoust. Soc. Am., Vol. 104, No. 6. 1998

Adjustment of absorption
ANKARA OPERA HOUSE, PHASE IIIClosed stage opening - Source in pit
2
2,5
Rev
erbe
ratio
n tim
e, T
30 (
s)
Final
ISRA Melbourne 2010 20
0
0,5
1
1,5
125 250 500 1000 2000 4000
Frequency, Hz
Rev
erbe
ratio
n tim
e, T
30 (
s)
Final
Simulated
Model 1
Model 2

Adjustment of absorption
Ceiling in the auditorium with
Low frequency absorption added
ISRA Melbourne 2010 21
• Principle: To obtain the correct reverberation time in the relevant frequency range, although the contribution from air attenuation is higher in the model than in the real hall
auditorium with additional absorption
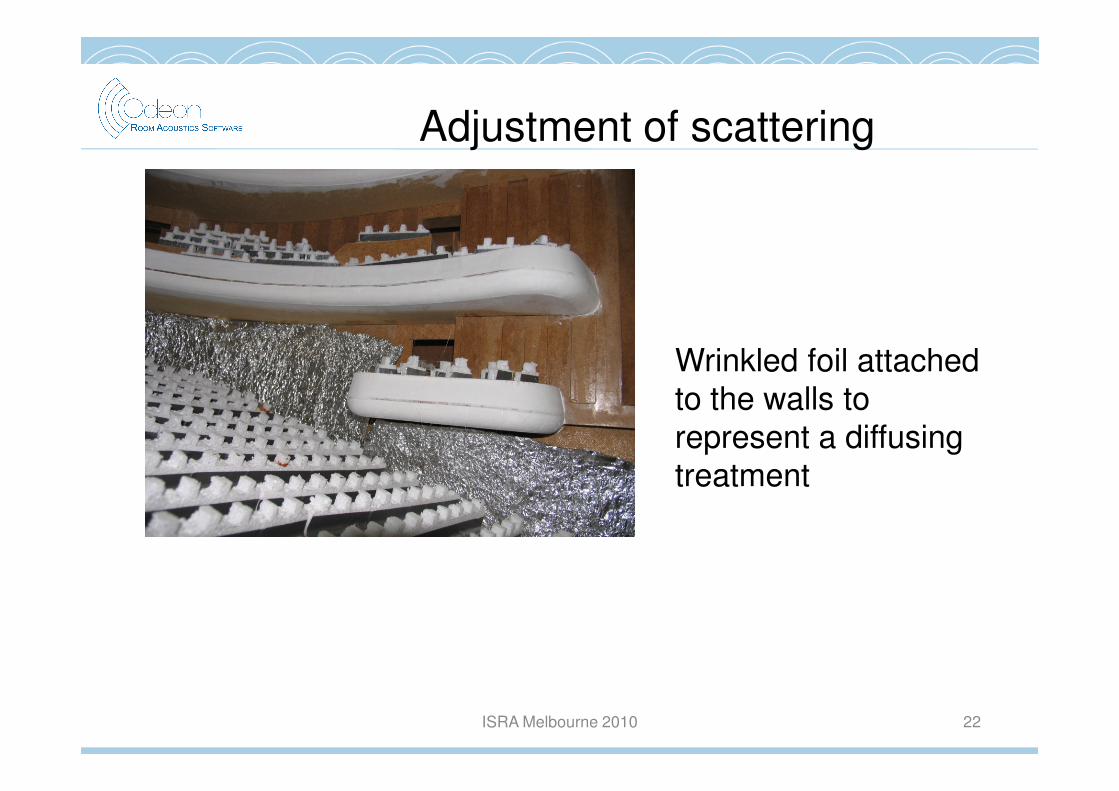
Adjustment of scattering
Wrinkled foil attached to the walls to
ISRA Melbourne 2010 22
to the walls to represent a diffusing treatment

RT – Source on stage
ANKARA OPERA HOUSE, PHASE IIISource on stage
11,21,41,61,8
2
Rev
erbe
ratio
n tim
e, T
30 (
s)
Measured
ISRA Melbourne 2010 23
00,20,40,60,8
1
125 250 500 1000 2000 4000
Frequency, Hz
Rev
erbe
ratio
n tim
e, T
30 (
s)
Measured
Simulated
Average of 7 receiver positions

RT – Source in pitANKARA OPERA HOUSE, PHASE III
Source in pit
11,21,41,61,8
2R
ever
bera
tion
time,
T30
(s)
Measured
ISRA Melbourne 2010 24
00,20,40,60,8
1
125 250 500 1000 2000 4000
Frequency, Hz
Rev
erbe
ratio
n tim
e, T
30 (
s)
Simulated
Average of 7 receiver positions
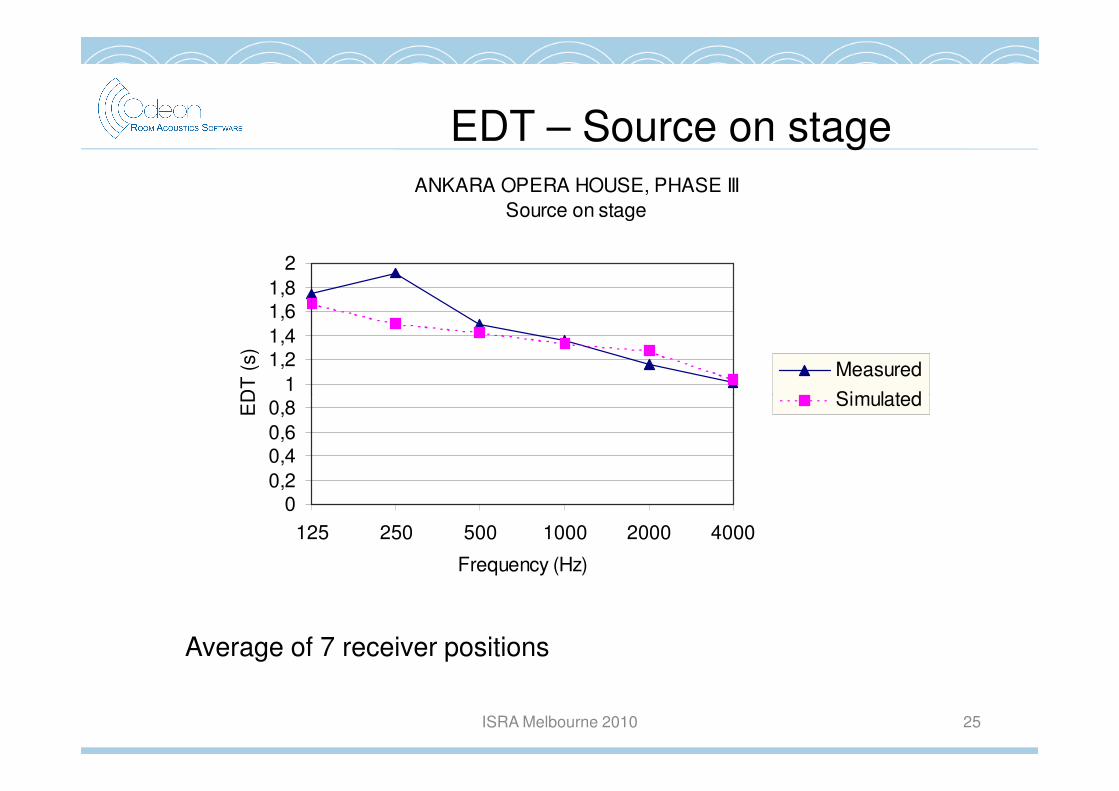
EDT – Source on stageANKARA OPERA HOUSE, PHASE III
Source on stage
11,21,41,61,8
2E
DT
(s)
Measured
Simulated
ISRA Melbourne 2010 25
00,20,40,60,8
125 250 500 1000 2000 4000
Frequency (Hz)
ED
T (
s)
Simulated
Average of 7 receiver positions
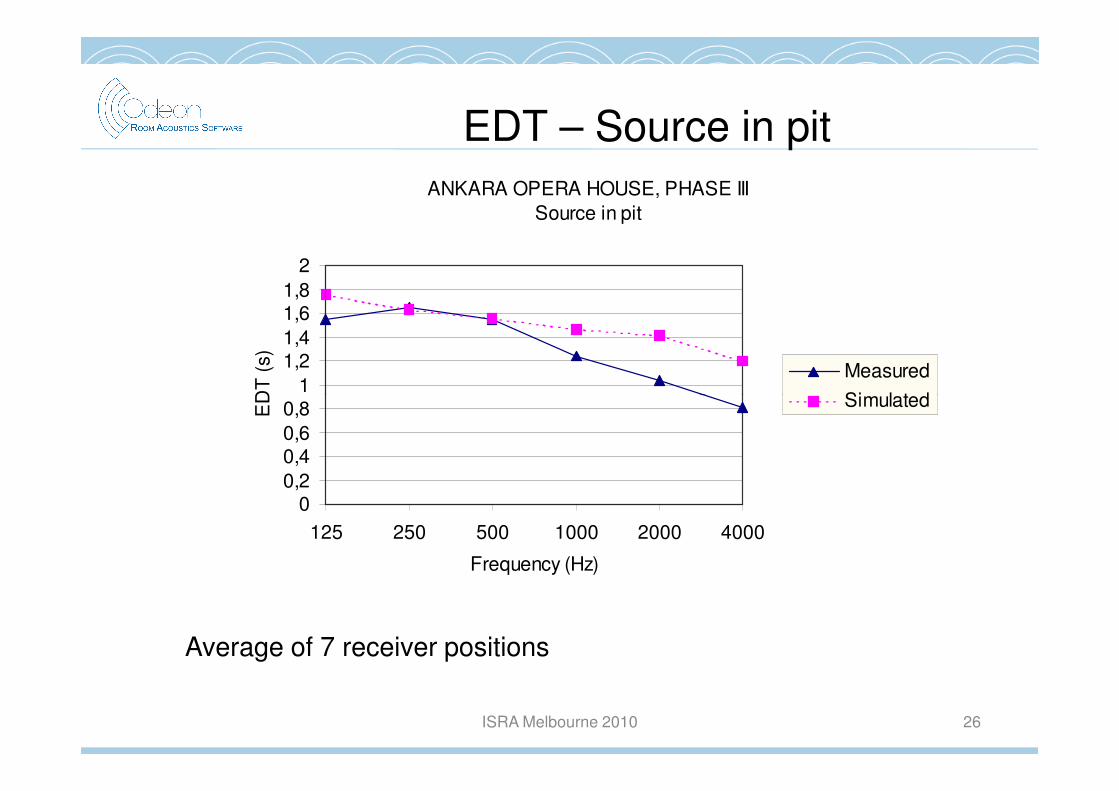
EDT – Source in pitANKARA OPERA HOUSE, PHASE III
Source in pit
11,21,41,61,8
2E
DT
(s)
Measured
Simulated
ISRA Melbourne 2010 26
00,20,40,60,8
1
125 250 500 1000 2000 4000
Frequency (Hz)
ED
T (
s)
Simulated
Average of 7 receiver positions
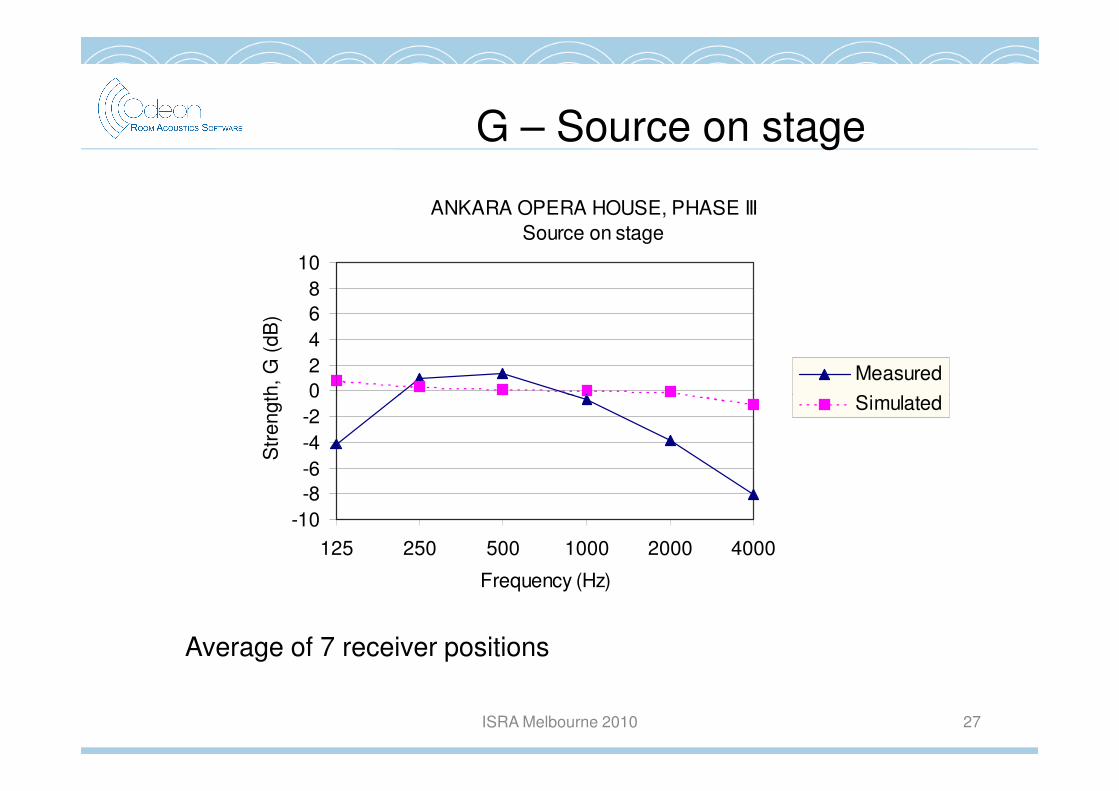
G – Source on stage
ANKARA OPERA HOUSE, PHASE IIISource on stage
02468
10S
tren
gth,
G (
dB)
Measured
Simulated
ISRA Melbourne 2010 27
-10-8-6-4-20
125 250 500 1000 2000 4000
Frequency (Hz)
Str
engt
h, G
(dB
)
Simulated
Average of 7 receiver positions

G – Source in pit
ANKARA OPERA HOUSE, PHASE IIISource in pit
-202468
10S
tren
gth,
G (
dB)
Measured
Simulated
ISRA Melbourne 2010 28
-10-8-6-4-2
125 250 500 1000 2000 4000
Frequency (Hz)
Str
engt
h, G
(dB
)
Simulated
Average of 7 receiver positions

C80 – Source on stageANKARA OPERA HOUSE, PHASE III
Source on stage
02468
10C
larit
y, C
80 (
dB)
Measured
Simulated
ISRA Melbourne 2010 29
-10-8-6-4-20
125 250 500 1000 2000 4000
Frequency, Hz
Cla
rity,
C80
(dB
)
Simulated
Average of 7 receiver positions

C80 – Source in pitANKARA OPERA HOUSE, PHASE III
Source in pit
02468
10C
larit
y, C
80 (
dB)
Measured
Simulated
ISRA Melbourne 2010 30
-10-8-6-4-20
125 250 500 1000 2000 4000
Frequency, Hz
Cla
rity,
C80
(dB
)
Simulated
Average of 7 receiver positions

Comparison of methods
Source on stage
ISRA Melbourne 2010 31
P1
3
P1
Receiver 3: Sound propagation elevated over audience surface, no attenuation of direct soundReflection from audience surface

Comparison of methods
Source in pit
ISRA Melbourne 2010 32
P2
3
P1
Receiver 3: Sound propagation close to audience surface (attenuation missing in simulation)No direct sound; Diffraction across pit wall (Odeon ver. 10)
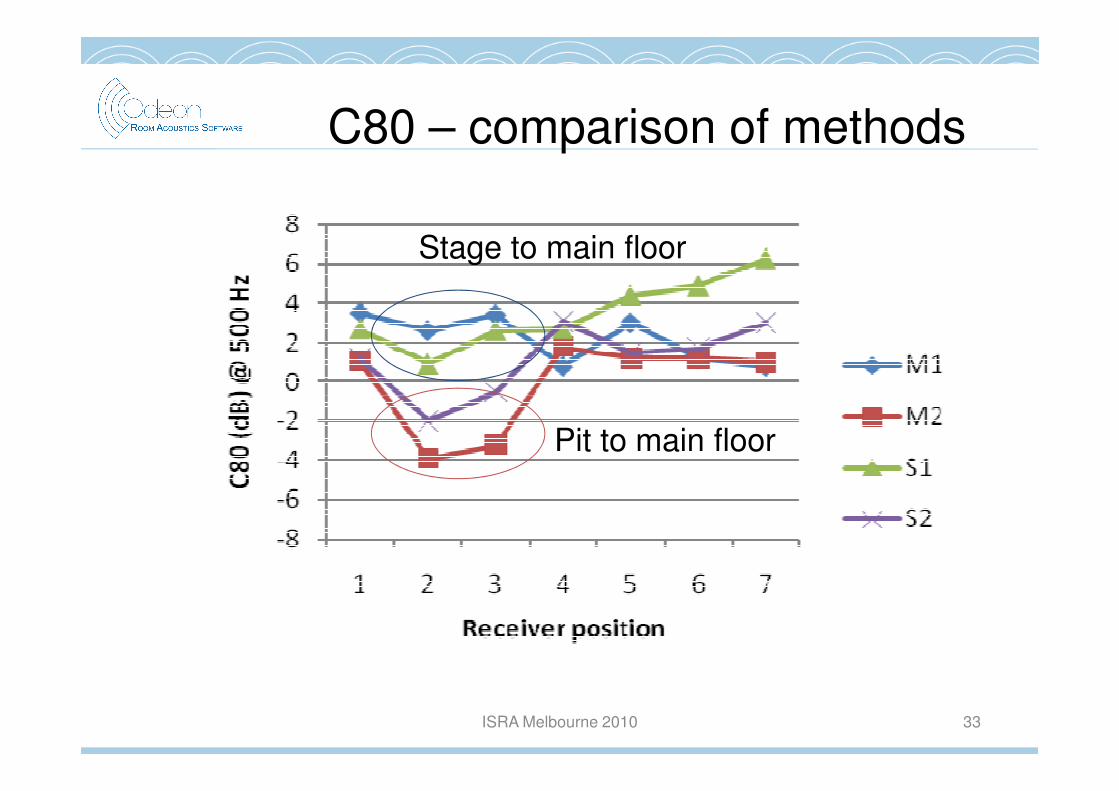
C80 – comparison of methods
Stage to main floor
ISRA Melbourne 2010 33
Pit to main floor

Discussion - 1Scale model Computer model
Room model detailing High degree of detail possible (butexpensive)
Simplified geometry preferredHigh degree of detail possible
Materials Absorptionapproximated
Absorption data accurate (if available)
ISRA Melbourne 2010 34
approximated accurate (if available)
Scattering Included with detailed modelling
Scattering coefficients assigned to surfaces with simplified details
Diffraction Included Approximated or missing in some cases
Attenuation of sound propagating across audience area
Included with detailed modelling of audience
Not included (yet)
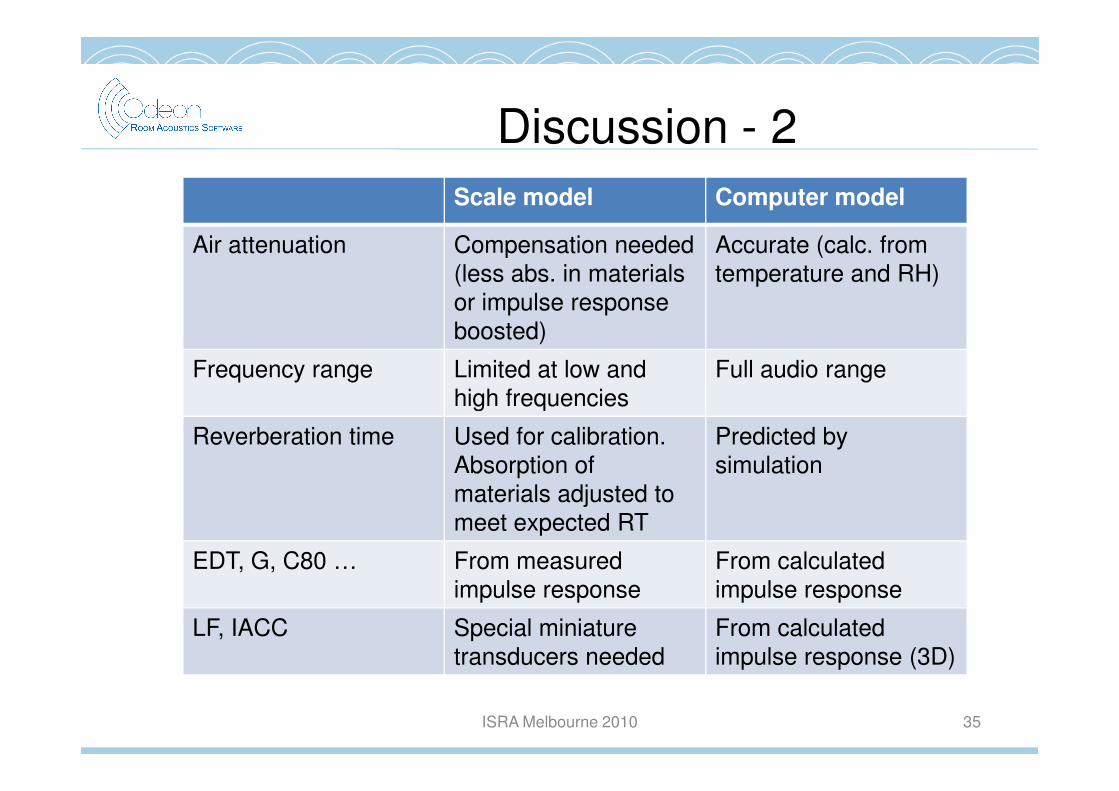
Discussion - 2Scale model Computer model
Air attenuation Compensation needed (less abs. in materials or impulse response boosted)
Accurate (calc. from temperature and RH)
Frequency range Limited at low and high frequencies
Full audio range
ISRA Melbourne 2010 35
high frequencies
Reverberation time Used for calibration. Absorption of materials adjusted to meet expected RT
Predicted by simulation
EDT, G, C80 … From measured impulse response
From calculated impulse response
LF, IACC Special miniature transducers needed
From calculated impulse response (3D)

Discussion - 3Scale model Computer model
Auralisation Quality limited by transducers
High quality possible. Any HRTF may be applied
Reproduction throughloudspeakers
Not possible Ambisonics or n-channel surround
Sources with special Possible, but difficult Possible. Application
ISRA Melbourne 2010 36
Sources with special directivity (musical instruments)
Possible, but difficult Possible. Application of directivity data or multi-channel auralisation
3D analysis of early reflections
Possible with laser beam and light-reflecting surfaces
Easy, coupled to reflectogram

Discussion - 4Scale model Computer model
Echo and flutterechodetection
Inspection of impulse response
Inspection of impulse response.Auralisation of impulsive sound
Colouration Not possible Possible with high quality auralisation
ISRA Melbourne 2010 37
quality auralisation
Detection of weak spots in the audience area
Not realistic to cover all seats by measurements
Possible through grid mapping of all parameters
Grid mapping of results
Not possible High resolution grids possible (long calculation time)

Conclusion
• Both methods have weaknesses and advantages
• Results: No big difference between measured and simulated room acoustic parameters
• Main problems in scale models:– Transducers (directive sources, dummy head)– Transducers (directive sources, dummy head)
– Auralisation with sufficient quality
• Main problems in computer models– Data for scattering surfaces; can be measured in scale model
reverberation chamber (ISO 17497-1)
– Simulation of the attenuation of sound propagation across the audience area
ISRA Melbourne 2010 38


