ROSEAU COUNTY, MINNESOTA AND INCORPORATED AREAS Community Community Name Number BADGER, CITY OF 270412 GREENBUSH, CITY OF 270413 *ROOSEVELT, CITY OF 270781 ROSEAU, CITY OF 270414 ROSEAU COUNTY 270633 (UNINCORPORATED AREAS) *STRATHCONA, CITY OF 270726 WARROAD, CITY OF 270415 *NO SPECIAL FLOOD HAZARD AREAS IDENTIFIED Roseau County FLOOD INSURANCE STUDY NUMBER 27135CV000A Preliminary:
Transcript
ROSEAU COUNTY,
MINNESOTA AND INCORPORATED AREAS Community Community Name Number BADGER, CITY OF 270412 GREENBUSH, CITY OF 270413
*ROOSEVELT, CITY OF 270781 ROSEAU, CITY OF 270414 ROSEAU COUNTY 270633 (UNINCORPORATED AREAS)
*STRATHCONA, CITY OF 270726 WARROAD, CITY OF 270415 *NO SPECIAL FLOOD HAZARD AREAS IDENTIFIED
Roseau County
FLOOD INSURANCE STUDY NUMBER
27135CV000A
Preliminary:
NOTICE TO
FLOOD INSURANCE STUDY USERS
Communities participating in the National Flood Insurance Program have established repositories of flood hazard data for floodplain management and flood insurance purposes. This Flood Insurance Study (FIS) report may not contain all data available within the Community Map Repository. Please contact the Community Map Repository for any additional data. The Federal Emergency Management Agency (FEMA) may revise and republish part or all of this FIS report at any time. In addition, FEMA may revise part of this FIS report by the Letter of Map Revision process, which does not involve republication or redistribution of the FIS report. Therefore, users should consult with community officials and check the Community Map Repository to obtain the most current FIS report components. Selected Flood Insurance Rate Map panels for this community contain information that was previously shown separately on the corresponding Flood Boundary and Floodway Map panels (e.g., floodways, cross sections). In addition, former flood hazard zone designations have been changed as follows:
Old Zone(s) New Zone
Al through A30 AE
B X C X
Initial Countywide FIS Effective Date: To Be Determined
Table 1 - Summary of Discharges .................................................................................................... 11 Table 2 - Summary of Stillwater Elevations ..................................................................................... 12 Table 3 - Vertical Datum Conversion ............................................................................................... 16 Table 4 - Floodway Data................................................................................................................... 20 Table 5 - Community Map History ................................................................................................... 30
EXHIBITS
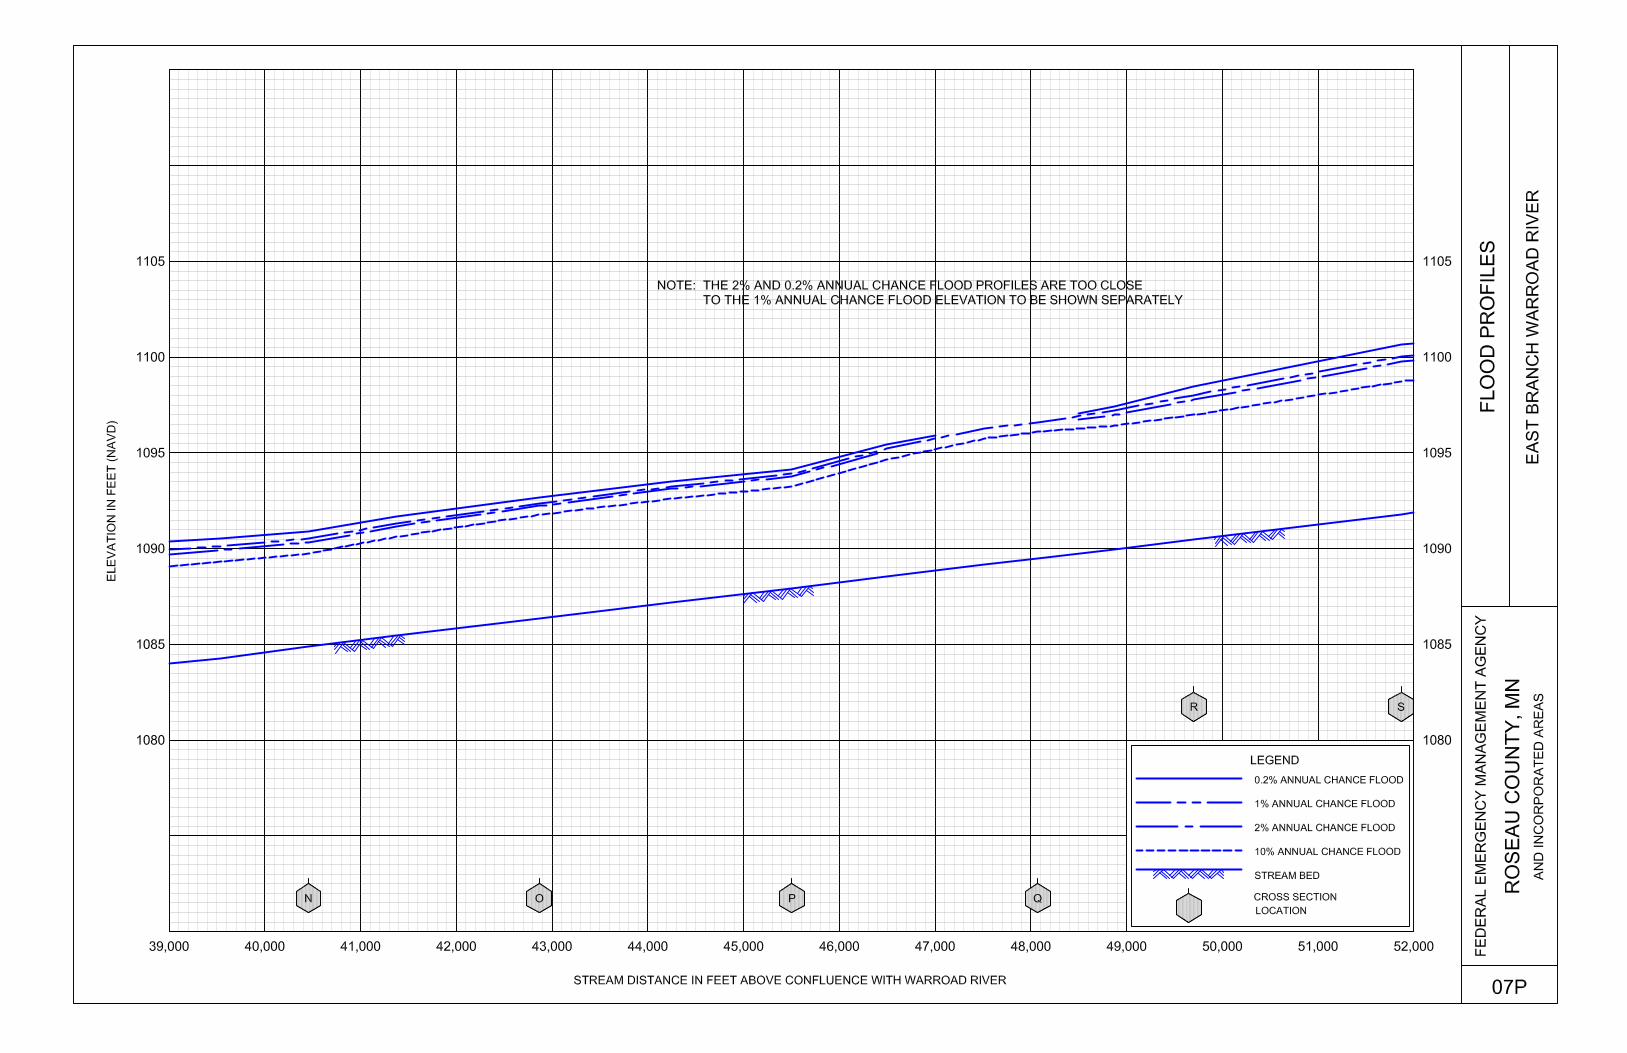
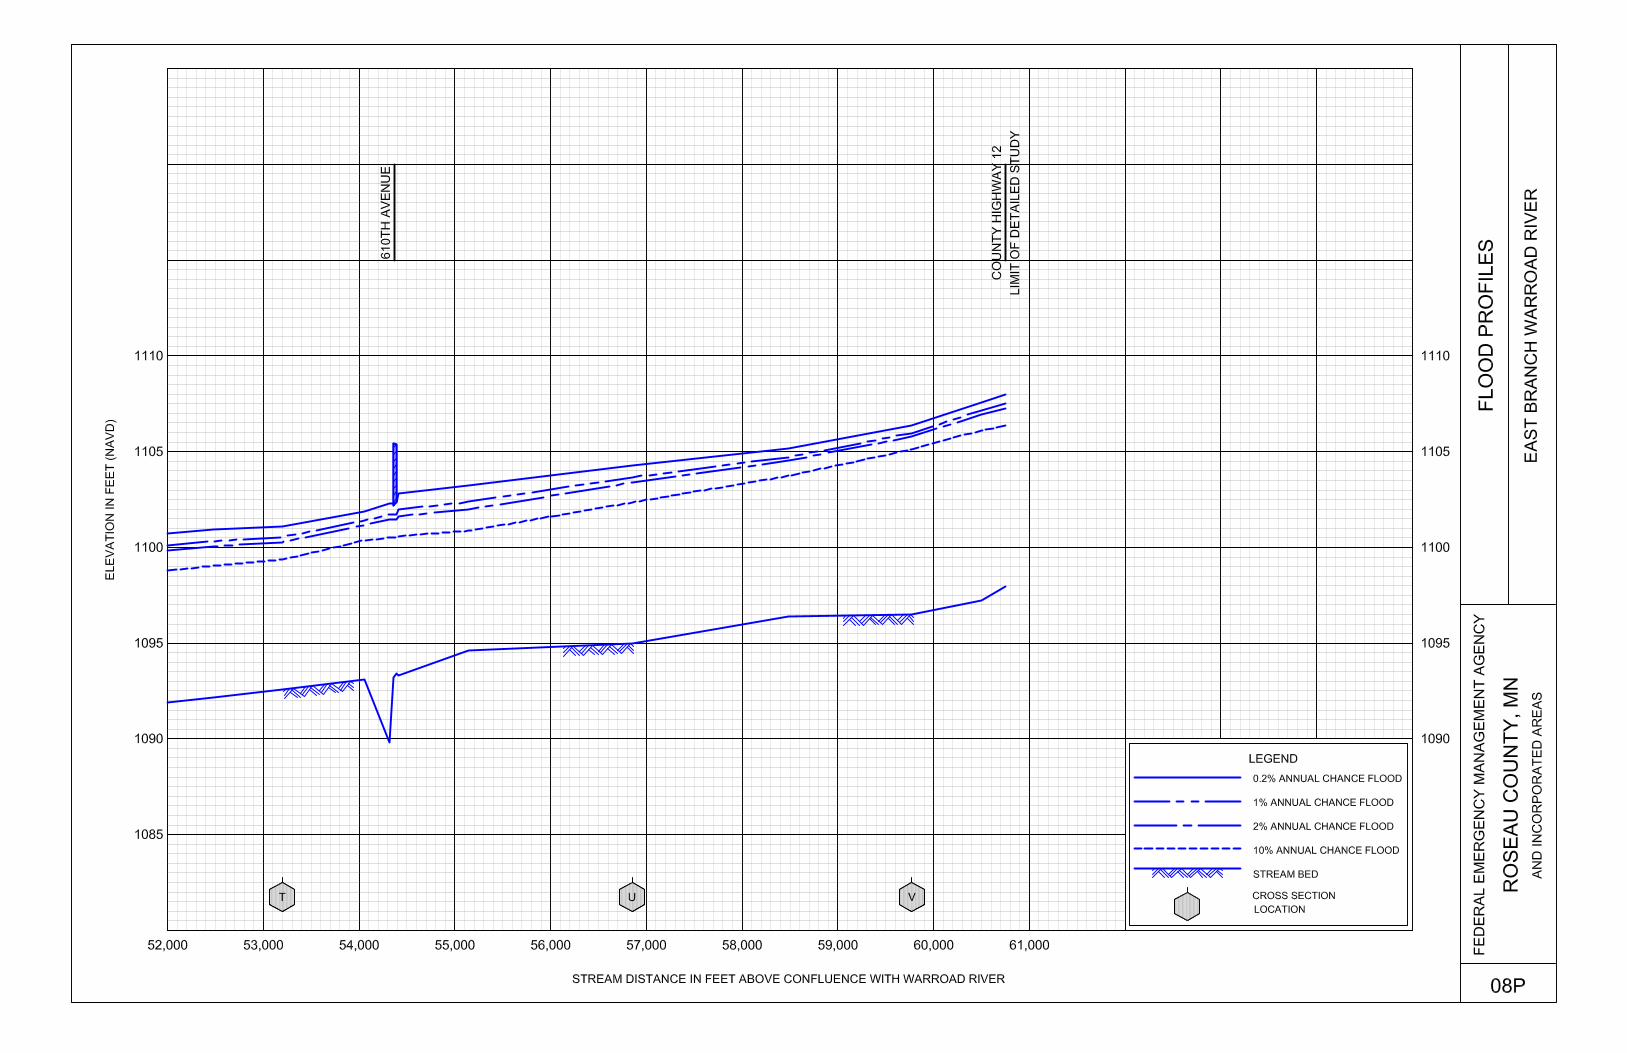
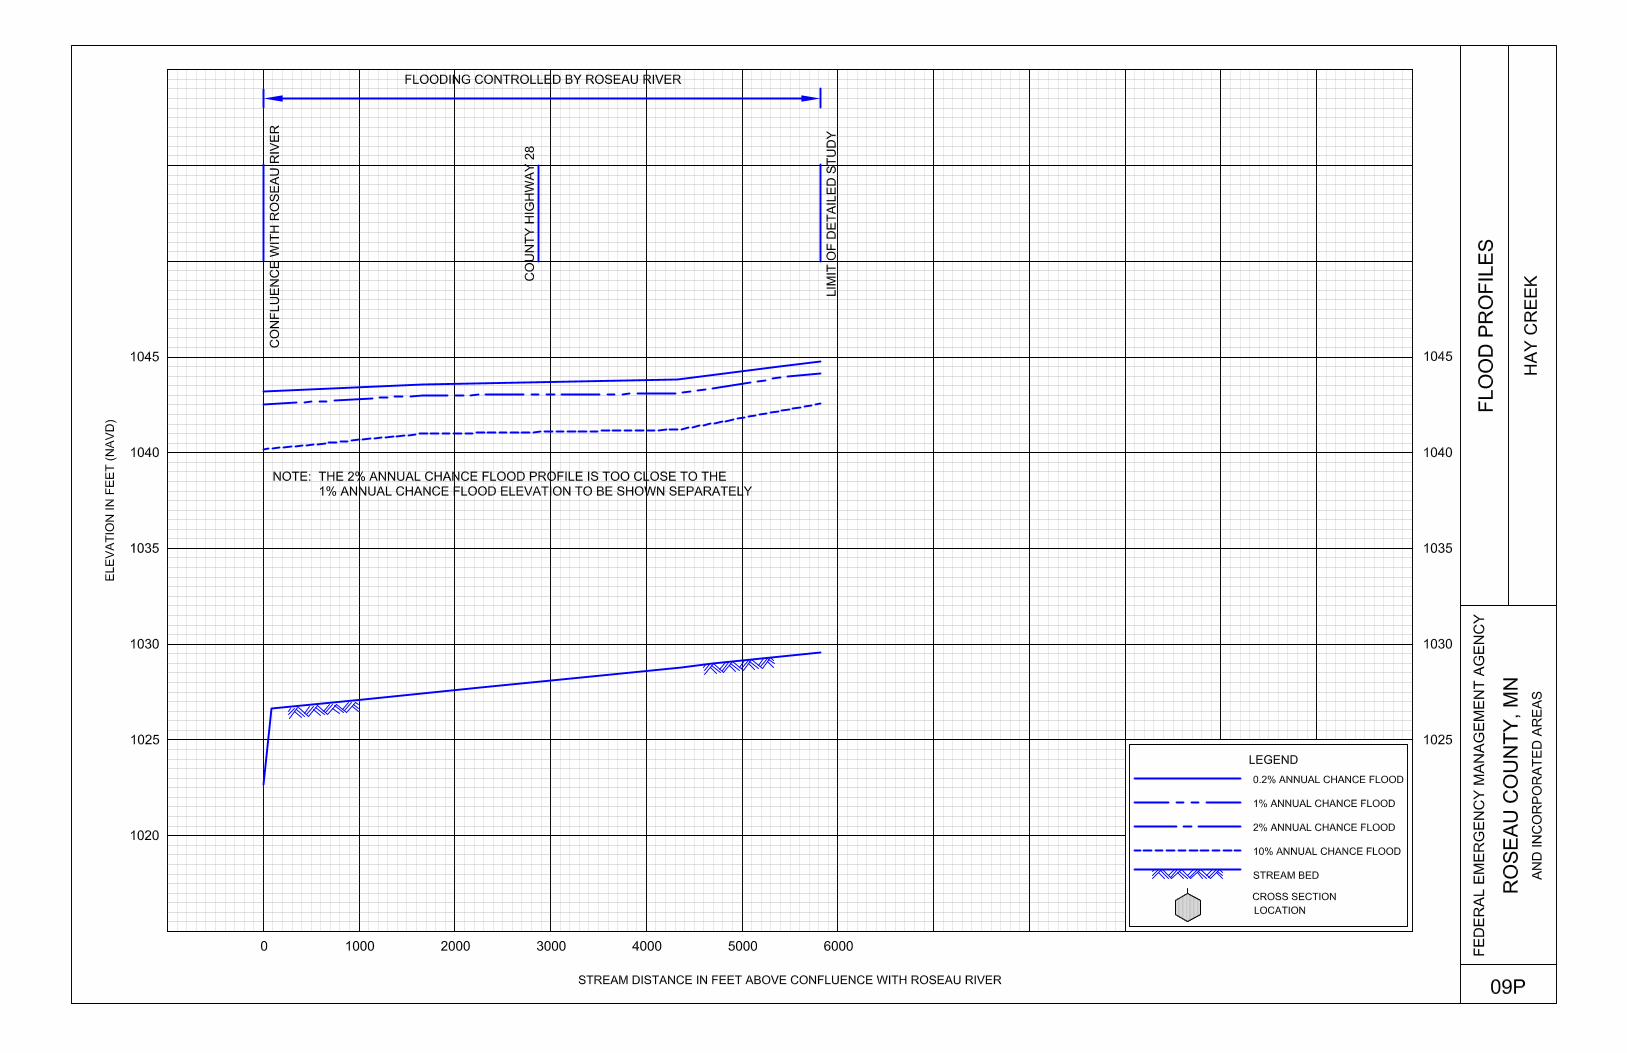
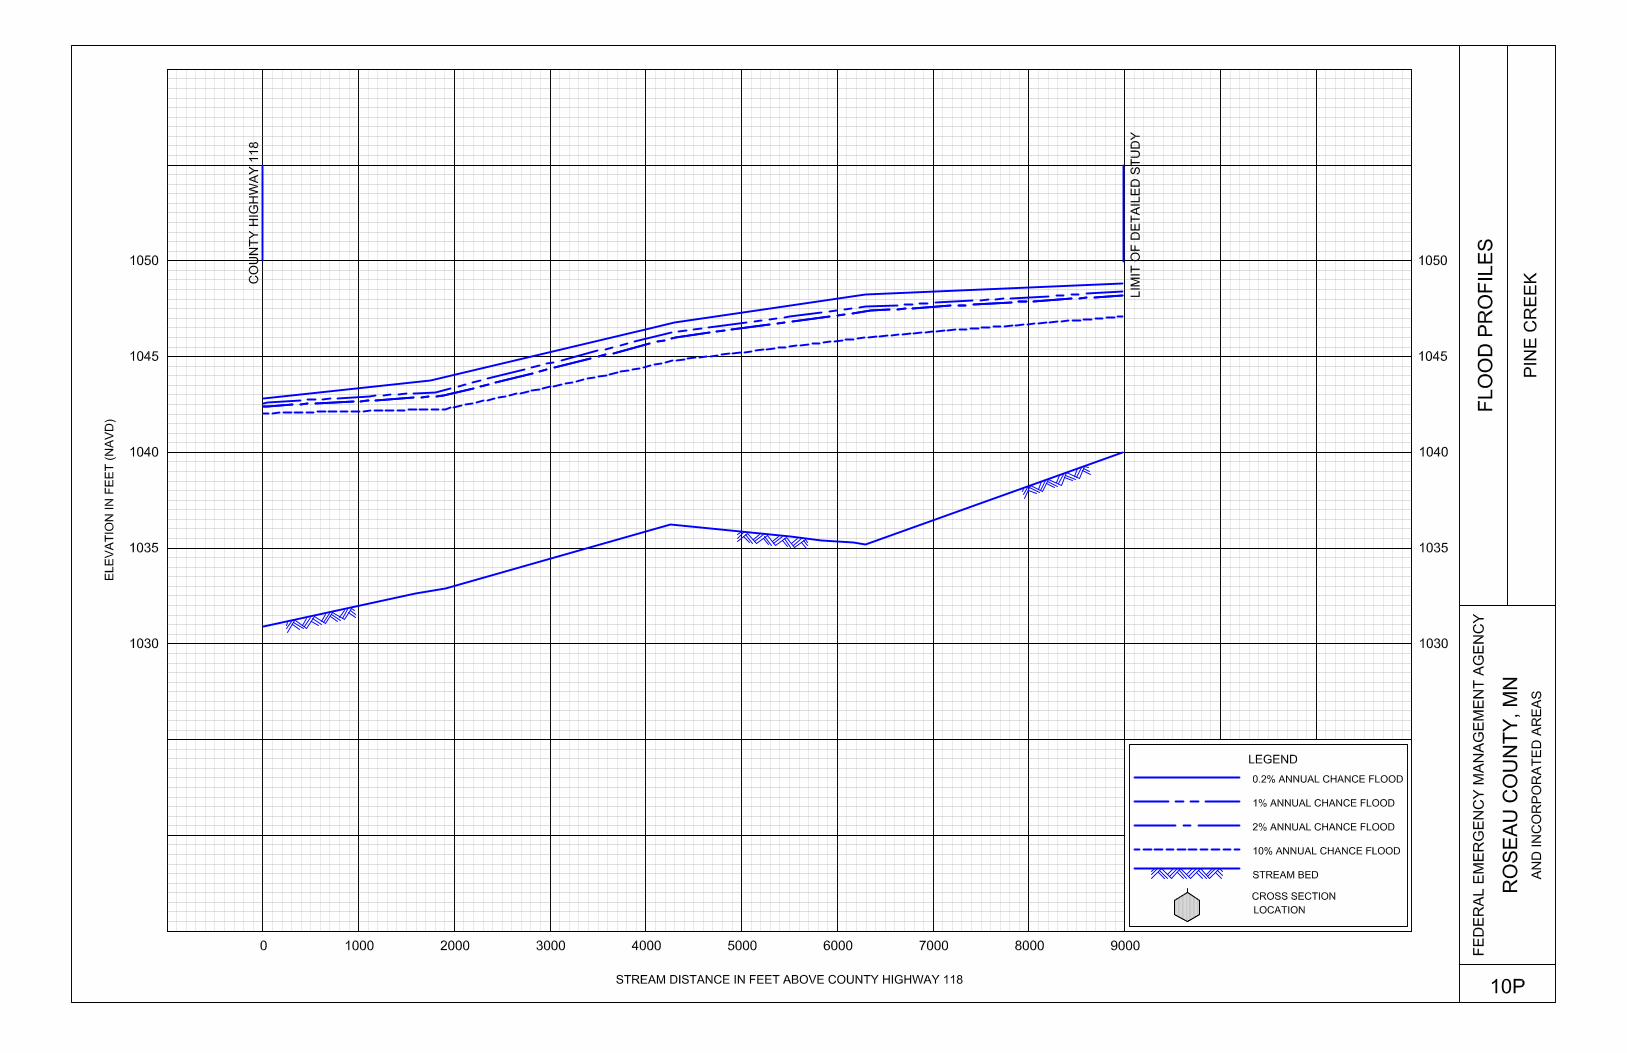
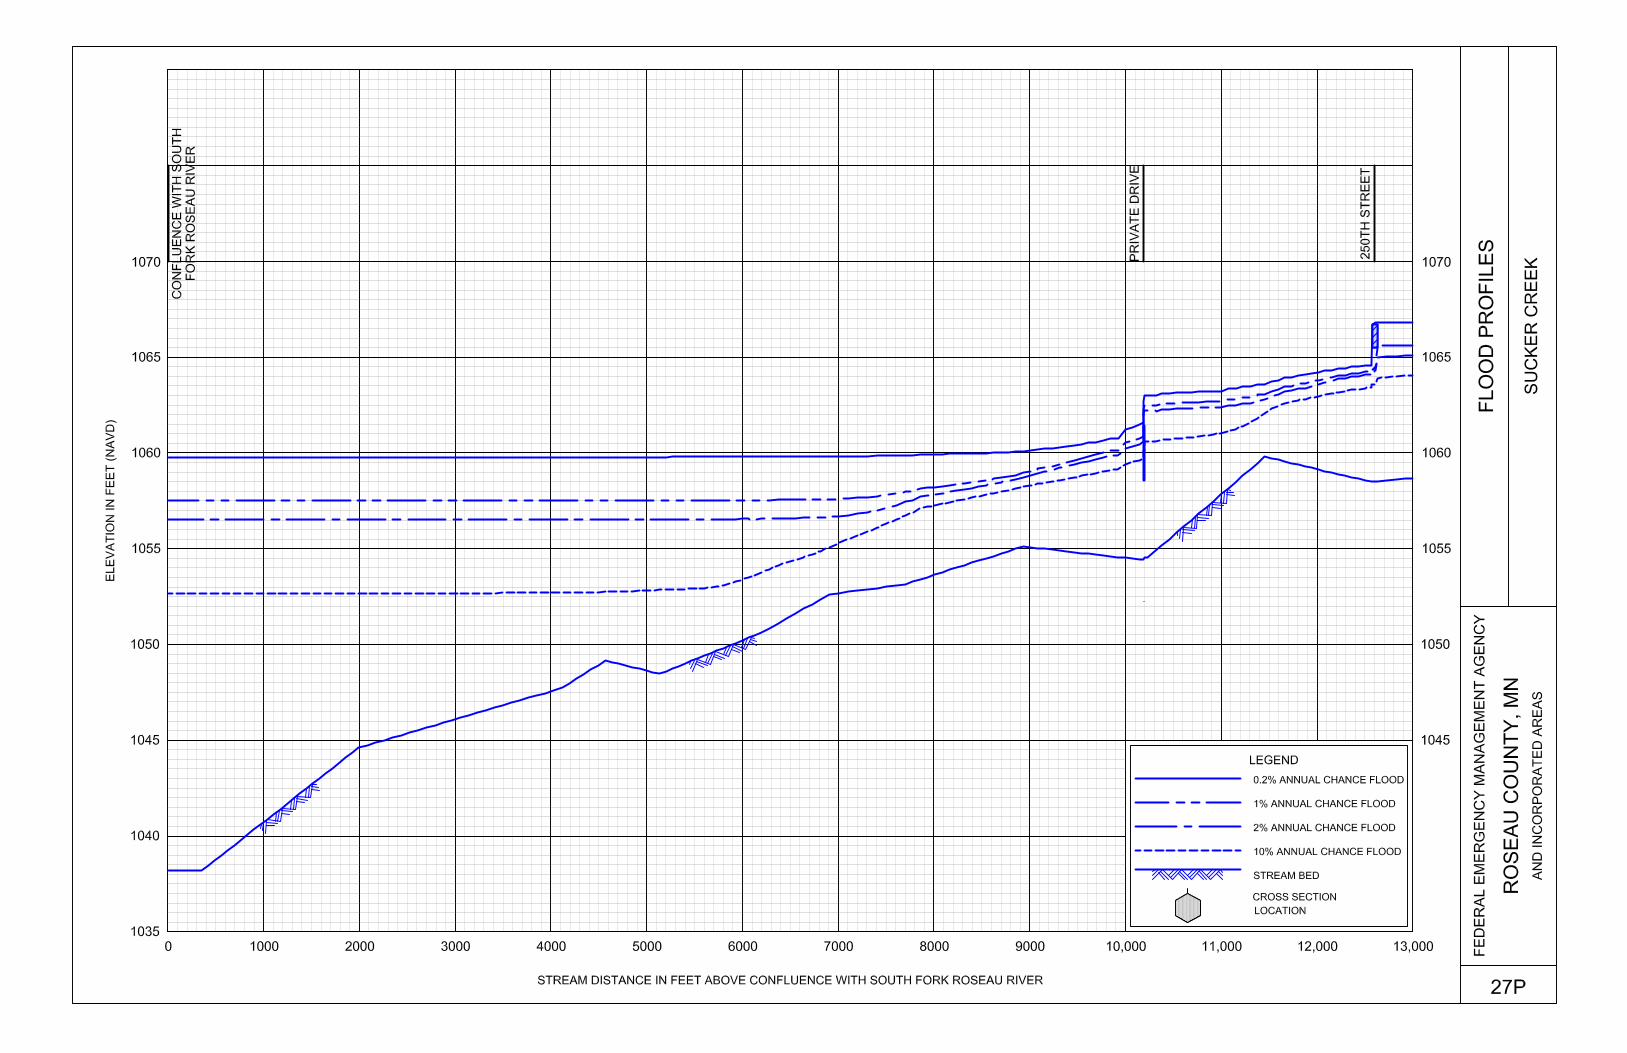
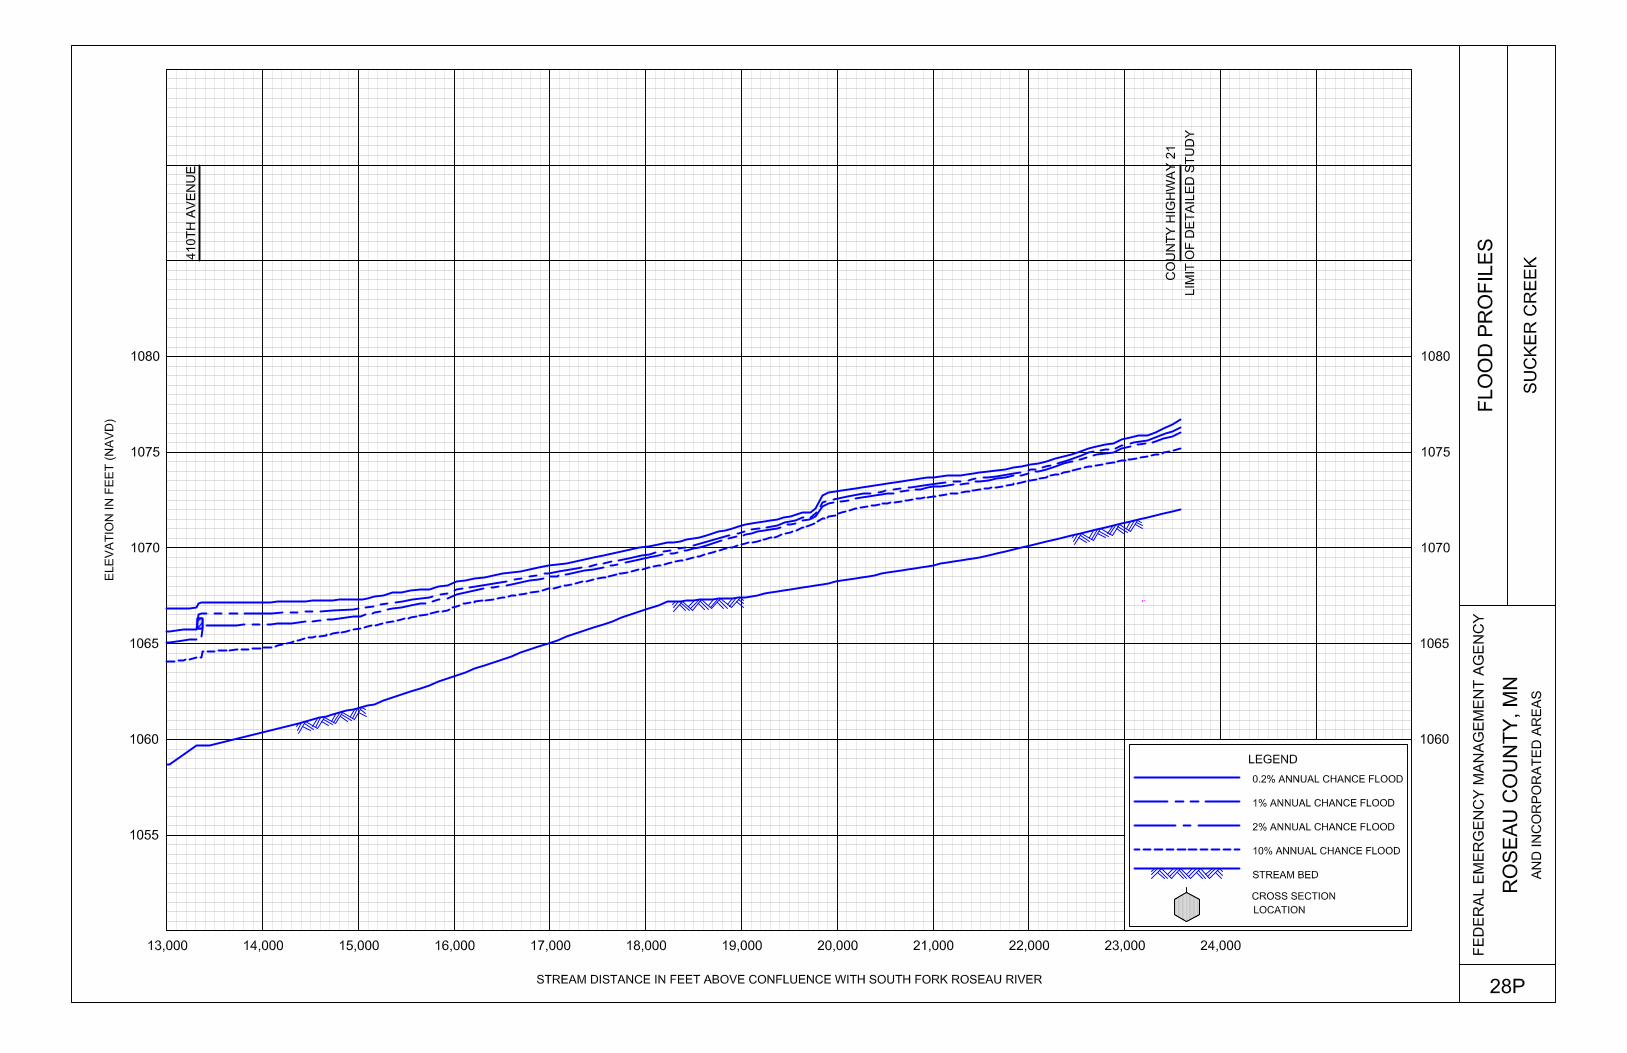
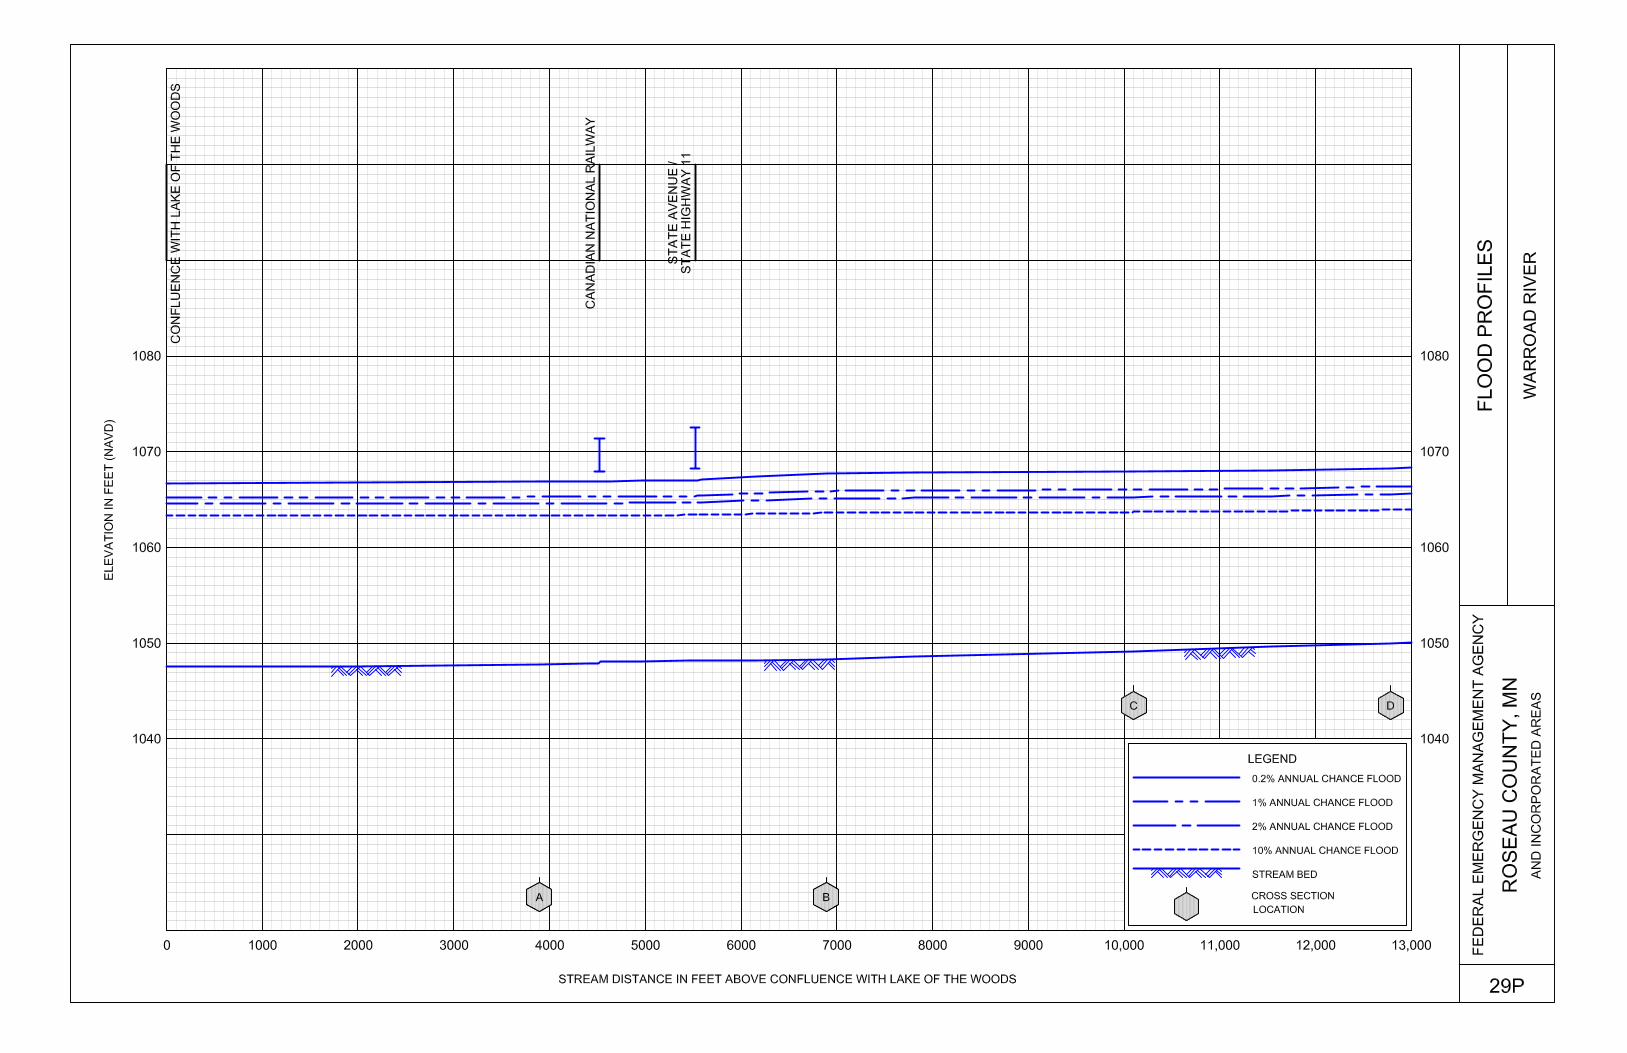
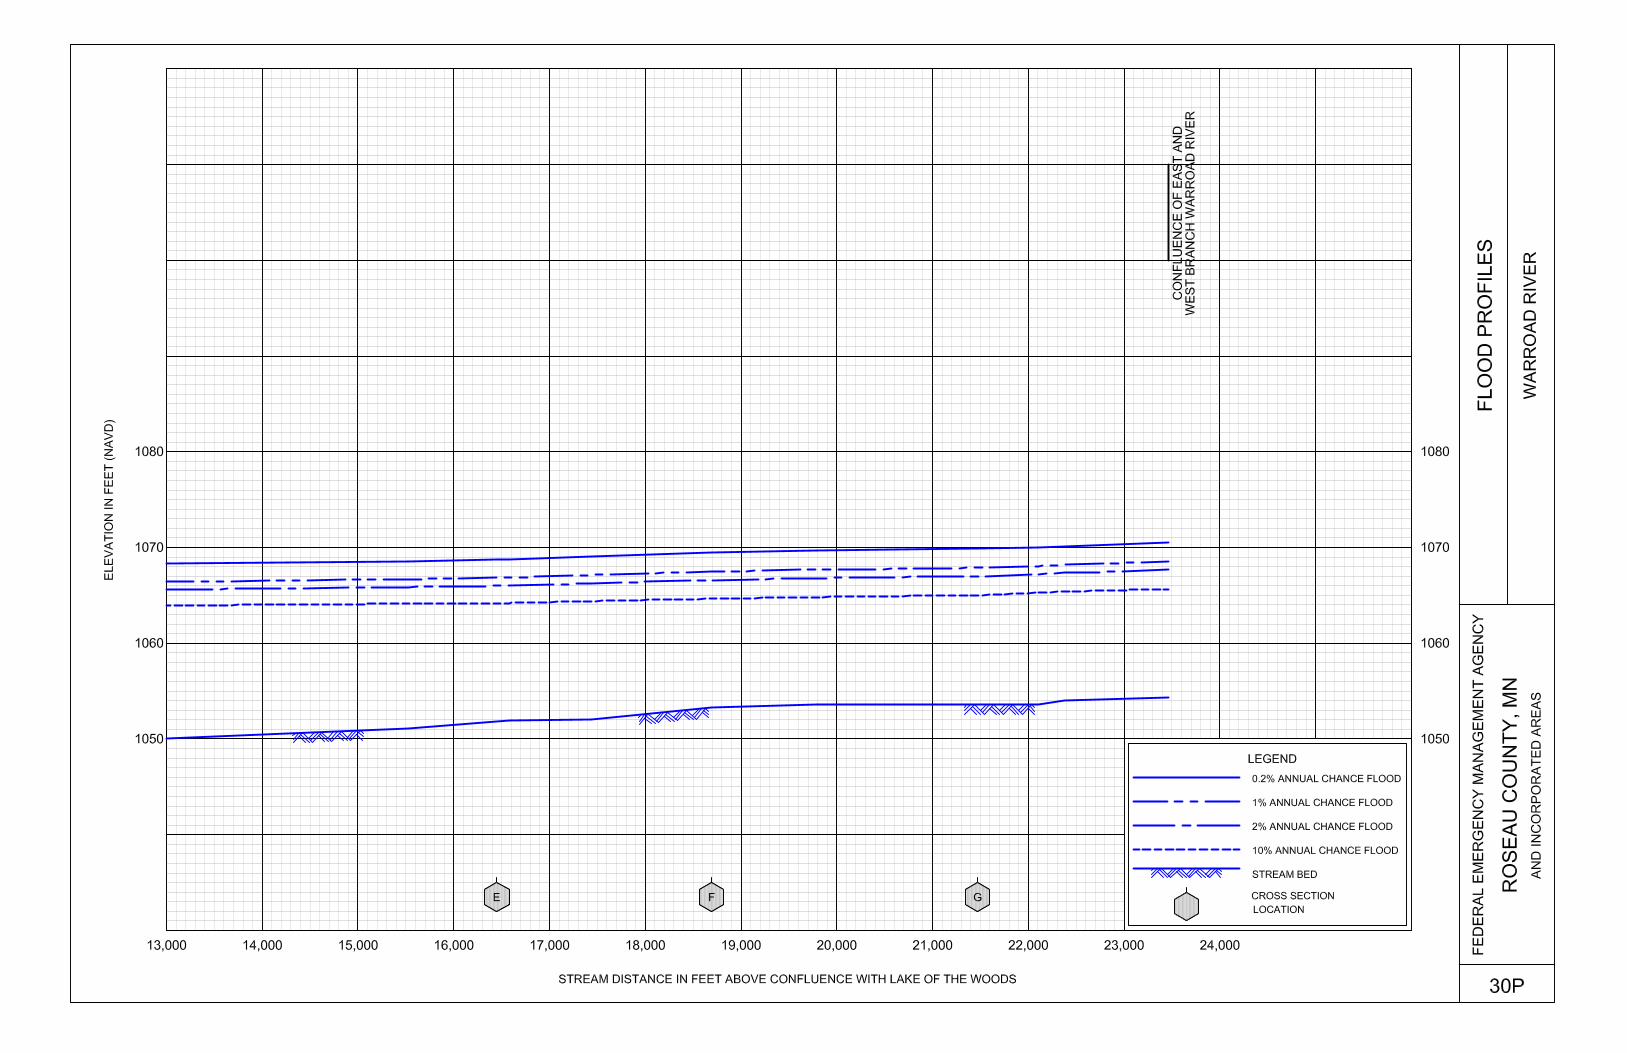
Exhibit 1 - Flood Profiles Bulldog Run River Panels 01P-03P East Branch Warroad River Panels 04P-08P Hay Creek Panel 09P Pine Creek Panel 10P Roseau River Panels 11P-17P South Branch Two Rivers Panel 18P South Fork Roseau River Panels 19P-24P Sprague Creek Panels 25P-26P Sucker Creek Panels 27P-28P Warroad River Panels 29P-30P West Branch Warroad River Panels 31P-33P Exhibit 2 - Flood Insurance Rate Map Index
Flood Insurance Rate Map
1
FLOOD INSURANCE STUDY
ROSEAU COUNTY, MINNESOTA AND INCORPORATED AREAS
1.0 INTRODUCTION
1.1 Purpose of Study
This Flood Insurance Study (FIS) revises and updates information on the existence and severity of flood hazards in the geographic area of Roseau County, including the Cities of Badger, Greenbush, Roosevelt, Roseau, Strathcona, and Warroad; and the unincorporated areas of Roseau County (referred to collectively herein as Roseau County), and aids in the administration of the National Flood Insurance Act of 1968 and the Flood Disaster Protection Act of 1973. This study has developed flood-risk data for various areas of the community that will be used to establish actuarial flood insurance rates and to assist the community in its efforts to promote sound floodplain management. Minimum floodplain management requirements for participation in the National Flood Insurance Program (NFIP) are set forth in the Code of Federal Regulations at 44 CFR, 60.3. Please note that the Cities of Roosevelt and Warroad are geographically located in Roseau and Lake of the Woods Counties. Only the portions of the Cities of Roosevelt and Warroad within Roseau County are included in this FIS report. See the separately published FIS report and Flood Insurance Rate Map (FIRM) for flood-hazard information. Please note that the Cities of Roosevelt and Strathcona have no mapped special flood hazard areas. In some states or communities, floodplain management criteria or regulations may exist that are more restrictive or comprehensive than the minimum Federal requirements. In such cases, the more restrictive criteria take precedence and the State (or other jurisdictional agency) will be able to explain them. The Digital Flood Insurance Rate Map (DFIRM) and FIS report for this countywide study have been produced in digital format. Flood hazard information was converted to meet the Federal Emergency Management Agency (FEMA) DFIRM database specifications and Geographic Information System (GIS) format requirements. The flood hazard information was created and is provided in a digital format so that it can be incorporated into a local GIS and be accessed more easily by the community.
2
1.2 Authority and Acknowledgments
The sources of authority for this FIS are the National Flood Insurance Act of 1968 and the Flood Disaster Protection Act of 1973. Precountywide Analyses
Information on the authority and acknowledgements for each jurisdiction included in this countywide FIS, as compiled from their previously printed FIS reports, is shown below: Greenbush, City of: The hydrologic and hydraulic analyses for
South Branch Two Rivers for the March 30, 1982, FIS report (FEMA, 1982) were performed by Edwards and Kelcey, Inc., for FEMA, under Contract No. EMW-C-0322. The work was completed in March 1981.
Roseau, City of: The hydrologic and hydraulic analyses for Lake of the Woods and the Roseau River for the March 29, 1978, FIS report were performed by Barr Engineering Company, for the Federal Insurance Administration (FIA), under Contract No. H-3799 (FIA, 1978). The work was completed in May 1977.
Roseau County (Unincorporated Areas):
The hydrologic and hydraulic analyses for Hay Creek, Lake of the Woods, Pine Creek, Roseau River, South Fork Roseau River, and Warroad River for the July 2, 1979, FIS report (FIA, 1979b) were performed by Barr Engineering Company, for the FIA, under Contract No. H-3892. The work was completed in March 1978.
Warroad, City of: The hydrologic and hydraulic analyses for Warroad River for the June 4, 1979, FIS report (FIA, 1979a) were performed by the U.S. Geological Survey (USGS), Water Resources Division, for the FIA, under Interagency Agreement No. IAA-H-8-26, Project Order No. 10. The work was completed in April 1978.
3
The Cities of Badger, Roosevelt, and Strathcona have no previously printed FIS reports. This Countywide FIS Report
The approximate hydrologic and hydraulic analyses for this study were performed by Atkins North America, Inc. (Atkins) for FEMA, under Contract No. HSFE05-05-D-0023. The work was completed in February 2011. The detailed hydrologic and hydraulic analyses for Bulldog Run River, East Branch Warroad River, the portion of the Roseau River from approximately 300 feet downstream of State Highway 89 to approximately 1.54 miles upstream of 420th Avenue, the portion of the South Fork Roseau River from the confluence with the Roseau River to approximately 0.53 mile upstream of County Road 128, Sprague Creek, Sucker Creek, Warroad River, and West Branch Warroad River, were performed by the Minnesota Department of Natural Resources (MDNR). Base map information shown on the Flood Insurance Rate Map (FIRM) was derived from aerial imagery produced at a scale of 1:12,000, from the U.S. Department of Agriculture, Service Center Agencies aerial photography dated 2010 or later. The projection used in the preparation of this map is Universal Transverse Mercator (UTM) Zone 15, and the horizontal datum used was North American Datum of 1983 (NAD83), Geodetic Reference System 1980 (GRS80) Spheroid.
1.3 Coordination
An initial meeting is held with representatives of FEMA, the community, and the study contractor to explain the nature and purpose of a FIS, and to identify the streams to be studied or restudied. A final meeting is held with representatives from FEMA, the community, and the study contractor to review the results of the study. Precountywide Analyses
The initial and final meeting dates for previous FIS reports for Roseau County and its communities are listed in the following table:
Community FIS Date Initial Meeting Final Meeting
Greenbush, City of March 30, 1982 June 1979 October 7, 1981
Roseau, City of March 29, 1978 February 1975 October 20, 1977
Roseau County (Unincorporated Areas)
July 2, 1979 March 1976 January 31, 1979
4
Community FIS Date Initial Meeting Final Meeting
Warroad, City of June 4, 1979 December 1975 October 23, 1978
This Countywide FIS Report
The initial meeting was held on October 17, 2006, and attended by representatives of FEMA, Atkins, MDNR, and community officials. The results of the study were reviewed at the final meeting held on [Month Day,
Year], and attended by representatives of [list all communities and parties that
were in attendance – typically list FEMA first, followed by any state
organizations, contractors, and communities]. All issues and/or concerns raised at that meeting have been addressed.
2.0 AREA STUDIED
2.1 Scope of Study
This FIS covers the geographic area of Roseau County, Minnesota, including the incorporated communities listed in Section 1.1. The areas studied by detailed methods were selected with priority given to all known flood hazards and areas of projected development or proposed construction through February 2011. The following streams and lakes are studied by detailed methods in this FIS report:
Bulldog Run River South Branch Two Rivers East Branch Warroad River South Fork Roseau River Hay Creek Sprague Creek Lake of the Woods Sucker Creek Pine Creek Warroad River Roseau River West Branch Warroad River
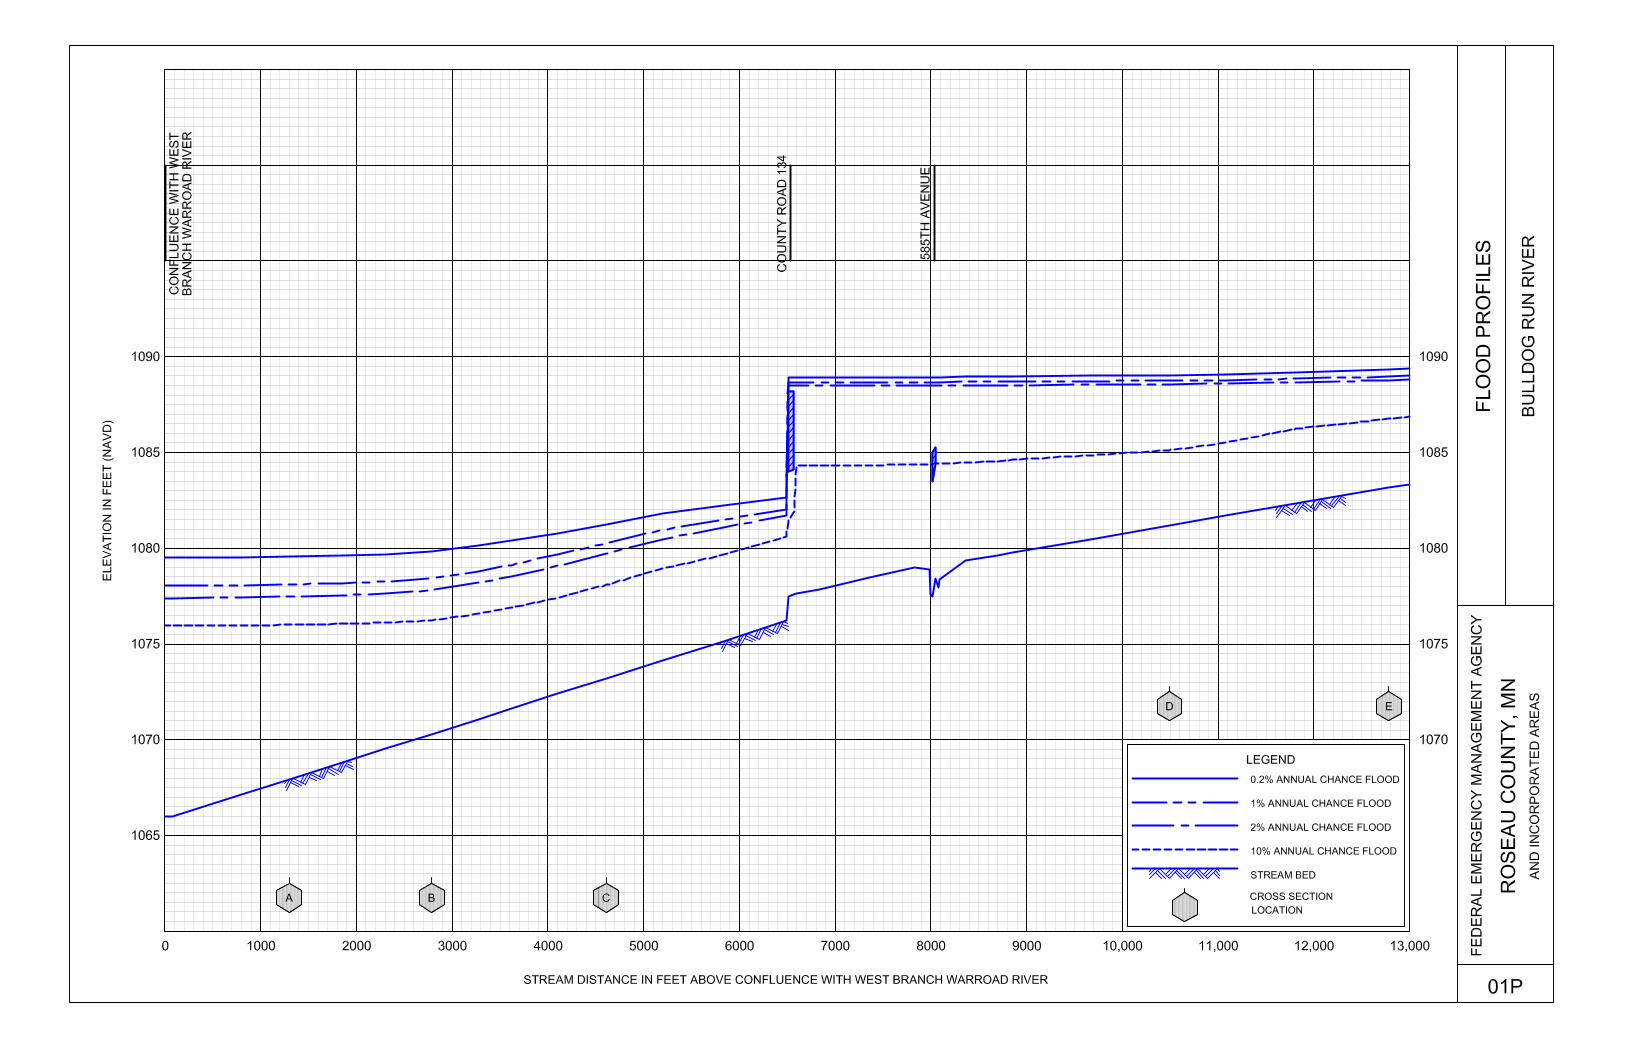
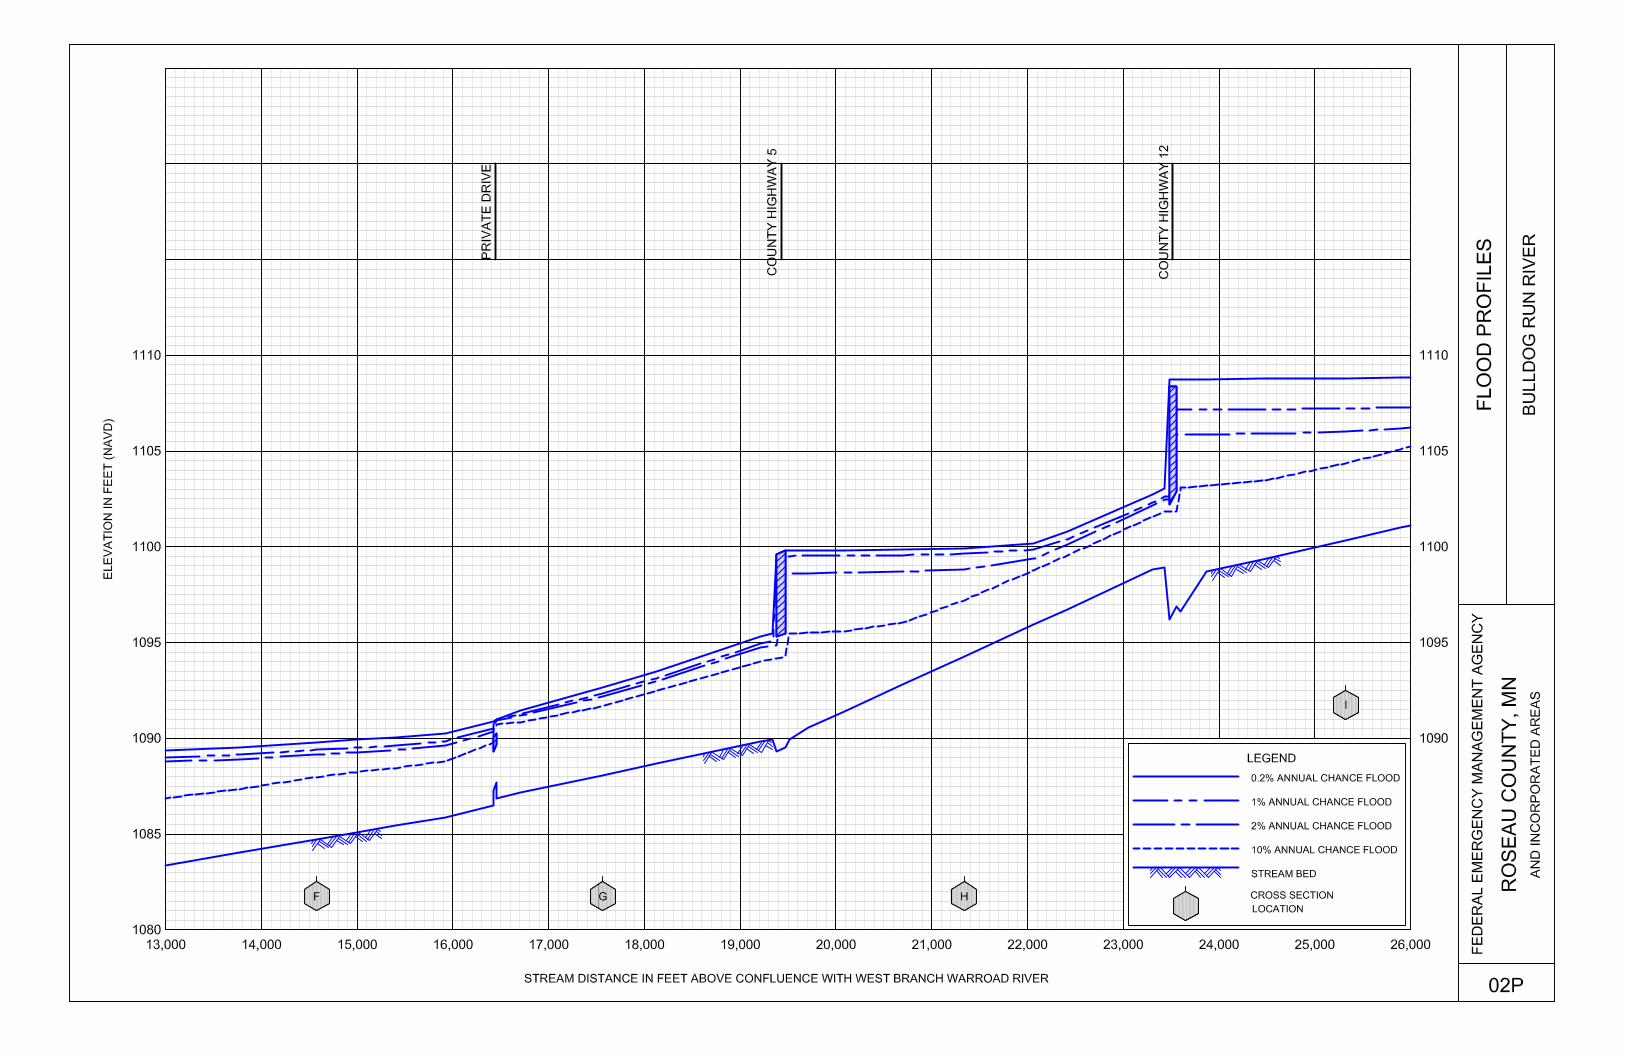
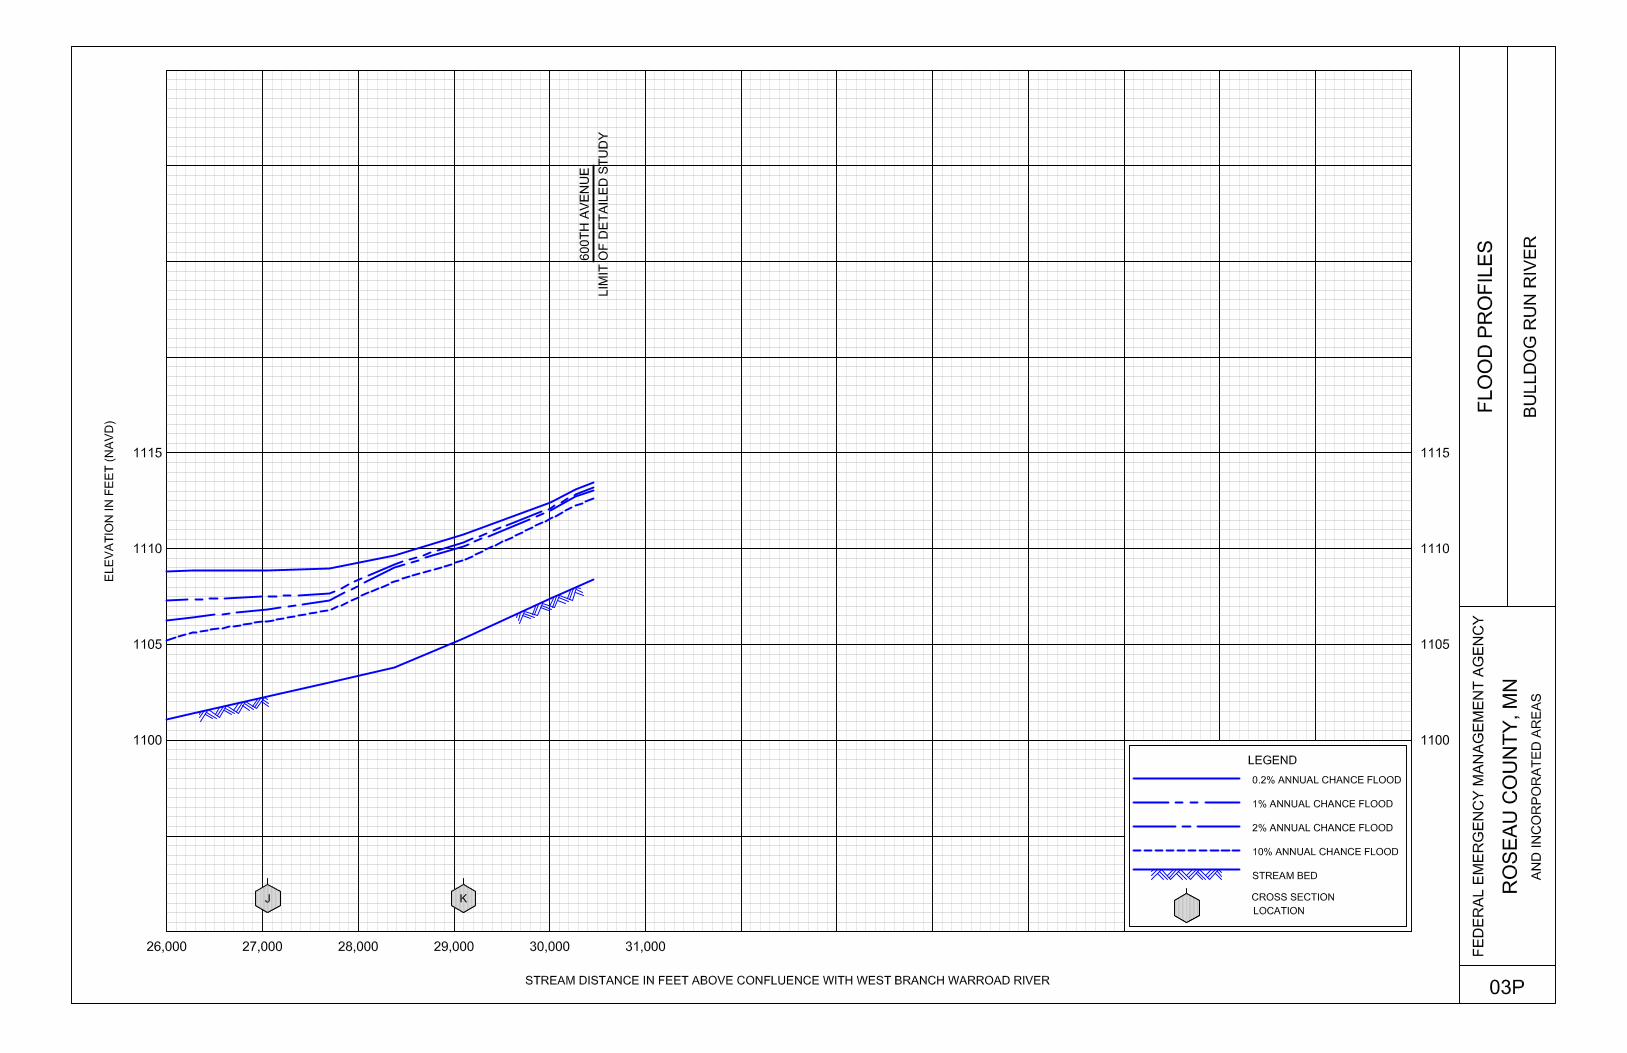
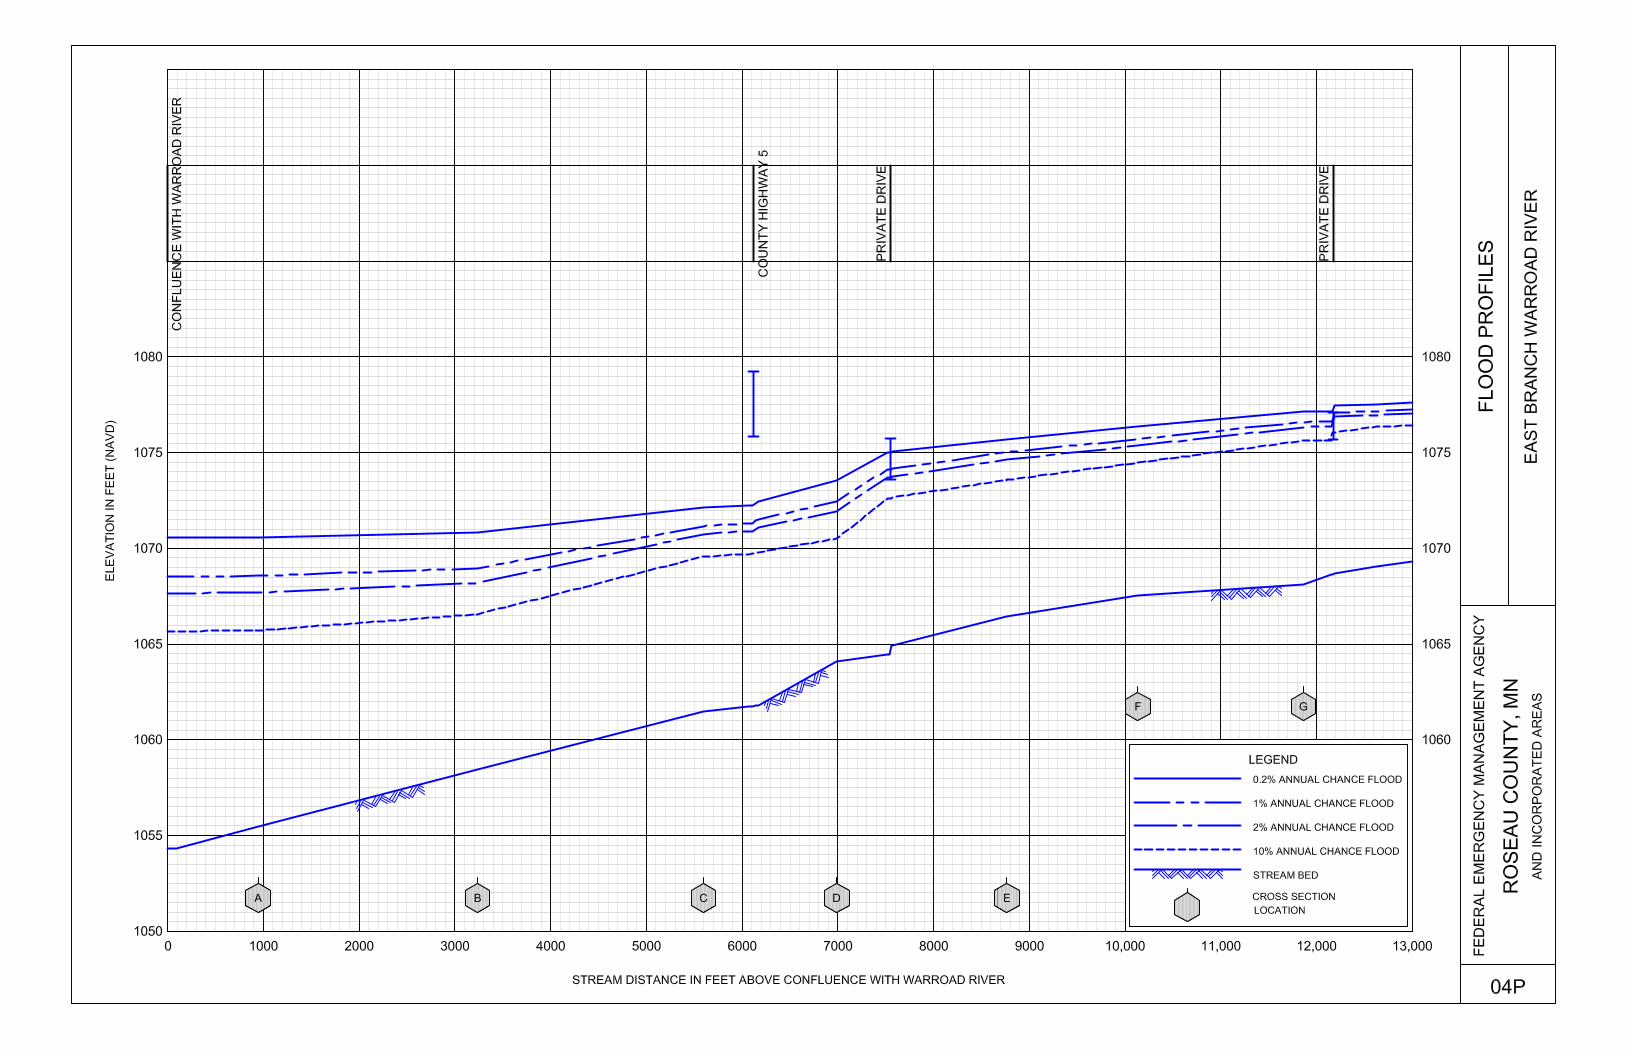
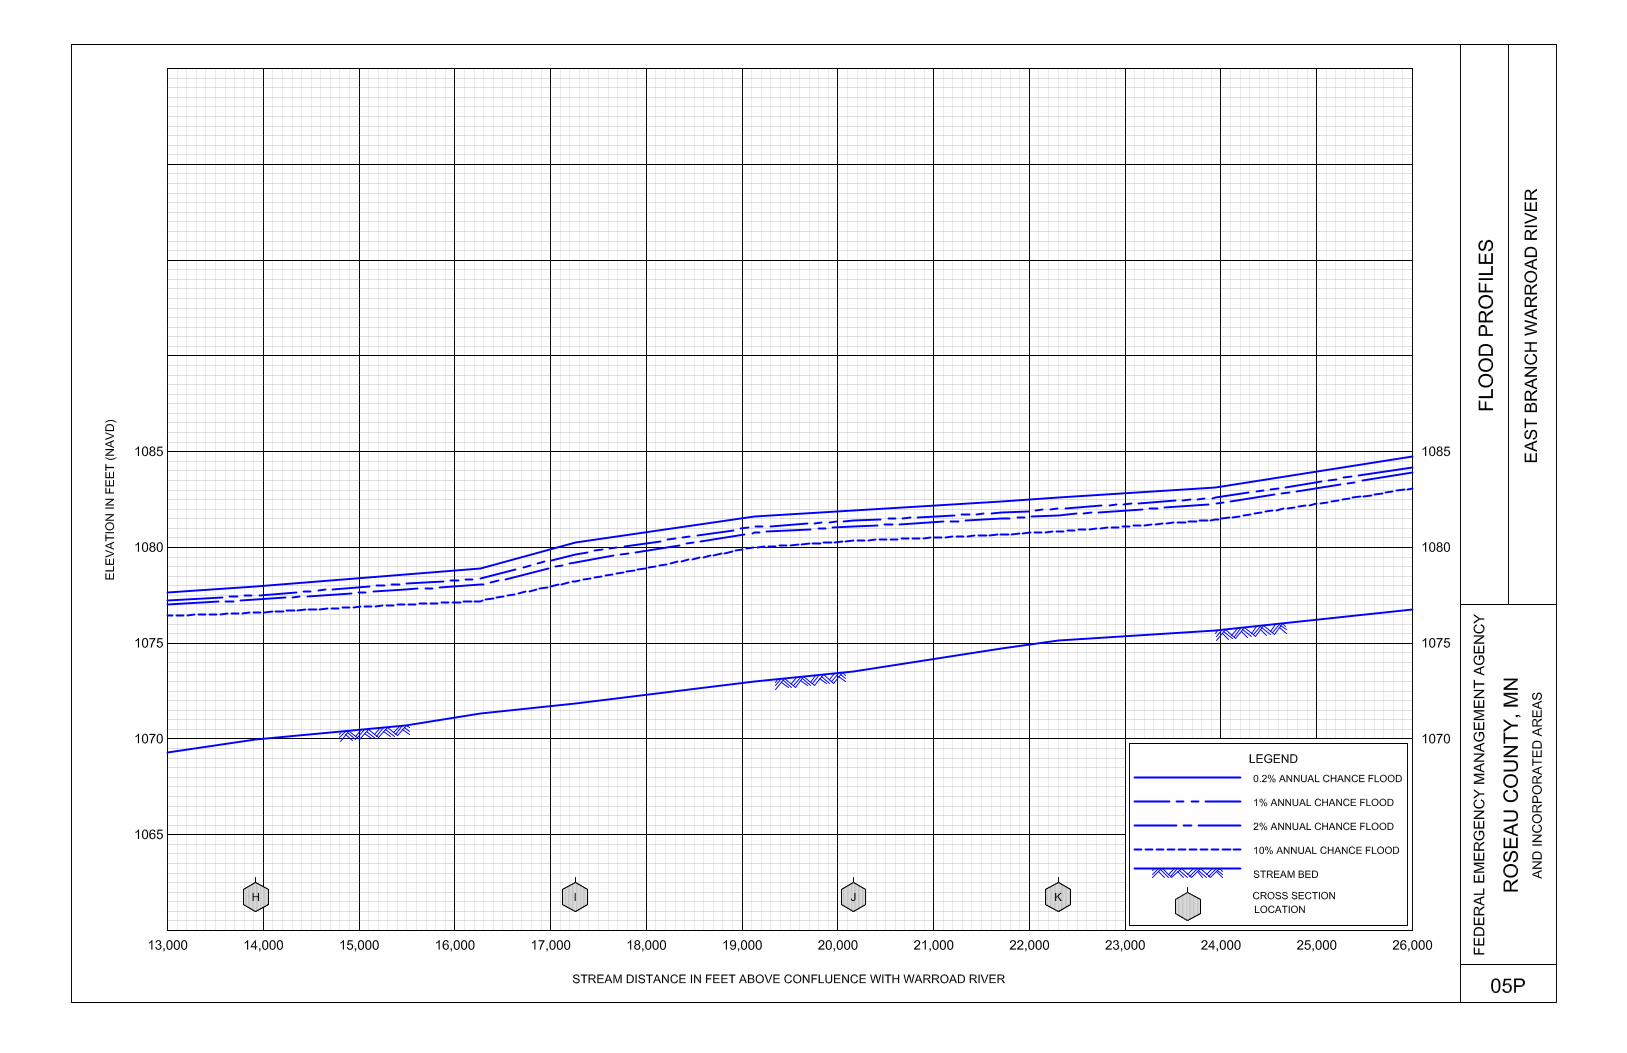
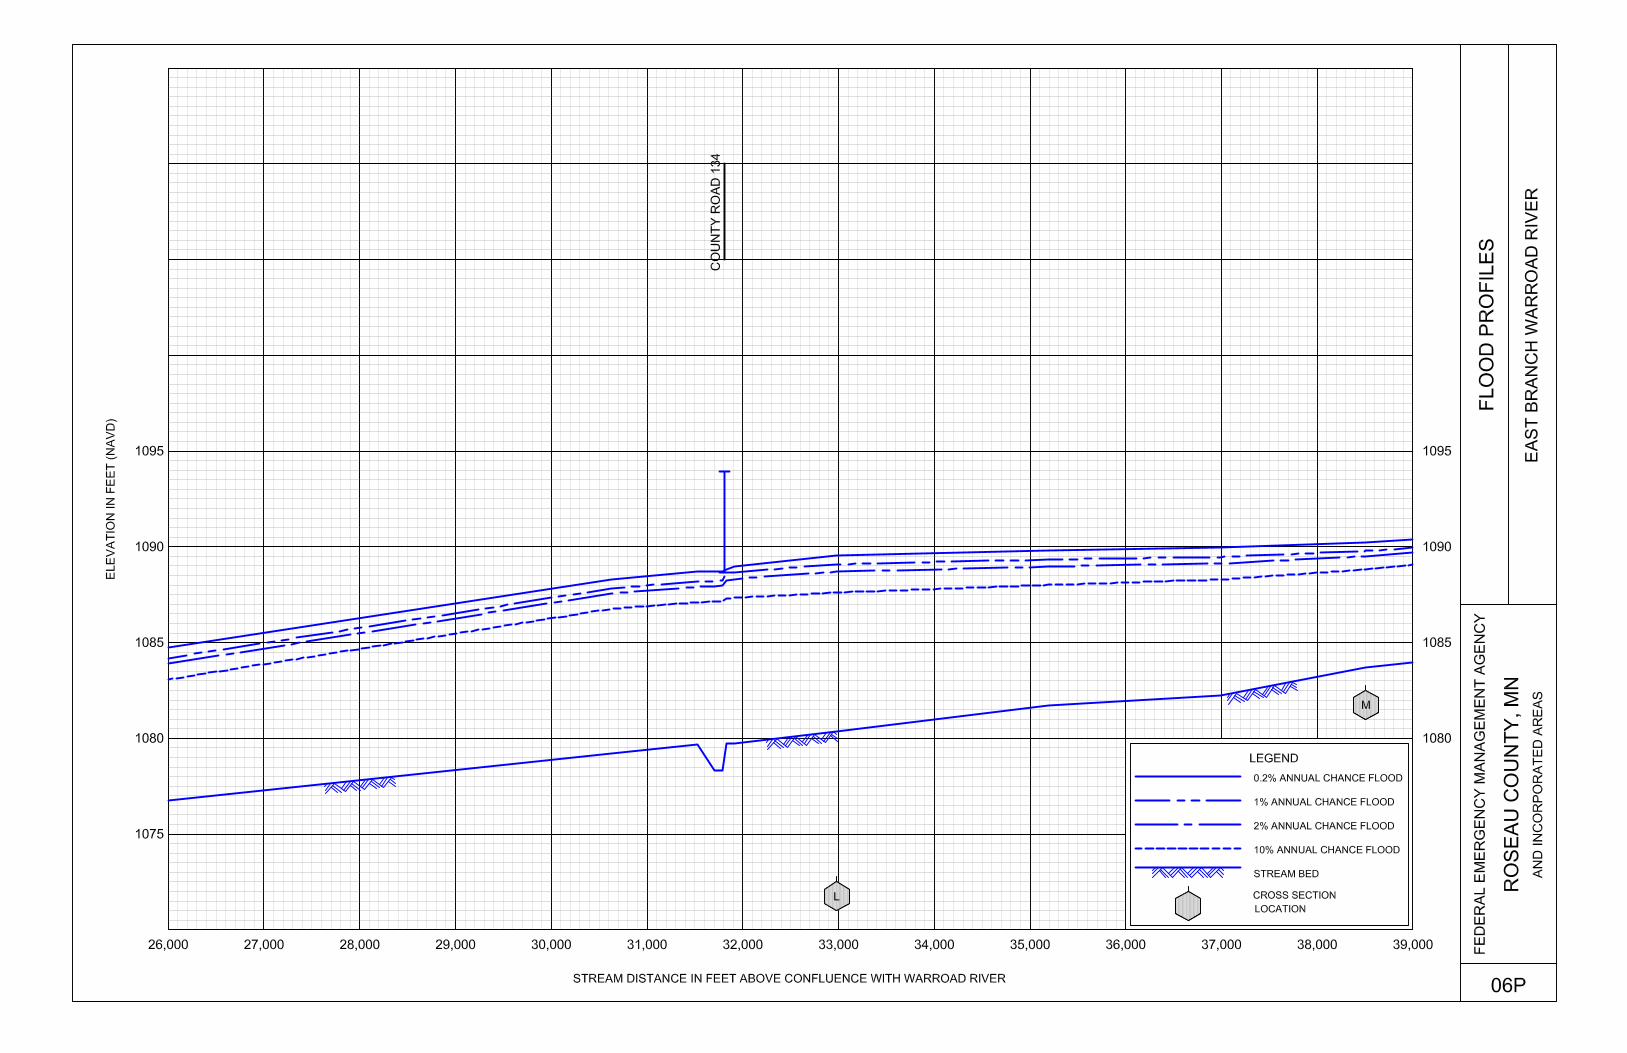
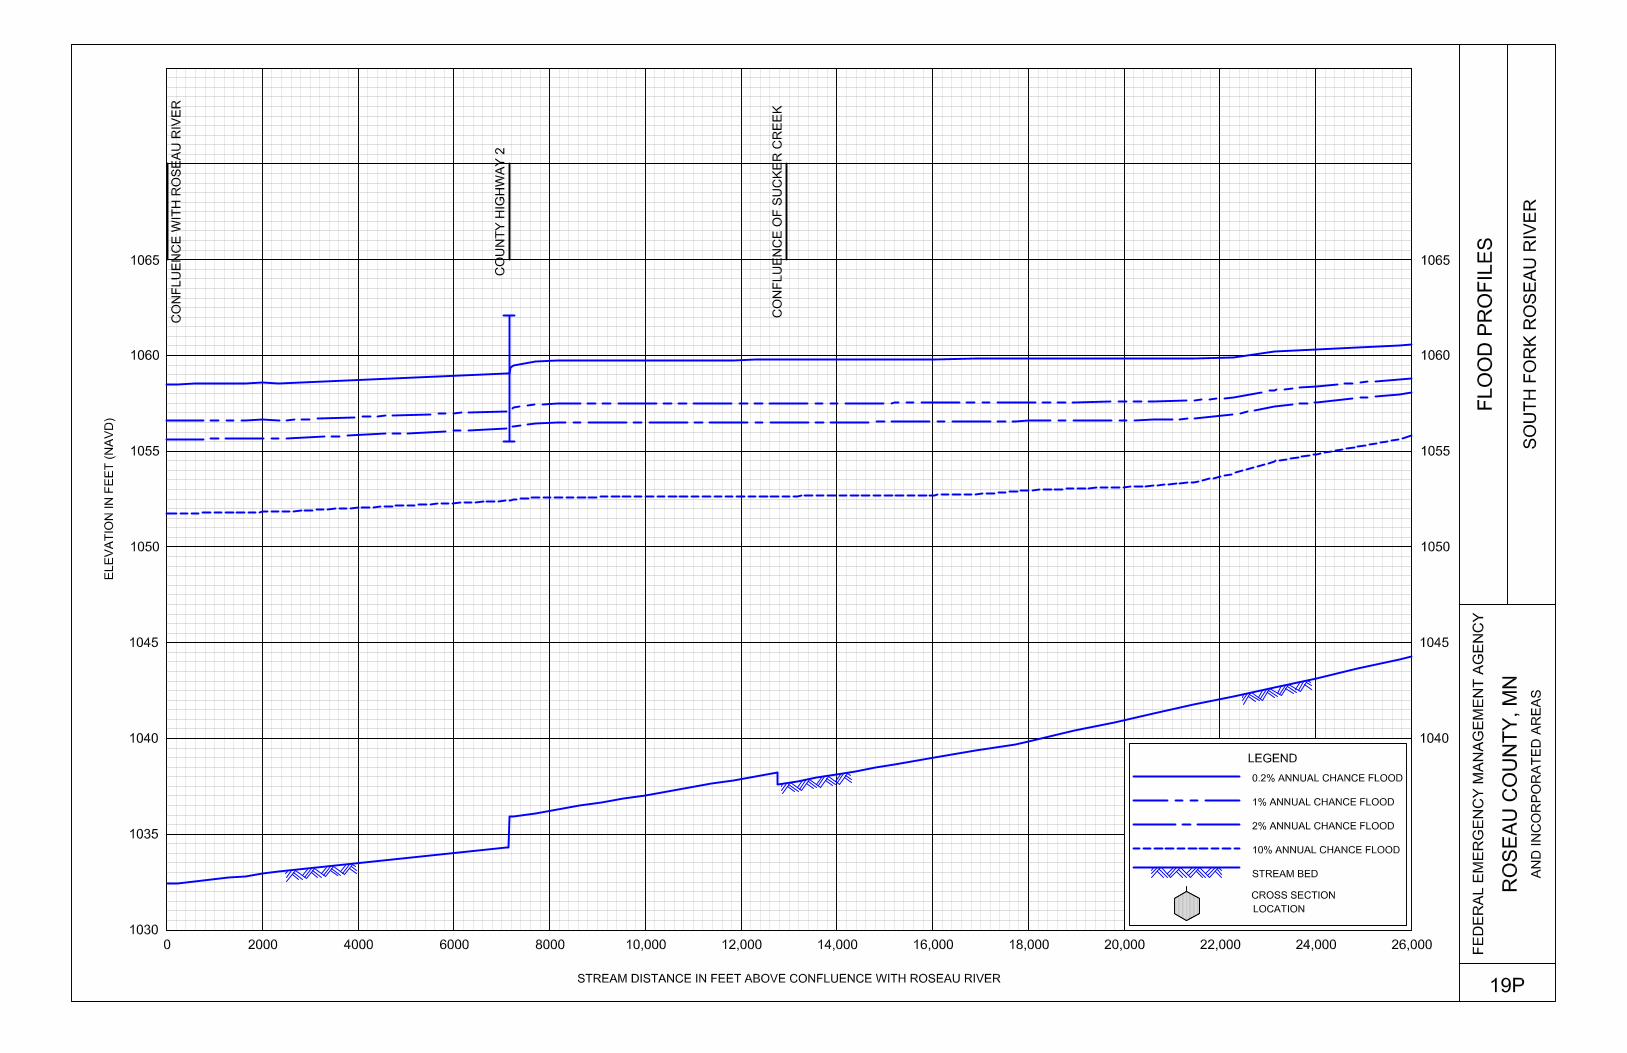
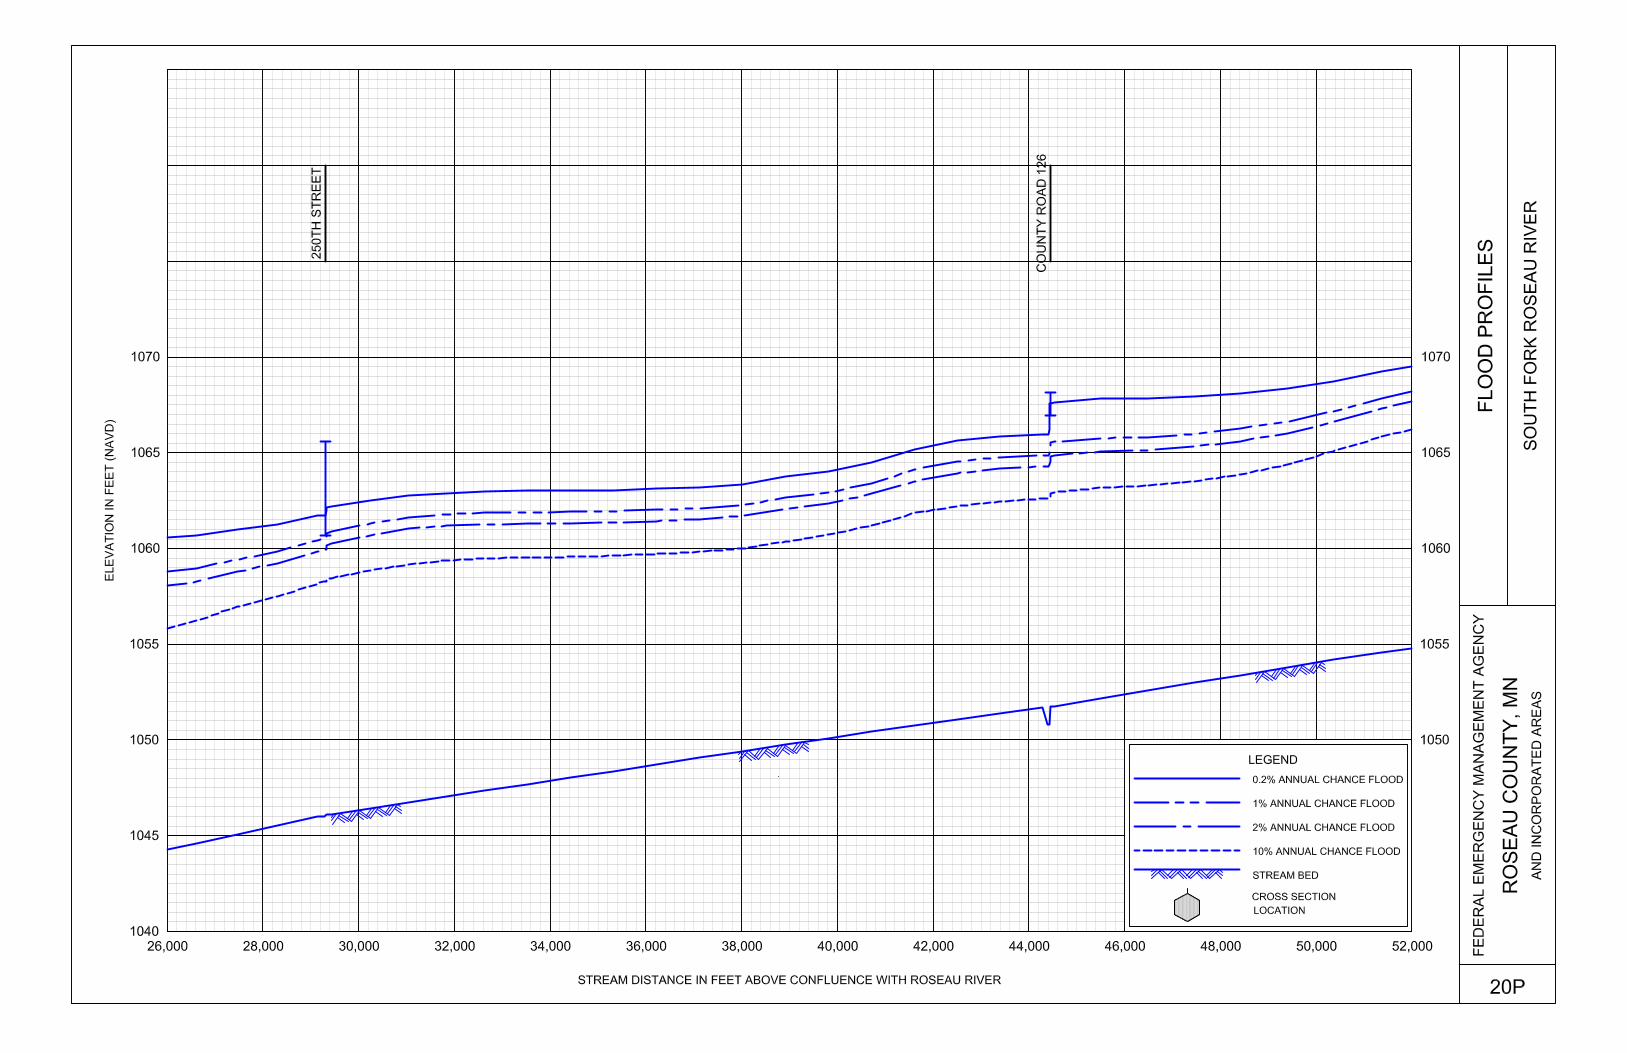
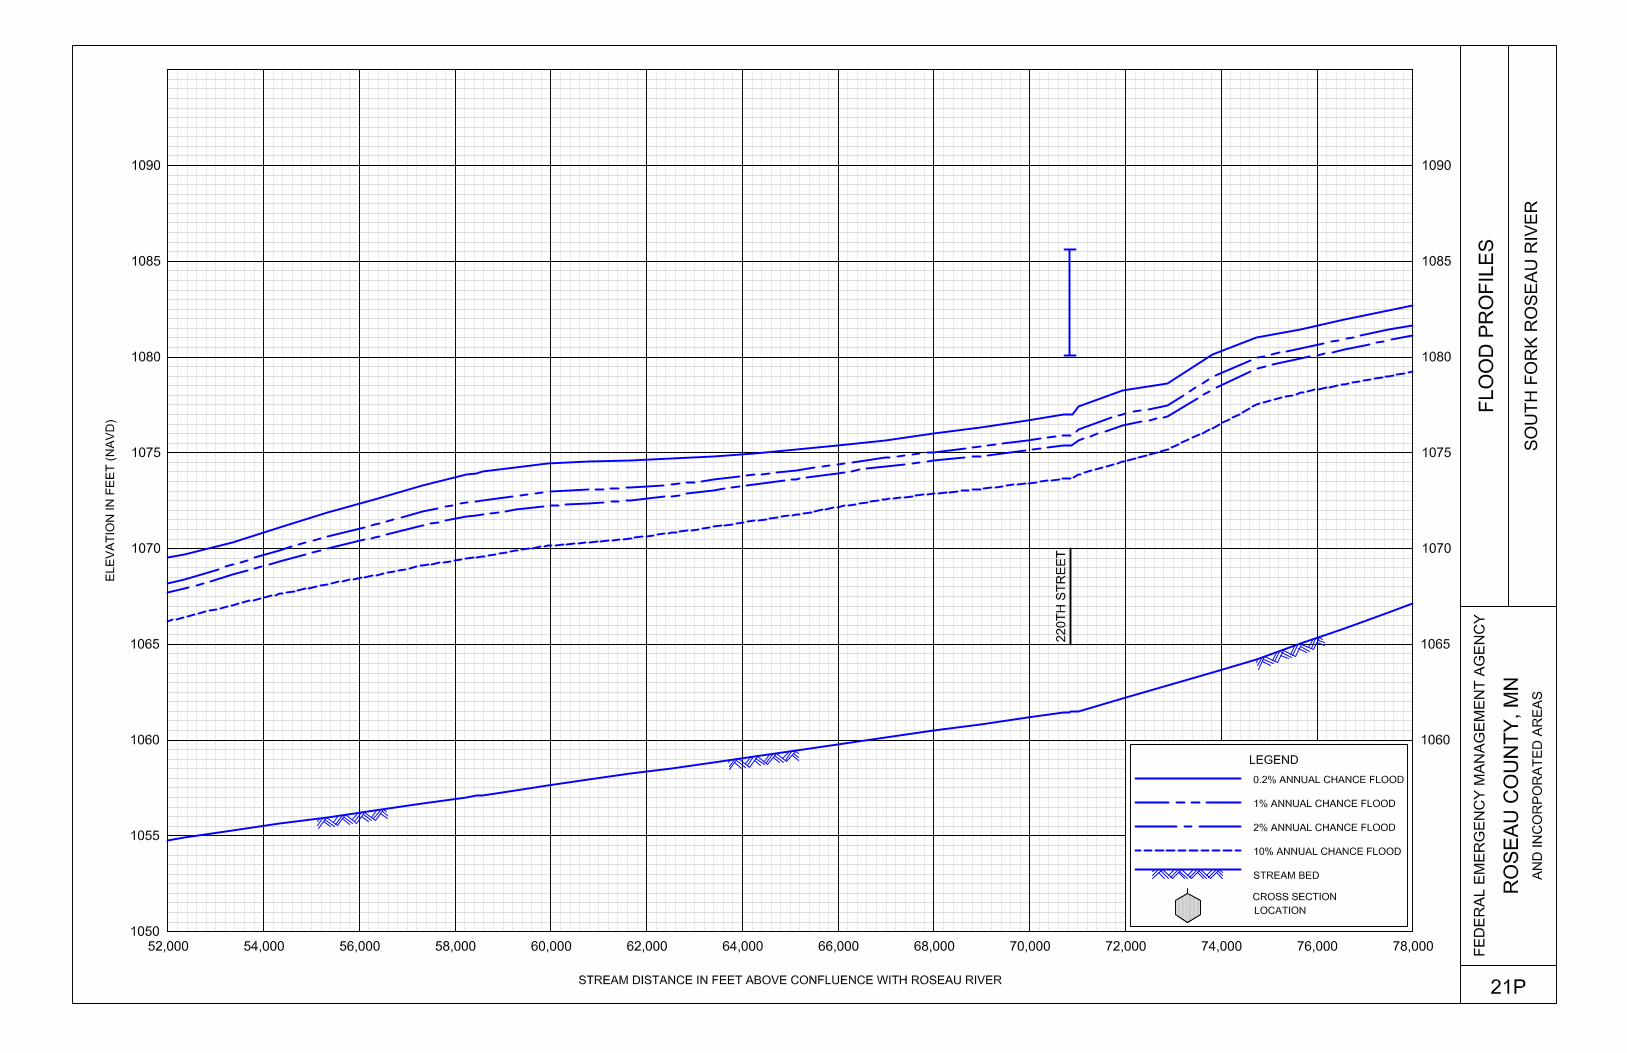
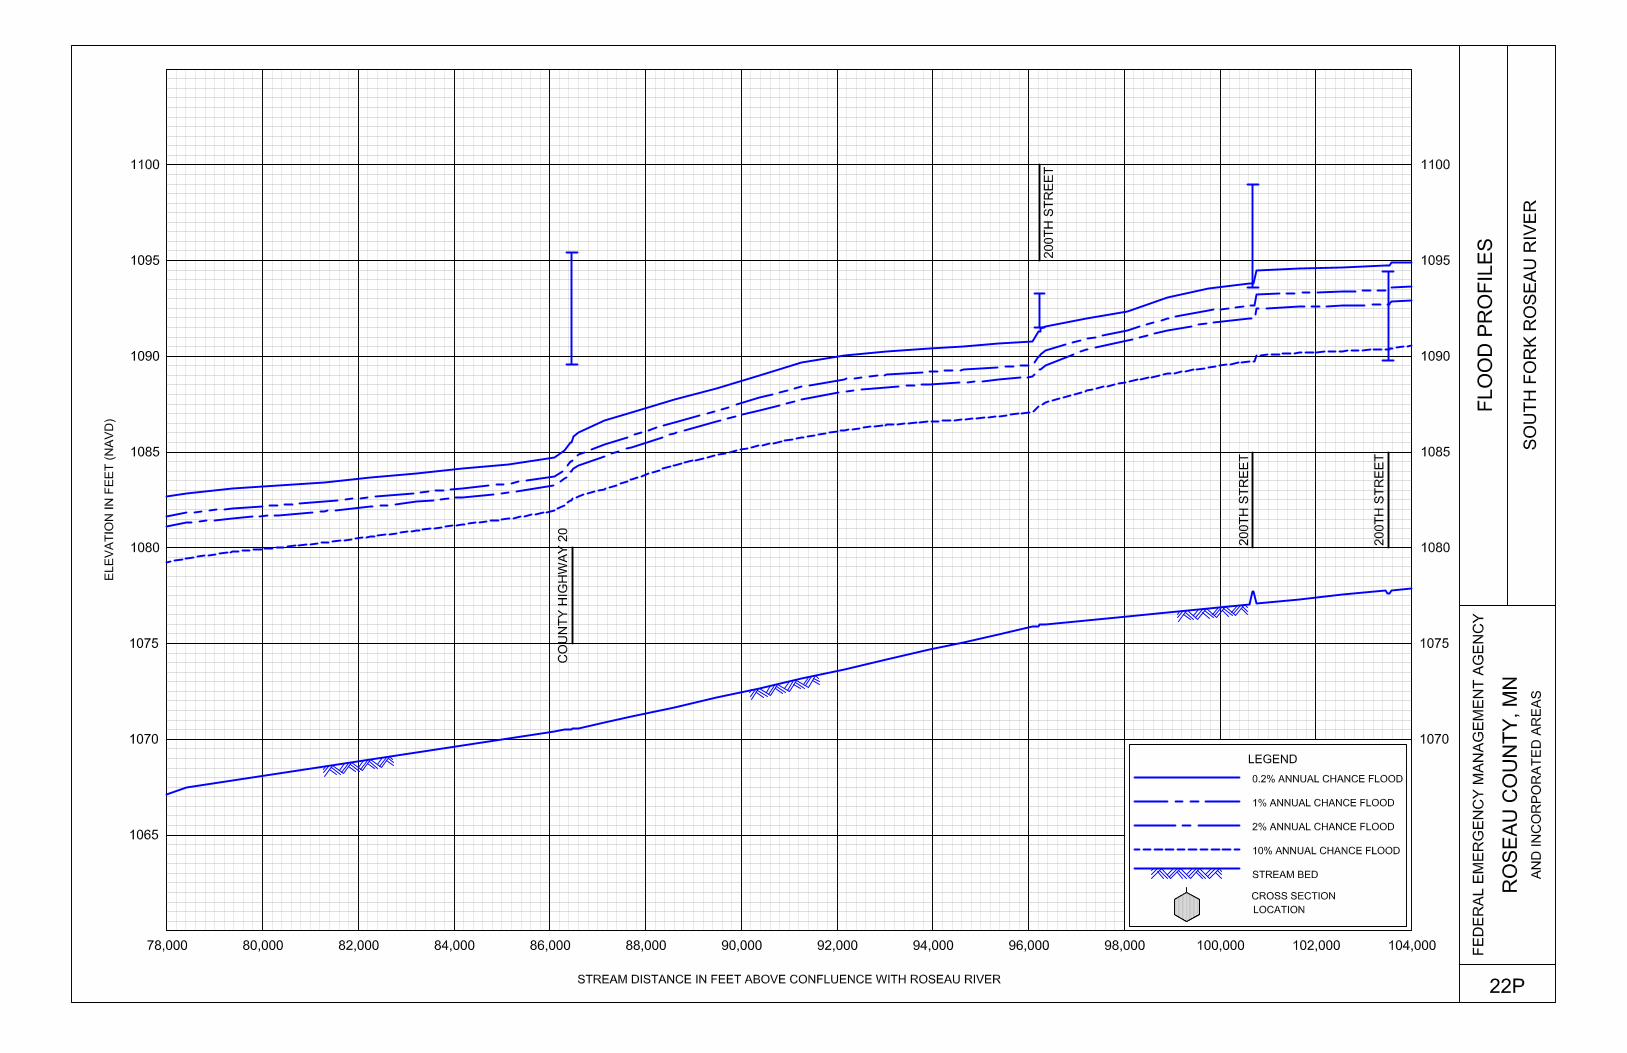
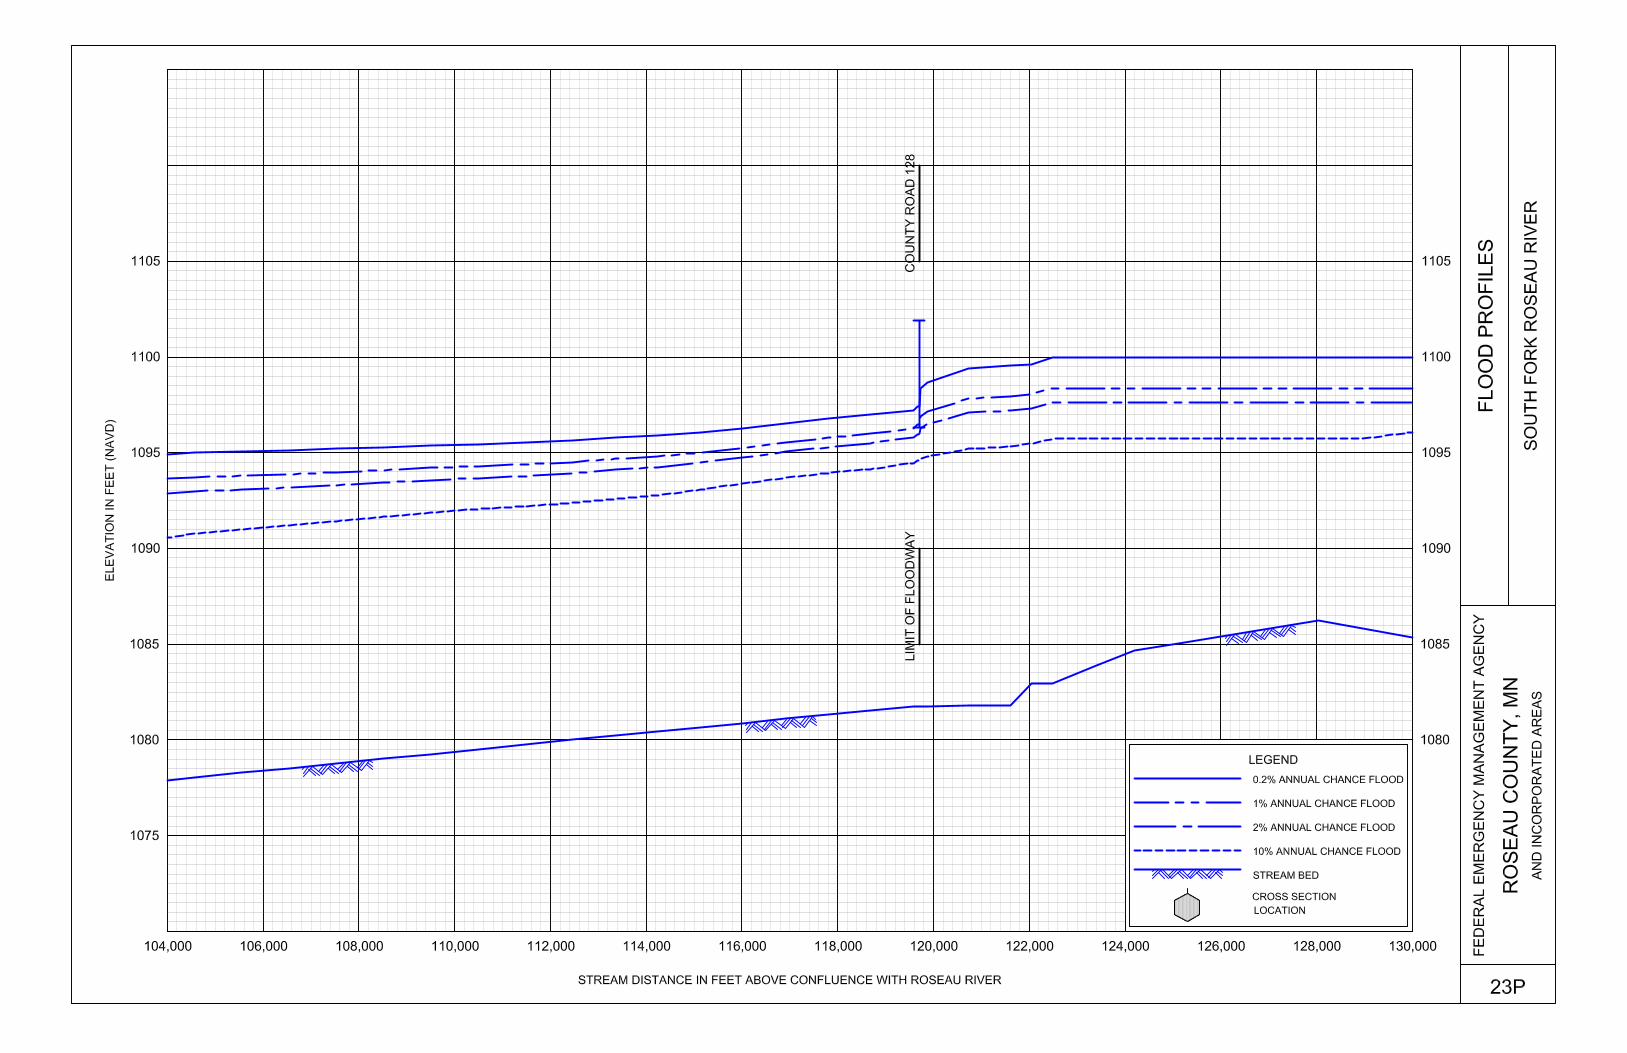
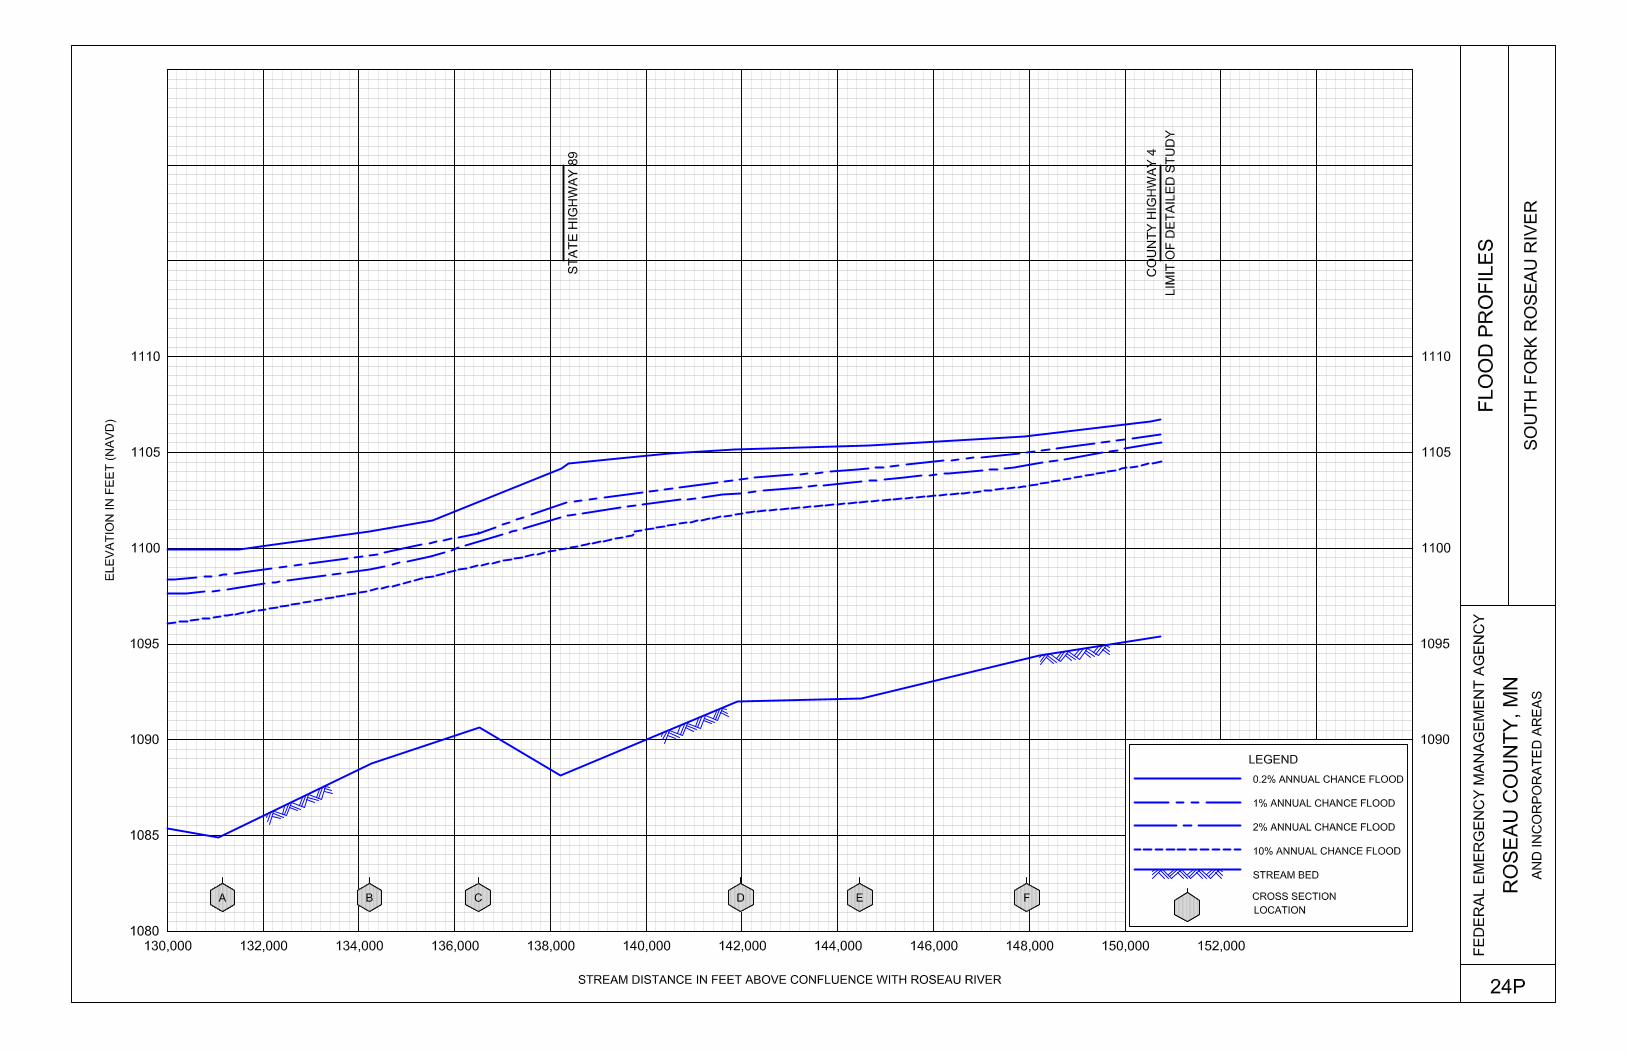
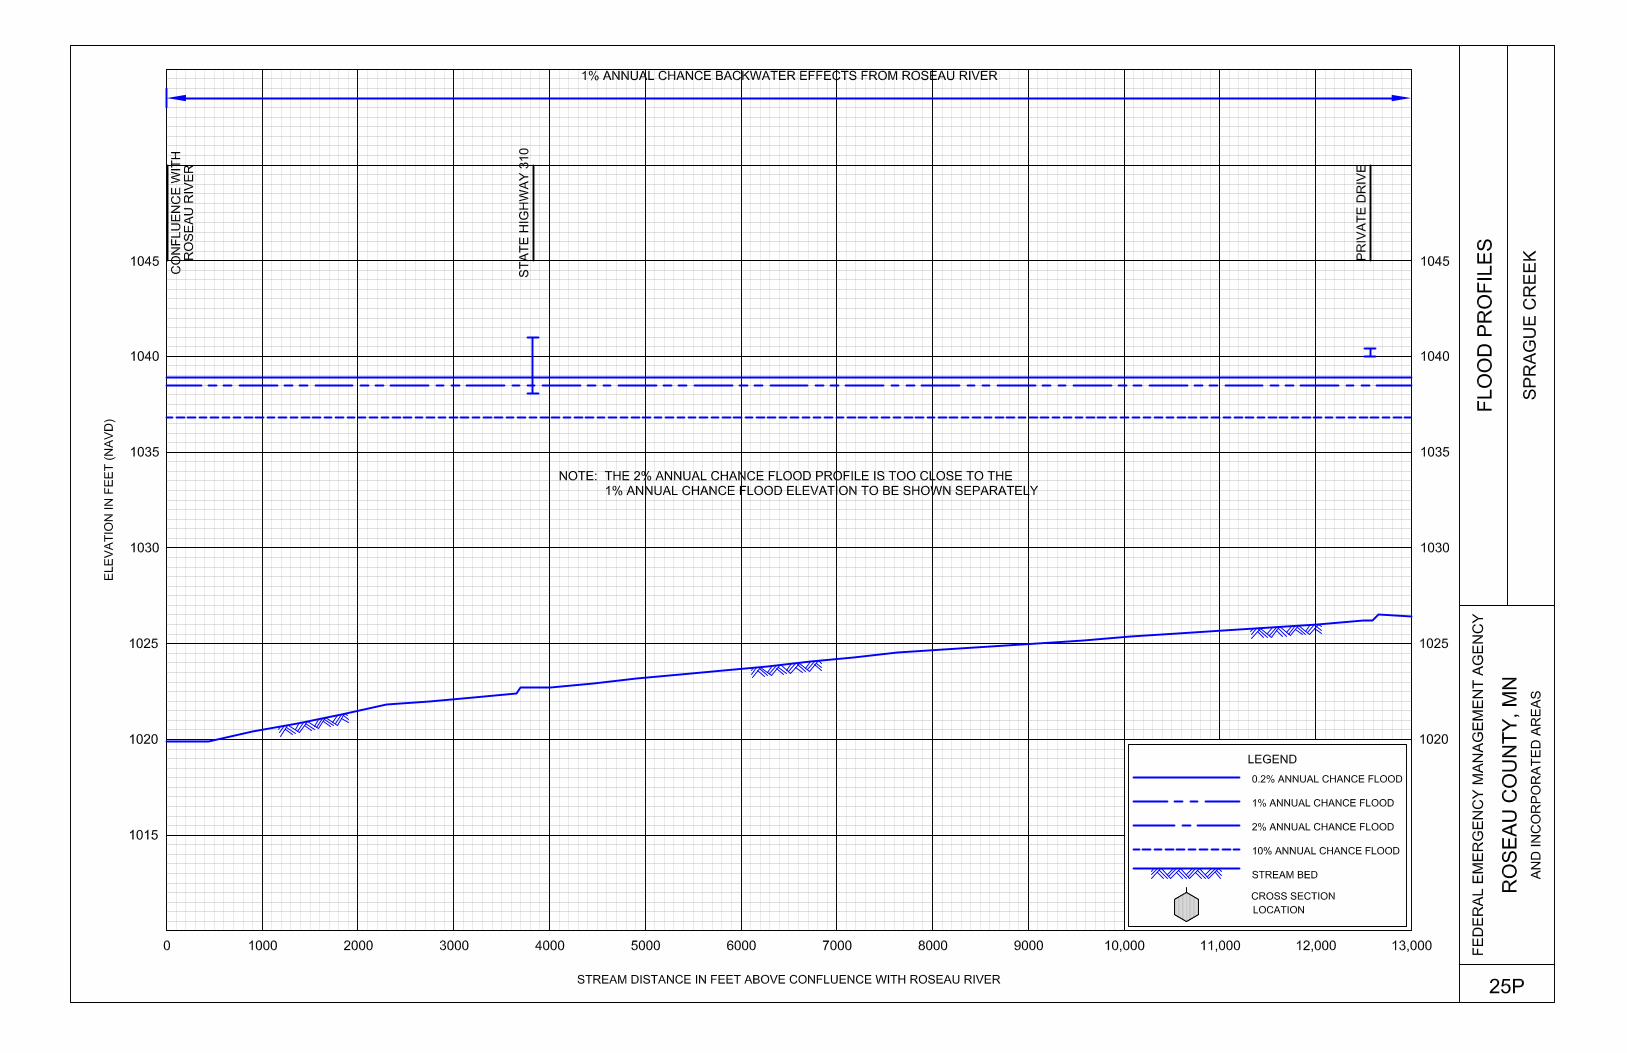
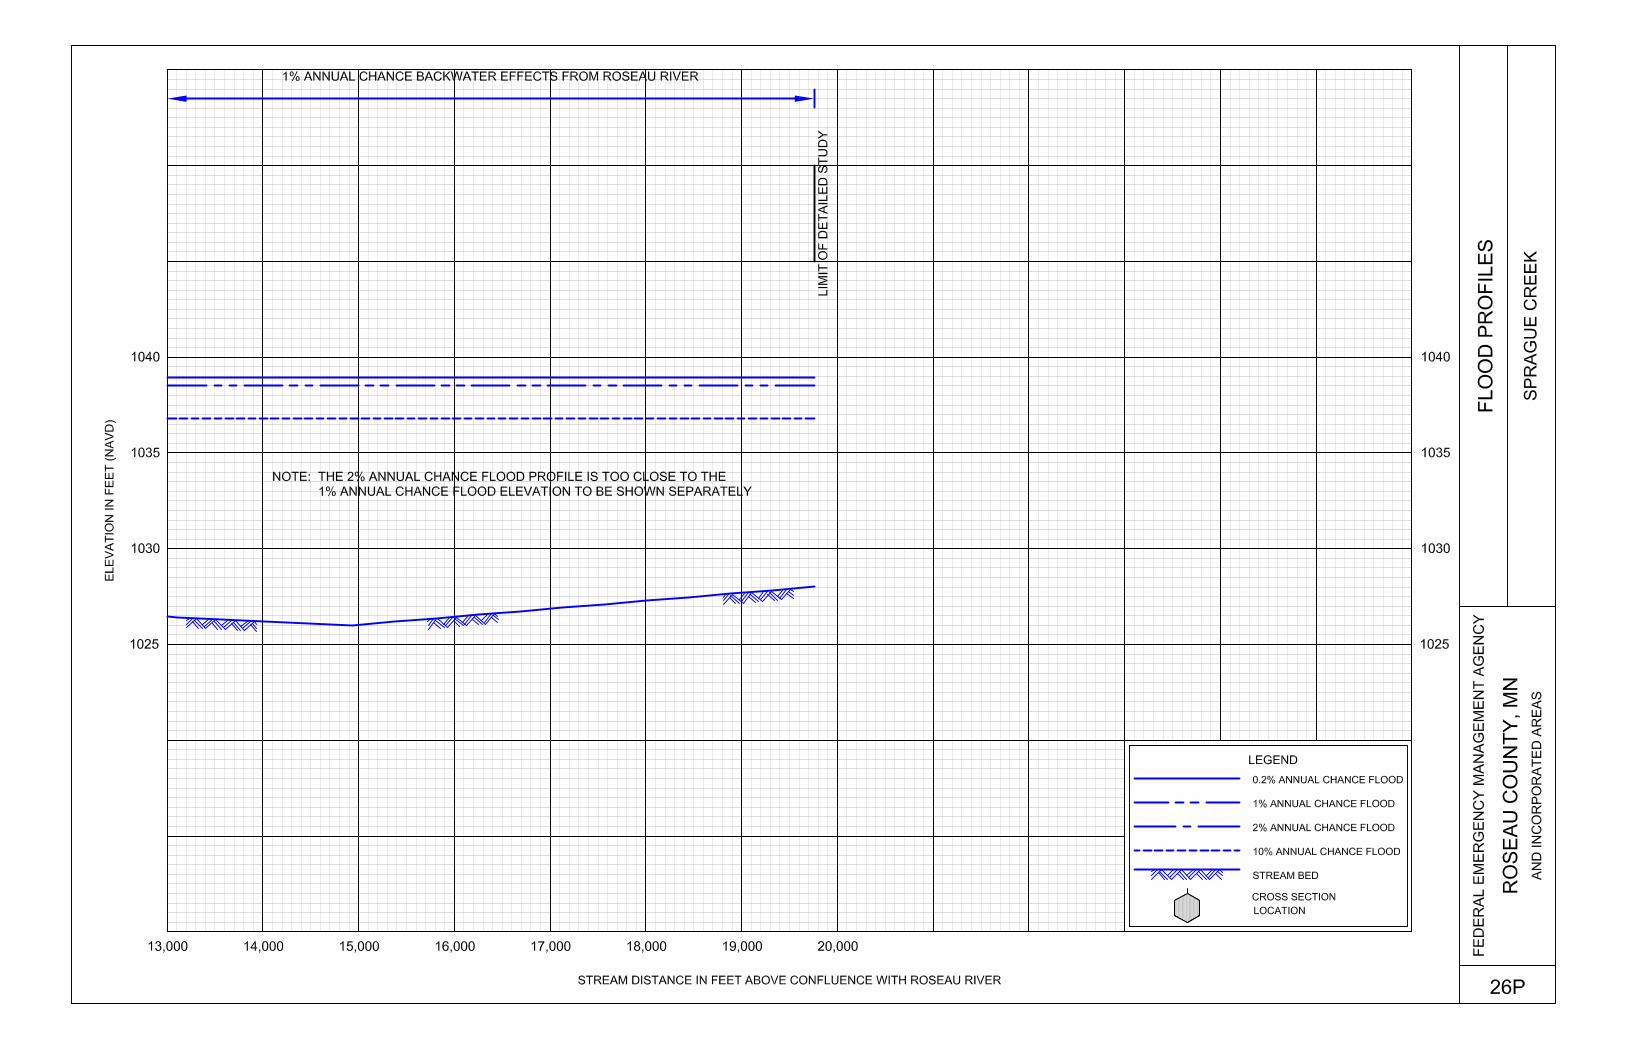
The limits of detailed study are indicated on the Flood Profiles (Exhibit 1) and on the FIRM (Exhibit 2). This Countywide FIS Report
For this countywide FIS, Bulldog Run River, East Branch Warroad River, Sprague Creek, Sucker Creek, and West Branch Warroad River were newly studied. The portion of the Roseau River from approximately 300 feet downstream of State Highway 89 to approximately 1.54 miles upstream of 420th Avenue, the portion of the South Fork Roseau River from the confluence with the Roseau River to approximately 0.53 mile upstream of County Road 128, and Warroad River were studied as part of this revision and provide some reaches of
5
new detail as well as some reaches of revised detail. All areas studied by approximate methods were either newly studied or revised based on updated hydrologic and hydraulic models, with the exception of South Branch Two Rivers. For this countywide FIS, the FIS report and FIRM were converted to countywide format, and the flooding information for the entire county, including both incorporated and unincorporated areas, is shown. Also, the vertical datum was converted from the National Geodetic Vertical Datum of 1929 (NGVD) to the North American Vertical Datum of 1988 (NAVD). In addition, the Universal Transverse Mercator coordinates, previously referenced to the North American Datum of 1927 (NAD 27), are now referenced to the NAD83. Approximate analyses were used to study those areas having low development potential or minimal flood hazards. The scope and methods of study were proposed to and agreed upon by FEMA and Roseau County.
2.2 Community Description
Roseau County is located in the northwest portion of Minnesota. It is bordered by Lake of the Woods County to the east; Beltrami County to the southeast; Marshall County to the south; and Kittson County to the west. The province of Manitoba, Canada, is adjacent to the entire northern border of Roseau County. The 2000 population estimate for Roseau County was 16,338 (U.S. Census Bureau, 2010). The climate of the area is classified as humid continental, characterized by large seasonal variations in temperature. Average temperatures for Roseau County range from an average low of -11 degrees Fahrenheit (°F) in the winter months to an average high of 77 °F in the summer months. The average monthly rainfall for the county is 1.73 inches with the majority of the precipitation falling as rain during the summer months (The Weather Channel, 2010). The county is serviced by State Highways 8, 11, 13, 32, and 89; the Minnesota Northern Railroad; and the Canadian National Railway. State Highway 11 and the Minnesota Northern Railroad traverse the county east and west, connecting the two largest cities of Warroad and Roseau. The Canadian National Railway and the remaining state highways traverse the county to the south and north into Canada. The economy of Roseau County is primarily agricultural. Farms are located primarily in the central and western two-thirds of the county and are mostly involved in grain and livestock production. Roseau County is an expansive prairie region that is the remnant of the floor of Glacial Lake Agassiz. The topographic relief is minimal, often with a change in elevation of one foot per mile or less. The general slope of the land for the entire
6
county is to the north-northwest with the highest elevation of approximately 1,265 feet NAVD in the southeastern portion of the county and the lowest elevation of approximately 1,020 feet NAVD in the northwestern portion of the county. Approximately twenty percent of total land area is forested, consisting primarily of northern hardwoods and bog conifers, primarily in the eastern third of the county. Fifty-nine percent of the land area is agriculturally oriented, primarily in the central and western portions of the county. Marsh areas scattered throughout the county constitute approximately eight percent of the total land area. Brush land constitutes approximately twelve percent of the county. The remaining one percent consists of urban and rural development, mining, and water (Minnesota Department of Administration, 2010). The drainage in the county is characterized by a series of low gradient drainage ditches which feed the natural streams and rivers. Three major drainage areas exist within the county. Approximately 15 percent of the county drains north through the Warroad River to Lake of the Woods; 20 percent of the county drains west through Two Rivers, a tributary to the Red River; and the remainder of the county drains northwest through the Roseau River to join the Red River in Canada. The extent and nature of the floodplain development consists of agricultural and farmstead land.
2.3 Principal Flood Problems
Flooding in Roseau County generally occurs from rapid snowmelt or snowmelt in combination with heavy spring rainfall. Flooding has also occurred during the summer months from short-duration, high-intensity rain storms. The low gradient of the Roseau River and the backwater effects of Roseau Lake and Bog Swamp are factors contributing to flooding near Roseau and Ross. The river flattens gradually from a slope of 17.0 feet per mile upstream of the City of Roseau to 0.2 feet per mile at Big Swamp located approximately 10 miles downstream of Ross. The shallow channel of the Roseau River downstream of the City of Roseau causes frequent overbank flooding. Flood damage in Roseau County has generally been limited to fields and crops, but has also included bridges and roadway embankments and some rural farmsteads. Flooding occurred on the Roseau River near the City of Roseau in 1919, 1950, 1965, 1966, 1968, 1969, and 1975 (USGS, 1917-1976). During the flood of 1966, the highest stage of record was experienced and had approximately 3.3-percent-annual-chance of recurrence. No recent flooding information is available for this area.
Flooding occurred on the Roseau River near Ross in 1919, 1948, 1950, 1966, and 1969 (USGS, 1917-1976). More recent floods at Ross have occurred in May 1970, April 1974, April 1979, May 1996, April 1997, June 2002, May 2004, April 2006, and April 2009. The flood on June 2002 had the highest discharge of record of 10,500 cubic feet per second (cfs) (USGS, 2010a).
7
Floods of record on Pine Creek occurred in 1941, 1947, 1948, and 1950 (USGS, 1917-1976). The stream gage at Pine Creek was discontinued in 1953. The flood of record in 1941 on Pine Creek had a 10-percent-annual-chance of recurrence. Flooding in Greenbush from the South Branch Two Rivers has occurred in April 1950, July 1957, and April 1966. Past flooding problems have occurred due to the ponding east of the State Highway 32 crossing, which has been eased after the installation of culverts at the State Highway 32 crossing and a new bridge on County Highway 4 (approximately one mile upstream of State Highway 32). No recent flooding information is available for this area. Historical flood information for the Warroad River is incomplete; however, floods have occurred in 1948, 1950, 1962, 1965, and 1968 (USGS, 1917-1976). More recent information from the USGS is available up until 1980, where floods were shown to occur in 1969 and 1979 (USGS, 2010b). Recent disaster declarations for flooding have been made for Roseau County in March-May 1999, March-July 2001, June 2002, March-May 2006, and March 2009 (FEMA, 2010).
2.4 Flood Protection Measures
Small flood control and drainage projects initiated by state and local agencies began in 1904. These projects involved land drainage through a system of ditches and channel enlargement of the Roseau River at selected locations. Among one of the projects completed during the construction period of 1904 to 1918 was the draining of Roseau Lake. A new channel was cut along the southern edge of the lake to reduce the elevation and duration of the flood peak at Roseau Lake. The joint study by the International Roseau River Engineering Board reports a 10 to 25 percent increase in peak discharge at the international boundary due to these projects (International Roseau River Engineering Board, 1975). The Pine Creek diversion project was completed in 1953. This project allows up to 450 cfs of water to be diverted to three wildlife ponds in Minnesota, although the actual diversion structure is located in Manitoba. It has been estimated that the diversion project reduces peak discharges of the Roseau River at the international boundary by four to five percent (International Roseau River Engineering Board, 1975).
Flood control dikes built in 1965 exist on both the east and west banks of the Roseau River throughout the City of Roseau, but are not designed to meet the U.S. Army Corps of Engineers (USACE) diking standards. The dikes do not provide effective protection from the 1-percent-annual-chance flood, but do provide a minimum amount of flood protection. A dam located at the north end
8
of the City of Roseau has little flow-retarding effect, and is essentially overtopped except during low flows. Concrete retaining walls have been built along both banks of the Warroad River for a distance of 0.7 mile, beginning 0.4 mile upstream of the mouth. These projects do not protect against the 1-percent-annual-chance flood, but keep the banks from eroding.
3.0 ENGINEERING METHODS
For the flooding sources studied by detailed methods in the community, standard hydrologic and hydraulic study methods were used to determine the flood hazard data required for this study. Flood events of a magnitude that are expected to be equaled or exceeded once on the average during any 10-, 50-, 100-, or 500-year period (recurrence interval) have been selected as having special significance for floodplain management and for flood insurance rates. These events, commonly termed the 10-, 50-, 100-, and 500-year floods, have a 10-, 2-, 1-, and 0.2-percent chance, respectively, of being equaled or exceeded during any year. Although the recurrence interval represents the long-term, average period between floods of a specific magnitude, rare floods could occur at short intervals or even within the same year. The risk of experiencing a rare flood increases when periods greater than 1 year are considered. For example, the risk of having a flood that equals or exceeds the 1-percent-annual-chance (100-year) flood in any 50-year period is approximately 40 percent (4 in 10); for any 90-year period, the risk increases to approximately 60 percent (6 in 10). The analyses reported herein reflect flooding potentials based on conditions existing in the community at the time of completion of this study. Maps and flood elevations will be amended periodically to reflect future changes. 3.1 Hydrologic Analyses
Hydrologic analyses were carried out to establish peak discharge-frequency relationships for each flooding source studied by detailed methods affecting the community.
Precountywide Analyses
Peak flood discharges for Pine Creek, Roseau River, South Branch Two Rivers, and Warroad River were coordinated with the MDNR, the USACE, the USGS, and the Soil Conservation Service (SCS). Discharges for Pine Creek were determined using the log-Pearson Type III analysis on 24 years of record from the USGS gaging station (No. 05107000, 1929 to 1953) located 1.5 miles northwest of the community of Pine Creek (NOAA, 1975). Because of the short period of record available at the site, the results were adjusted according to results obtained from the regional regression equations developed for this area (USGS, 1977).
9
The selected flood frequency discharges for the Roseau River near Ross were determined using the log-Pearson Type III analysis and skew adjustment according to procedures outlined in the Water Resources Council (WRC) Bulletin #17 (WRC, 1976). The data consisted of 47 years of record (1929-1975) at the gaging station located at Ross (No. 05107500) (USACE, 1964) and a regional skew value of -0.2. For the Roseau River near the City of Roseau, the same method was used on 46 years of record (1929-1975) at the gaging station located at Malung (No. 05104500) (USGS, 1917-1976). The downstream decrease in peak discharges on the Roseau River between the communities of Ross and Roseau is due to an enlargement of the floodplain width capable of extensive floodwater storage. In the City of Roseau, varied gaging station records along the Roseau River were analytically correlated to produce 49 years of record (1919-1966 and 1971) at Malung. The USACE developed a discharge-frequency analysis of this period of record using a log-Pearson Type III analysis as outlined in WRC Bulletin #17 (WRC, 1976). The USGS developed a discharge frequency analysis of this period of record using a log-Pearson Type III analysis and regression equations. The two analyses from the USACE and USGS were coordinated on November 24, 1976, for the gaging station at Malung. The discharge at Malung was transferred to the City of Roseau using the discharge area ratio method and an exponent of 0.6 for the selected recurrence intervals. The discharges for the South Fork Roseau River near Wannaska were established using the regional regression equations developed for this area by the USGS (USGS, 1977). The method of determining the magnitude of the selected frequency discharges was based on equations developed from a multiple regression analysis of over 200 gaged stream sites throughout the state of Minnesota. The analysis takes into consideration the drainage area, storage area, vertical relief, and hydraulic length of the watershed. The magnitude of the selected flood-frequency discharges for the Warroad River were determined by log-Pearson Type III analysis, using methods outlined in the WRC Bulletin #17 (WRC, 1976) with regionalized skew coefficients for records from the three gaging stations in the basin (USGS, 1917-1976). The three gaging stations are located approximately 2.5 miles south of Warroad on the Warroad River (31 years of record), Bulldog Run River (16 years of record), and East Branch Warroad River (19 years of record). However, because the station records are relatively short, the results of these analyses were combined with the results obtained by applying regional regression equations developed for this area (USGS, 1977). This was done by following the method of Hardison (USGS, 1969). The final values were projected to the mouth based on results from USGS regression equations with slight adjustment found applicable from the weighting process applied at the gaging stations (USGS, 1961-1976) The flood frequency discharges for Hay Creek were determined using regional regression equations (USGS, 1977).
10
A discharge-frequency relationship for the South Branch Two Rivers at the City of Greenbush was prepared utilizing the 10- and 1-percent-annual-chance flood discharges previously developed in the Barr Engineering report entitled, Water
Resources of the Lake Bronson Watershed (Barr Engineering Company, 1980). Discharges for the 2- and 0.2-percent-annual-chance flood events were interpolated and extrapolated from a log-probability graph of the 10- and 1-percent-annual-chance flood events. The peak water level data for the elevation frequency analysis for Lake of the Woods were obtained from the USACE from their lake gage at Warroad (USACE, 1893-1976). The gage is located on the left bank, traveling downstream below the Canadian National Railway track at the south end of Roberts Street in the City of Warroad. The elevation-frequency analyses were carried out using standard graphical procedures for 84 years of record.
This Countywide FIS Report
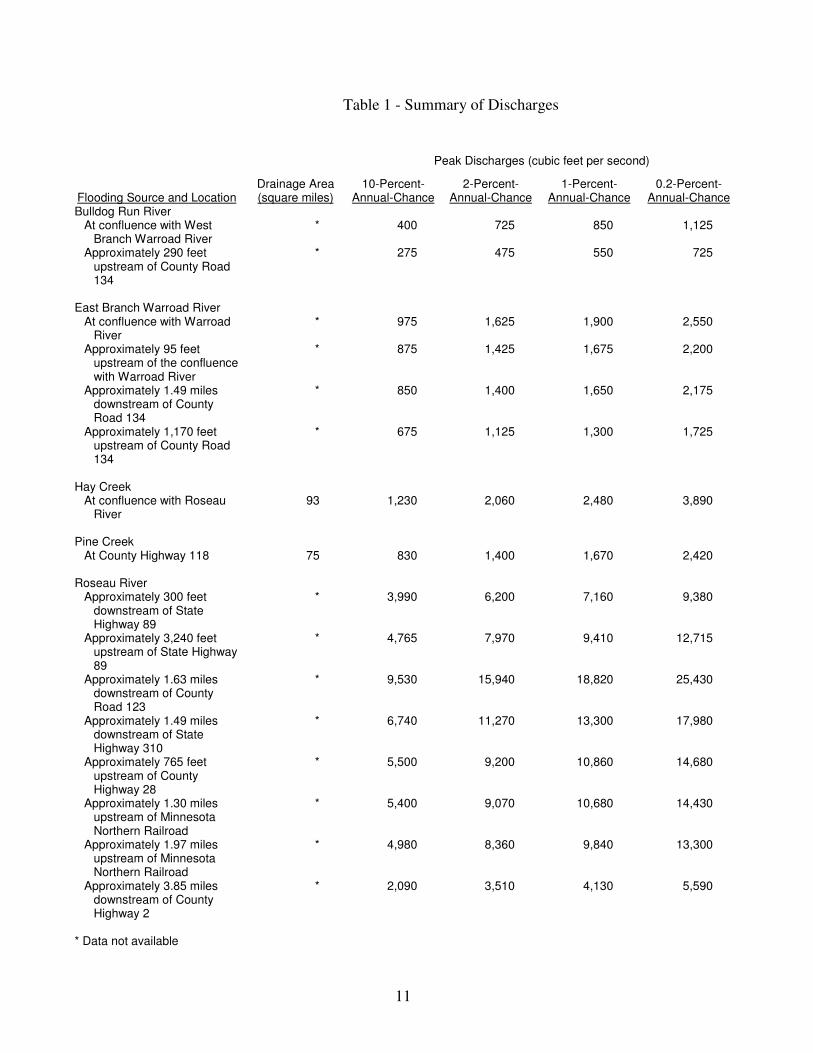
For Bulldog Run River, East Branch Warroad River, Warroad River, and West Branch Warroad River, statistical analyses were accomplished using the USACE, Hydrologic Engineering Center (HEC), computer program HEC-FFA (HEC, 1995) which incorporates techniques consistent with WRC Bulletin #17B (WRC, 1982). Statistical computations for this analysis were based on annual instantaneous peak values and the computed probability with no expected probability adjustment. The updated statistical analyses presented in this report utilized the period of record data including peak flows and elevations for the 2002 flood event. For the portion of the Roseau River from approximately 300 feet downstream of State Highway 89 to approximately 1.54 miles upstream of 420th Avenue, the portion of the South Fork Roseau River from the confluence with the Roseau River to approximately 0.53 mile upstream of County Road 128, Sprague Creek, and Sucker Creek, JOR Engineering (JOR Engineering, Inc., 2001) completed a HEC-1 analysis. The study utilized SCS methods to analyze two storms: a 10-day summer runoff event as well as a 10-day spring snow-melt event. The model was calibrated to two events, a May 1996 event and an October 2000 event. The major storm of record through the watershed occurred in June 2002, after the report was completed and therefore was not included in the calibration process. The HEC-1 analysis was later updated by the MDNR. For the streams studied by approximate methods, peak discharges were estimated using the published USGS regional regression equations (USGS, 1997). Regression equations estimate peak discharges for ungaged streams based on characteristics of nearby gaged streams. Peak discharge-drainage area relationships for each flooding source studied in detail are shown in Table 1.
11
Table 1 - Summary of Discharges
Peak Discharges (cubic feet per second)
Flooding Source and Location Drainage Area (square miles)
10-Percent-Annual-Chance
2-Percent-Annual-Chance
1-Percent-Annual-Chance
0.2-Percent-Annual-Chance
Bulldog Run River At confluence with West
Branch Warroad River * 400 725 850 1,125
Approximately 290 feet upstream of County Road 134
* 275 475 550 725
East Branch Warroad River
At confluence with Warroad River
* 975 1,625 1,900 2,550
Approximately 95 feet upstream of the confluence with Warroad River
* 875 1,425 1,675 2,200
Approximately 1.49 miles downstream of County Road 134
* 850 1,400 1,650 2,175
Approximately 1,170 feet upstream of County Road 134
* 675 1,125 1,300 1,725
Hay Creek
At confluence with Roseau River
93 1,230 2,060 2,480 3,890
Pine Creek
At County Highway 118 75 830 1,400 1,670 2,420 Roseau River
Approximately 300 feet downstream of State Highway 89
* 3,990 6,200 7,160 9,380
Approximately 3,240 feet upstream of State Highway 89
* 4,765 7,970 9,410 12,715
Approximately 1.63 miles downstream of County Road 123
* 9,530 15,940 18,820 25,430
Approximately 1.49 miles downstream of State Highway 310
* 6,740 11,270 13,300 17,980
Approximately 765 feet upstream of County Highway 28
* 5,500 9,200 10,860 14,680
Approximately 1.30 miles upstream of Minnesota Northern Railroad
* 5,400 9,070 10,680 14,430
Approximately 1.97 miles upstream of Minnesota Northern Railroad
* 4,980 8,360 9,840 13,300
Approximately 3.85 miles downstream of County Highway 2
* 2,090 3,510 4,130 5,590
* Data not available
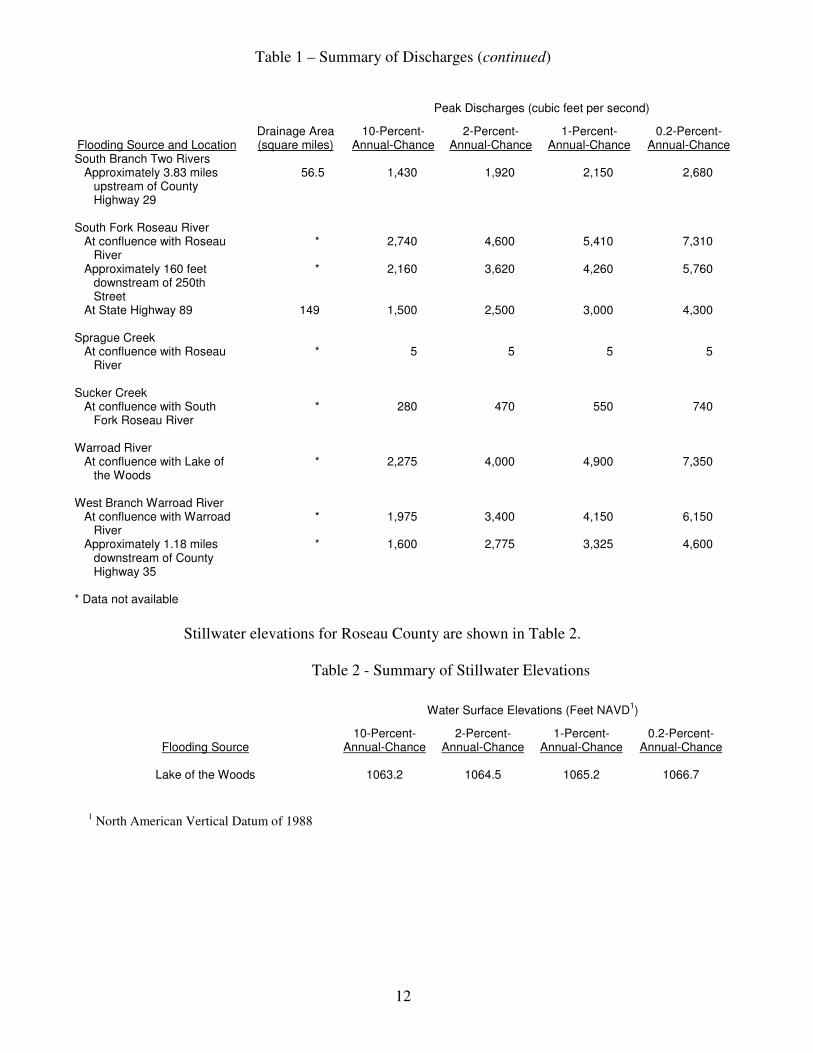
Table 1 – Summary of Discharges (continued)
12
Peak Discharges (cubic feet per second)
Flooding Source and Location Drainage Area (square miles)
10-Percent-Annual-Chance
2-Percent-Annual-Chance
1-Percent-Annual-Chance
0.2-Percent-Annual-Chance
South Branch Two Rivers Approximately 3.83 miles
upstream of County Highway 29
56.5 1,430 1,920 2,150 2,680
South Fork Roseau River
At confluence with Roseau River
* 2,740 4,600 5,410 7,310
Approximately 160 feet downstream of 250th Street
* 2,160 3,620 4,260 5,760
At State Highway 89 149 1,500 2,500 3,000 4,300 Sprague Creek
At confluence with Roseau River
* 5 5 5 5
Sucker Creek
At confluence with South Fork Roseau River
* 280 470 550 740
Warroad River
At confluence with Lake of the Woods
* 2,275 4,000 4,900 7,350
West Branch Warroad River
At confluence with Warroad River
* 1,975 3,400 4,150 6,150
Approximately 1.18 miles downstream of County Highway 35
* 1,600 2,775 3,325 4,600
* Data not available
Stillwater elevations for Roseau County are shown in Table 2.
Table 2 - Summary of Stillwater Elevations
Water Surface Elevations (Feet NAVD1)
Flooding Source 10-Percent-
Annual-Chance 2-Percent-
Annual-Chance 1-Percent-
Annual-Chance 0.2-Percent-
Annual-Chance
Lake of the Woods 1063.2 1064.5 1065.2 1066.7
1 North American Vertical Datum of 1988
13
3.2 Hydraulic Analyses
Analyses of the hydraulic characteristics of flooding from the sources studied were carried out to provide estimates of the elevations of floods of the selected recurrence intervals. Users should be aware that flood elevations shown on the FIRM represent rounded whole-foot elevations and may not exactly reflect the elevations shown on the Flood Profiles or in the Floodway Data Table in the FIS report. Flood elevations shown on the FIRM are primarily intended for flood insurance rating purposes. For construction and/or floodplain management purposes, users are cautioned to use the flood elevation data presented in this FIS report in conjunction with the data shown on the FIRM. Precountywide Analyses
Cross sections for the analyses were located at close intervals upstream and downstream of bridges, culverts, and other obstructions in order to compute significant backwater effects of those structures. Other cross sections were located along the watercourse in a manner that would provide a typical representation of the stream valley topography. Cross sections used in the hydraulic analyses for Hay Creek, Pine Creek, Roseau River outside of the City of Roseau, and South Fork Roseau River were field surveyed. All bridges and culverts were field surveyed to obtain elevation and structural data. For the Roseau River inside the City of Roseau, photogrammetric methods were used to obtain data for the dry portions of the cross sections (Aero-Metric Engineering, Inc., 1975) and the wet portions were field surveyed. Bridge dimensions and elevations were obtained from the Minnesota Department of Transportation (Minnesota Department of Transportation, 1971 and 1968) and the Burlington Northern Railroad (Burlington Northern Railroad, date unavailable). For the South Branch Two Rivers, photogrammetric methods were used to obtain data for the dry portions of the cross sections (Mark Hurd Aerial Surveys, Inc., 1980) while the wet portions were field surveyed. All bridges and culverts were field surveyed to obtain elevation and structural data. For the Warroad River, the dry portions of the cross sections were obtained using photogrammetric methods with aerial photographs (Aero-Metric Engineering, Inc., 1976) and the wet portions were obtained from field surveys. All bridges and culverts were field surveyed to obtain elevation and structural data. Water surface elevations (WSELs) for Hay Creek, Pine Creek, Roseau River outside of the City of Roseau, South Fork Roseau River, and Warroad River
14
outside of Warroad were computed through the use of the USACE, HEC computer program, HEC-2 (HEC, 1976). A newer version of the USACE, HEC computer program, HEC-2 was used to compute WSELs for South Branch Two Rivers (HEC, 1979) and an older version was used for the Roseau River inside the City of Roseau and the Warroad River inside the City of Warroad (HEC, 1973). Starting WSELs for the Roseau River outside the City of Roseau, South Branch Two Rivers, and South Fork Roseau River were developed using the slope-area method. Starting WSELs for Hay Creek and Pine Creek were obtained by using known WSELs at the confluence with the Roseau River. Starting WSELs for the Warroad River were based on the 2-percent-annual-chance frequency elevation of Lake of the Woods because the drainage area ratio of the Warroad River to Lake of the Woods is greater than 1:50 (MDNR, 1970). Starting WSELs inside the City of Roseau were obtained using rating curves developed by the USACE at the mouth of Hay Creek, at the headwater and tailwater of the Roseau Dam, and above Center Street (USACE, 1971).
This Countywide FIS Report
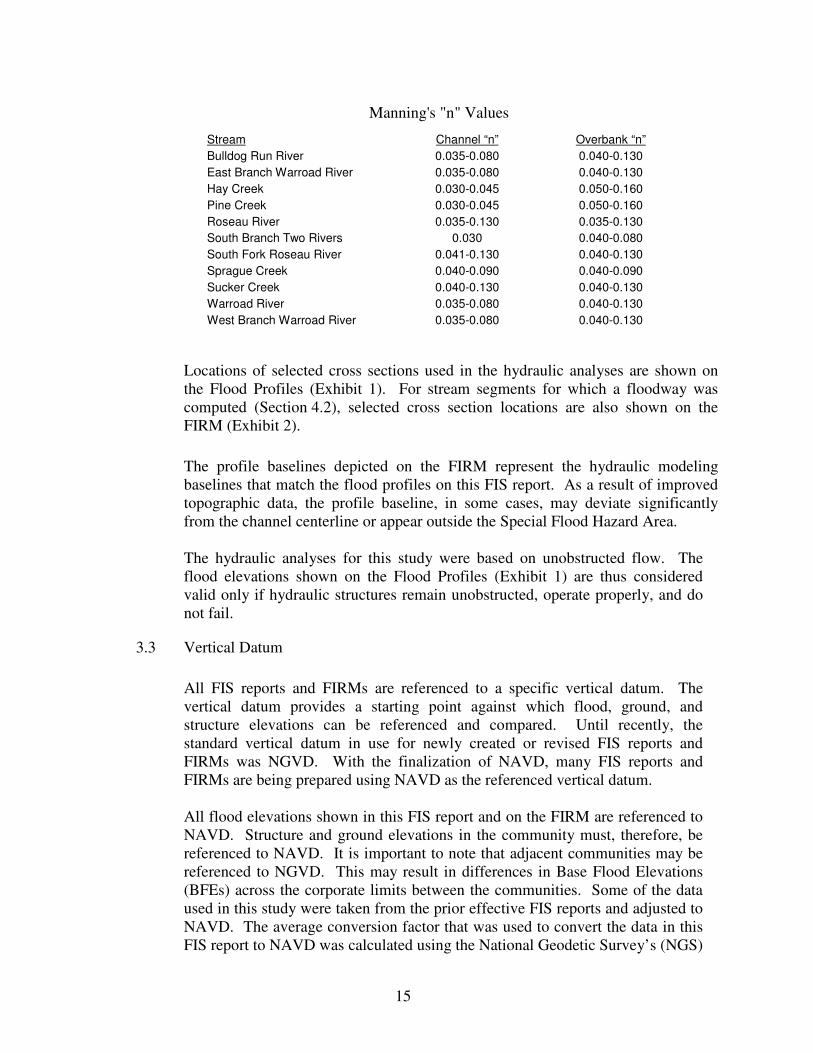
For Bulldog Run River, East Branch Warroad River, Warroad River, and West Branch Warroad River, cross sections were field surveyed within the banks and topographic data was used to extend the cross sections in the overbanks. Starting WSELs were determined utilizing normal depth. WSELS were computed through the use of the USACE, HEC computer program, HEC-RAS, version 3.1.3 (HEC, 2005). For the portion of the Roseau River from approximately 300 feet downstream of State Highway 89 to approximately 1.54 miles upstream of 420th Avenue, the portion of the South Fork Roseau River from the confluence with the Roseau River to approximately 0.53 mile upstream of County Road 128, Sprague Creek, and Sucker Creek, cross sections were field surveyed within the banks and topographic data was used to extend the cross sections in the overbanks. Starting WSELS were determined utilizing normal depth. WSELs were computed through the use of the USACE, HEC computer program, HEC-RAS, version 4.0 (HEC, 2008). For the streams studied by approximate methods, cross section data was obtained from the topography. Floodplains were delineated using a proprietary model which extracted the topographic and flow data, modeled the stream using a step-backwater calculation, and then delineated the floodplain. Roads were generally modeled as weirs, or with ineffective flow areas set to the bridge opening. Channel roughness factors (Mannings “n”) used in the hydraulic computations were based on field inspection. The Manning’s “n” values for all detailed studied streams are listed in the following table:
15
Manning's "n" Values
Stream Channel “n” Overbank “n”
Bulldog Run River 0.035-0.080 0.040-0.130
East Branch Warroad River 0.035-0.080 0.040-0.130
Hay Creek 0.030-0.045 0.050-0.160
Pine Creek 0.030-0.045 0.050-0.160
Roseau River 0.035-0.130 0.035-0.130
South Branch Two Rivers 0.030 0.040-0.080
South Fork Roseau River 0.041-0.130 0.040-0.130
Sprague Creek 0.040-0.090 0.040-0.090
Sucker Creek 0.040-0.130 0.040-0.130
Warroad River 0.035-0.080 0.040-0.130
West Branch Warroad River 0.035-0.080 0.040-0.130
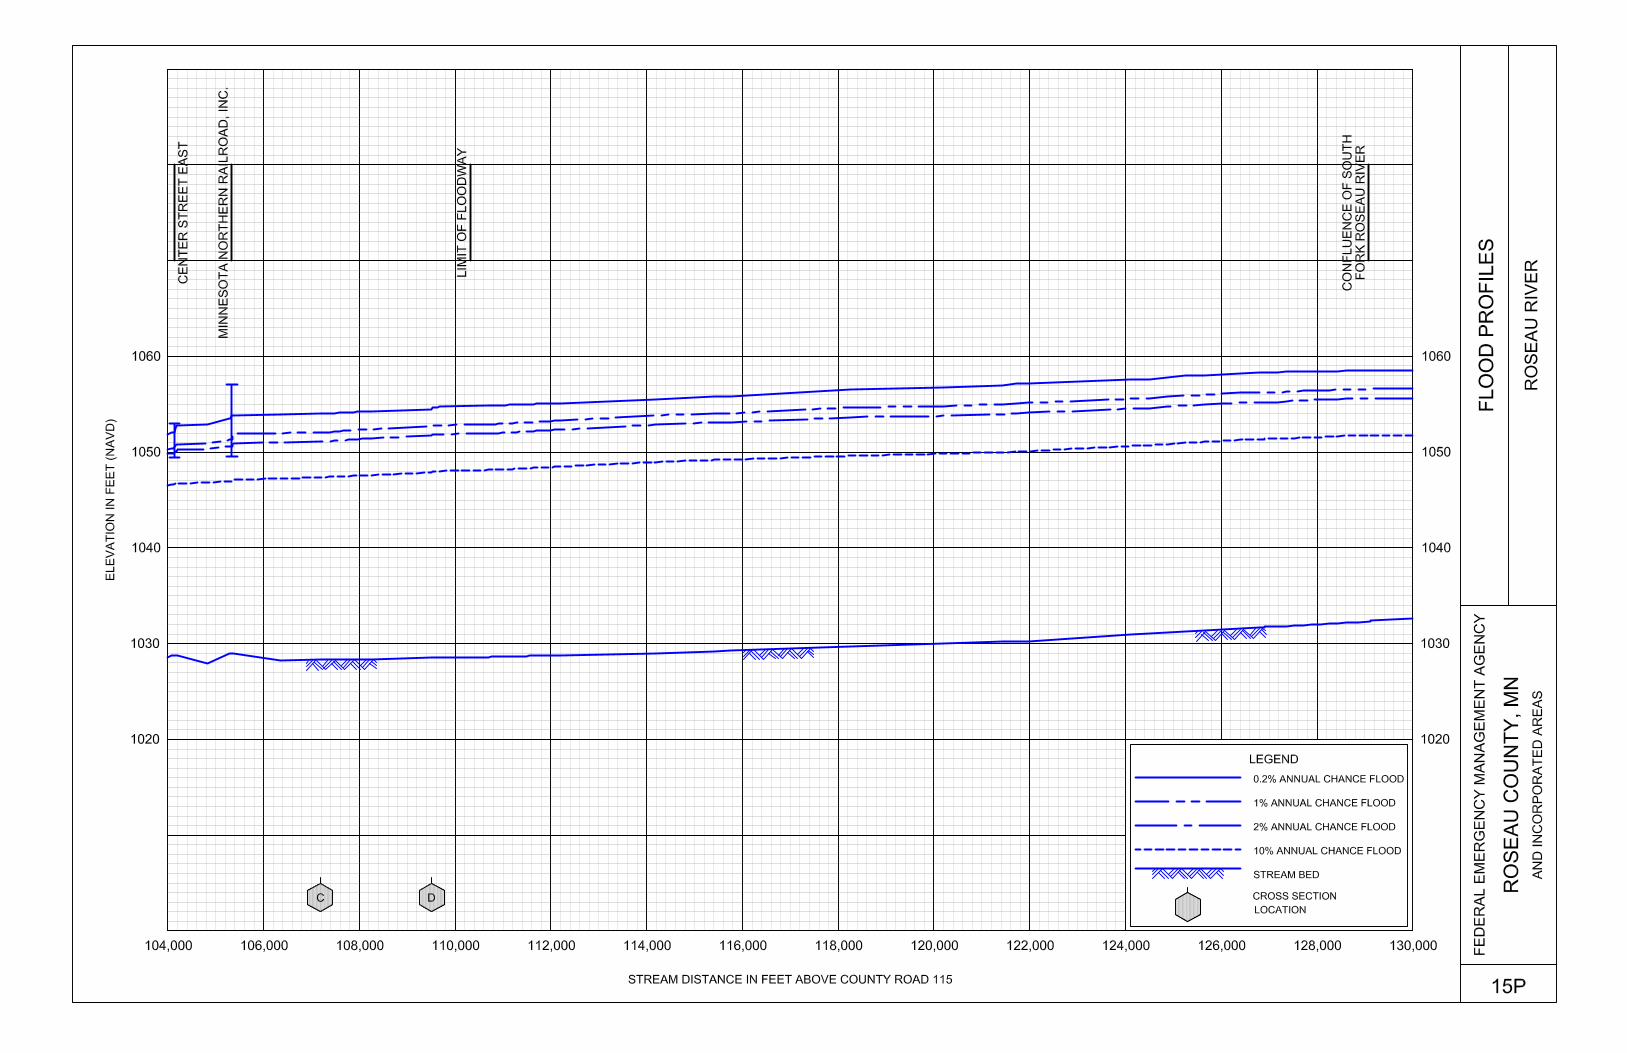
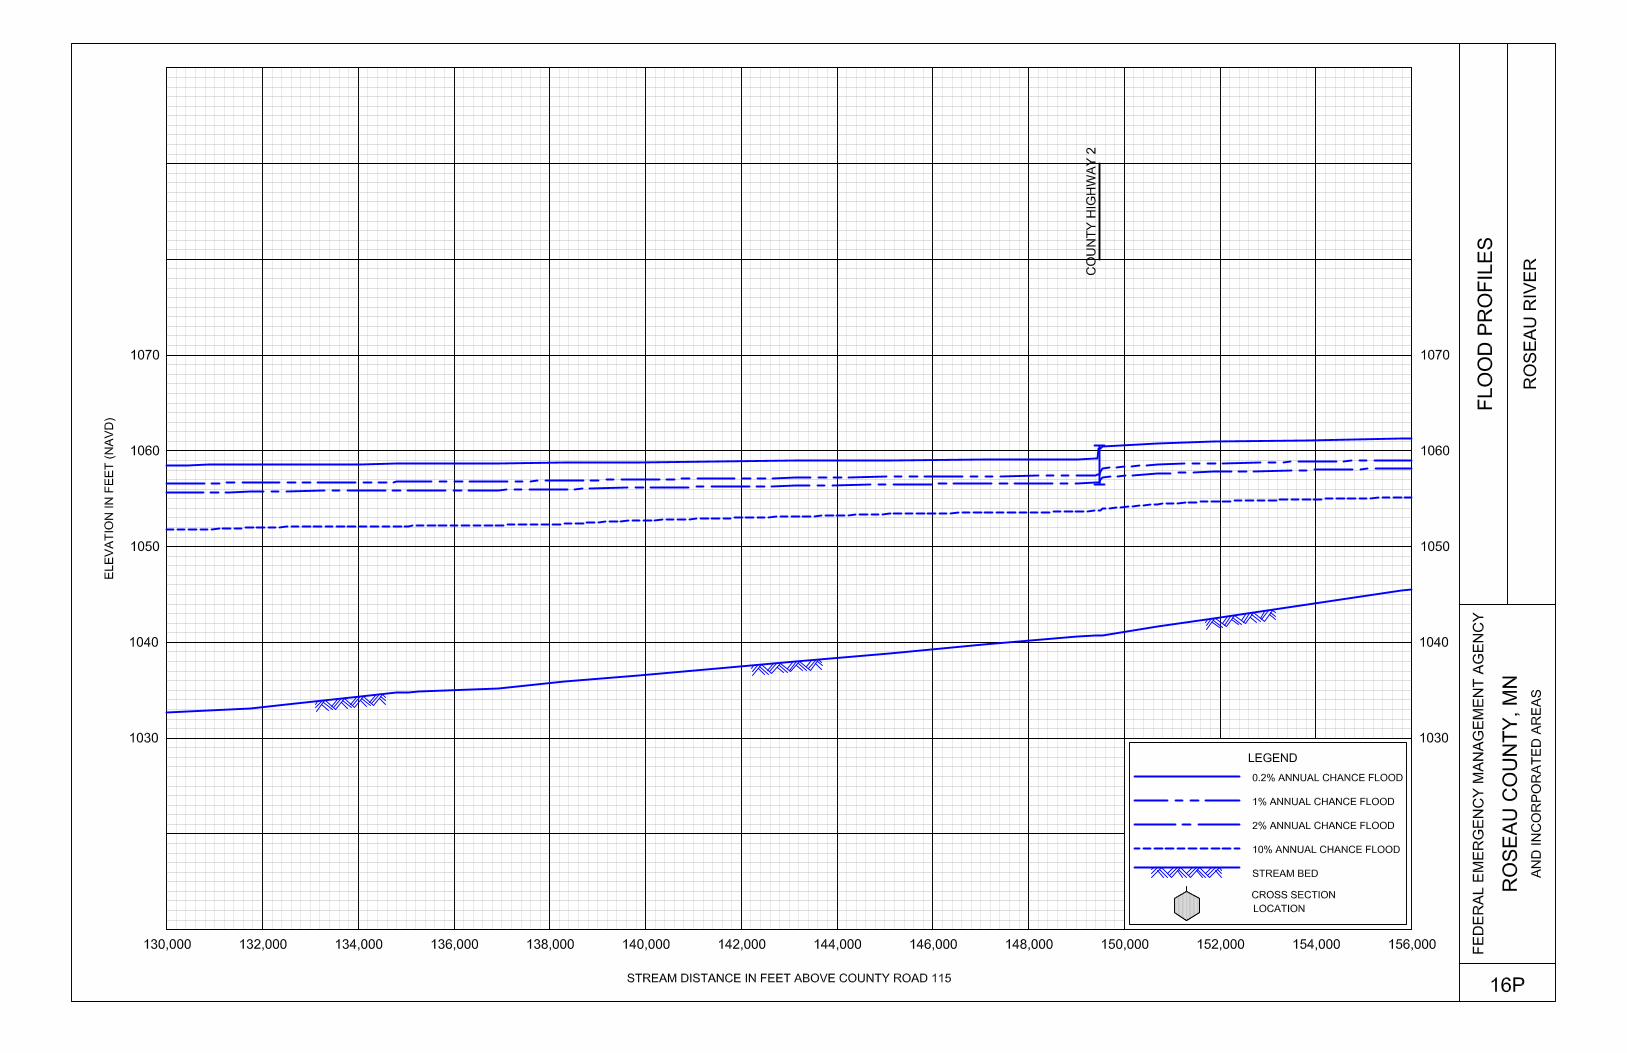
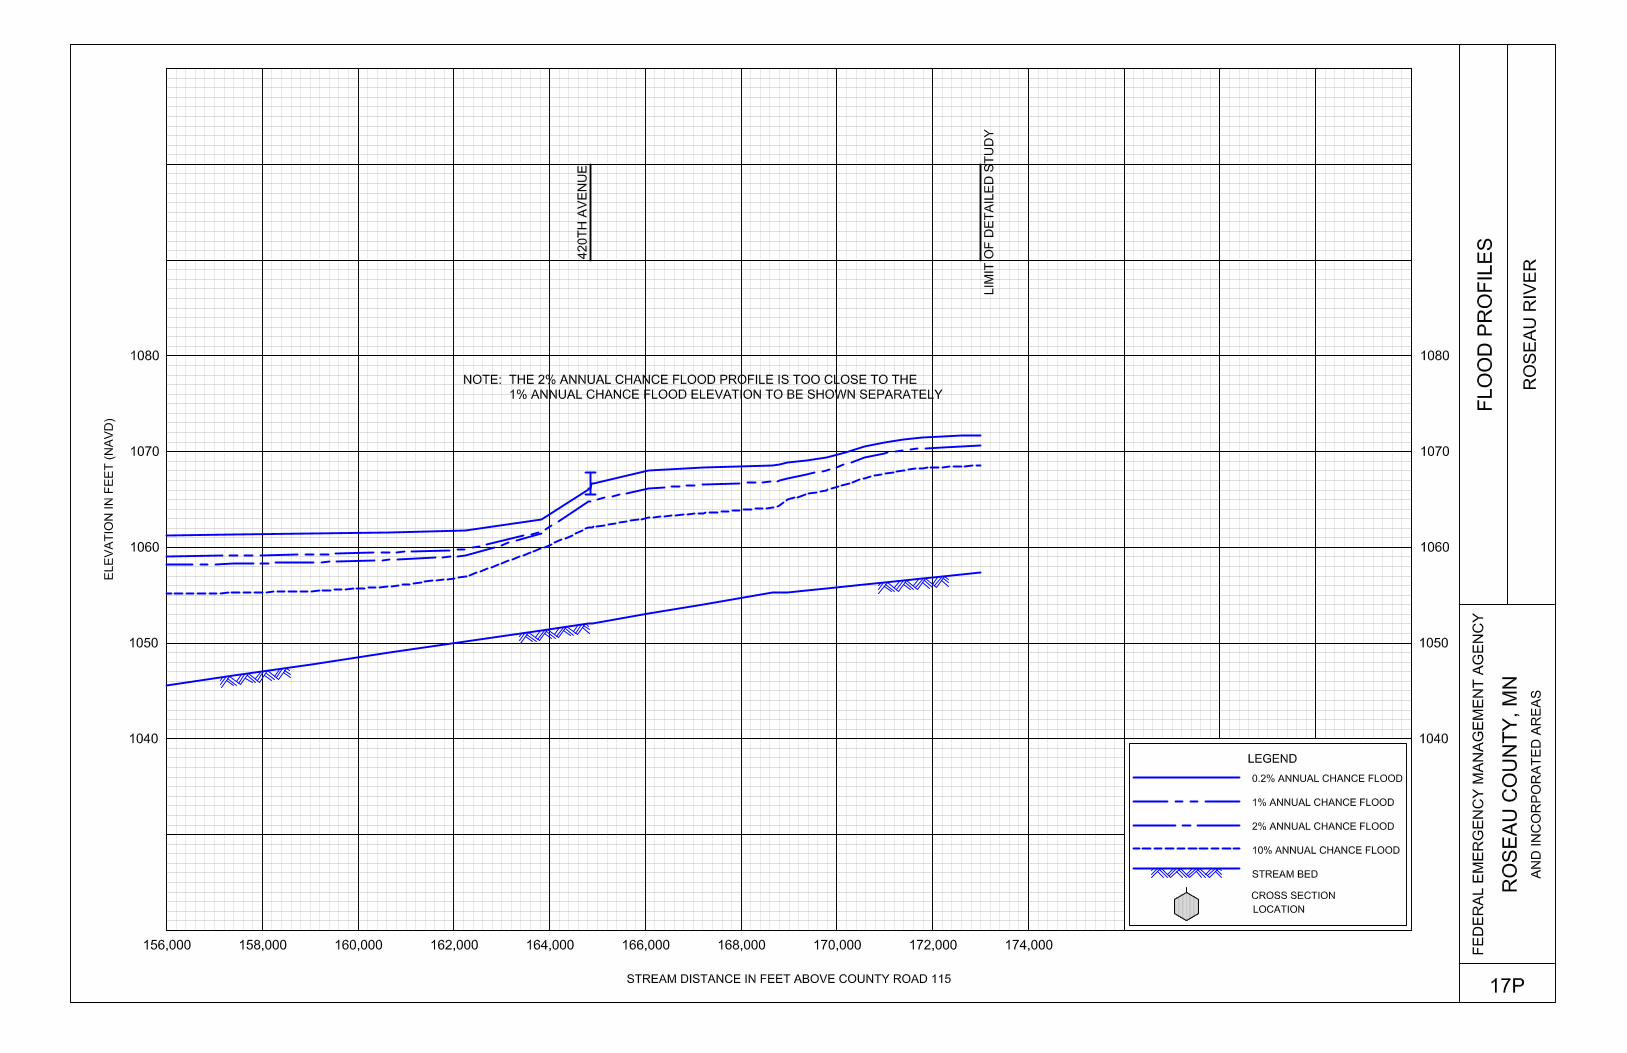
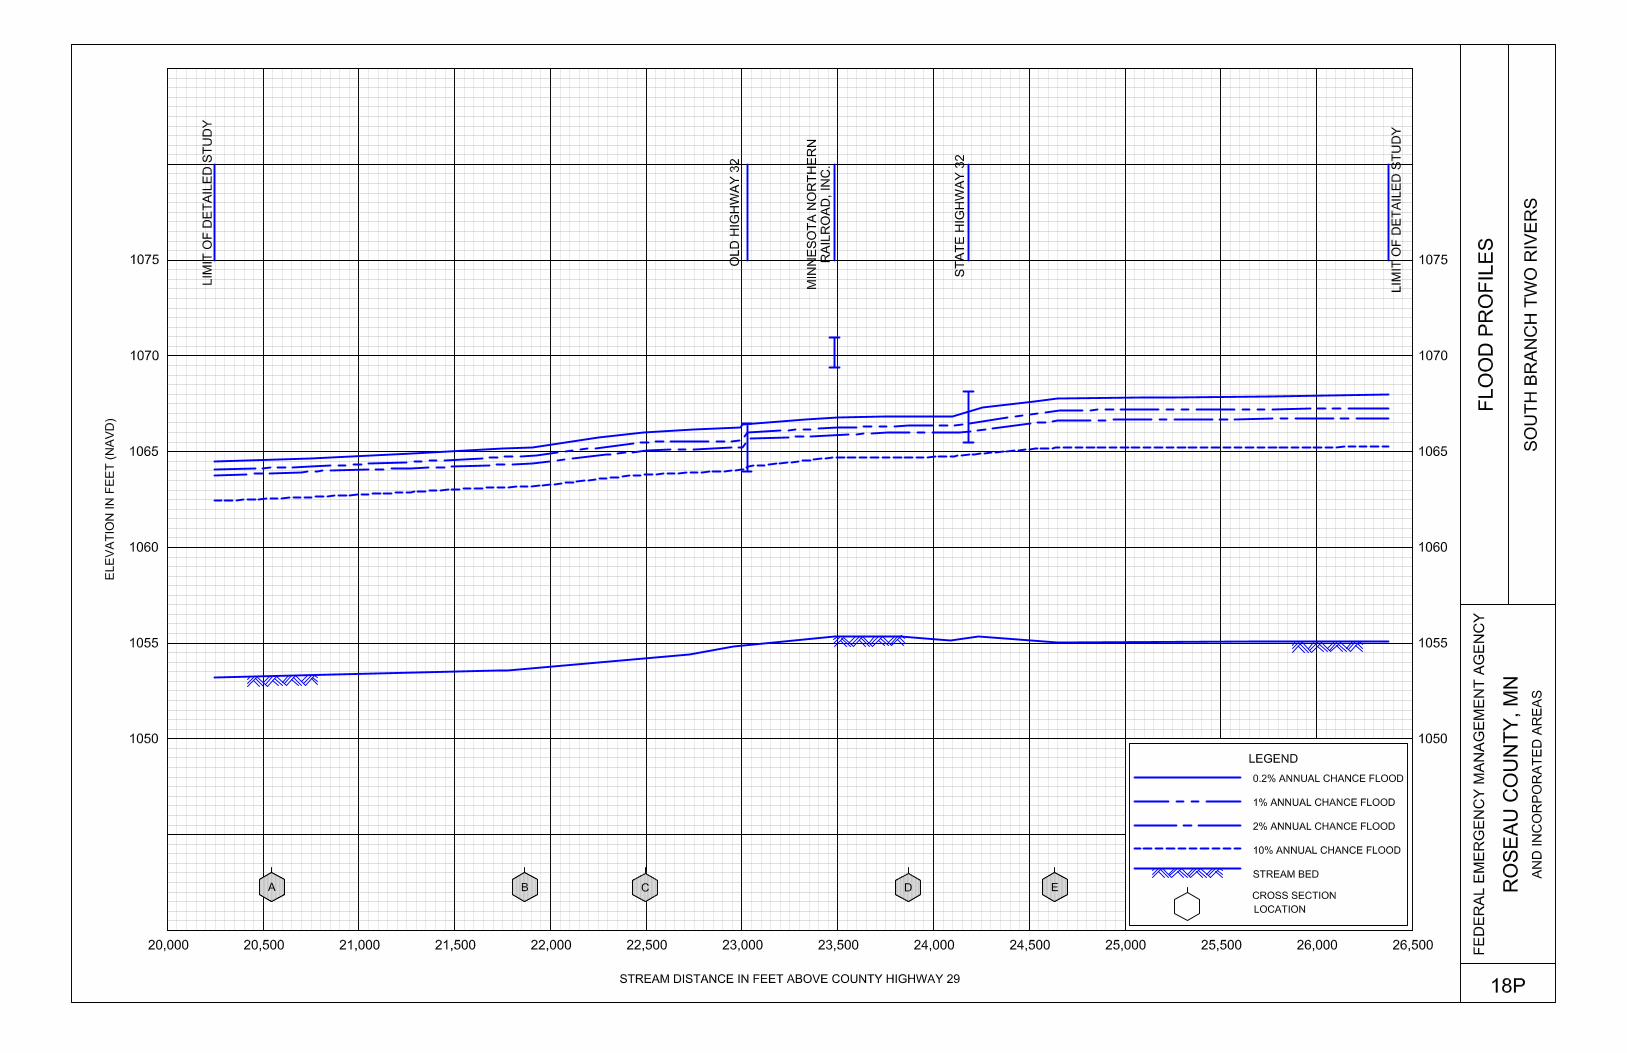
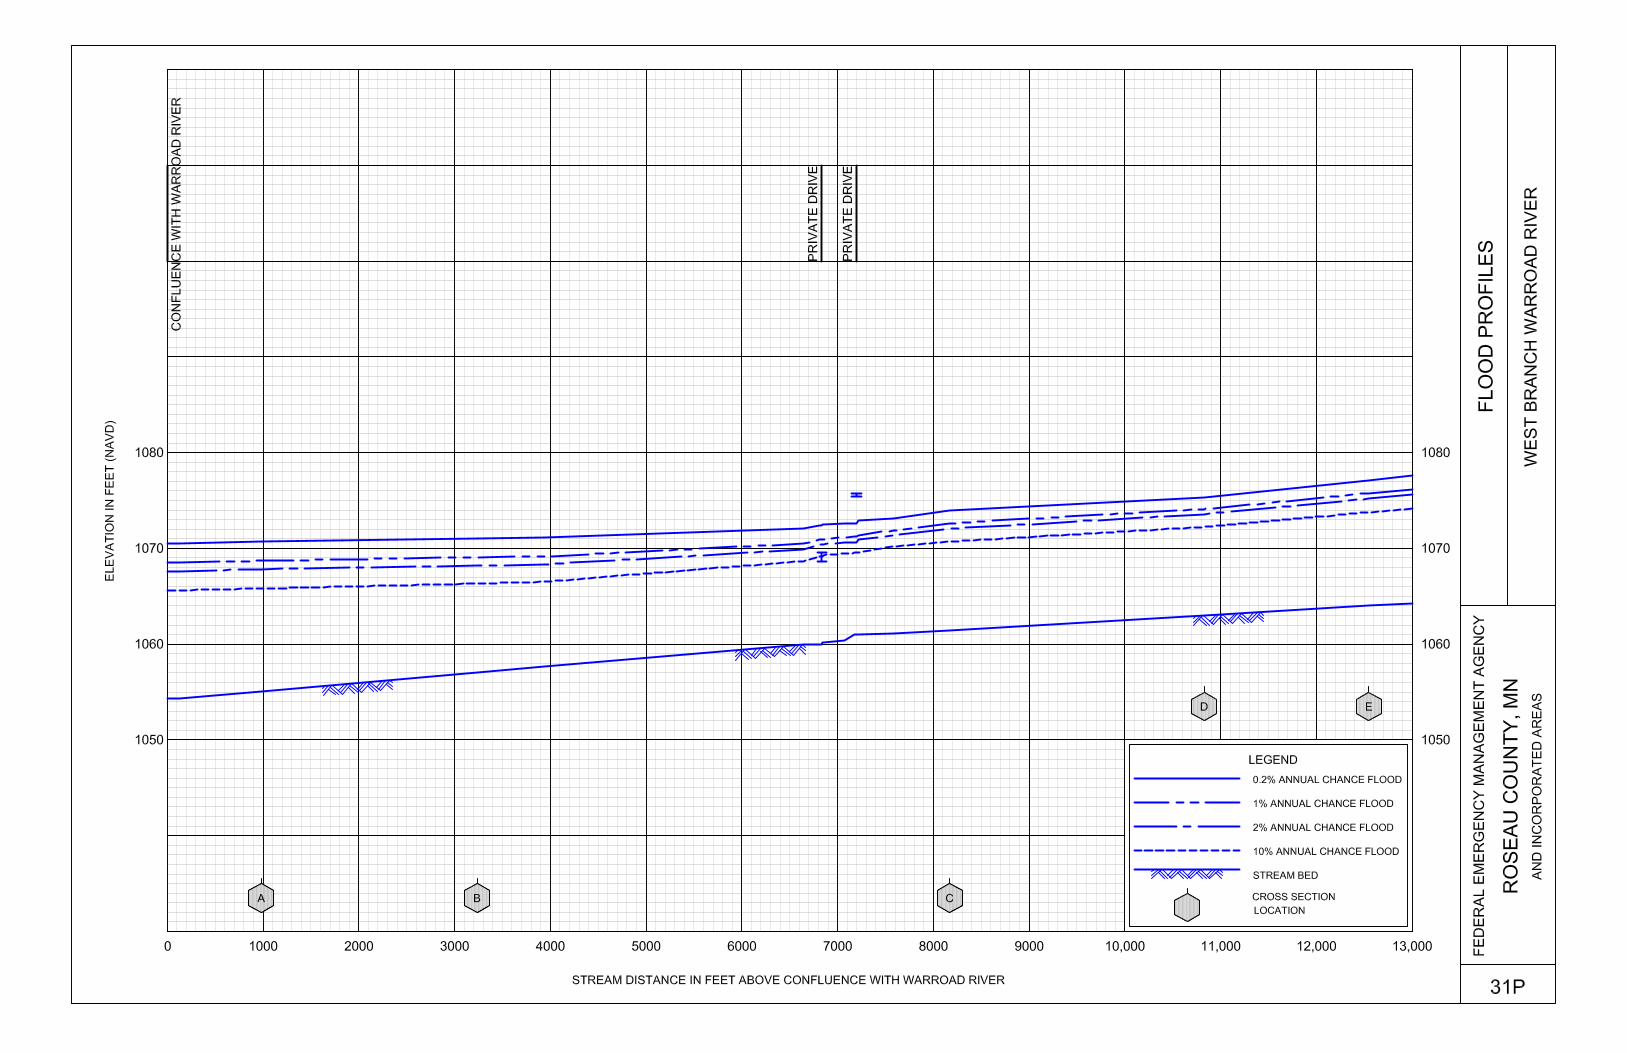
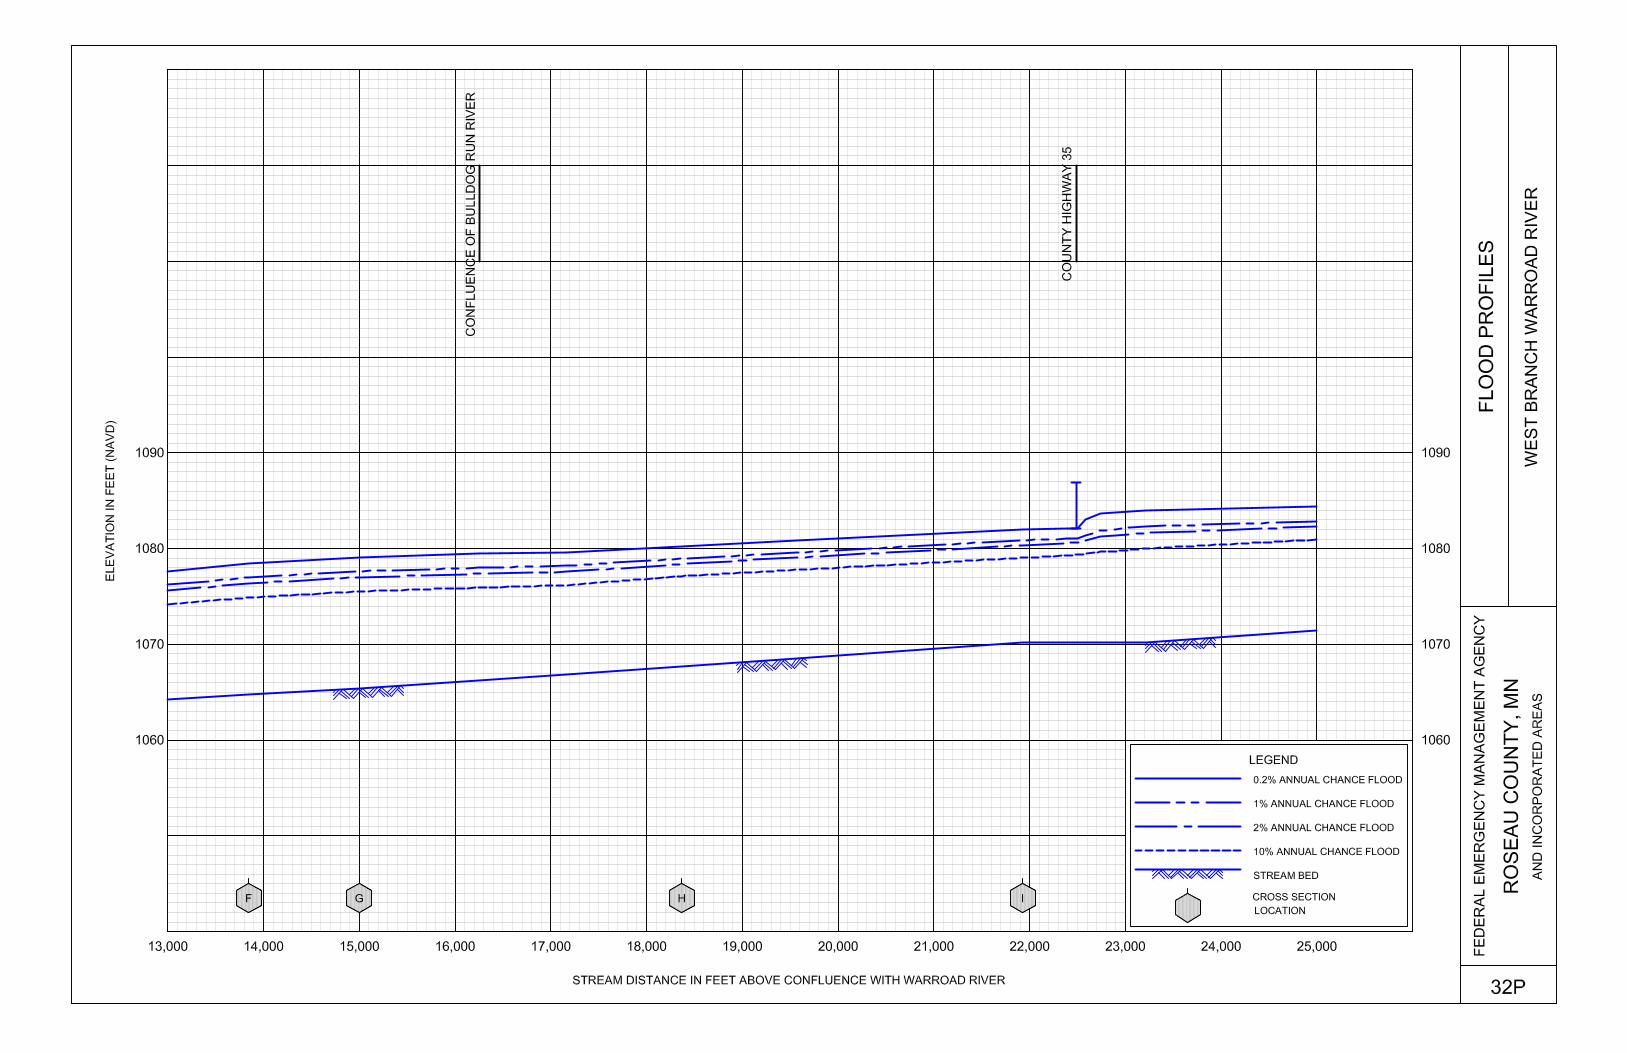
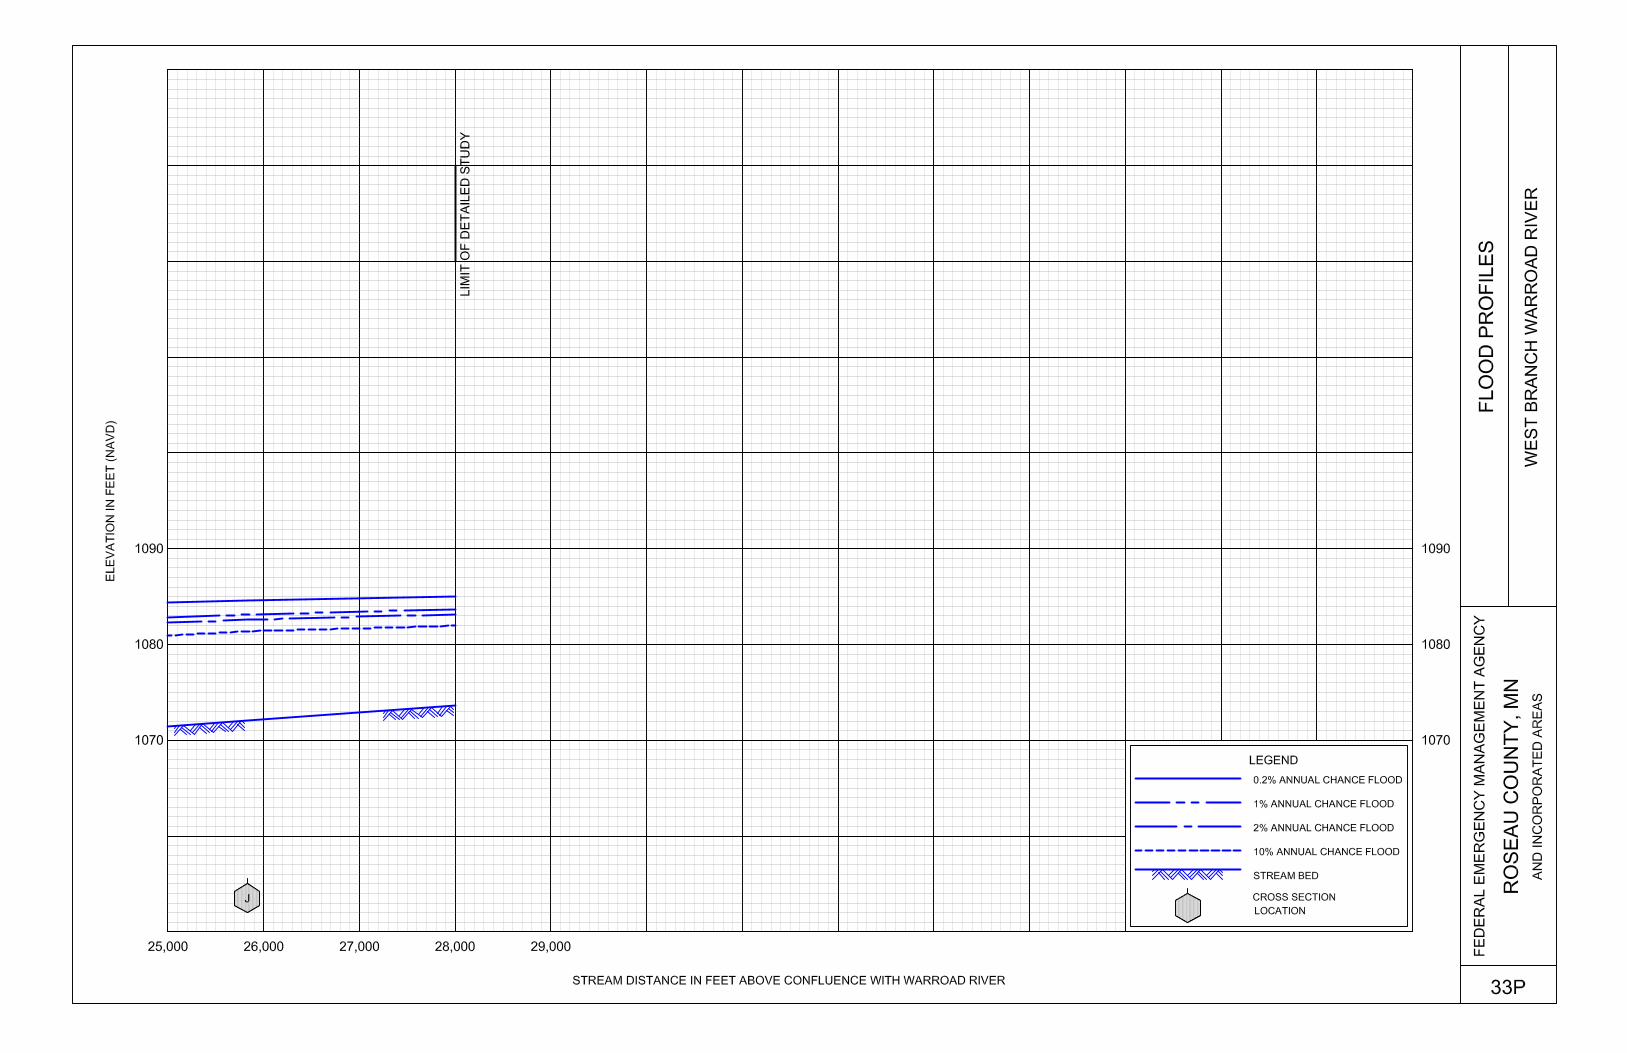
Locations of selected cross sections used in the hydraulic analyses are shown on the Flood Profiles (Exhibit 1). For stream segments for which a floodway was computed (Section 4.2), selected cross section locations are also shown on the FIRM (Exhibit 2).
The profile baselines depicted on the FIRM represent the hydraulic modeling baselines that match the flood profiles on this FIS report. As a result of improved topographic data, the profile baseline, in some cases, may deviate significantly from the channel centerline or appear outside the Special Flood Hazard Area. The hydraulic analyses for this study were based on unobstructed flow. The flood elevations shown on the Flood Profiles (Exhibit 1) are thus considered valid only if hydraulic structures remain unobstructed, operate properly, and do not fail.
3.3 Vertical Datum
All FIS reports and FIRMs are referenced to a specific vertical datum. The vertical datum provides a starting point against which flood, ground, and structure elevations can be referenced and compared. Until recently, the standard vertical datum in use for newly created or revised FIS reports and FIRMs was NGVD. With the finalization of NAVD, many FIS reports and FIRMs are being prepared using NAVD as the referenced vertical datum. All flood elevations shown in this FIS report and on the FIRM are referenced to NAVD. Structure and ground elevations in the community must, therefore, be referenced to NAVD. It is important to note that adjacent communities may be referenced to NGVD. This may result in differences in Base Flood Elevations (BFEs) across the corporate limits between the communities. Some of the data used in this study were taken from the prior effective FIS reports and adjusted to NAVD. The average conversion factor that was used to convert the data in this FIS report to NAVD was calculated using the National Geodetic Survey’s (NGS)
16
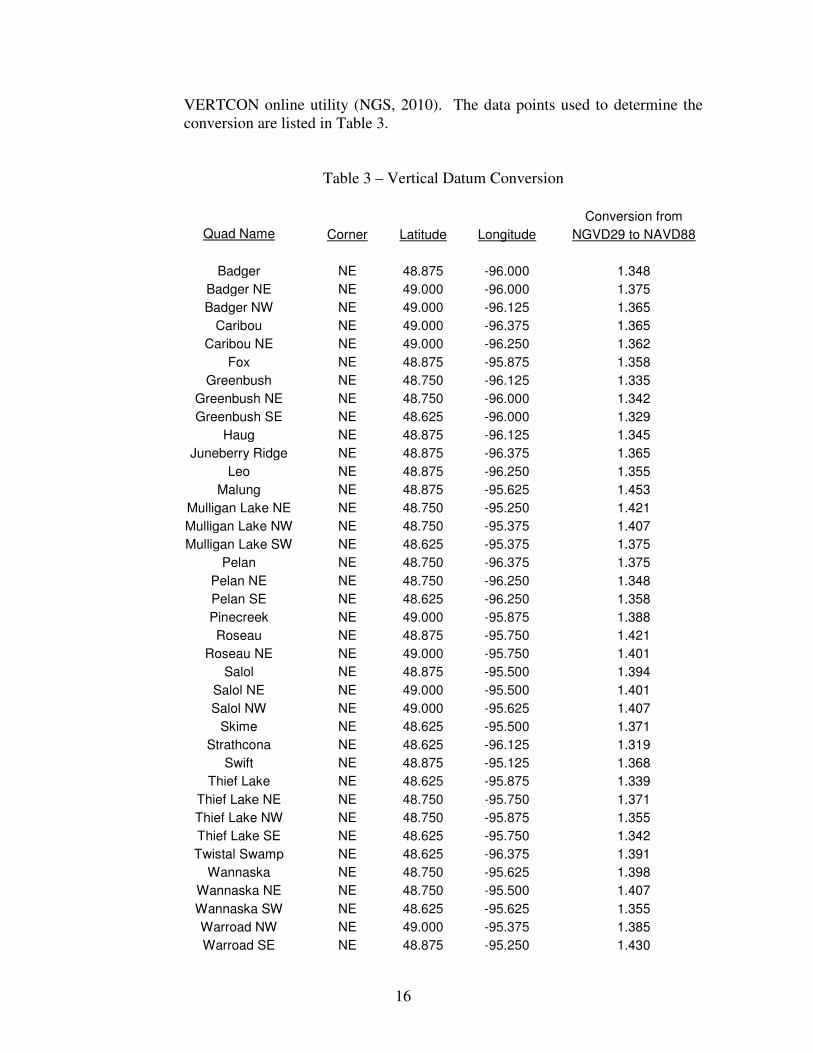
VERTCON online utility (NGS, 2010). The data points used to determine the conversion are listed in Table 3.
Table 3 – Vertical Datum Conversion
Conversion from
Quad Name Corner Latitude Longitude NGVD29 to NAVD88
Badger NE 48.875 -96.000 1.348
Badger NE NE 49.000 -96.000 1.375
Badger NW NE 49.000 -96.125 1.365
Caribou NE 49.000 -96.375 1.365
Caribou NE NE 49.000 -96.250 1.362
Fox NE 48.875 -95.875 1.358
Greenbush NE 48.750 -96.125 1.335
Greenbush NE NE 48.750 -96.000 1.342
Greenbush SE NE 48.625 -96.000 1.329
Haug NE 48.875 -96.125 1.345
Juneberry Ridge NE 48.875 -96.375 1.365
Leo NE 48.875 -96.250 1.355
Malung NE 48.875 -95.625 1.453
Mulligan Lake NE NE 48.750 -95.250 1.421
Mulligan Lake NW NE 48.750 -95.375 1.407
Mulligan Lake SW NE 48.625 -95.375 1.375
Pelan NE 48.750 -96.375 1.375
Pelan NE NE 48.750 -96.250 1.348
Pelan SE NE 48.625 -96.250 1.358
Pinecreek NE 49.000 -95.875 1.388
Roseau NE 48.875 -95.750 1.421
Roseau NE NE 49.000 -95.750 1.401
Salol NE 48.875 -95.500 1.394
Salol NE NE 49.000 -95.500 1.401
Salol NW NE 49.000 -95.625 1.407
Skime NE 48.625 -95.500 1.371
Strathcona NE 48.625 -96.125 1.319
Swift NE 48.875 -95.125 1.368
Thief Lake NE 48.625 -95.875 1.339
Thief Lake NE NE 48.750 -95.750 1.371
Thief Lake NW NE 48.750 -95.875 1.355
Thief Lake SE NE 48.625 -95.750 1.342
Twistal Swamp NE 48.625 -96.375 1.391
Wannaska NE 48.750 -95.625 1.398
Wannaska NE NE 48.750 -95.500 1.407
Wannaska SW NE 48.625 -95.625 1.355
Warroad NW NE 49.000 -95.375 1.385
Warroad SE NE 48.875 -95.250 1.430
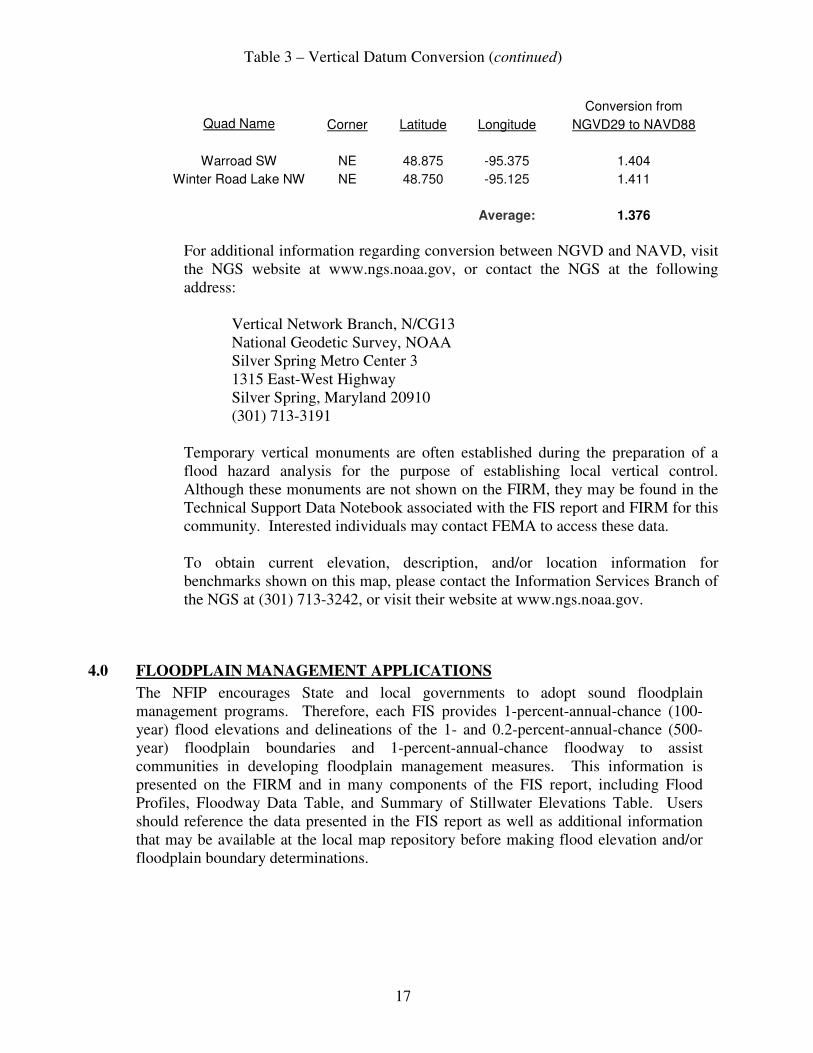
Table 3 – Vertical Datum Conversion (continued)
17
Conversion from
Quad Name Corner Latitude Longitude NGVD29 to NAVD88
Warroad SW NE 48.875 -95.375 1.404
Winter Road Lake NW NE 48.750 -95.125 1.411
Average: 1.376
For additional information regarding conversion between NGVD and NAVD, visit the NGS website at www.ngs.noaa.gov, or contact the NGS at the following address:
Vertical Network Branch, N/CG13 National Geodetic Survey, NOAA Silver Spring Metro Center 3 1315 East-West Highway Silver Spring, Maryland 20910 (301) 713-3191
Temporary vertical monuments are often established during the preparation of a flood hazard analysis for the purpose of establishing local vertical control. Although these monuments are not shown on the FIRM, they may be found in the Technical Support Data Notebook associated with the FIS report and FIRM for this community. Interested individuals may contact FEMA to access these data. To obtain current elevation, description, and/or location information for benchmarks shown on this map, please contact the Information Services Branch of the NGS at (301) 713-3242, or visit their website at www.ngs.noaa.gov.
4.0 FLOODPLAIN MANAGEMENT APPLICATIONS
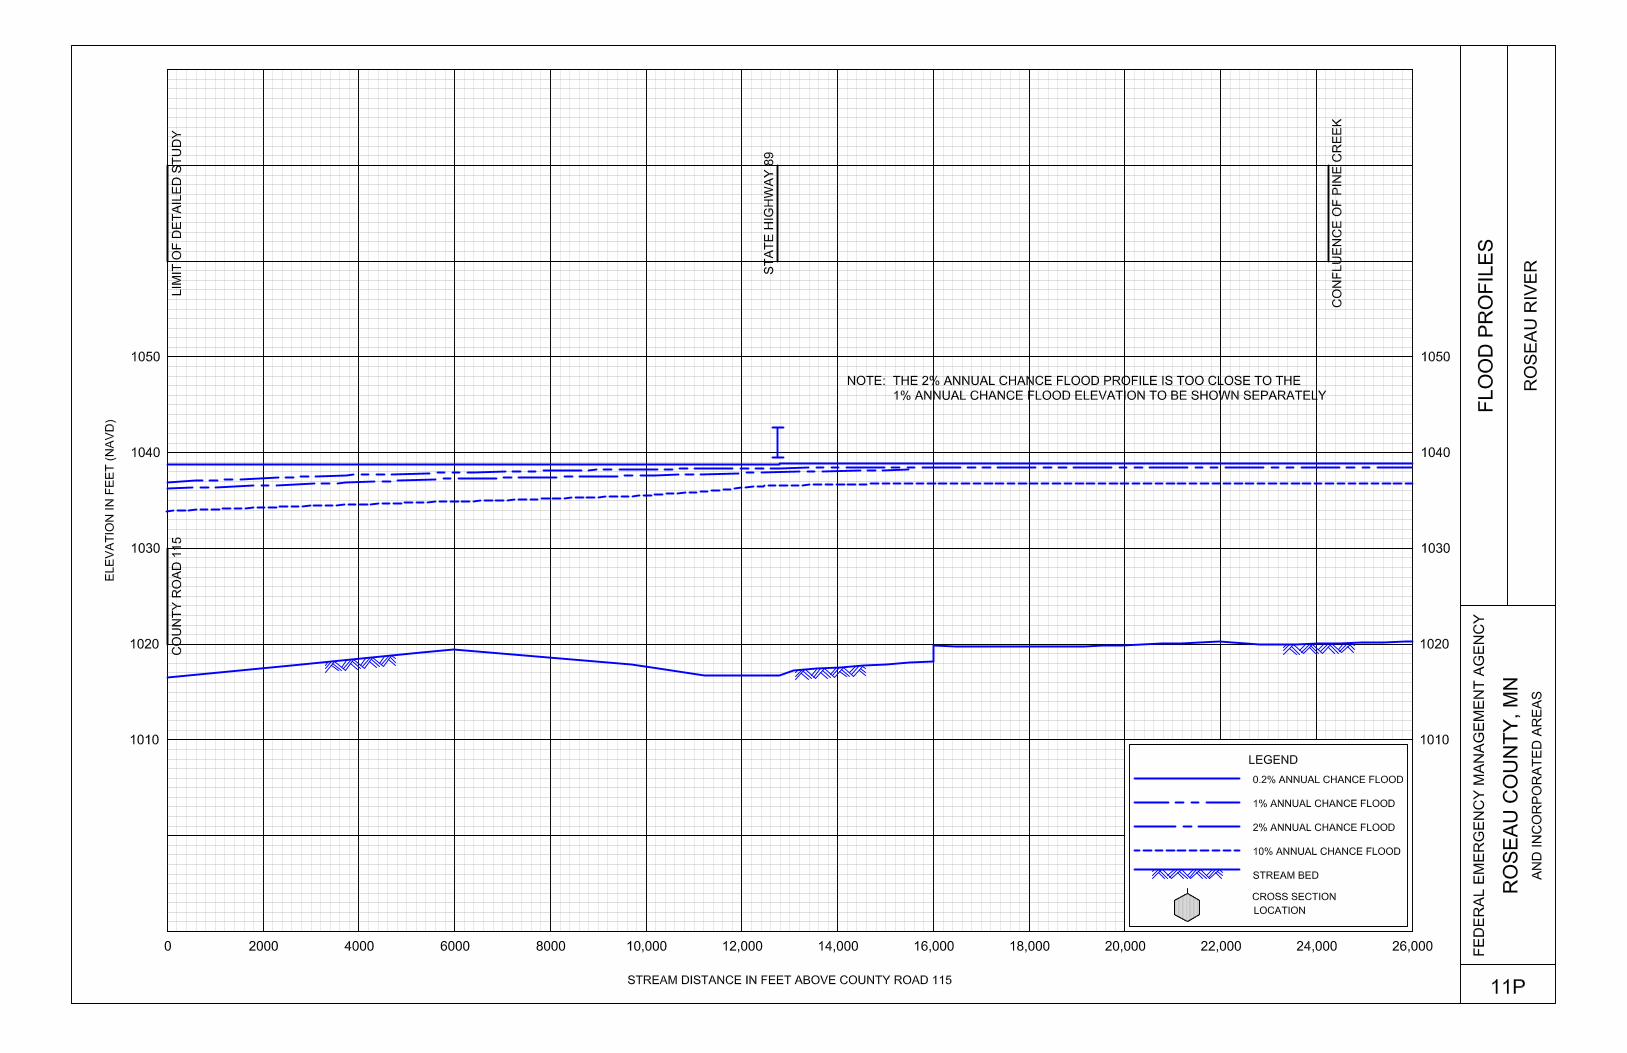
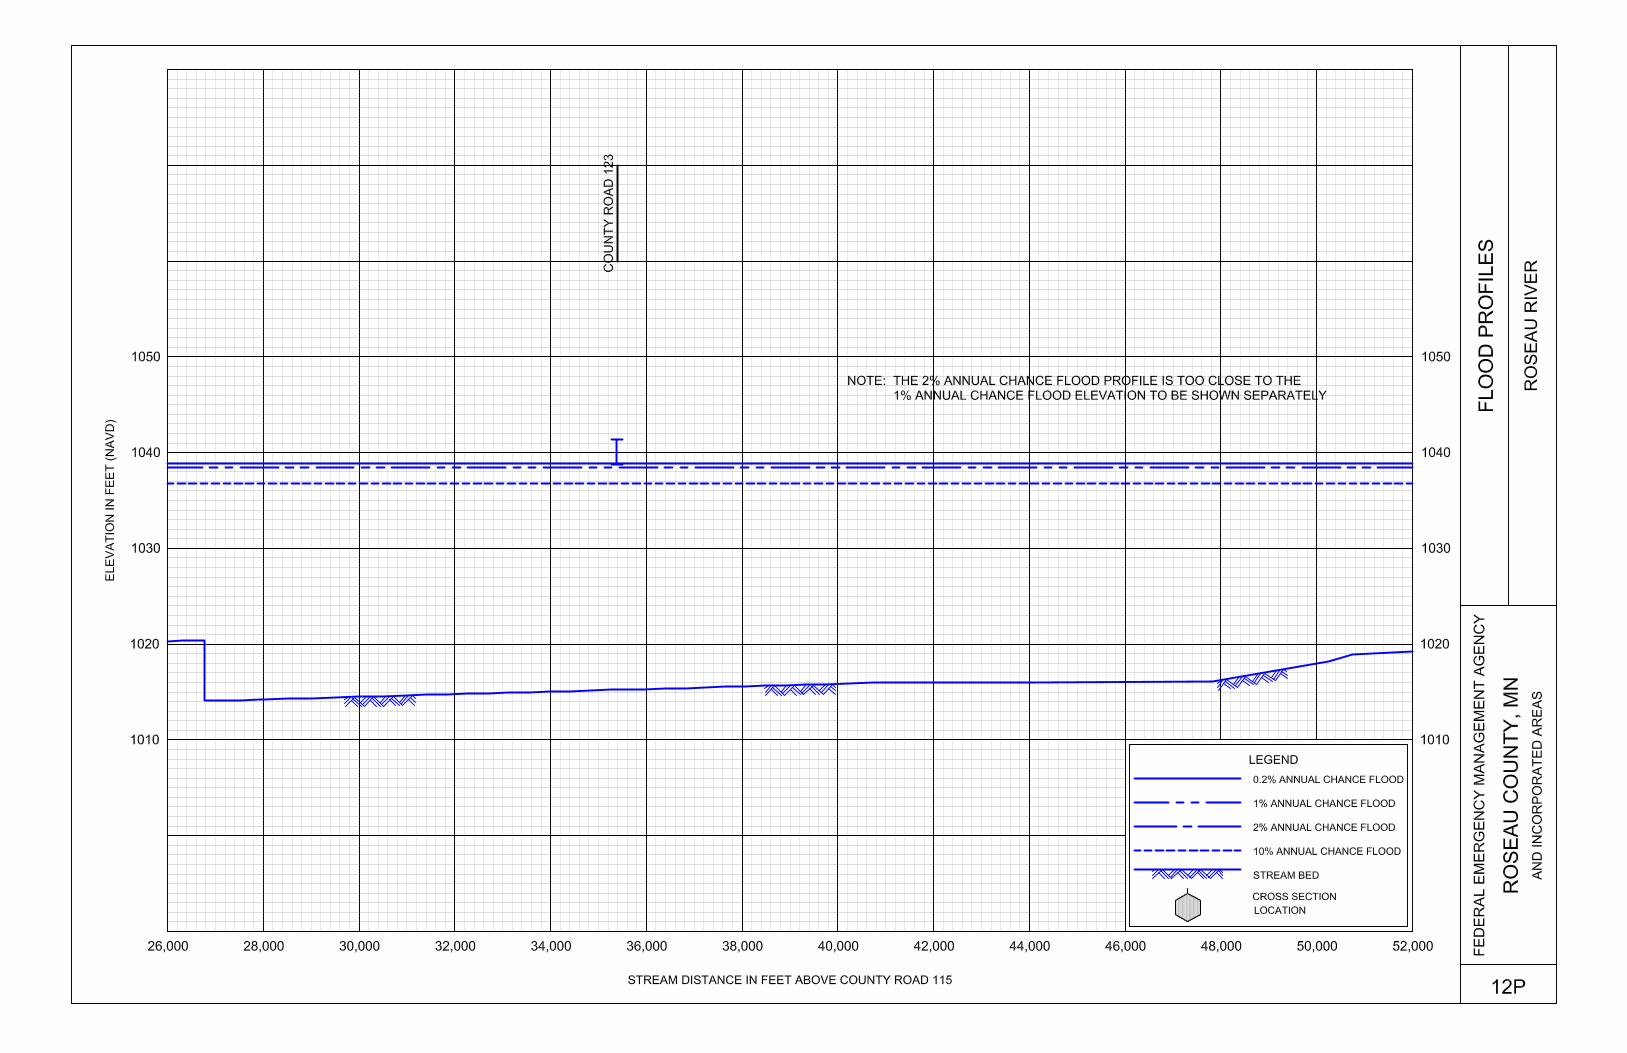
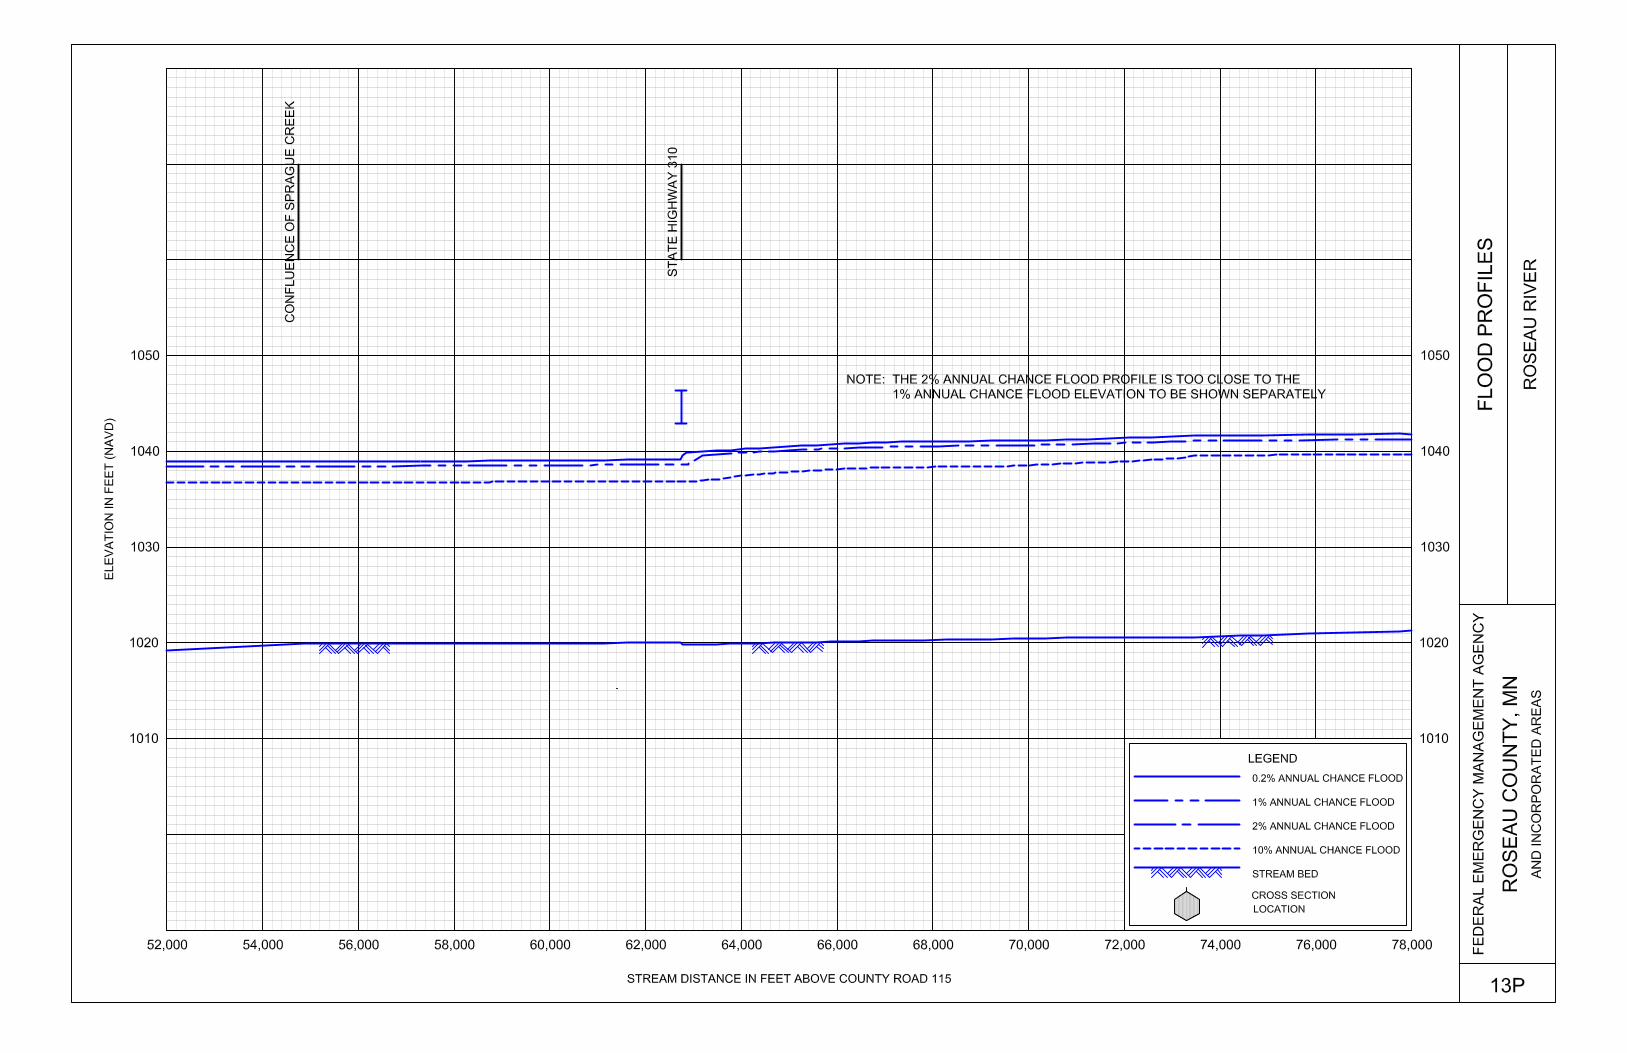
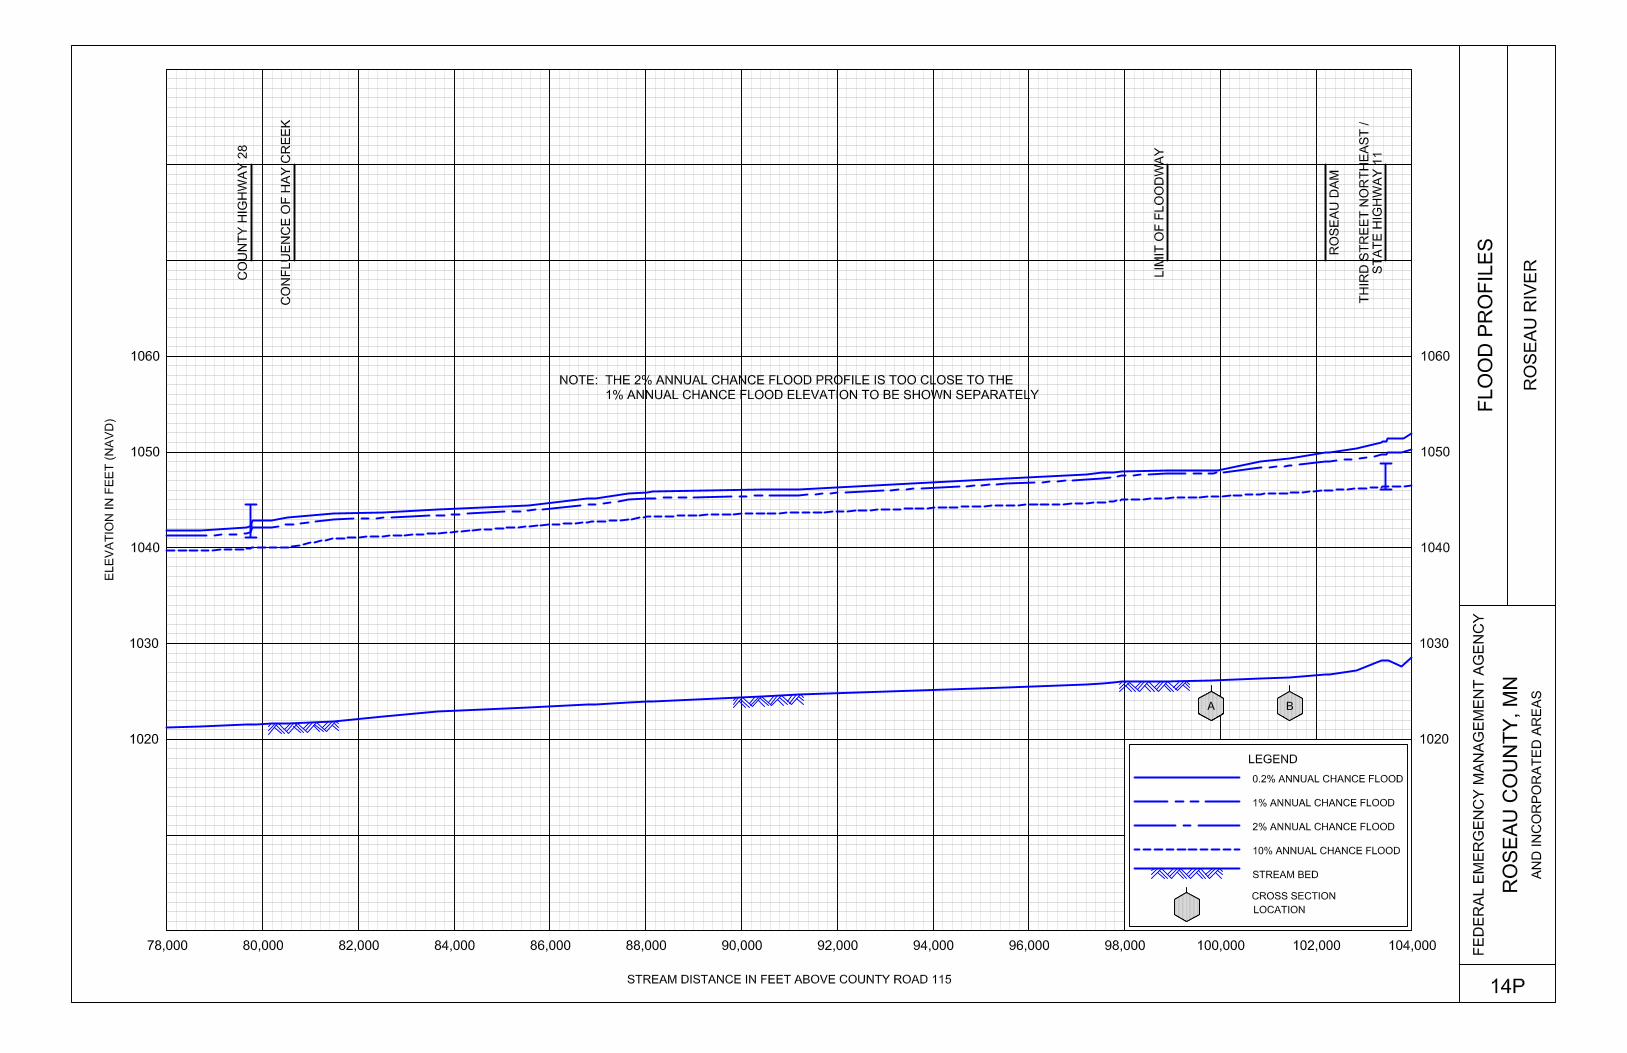
The NFIP encourages State and local governments to adopt sound floodplain management programs. Therefore, each FIS provides 1-percent-annual-chance (100-year) flood elevations and delineations of the 1- and 0.2-percent-annual-chance (500-year) floodplain boundaries and 1-percent-annual-chance floodway to assist communities in developing floodplain management measures. This information is presented on the FIRM and in many components of the FIS report, including Flood Profiles, Floodway Data Table, and Summary of Stillwater Elevations Table. Users should reference the data presented in the FIS report as well as additional information that may be available at the local map repository before making flood elevation and/or floodplain boundary determinations.
18
4.1 Floodplain Boundaries
To provide a national standard without regional discrimination, the 1-percent-annual-chance flood has been adopted by FEMA as the base flood for floodplain management purposes. The 0.2-percent-annual-chance flood is employed to indicate additional areas of flood risk in the community. For Bulldog Run River, East Branch Warroad River, Hay Creek, the portion of the Roseau River upstream of State Highway 89, the portion of the South Fork Roseau River downstream of County Road 128, Sprague Creek, Sucker Creek, Warroad River, and West Branch Warroad River, the 1- and 0.2-percent-annual-chance floodplain boundaries have been delineated using the flood elevations determined at each cross section. Between cross sections, the boundaries were interpolated using 2-foot contours derived from Light Detection and Ranging (LiDAR) data (3DI Technologies, Inc. and Ulteig Engineers, Inc., 2003).
For Pine Creek, the portion of the Roseau River downstream of State Highway 89, South Branch Two Rivers, and the portion of the South Fork Roseau River upstream of County Road 128, the 1- and 0.2-percent-annual-chance floodplain boundaries have been delineated using the flood elevations determined at each cross section. Between cross sections, the boundaries were interpolated using topographic maps photo-enlarged to a scale of 1:12,000, with a contour interval of five feet (USGS, various dates). Approximate floodplains were delineated utilizing the LiDAR data where available and otherwise reverting to the USGS data (3DI Technologies, Inc. and Ulteig Engineers, Inc., 2003; USGS, various dates). The 1- and 0.2-percent-annual-chance floodplain boundaries are shown on the FIRM (Exhibit 2). On this map, the 1-percent-annual-chance floodplain boundary corresponds to the boundary of the areas of special flood hazards (Zones A and AE), and the 0.2-percent-annual-chance floodplain boundary corresponds to the boundary of areas of moderate flood hazards. In cases where the 1- and 0.2-percent-annual-chance floodplain boundaries are close together, only the 1-percent-annual-chance floodplain boundary has been shown. Small areas within the floodplain boundaries may lie above the flood elevations but cannot be shown due to limitations of the map scale and/or lack of detailed topographic data. For the streams studied by approximate methods, only the 1-percent-annual-chance floodplain boundary is shown on the FIRM (Exhibit 2).
19
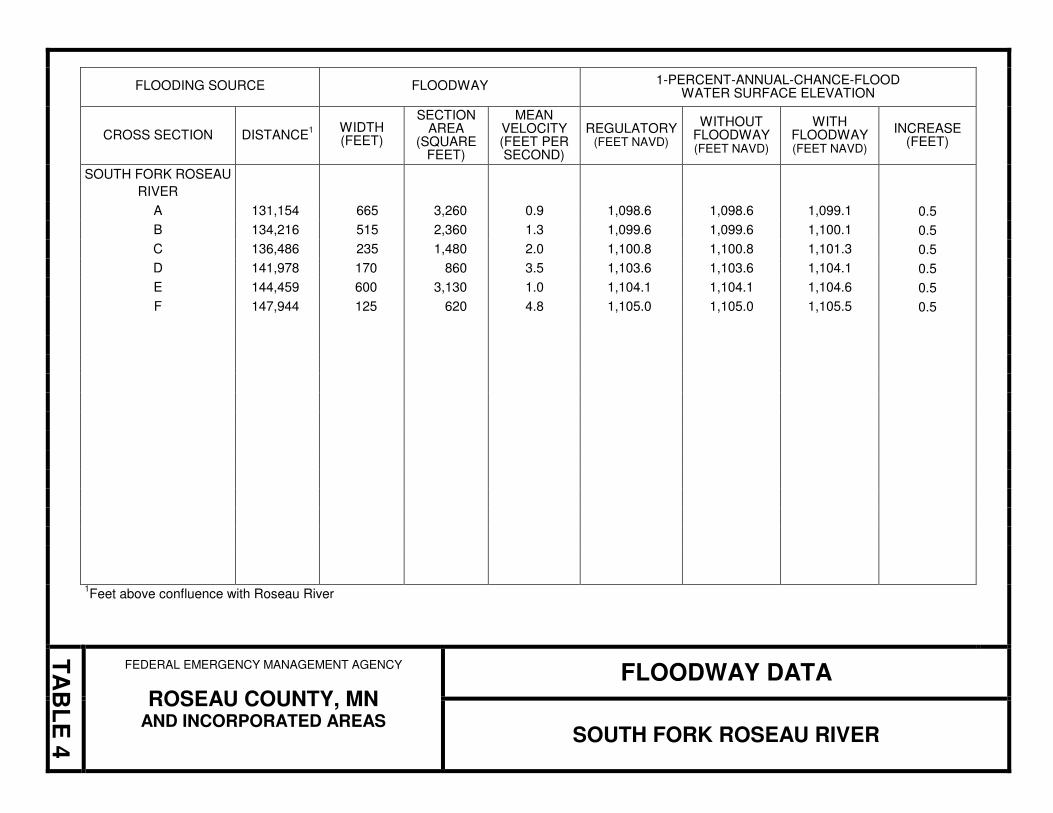
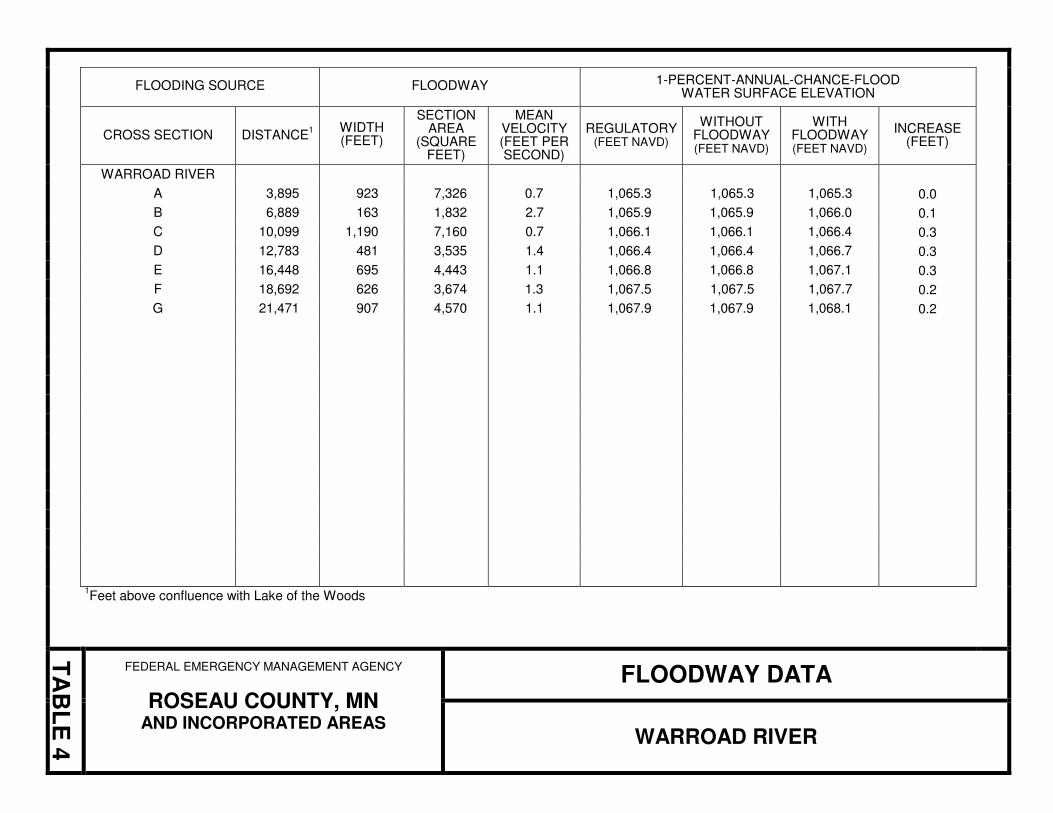
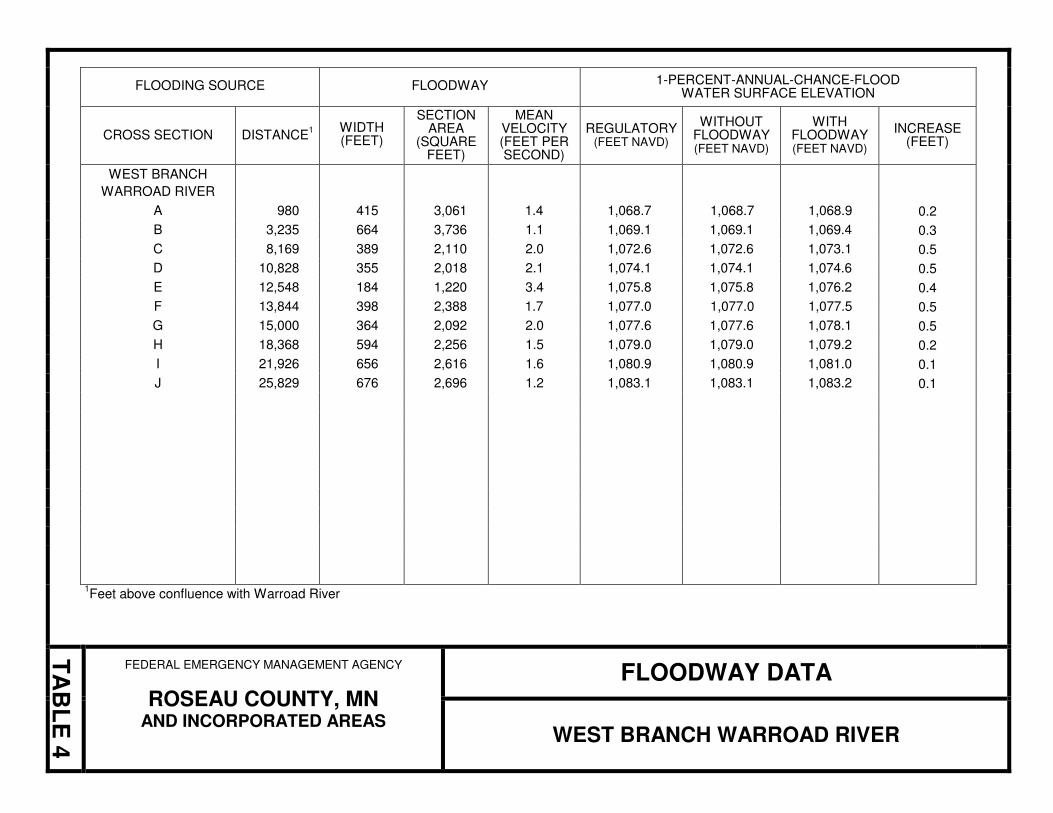
4.2 Floodways
Encroachment on floodplains, such as structures and fill, reduces flood-carrying
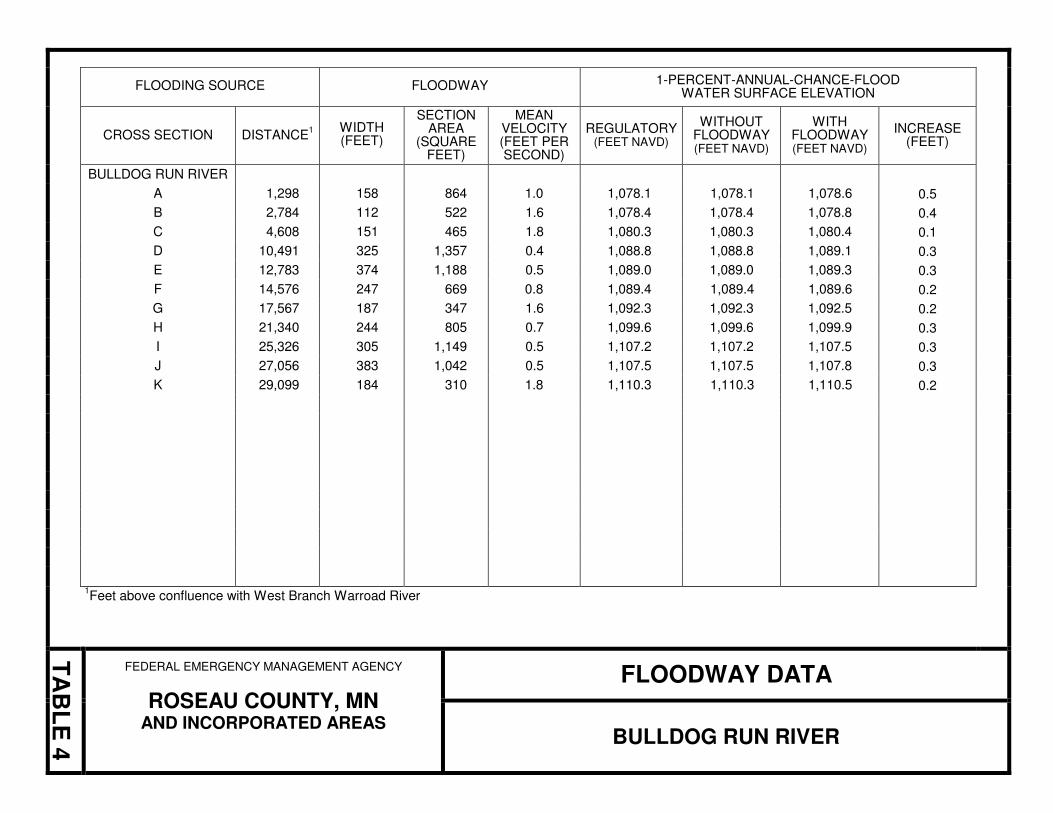
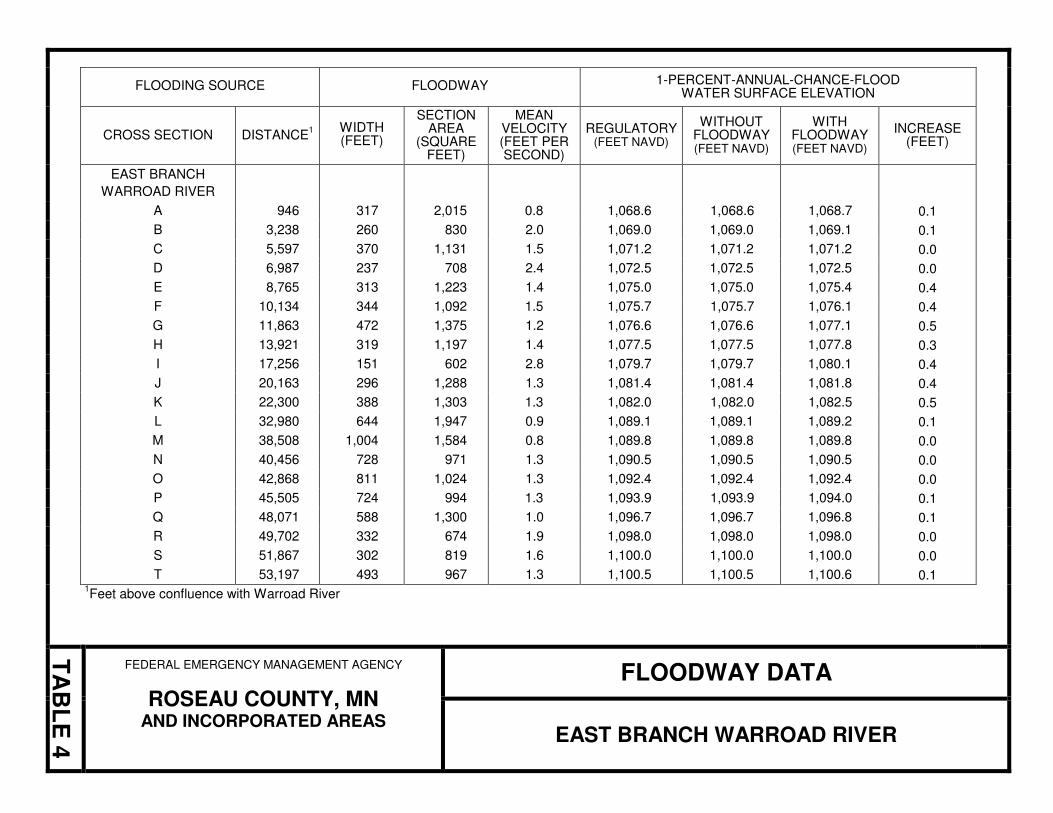
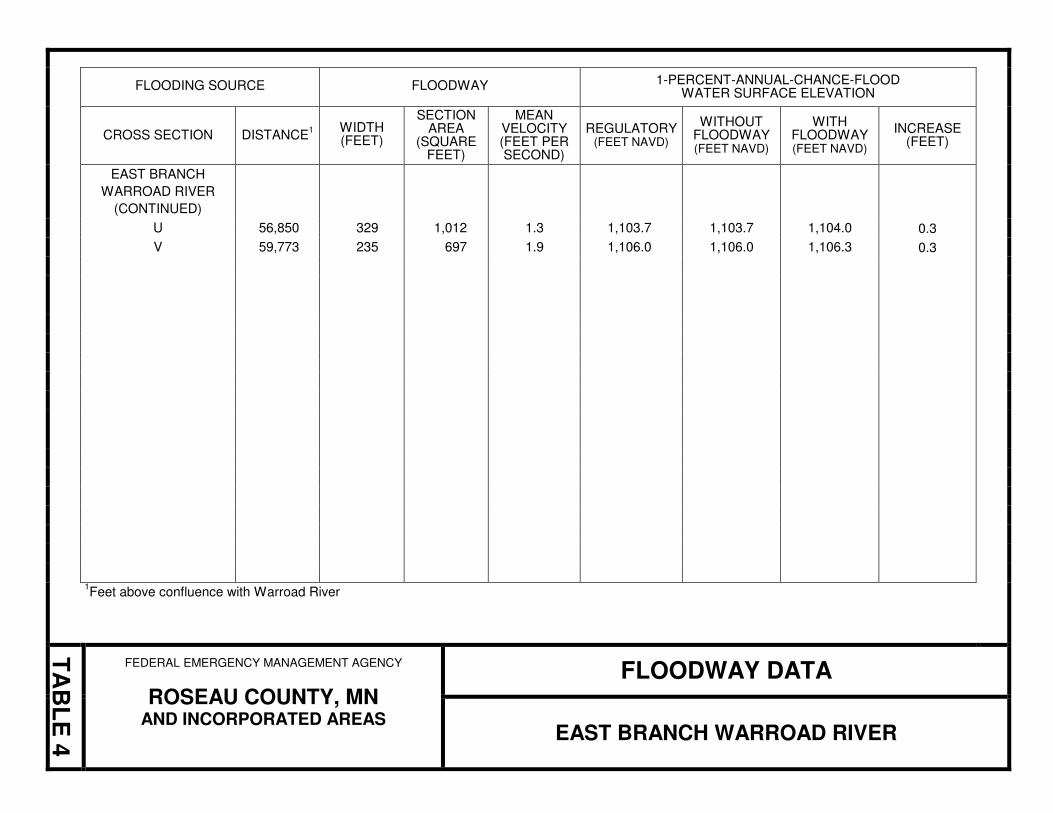
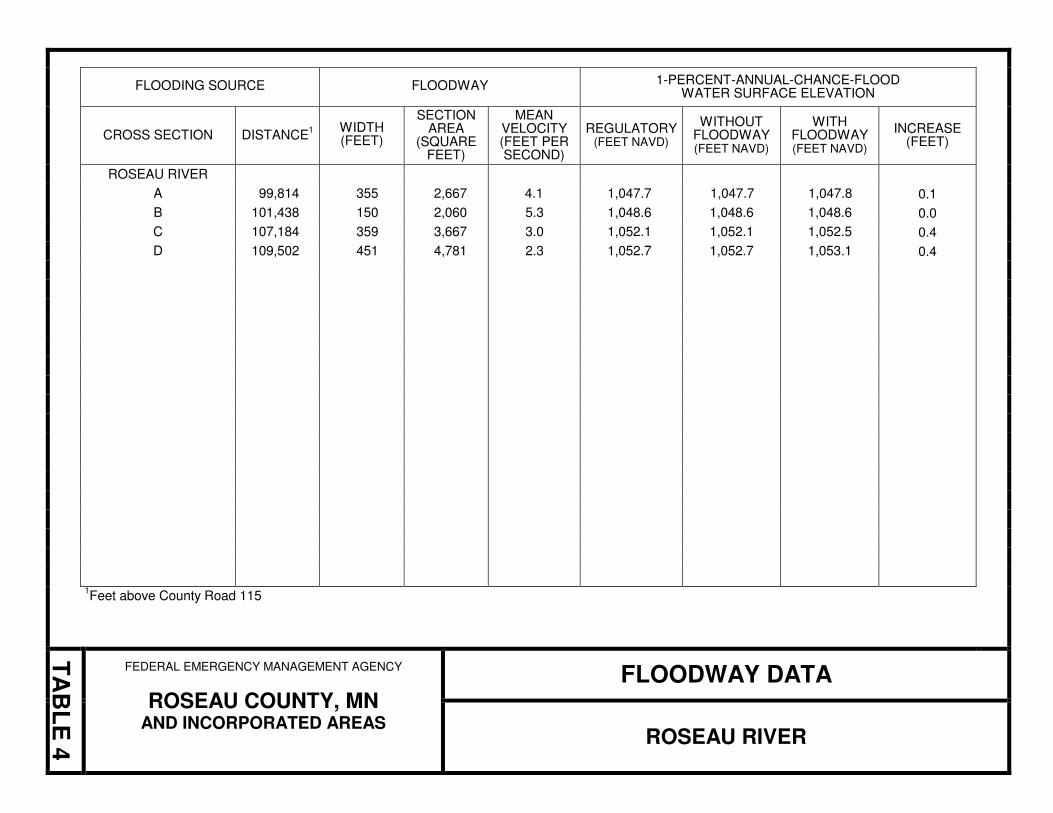
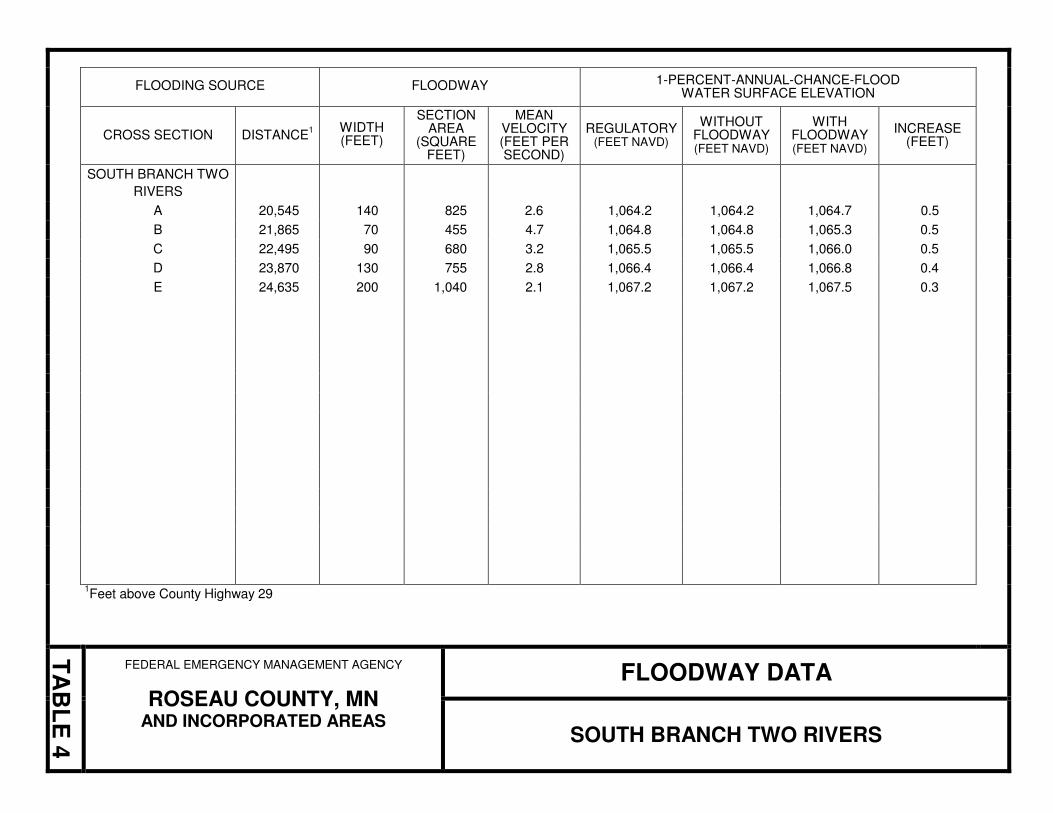
capacity, increases flood heights and velocities, and increases flood hazards in areas beyond the encroachment itself. One aspect of floodplain management involves balancing the economic gain from floodplain development against the resulting increase in flood hazard. For purposes of the NFIP, a floodway is used as a tool to assist local communities in this aspect of floodplain management. Under this concept, the area of the 1-percent-annual-chance floodplain is divided into a floodway and a floodway fringe. The floodway is the channel of a stream, plus any adjacent floodplain areas, that must be kept free of encroachment so that the 1-percent-annual-chance flood can be carried without substantial increases in flood heights. Minimum Federal standards limit such increases to 1 foot, provided that hazardous velocities are not produced. The floodways in this study are presented to local agencies as minimum standards that can be adopted directly or that can be used as a basis for additional floodway studies. In Minnesota, however, floodplain encroachment is limited by Minnesota Regulations to that which would cause a 0.5-foot increase in flood heights above pre-floodway conditions at any point (MDNR, 1977). Floodways having no more than 0.5-foot surcharge were delineated for this FIS. The floodway can be adopted directly or that can be used as a basis for additional floodway studies. The floodways presented in this FIS report and on the FIRM were computed for certain stream segments on the basis of equal-conveyance reduction from each side of the floodplain. Floodway widths were computed at cross sections. Between cross sections, the floodway boundaries were interpolated. The results of the floodway computations have been tabulated for selected cross sections (Table 4). In cases where the floodway and 1-percent-annual-chance floodplain boundaries are either close together or collinear, only the floodway boundary has been shown.
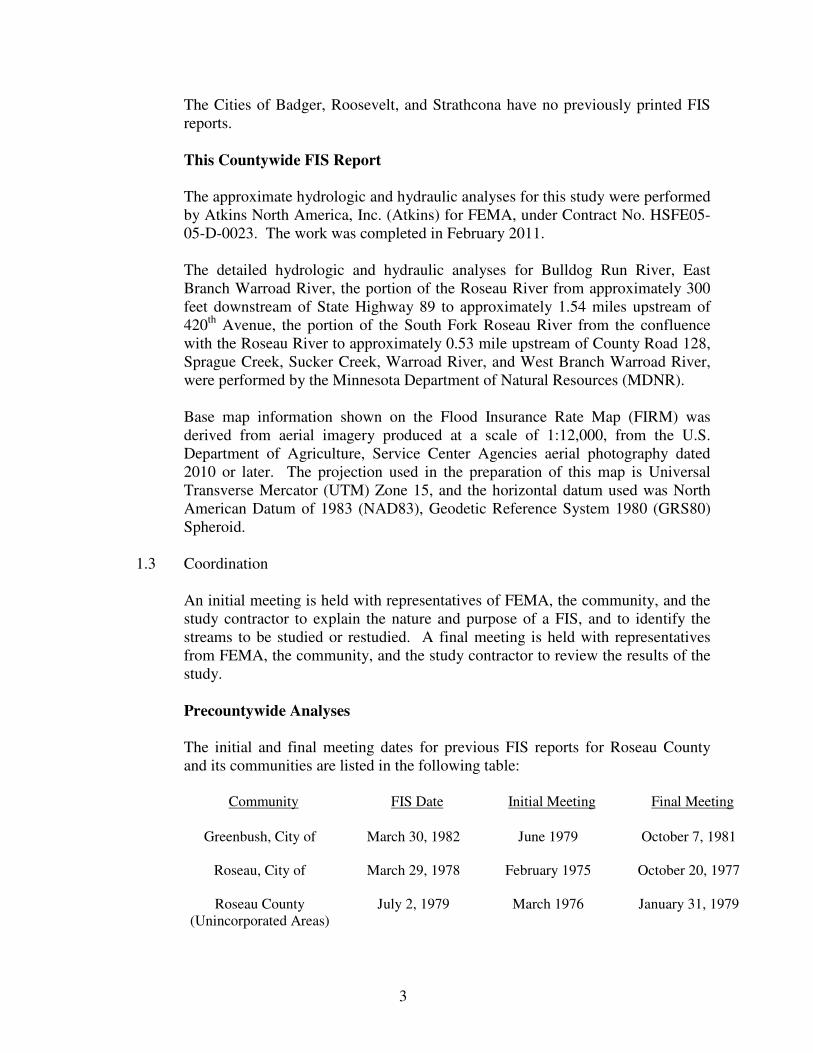
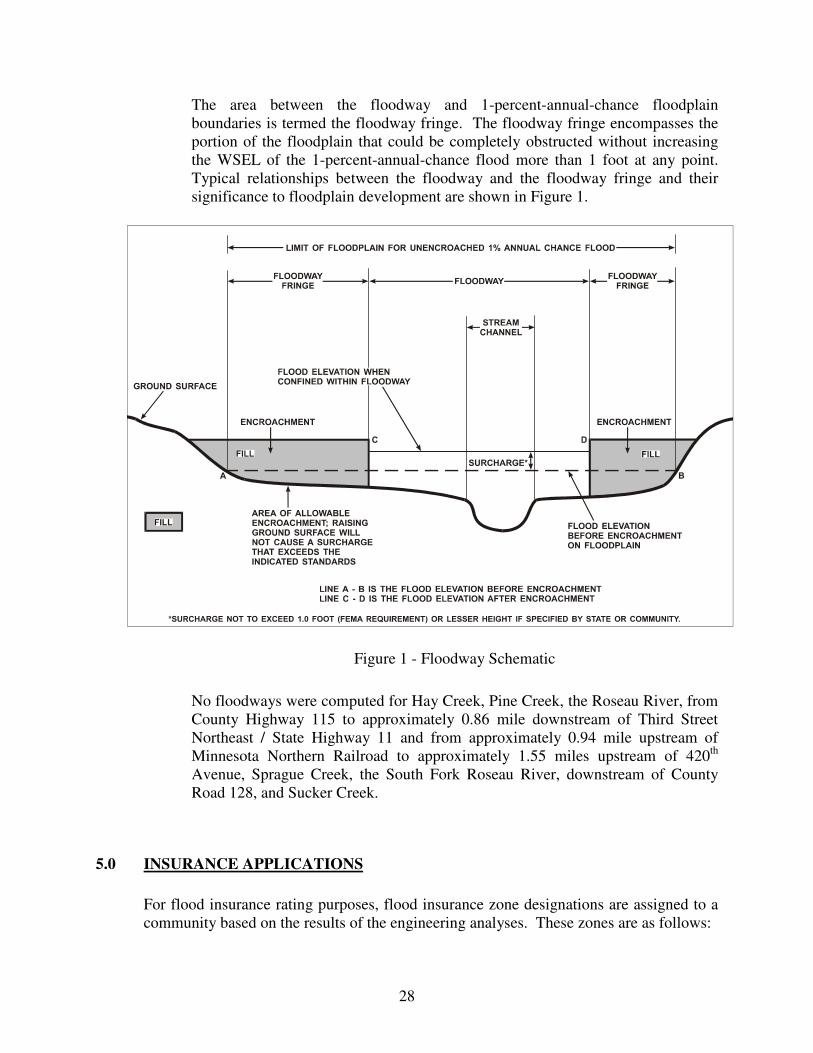
The area between the floodway and 1-percent-annual-chance floodplain boundaries is termed the floodway fringe. The floodway fringe encompasses the portion of the floodplain that could be completely obstructed without increasing the WSEL of the 1-percent-annual-chance flood more than 1 foot at any point. Typical relationships between the floodway and the floodway fringe and their significance to floodplain development are shown in Figure 1.
Figure 1 - Floodway Schematic
No floodways were computed for Hay Creek, Pine Creek, the Roseau River, from County Highway 115 to approximately 0.86 mile downstream of Third Street Northeast / State Highway 11 and from approximately 0.94 mile upstream of Minnesota Northern Railroad to approximately 1.55 miles upstream of 420th Avenue, Sprague Creek, the South Fork Roseau River, downstream of County Road 128, and Sucker Creek.
5.0 INSURANCE APPLICATIONS
For flood insurance rating purposes, flood insurance zone designations are assigned to a community based on the results of the engineering analyses. These zones are as follows:
29
Zone A Zone A is the flood insurance risk zone that corresponds to the 1-percent-annual-chance floodplains that are determined in the FIS by approximate methods. Because detailed hydraulic analyses are not performed for such areas, no BFEs or base flood depths are shown within this zone. Zone AE Zone AE is the flood insurance risk zone that corresponds to the 1-percent-annual-chance floodplains that are determined in the FIS by detailed methods. In most instances, whole-foot BFEs derived from the detailed hydraulic analyses are shown at selected intervals within this zone. Zone X Zone X is the flood insurance risk zone that corresponds to areas outside the 0.2-percent-annual-chance floodplain, areas within the 0.2-percent-annual-chance floodplain, areas of 1-percent-annual-chance flooding where average depths are less than 1 foot, areas of 1-percent-annual-chance flooding where the contributing drainage area is less than 1 square mile, and areas protected from the 1-percent-annual-chance flood by levees. No BFEs or base flood depths are shown within this zone.
6.0 FLOOD INSURANCE RATE MAP
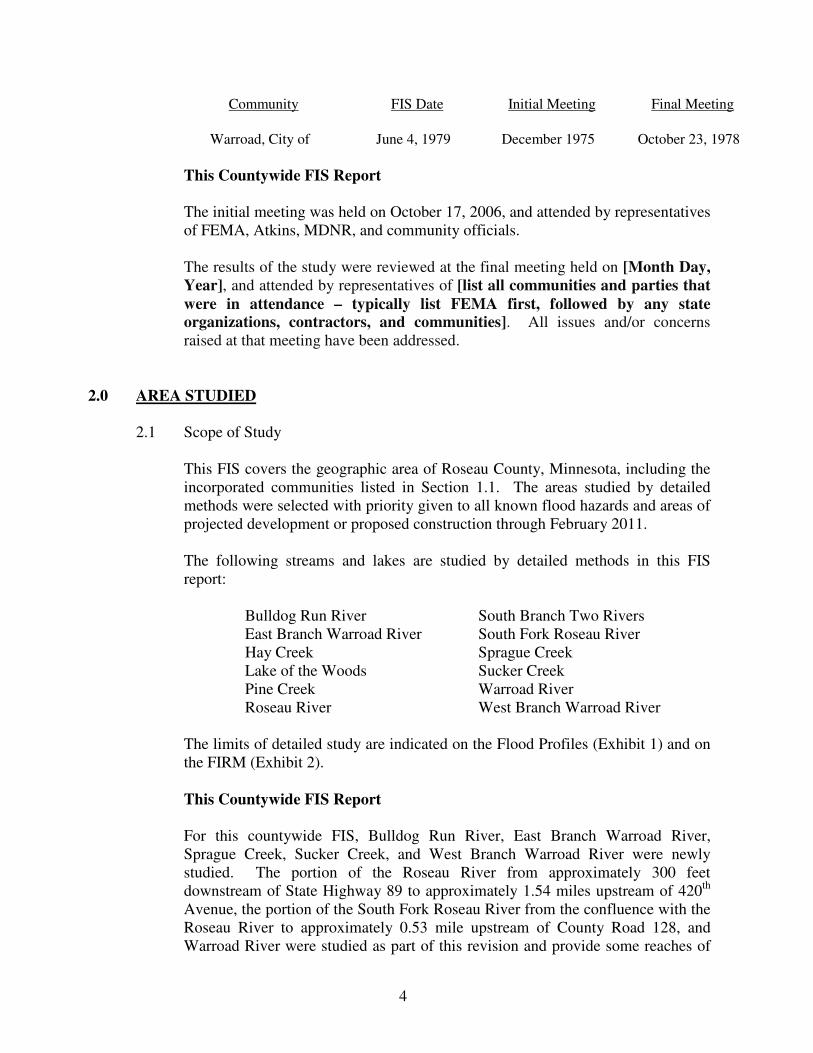
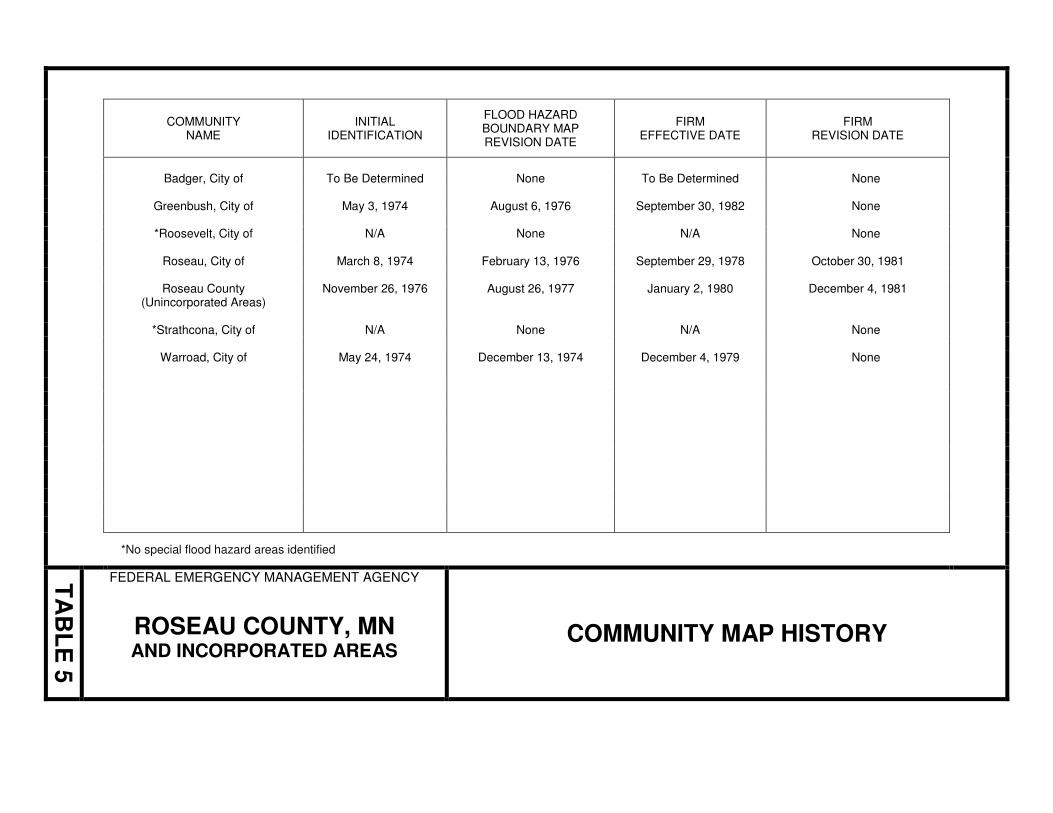
The FIRM is designed for flood insurance and floodplain management applications. For flood insurance applications, the map designates flood insurance risk zones as described in Section 5.0 and, in the 1-percent-annual-chance floodplains that were studied by detailed methods, shows selected whole-foot BFEs or average depths. Insurance agents use the zones and BFEs in conjunction with information on structures and their contents to assign premium rates for flood insurance policies. For floodplain management applications, the map shows by tints, screens, and symbols, the 1- and 0.2-percent-annual-chance floodplains, floodways, and the locations of selected cross sections used in the hydraulic analyses and floodway computations. The countywide FIRM presents flooding information for the entire geographic area of Roseau County. Previously, FIRMs were prepared for each incorporated community and the unincorporated areas of the County identified as flood-prone. This countywide FIRM also includes flood-hazard information that was presented separately on Flood Boundary and Floodway Maps, where applicable. Historical data relating to the maps prepared for each community are presented in Table 5.
COMMUNITY NAME
INITIAL IDENTIFICATION
FLOOD HAZARD BOUNDARY MAP REVISION DATE
FIRM EFFECTIVE DATE
FIRM REVISION DATE
Badger, City of To Be Determined None To Be Determined None
Greenbush, City of May 3, 1974 August 6, 1976 September 30, 1982 None
*Roosevelt, City of N/A None N/A None
Roseau, City of March 8, 1974 February 13, 1976 September 29, 1978 October 30, 1981
Roseau County
(Unincorporated Areas) November 26, 1976 August 26, 1977 January 2, 1980 December 4, 1981
*Strathcona, City of N/A None N/A None
Warroad, City of May 24, 1974 December 13, 1974 December 4, 1979 None
*No special flood hazard areas identified
TA
BL
E 5
FEDERAL EMERGENCY MANAGEMENT AGENCY
ROSEAU COUNTY, MN AND INCORPORATED AREAS
COMMUNITY MAP HISTORY
Table 4 - Community Map History
31
7.0 OTHER STUDIES
This report either supersedes or is compatible with all previous studies on streams studied in this report and should be considered authoritative for purposes of the NFIP.
8.0 LOCATION OF DATA
Information concerning the pertinent data used in the preparation of this study can be obtained by contacting FEMA, Federal Insurance and Mitigation Division, 536 South Clark Street, Sixth Floor, Chicago, Illinois 60605.
9.0 BIBLIOGRAPHY AND REFERENCES
3DI Technologies, Inc. and Ulteig Engineers, Inc., LiDAR Survey (City of Roseau Area and City of Warroad Area), November 2003. Aero-Metric Engineering, Inc., Aerial Photographs, Scale 1:12,000: City of Roseau, Minnesota, 1975. Aero-Metric Engineering, Inc., Aerial Photographs, Scale 1:12,000, and 1:800: City of Warroad, Minnesota, 1976. Barr Engineering Company, Water Resources of the Lake Bronson Watershed, February 1980. Burlington Northern Railroad, Engineering Division, Plan for Bridge No. 83.2 Over Roseau River, St. Paul, Minnesota, date unavailable. Federal Emergency Management Agency, Flood Insurance Study, City of Greenbush, Roseau County, Minnesota, Flood Insurance Study Report, March 30, 1982; Flood Insurance Rate Map, September 30, 1982.
Federal Emergency Management Agency, Declared Disasters by Year or State, Roseau County, Minnesota. Retrieved August 12, 2010, from http://www.fema.gov/news/disaster_totals_annual.fema. Federal Insurance Administration, Flood Insurance Study, City of Roseau, Roseau County, Minnesota, Flood Insurance Study Report, March 29, 1978; Flood Insurance Rate Map, October 30, 1981.
32
Federal Insurance Administration, Flood Insurance Study, City of Warroad, Roseau County, Minnesota, Flood Insurance Study Report, June 4, 1979a; Flood Insurance Rate Map, December 4, 1979.
Federal Insurance Administration, Flood Insurance Study, Roseau County, Minnesota (Unincorporated Areas), Flood Insurance Study Report, July 2, 1979b; Flood Insurance Rate Map, January 2, 1980.
Hydrologic Engineering Center, HEC-2 Water Surface Profiles, U.S. Army Corps of Engineers, Davis, California, October 1973. Hydrologic Engineering Center, HEC-2 Water Surface Profiles, U.S. Army Corps of Engineers, Davis, California, November 1976. Hydrologic Engineering Center, HEC-2 Water Surface Profiles, U.S. Army Corps of Engineers, Davis, California, August 1979. Hydrologic Engineering Center, HEC-FFA, Flood Frequency Analysis, Version 3.1, U.S. Army Corps of Engineers, Davis, California, February 1995. Hydrologic Engineering Center, HEC-RAS, River Analysis System, Version 3.1.3, U.S. Army Corps of Engineers, Davis, California, June 2005. Hydrologic Engineering Center, HEC-RAS, River Analysis System, Version 4.0, U.S. Army Corps of Engineers, Davis, California, March 2008. International Roseau River Engineering Board, Joint Studies for Coordinated Water Use and Control, Roseau River Basin, Manitoba-Minnesota, September 1975. JOR Engineering, Inc., Roseau River HEC-1 Hydrologic Model, July 18, 2001. Mark Hurd Aerial Surveys, Inc., Aerial Photographs for Greenbush, Minnesota, Minneapolis, Minnesota, April 1980. Minnesota Department of Administration, Office of Geographic and Demographic Analysis, 1990s Census of the Land, Roseau County, January 2000. Retrieved August 12, 2010, from http://www.lmic.state.mn.us/datanetweb/landuse.html.
Minnesota Department of Natural Resources, Document Station, Department of Administration, Statewide Standards and Criteria for the Management of Shoreland Areas of Minnesota, Minnesota Regulation NR70-77, St. Paul, Minnesota, 1970. Minnesota Department of Natural Resources, Technical Report No. 6, The Regulatory Floodway in Floodplain Management, Division of Water, September 1977.
33
Minnesota Department of Transportation, Bridge Plans for the City of Roseau in Roseau County Over the Roseau River, Bridge No. 5814, April 1968; Bridge No. 68520, June 1971.
National Geodetic Survey, VERTCON-North American Vertical Datum Conversion Utility. Retrieved September 20, 2007 from http://www.ngs.noaa.gov. National Oceanic and Atmospheric Administration, Environmental Data Services, Climatological Data for Minnesota, U.S. Department of Commerce, Asheville, North Carolina, January 1975.
U.S. Army Corps of Engineers, St. Paul District, Survey Report, Roseau River, Minnesota for Flood Control, May 8, 1964. U.S. Army Corps of Engineers, St. Paul District, Flood Control, Roseau River Minnesota – General Design Memorandum, October 1971.
U.S. Army Corps of Engineers, St. Paul District, Stage Records for Lake of the Woods at Warroad, Minnesota, 1893-1976. U.S. Census Bureau, American Fact Finder, Roseau County, Minnesota, 2000. Retrieved August 11, 2010, from http://factfinder.census.gov.
U.S. Geological Survey, Water Resources Division, Water Resources Data for Minnesota, Part 1, Surface Water Resources, Part 2, Water Quality Records, St. Paul, Minnesota, 1917-1976. U.S. Geological Survey, Water Resources Data for Minnesota, Annual Reports, 1961-1976. U.S. Geological Survey, 7.5 Minute Series Topographic Maps, Scale 1:24,000, Contour Interval 5 feet: Badger, 1966, Badger, N.E., 1966; Badger, N.W., 1966; Carribou, 1966; Carribou, N.E., 1966; Fox, 1966; Greenbush, 1962; Greenbush, N.E., 1962; Greenbush, S.E., 1962; Haug, 1966; Juneberry Ridge, 1966; Leo, 1966; Malung, 1966; Mulligan Lake, 1968; Mulligan Lake, N.E., 1968; Mulligan Lake, N.W., 1968; Mulligan Lake, S.W., 1968; Pine Creek, 1966; Roosevelt, 1969; Roosevelt, N.E., 1967; Roosevelt, N.W., 1967; Roseau, 1967; Roseau, N.E., 1966; Salol, N.E., 1966; Salol, N.W., 1966; Salol, S.E., 1966; Skime, 1969; Strathcona, 1968; Swift, 1967; Thief Lake, N.E., 1967; Thief Lake, N.W., 1967; Thief Lake, S.E., 1967; Thief Lake, S.W., 1967; Wannaska, 1967; Wannaska, N.E., 1967; Wannaska, S.W., 1968; Warroad, 1967; Warroad, S.E., 1967; Warroad, N.W., 1967; Warroad, S.W., 1967; Winter Road Lake, 1968; Winter Road Lake, N.W., 1968; Winter Road Lake, S.E., 1969; Winter Road Lake, S.W., 1969. U.S. Department of the Interior, various dates.
34
U.S. Geological Survey, Accuracy of Streamflow Characteristics in Geological Survey Research, Professional Paper 650-D, C.H. Hardison, U.S. Department of the Interior, 1969.
U.S. Geological Survey, St. Paul District, Techniques for Estimating Magnitude and Frequency of Floods in Minnesota, Water-Resources Investigation Report 77-31, prepared in cooperation with the Minnesota Department of Natural Resources, U.S. Department of the Interior, May 1977. U.S. Geological Survey, Techniques for Estimating Peak Flow on Small Streams, Water-Resources Investigation Report 97-4249, U.S. Department of the Interior, Mounds View, Minnesota, 1997. U.S. Geological Survey, Peak Streamflow for the Nation, USGS 05107500 Roseau River at Ross, MN. Retrieved August 12, 2010a, from http://nwis.waterdata.usgs.gov/usa/nwis/peak. U.S. Geological Survey, Peak Streamflow for the Nation, USGS 05139500 Warroad River near Warroad, MN. Retrieved August 12, 2010b, from http://nwis.waterdata.usgs.gov/usa/nwis/peak. Water Resources Council, Hydrology Committee, Guidelines for Determining Flood Flow Frequencies, Bulletin #17, March 1976.
Water Resources Council, Hydrology Committee, Guidelines for Determining Flood Flow Frequencies, Bulletin #17B, Revised September 1981, Editorial corrections March 1982. The Weather Channel, Monthly Averages for Roseau, MN. Retrieved August 12, 2010, from http://www.weather.com.