29
Australia’s Health System: Opportunities and Challenges 26 October 2015 Rosemary Calder AM Director
| Date post: | 19-Feb-2017 |
| Category: |
Healthcare |
| Upload: | informa-australia |
| View: | 512 times |
| Download: | 0 times |
Australia’s Health
System:
Opportunities and
Challenges26 October 2015
Rosemary Calder AMDirector
The challenges we know well: chronic
diseases
• The predominant causes of illness, premature mortality and health system utilisation
• High personal, family and community costs
• Reduce workforce participation and productivity for the individual and for their primary carer
• Have a major adverse impact on Australia’s economic prosperity with significant direct and indirect costs
• ‘If chronic disease was eliminated, the full-time workforce and hence productivity could increase by 10%’ (Business Council of Australia, 2011)
The risk factors we know well
• Shared amongst several chronic diseases
• Huge cost savings when addressing these 6:
Smoking
High risk alcohol use
Physical inactivity
Obesity
Inadequate diet
Intimate partner violence
1981 Australia becomes a signatory to the Health for All by the Year 2000 Agreement
1985 Better Health Commission established
1986 Better Health Commission and Looking forward to better health report
1986 WHO Health For All 2nd international conference
1988 Health for All Committee release Health for all Australians report
1993 Goals and targets for Australia’s Health in the Year 2000 and beyond released
1994 AHMAC release Better Health Outcomes for Australians report
1996 National Health Priority Areas agreed by Australian health ministers
1997 First report on National Health Priority Areas
2006 Australian Better Health Initiative
2008 National Partnership Agreement on Preventive Health and establishment of the
National Preventative Health Taskforce
2009 Australia: The healthiest Country by 2020 released
2011 Australian National Preventive Health Agency (ANPHA) established
2014 ANPHA closed and its functions transferred to the Department of Health
2014 Commonwealth pulls out of National Healthcare Agreements
2014 National Diabetes Strategy due
1981 Australia becomes a signatory to the Health for All by the Year 2000 Agreement
1985 Better Health Commission established
1986 Better Health Commission and Looking forward to better health report
1986 WHO Health For All 2nd international conference
1988 Health for All Committee release Health for all Australians report
1993 Goals and targets for Australia’s Health in the Year 2000 and beyond released
1994 AHMAC release Better Health Outcomes for Australians report
1996 National Health Priority Areas agreed by Australian health ministers
1997 First report on National Health Priority Areas
2006 Australian Better Health Initiative
2008 National Partnership Agreement on Preventive Health and establishment of the
National Preventative Health Taskforce
2009 Australia: The healthiest Country by 2020 released
2011 Australian National Preventive Health Agency (ANPHA) established
2014 Commonwealth terminates National Healthcare Agreements
2014 ANPHA closed and its functions transferred to the Department of Health
2014 National Diabetes Strategy due
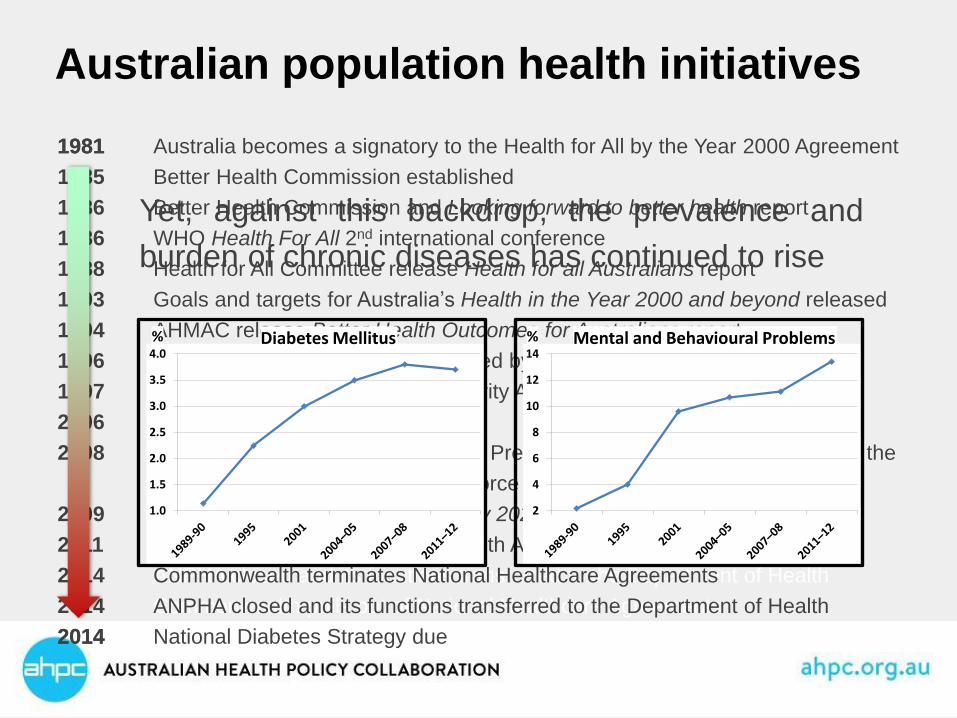
Australian population health initiatives
Yet, against this backdrop, the prevalence and
burden of chronic diseases has continued to rise
1.0
1.5
2.0
2.5
3.0
3.5
4.0Diabetes Mellitus%
2
4
6
8
10
12
14Mental and Behavioural Problems%
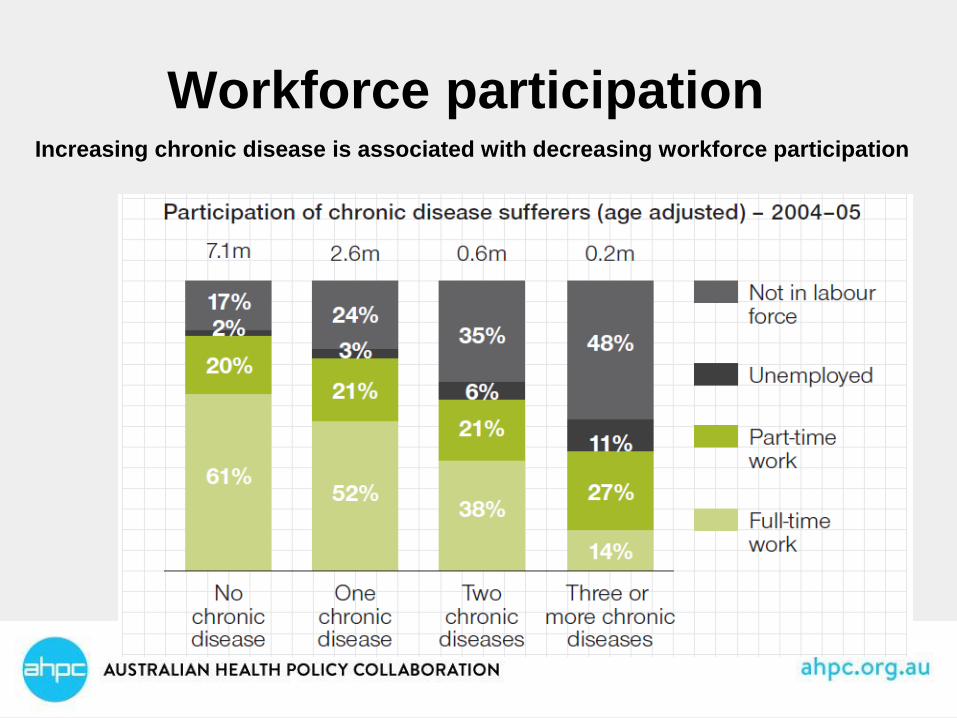
Workforce participationIncreasing chronic disease is associated with decreasing workforce participation
Health ‘system’ costs
• The proportion of health expenditure devoted to hospital care in Australia increased from 38% in 2003 to 40.4% in 2011.
• Other like countries-Canada, Germany, Netherlands, spend less on hospital care
• Australia makes a relatively low investment in public health
• Life expectancy is increasing, but so too is the burden and prevalence of chronic diseases.
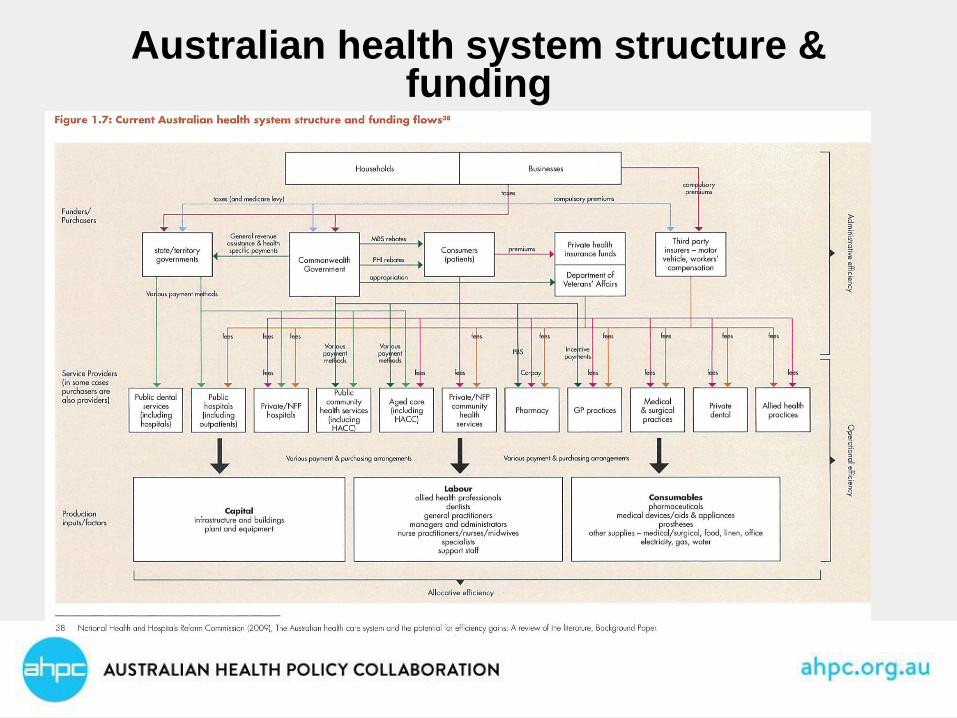
Australian health system structure & funding
Health system development
Re-engineering is needed to build an effective ‘system’
• Primary care
• Integrated care
• Funding
• E-health
• Acute care
Whose responsibility?
Historically, Australian governments have
not been required to answer for their
performance in relation to prevention of
chronic diseases.
There is no regular reporting against
national chronic disease prevention
targets, and indeed, there are no agreed
targets.
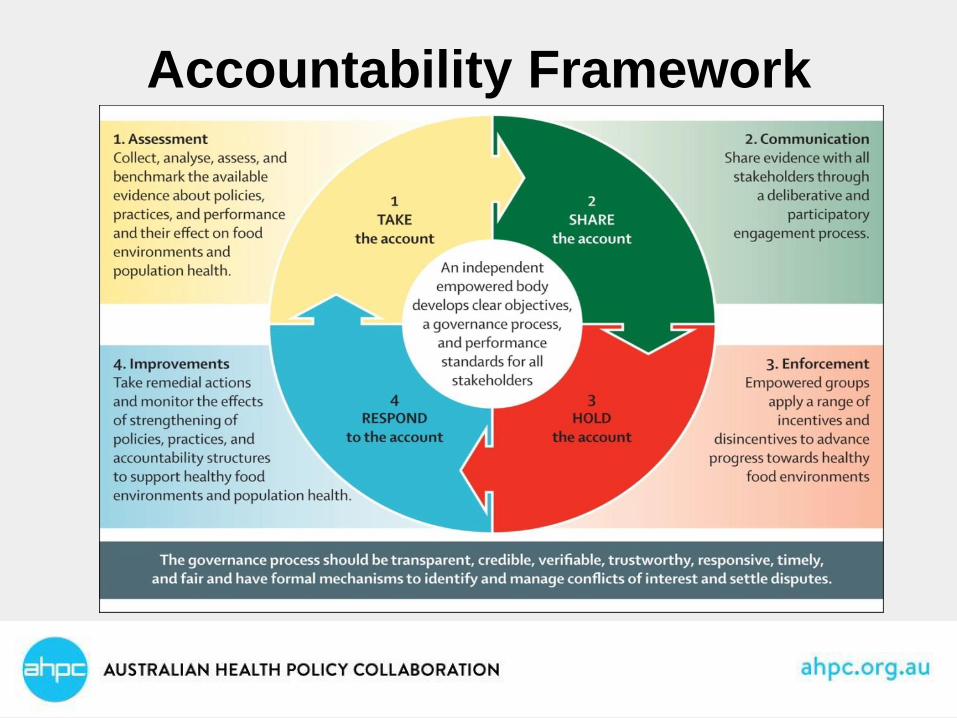
Accountability Framework
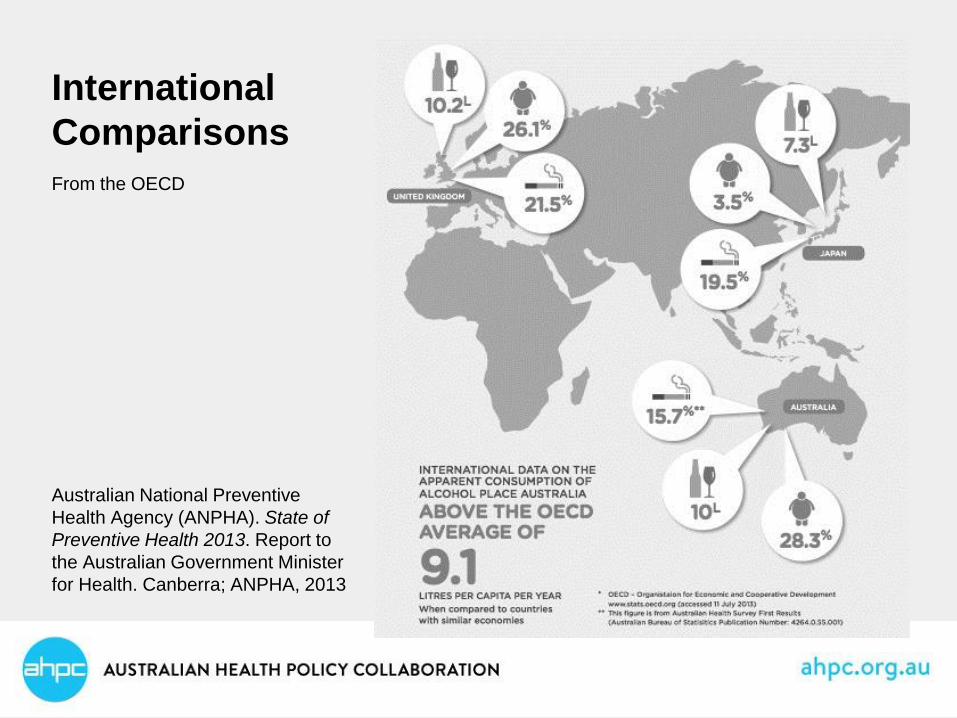
International
Comparisons
From the OECD
Australian National Preventive
Health Agency (ANPHA). State of
Preventive Health 2013. Report to
the Australian Government Minister
for Health. Canberra; ANPHA, 2013
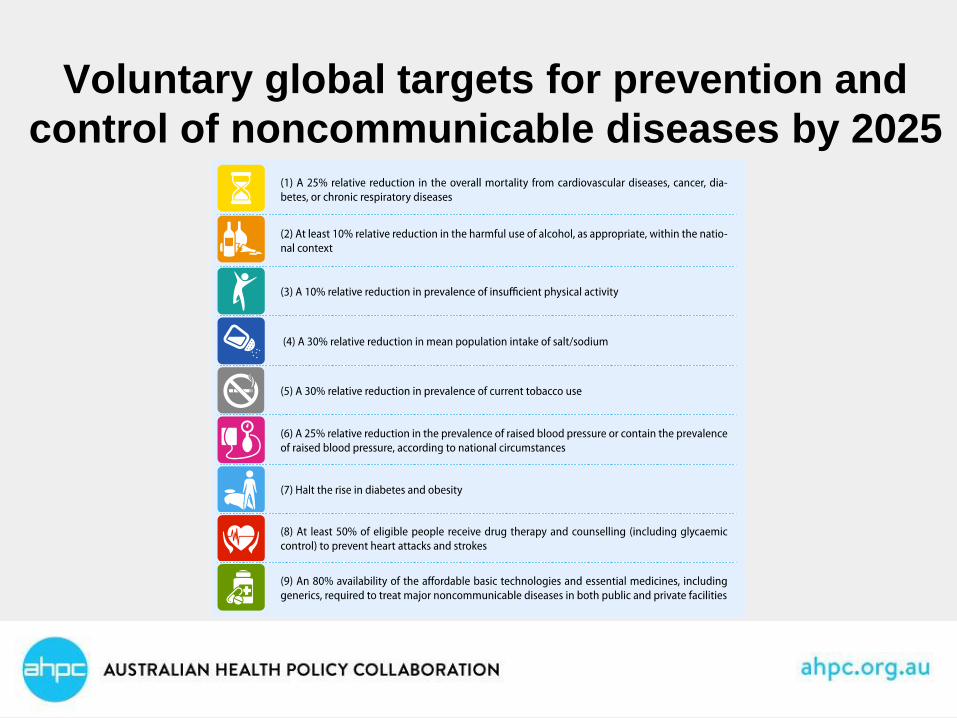
Voluntary global targets for prevention and
control of noncommunicable diseases by 2025
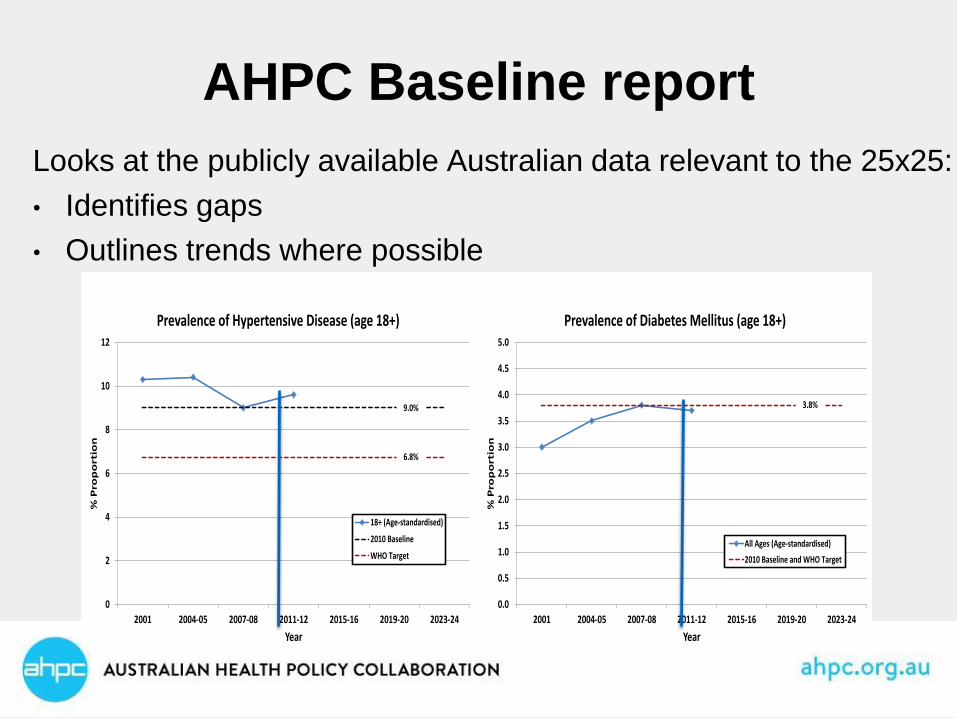
AHPC Baseline report
Looks at the publicly available Australian data relevant to the 25x25:
• Identifies gaps
• Outlines trends where possible
0
2
4
6
8
10
12
2001 2004-05 2007-08 2011-12 2015-16 2019-20 2023-24
% P
rop
ort
ion
Year
Prevalence of Hypertensive Disease (age 18+)
18+ (Age-standardised)
2010 Baseline
WHO Target
9.0%
6.8%
0.0
0.5
1.0
1.5
2.0
2.5
3.0
3.5
4.0
4.5
5.0
2001 2004-05 2007-08 2011-12 2015-16 2019-20 2023-24
% P
rop
ort
ion
Year
Prevalence of Diabetes Mellitus (age 18+)
All Ages (Age-standardised)
2010 Baseline and WHO Target
3.8%
Examples of effective and cost-effective interventions
that have been implemented successfully in other
countries include:
• Salt reduction in the United Kingdom
• Taxation on sugar-sweetened beverages in Mexico,
Denmark, Finland, Hungary, France
• Early detection (Integrated health check (Diabetes,
Chronic Kidney Disease, Cardiovascular Disease))
Q:What are other countries doing that we are not?
A: Plenty
‘Achieving realistic targets in the prevention of
behavioural risk factors has implications beyond
health and is a core outcome for the whole of
government…As the report highlights, we are all
beneficiaries when it comes to reducing the
prevalence of these six behavioural risk factors’
- Cadilhac et al., 2009, The health and economic benefits of reducing disease risk
factors, Melbourne: Deakin University & National Stroke Research Institute.
Australia needs to act on prevention
AHPC National Targets & Indicators Work
• Seven working groups (morbidity/high risk, alcohol, physical inactivity, salt, tobacco, diabetes & obesity, mental illness
• Starting with, but not limited to, the WHO 25 x 25 and WHO Global Mental Health Plan T&I
• Selecting indicators based on criteria from AIHW
• Each group will produce a short report, and these will form the basis for a larger report
• Forum in Melbourne on November 25
“It is not that there is not enough data, not
enough information and not enough knowledge
as a basis for addressing the prevention and
control of NCD. The problem has been how to
raise the issue to a high enough level in the
political agenda and maintain it there, as
without that there will be no material progress.”
Sir George Alleyne, 2011
Prevention
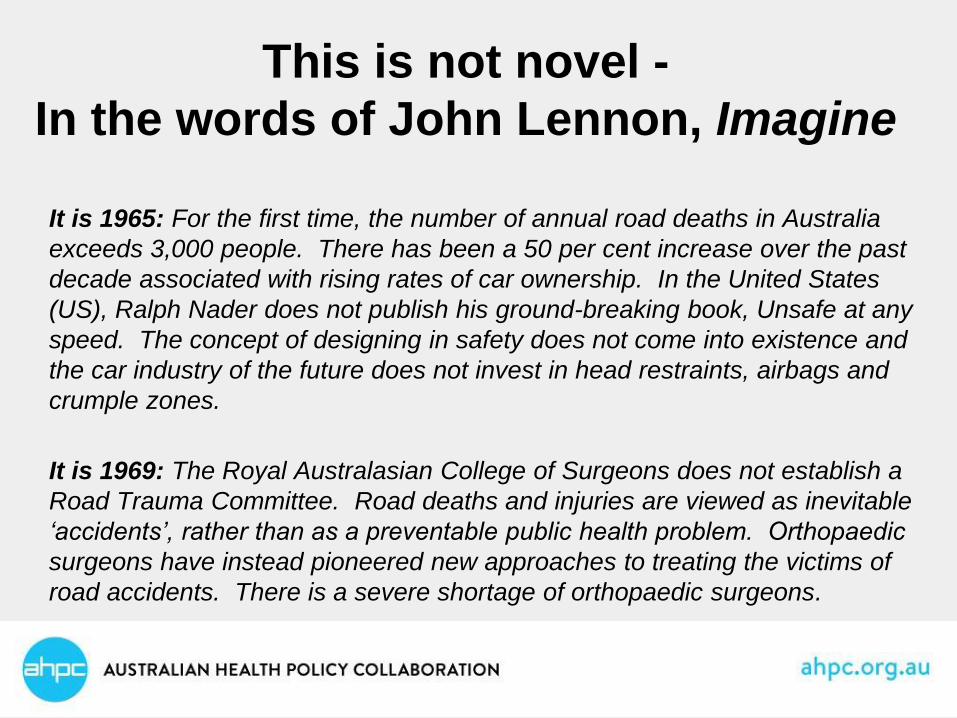
This is not novel -
In the words of John Lennon, Imagine
It is 1965: For the first time, the number of annual road deaths in Australia
exceeds 3,000 people. There has been a 50 per cent increase over the past
decade associated with rising rates of car ownership. In the United States
(US), Ralph Nader does not publish his ground-breaking book, Unsafe at any
speed. The concept of designing in safety does not come into existence and
the car industry of the future does not invest in head restraints, airbags and
crumple zones.
It is 1969: The Royal Australasian College of Surgeons does not establish a
Road Trauma Committee. Road deaths and injuries are viewed as inevitable
‘accidents’, rather than as a preventable public health problem. Orthopaedic
surgeons have instead pioneered new approaches to treating the victims of
road accidents. There is a severe shortage of orthopaedic surgeons.
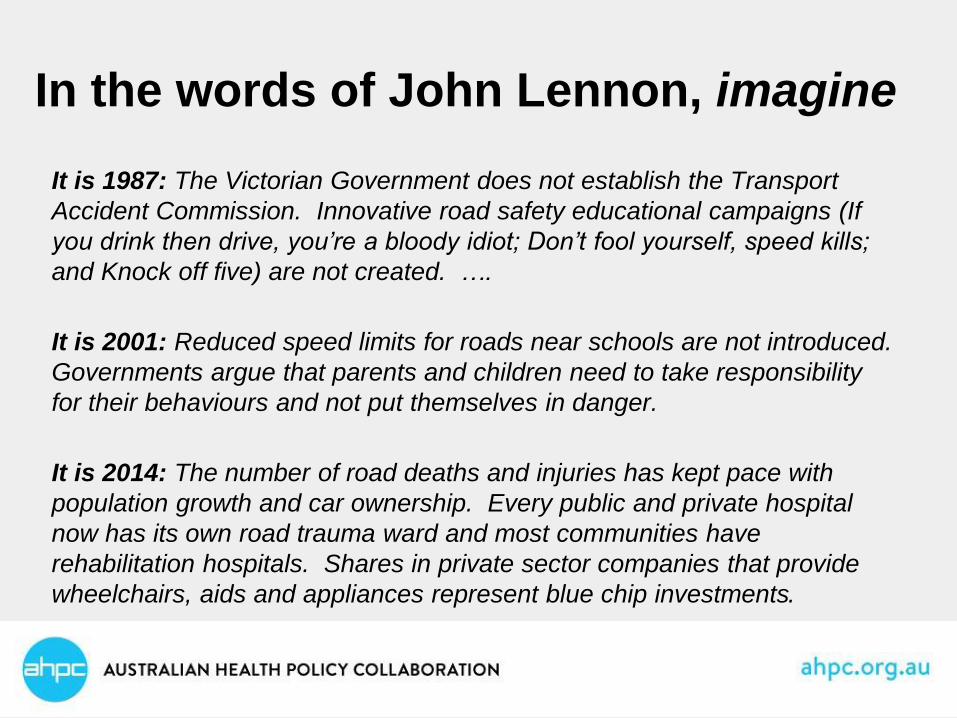
In the words of John Lennon, imagine
It is 1987: The Victorian Government does not establish the Transport
Accident Commission. Innovative road safety educational campaigns (If
you drink then drive, you’re a bloody idiot; Don’t fool yourself, speed kills;
and Knock off five) are not created. ….
It is 2001: Reduced speed limits for roads near schools are not introduced.
Governments argue that parents and children need to take responsibility
for their behaviours and not put themselves in danger.
It is 2014: The number of road deaths and injuries has kept pace with
population growth and car ownership. Every public and private hospital
now has its own road trauma ward and most communities have
rehabilitation hospitals. Shares in private sector companies that provide
wheelchairs, aids and appliances represent blue chip investments.
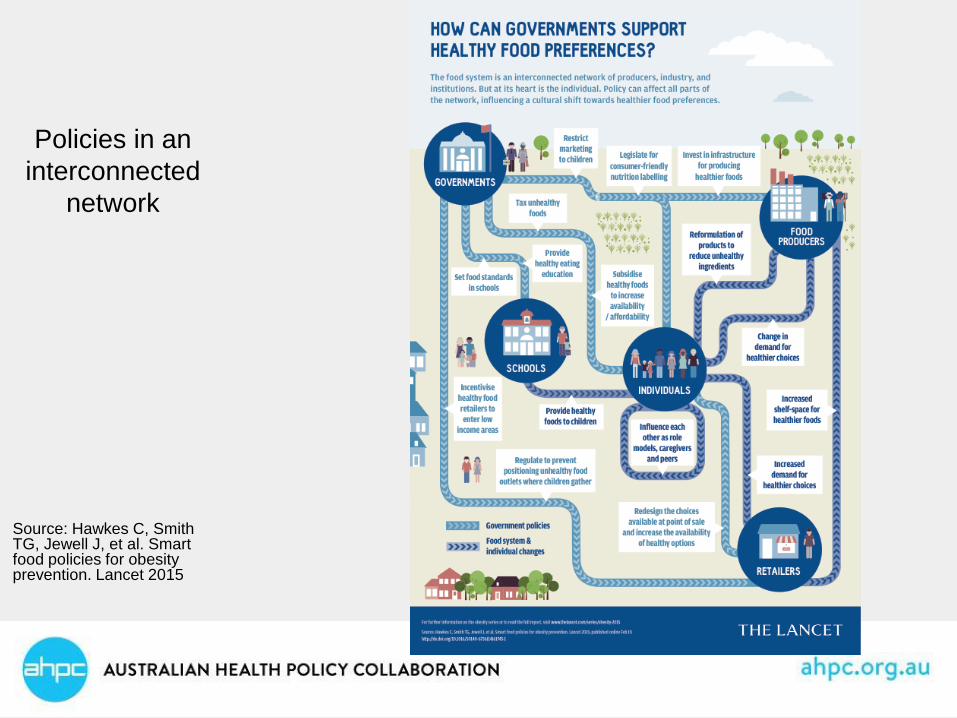
Policies in an
interconnected
network
Source: Hawkes C, Smith TG, Jewell J, et al. Smart food policies for obesity prevention. Lancet 2015
Primary Health Networks: the
challenge
• PHNs have replaced Medicare Locals that were only a few years old
• Other reviews will affect primary care directly or indirectly (MBS Review; Primary Health Care Advisory Group; Mental Health Review).
• PHNs need the opportunity to get established and serve their populations for a period of at least several years. Constant organisational change is in nobody’s interest.
• For the health system to perform well, strong and stable partnerships are needed across different parts of the system.
PHNs & chronic diseases: the
opportunity
Better prevention and management of chronic
diseases is essential
We should invest early, prior to the onset of illness,
and before health services are needed
Risk factors for chronic disease, such as obesity, are
at high levels and increasing
PHNs will have commissioning capacity – the
opportunity to build partnerships and focus
Integrated care & chronic diseases
• The challenges in prevention of avertable chronic
diseases and their impacts:
‘system’ capacity for effective management of
multiple chronic conditions over time and across
disciplines
‘system’ needs to be easy to access and use
equity of access using risk factors
promotion of self-management by consumers
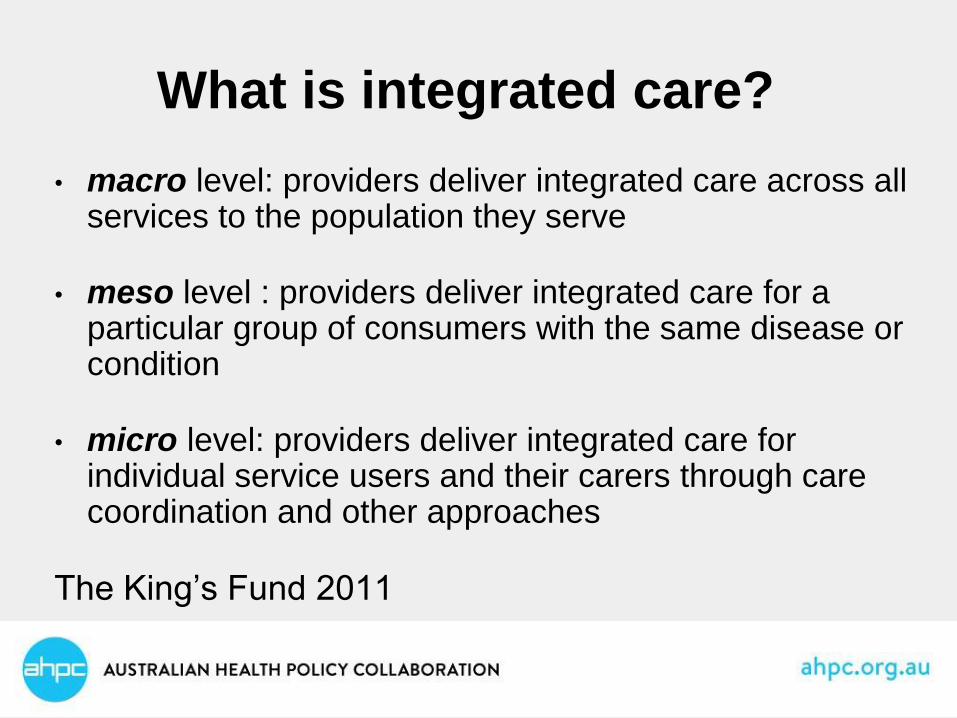
What is integrated care?
• macro level: providers deliver integrated care across all services to the population they serve
• meso level : providers deliver integrated care for a particular group of consumers with the same disease or condition
• micro level: providers deliver integrated care for individual service users and their carers through care coordination and other approaches
The King’s Fund 2011
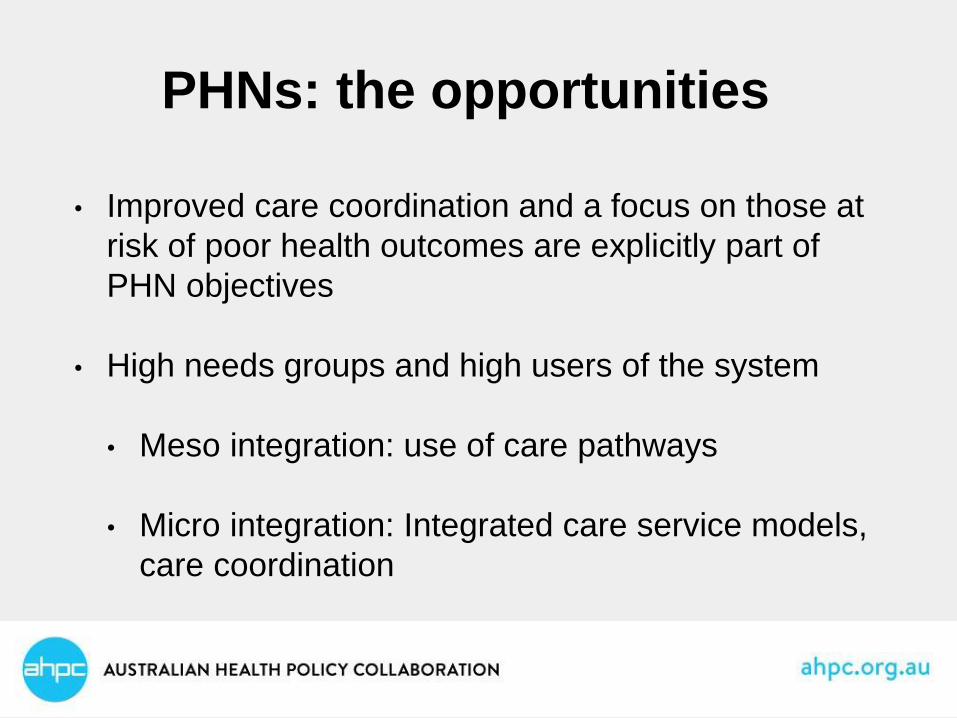
PHNs: the opportunities
• Improved care coordination and a focus on those at
risk of poor health outcomes are explicitly part of
PHN objectives
• High needs groups and high users of the system
• Meso integration: use of care pathways
• Micro integration: Integrated care service models,
care coordination
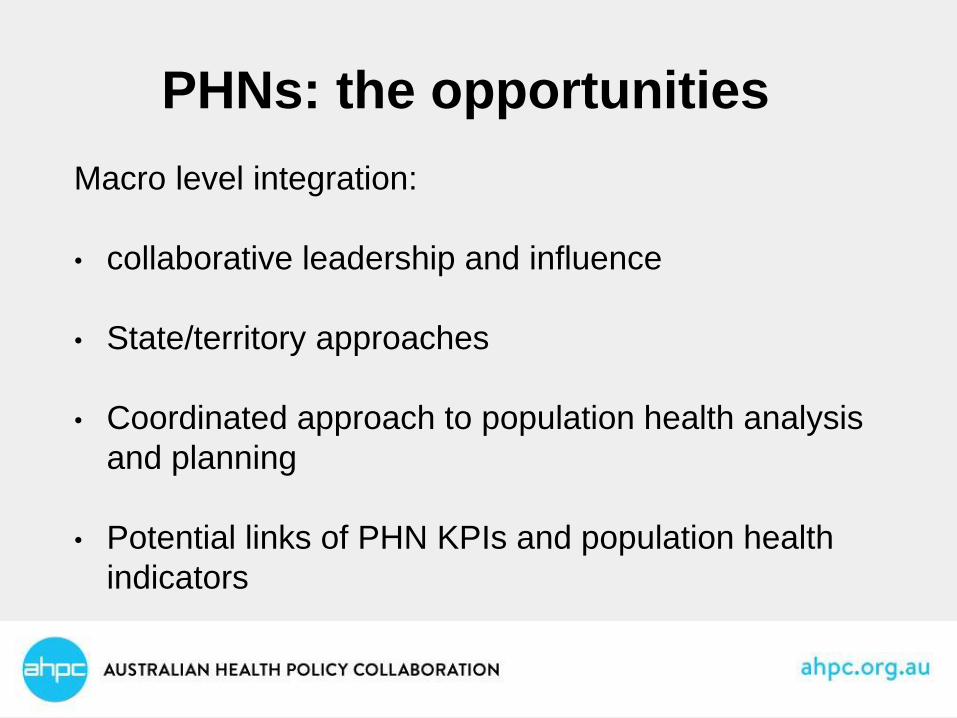
PHNs: the opportunities
Macro level integration:
• collaborative leadership and influence
• State/territory approaches
• Coordinated approach to population health analysis
and planning
• Potential links of PHN KPIs and population health
indicators
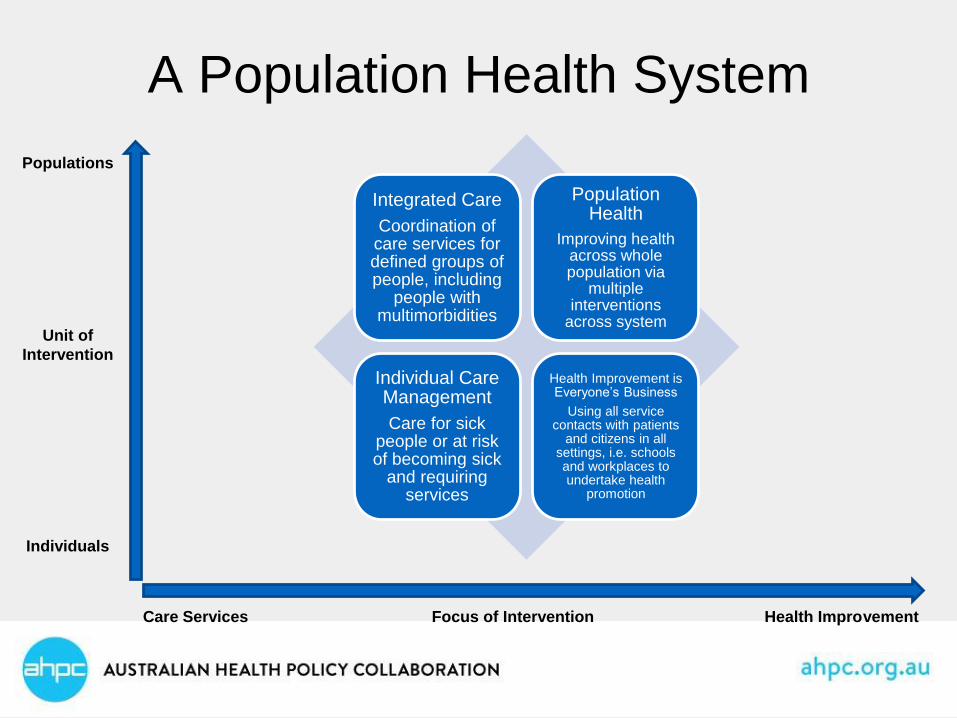
A Population Health System
Integrated Care
Coordination of care services for defined groups of people, including
people with multimorbidities
Population Health
Improving health across whole population via
multiple interventions
across system
Individual Care Management
Care for sick people or at risk of becoming sick
and requiring services
Health Improvement is Everyone’s Business
Using all service contacts with patients
and citizens in all settings, i.e. schools and workplaces to undertake health
promotion
Populations
Unit of
Intervention
Individuals
Care Services Focus of Intervention Health Improvement
Primary and integrated care – our
opportunity and challenge
The cornerstone of an effective health system


