Rosenberg International Forum on Water Policy Water for food: Quantity and Quality in a Changing World Zaragoza, Spain June 2008 Water Policies in Spain: Balancing water for food and water for nature Consuelo Varela Ortega Universidad Politécnica de Madrid (UPM), Spain 1
Transcript
Rosenberg International Forum on Water Policy Water for food: Quantity and Quality in a Changing World
Zaragoza, Spain
June 2008
Water Policies in Spain:
Balancing water for food and water for nature
Consuelo Varela Ortega
Universidad Politécnica de Madrid (UPM), Spain
1
Some highlights of the RF Key points
Hellen, Margaret, John
6. Public participation, stakeholders, credibility
legitimacy
Malin, Wendy… 7. Changes are Crisis-driven ….
Hellen, Uriel, John …
5. Scale matters, local-specific, context is critical
John, Maggie, Hellen…
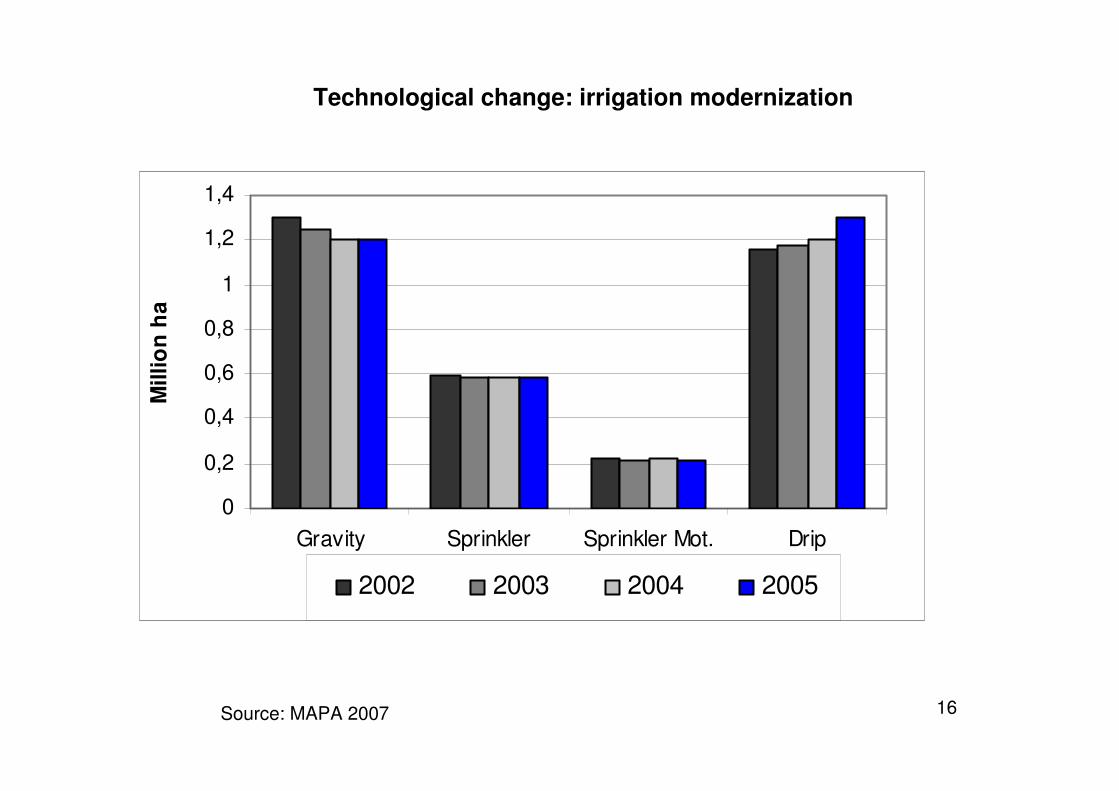
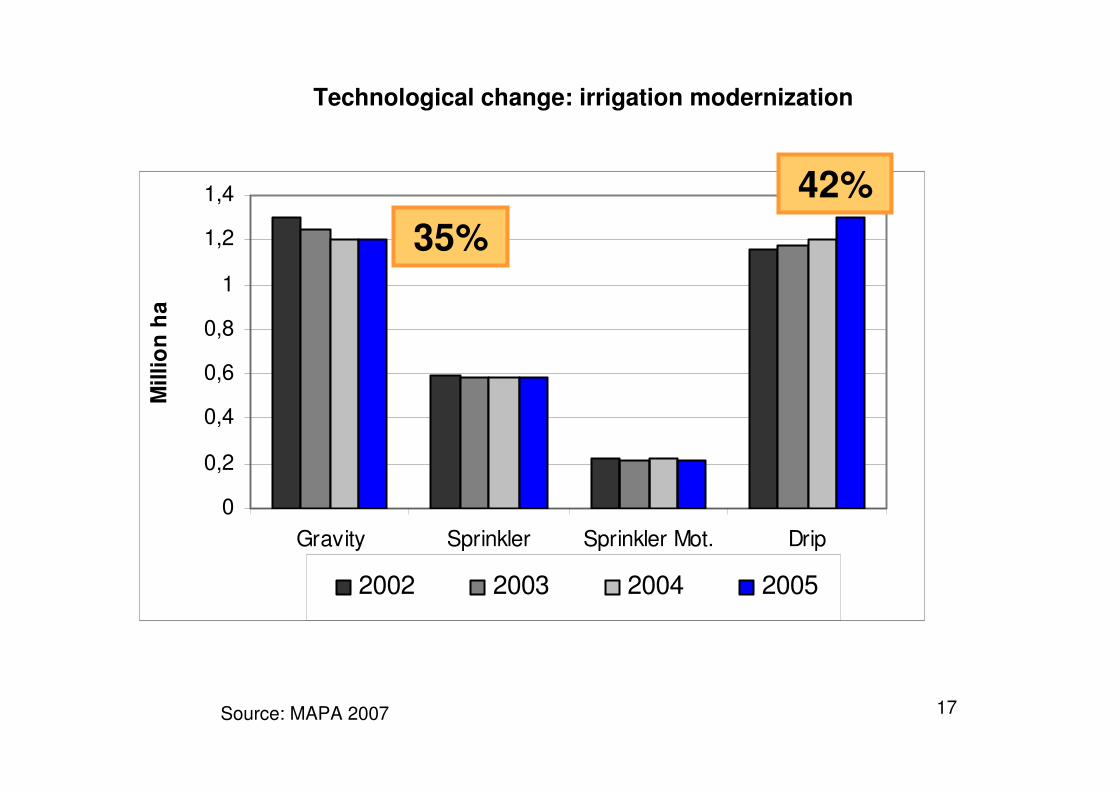
4. Technology is right, institutions must evolve
Elias … 3. Water productivity can increase, complexity
science , multidisciplinary
John B… 2. Policy is one thing, enforcing policy is the key
issue
Maggie, Elias,
……
1. Get Management right
2
Contents
1. Overview: Irrigation agriculture and water use in Spain
2. The policy context: Water and agricultural Policies
3. Complying with the EU policies
4. Down-scaling to the Regional perspective: a case study of groundwater irrigation
5. Concluding remarks
3
Main Issues:
• Spain Mediterranean (aridity, water stress, ..
EU (policies)
Difficult adaptation, dual objective in water
• Policy-driven determinants for irrigation expansion and
water use
water policies, agricultural policies
• Clash between irrigation-based development and ecosystem protection
• Down-scale global EU policies to local actions
• Integration of water and agricultural policies
4
RENEWABLE RESOURCES(m3/person/year)
• In the WORLD 6,750
• In EUROPE 4,560
• In SPAIN 2,829
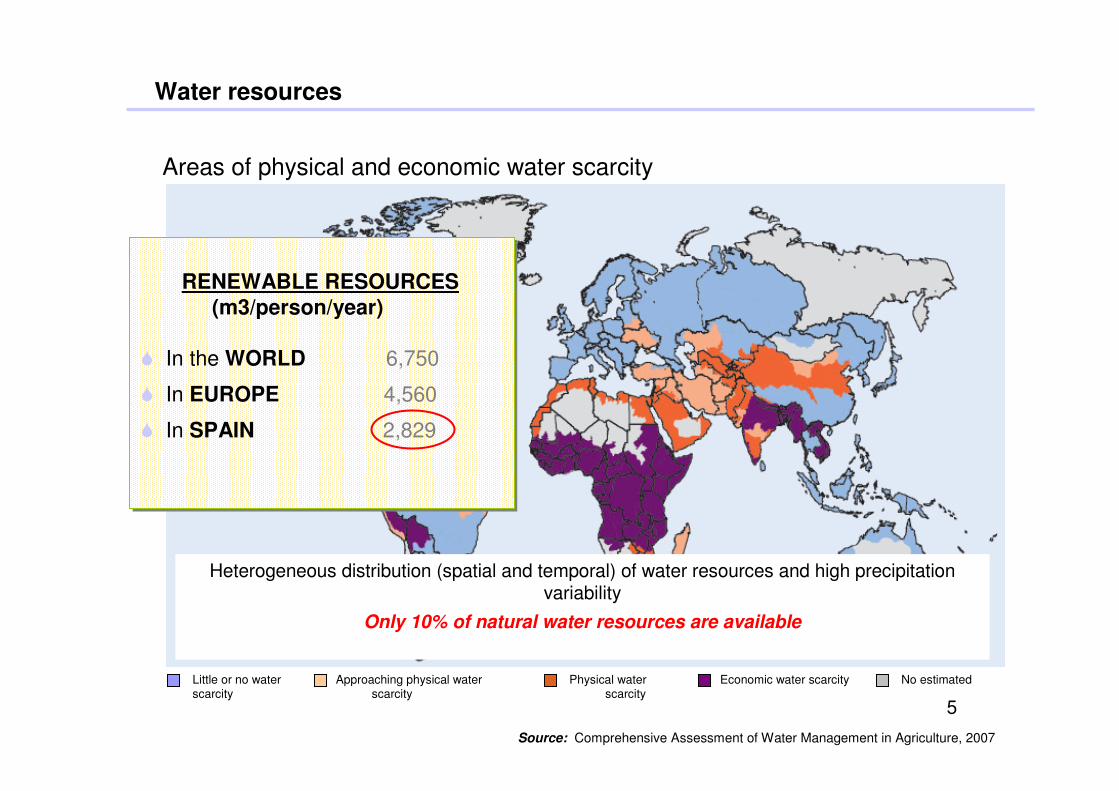
Water resources
Areas of physical and economic water scarcity
RENEWABLE RESOURCES (m3/person/year)
• In the WORLD 6,750
• In EUROPE 4,560
• In SPAIN 2,829
Heterogeneous distribution (spatial and temporal) of water resources and high precipitation variability
Only 10% of natural water resources are available
Little or no water Approaching physical water Physical water Economic water scarcity No estimated scarcity scarcity scarcity
Source: Comprehensive Assessment of Water Management in Agriculture, 2007
5
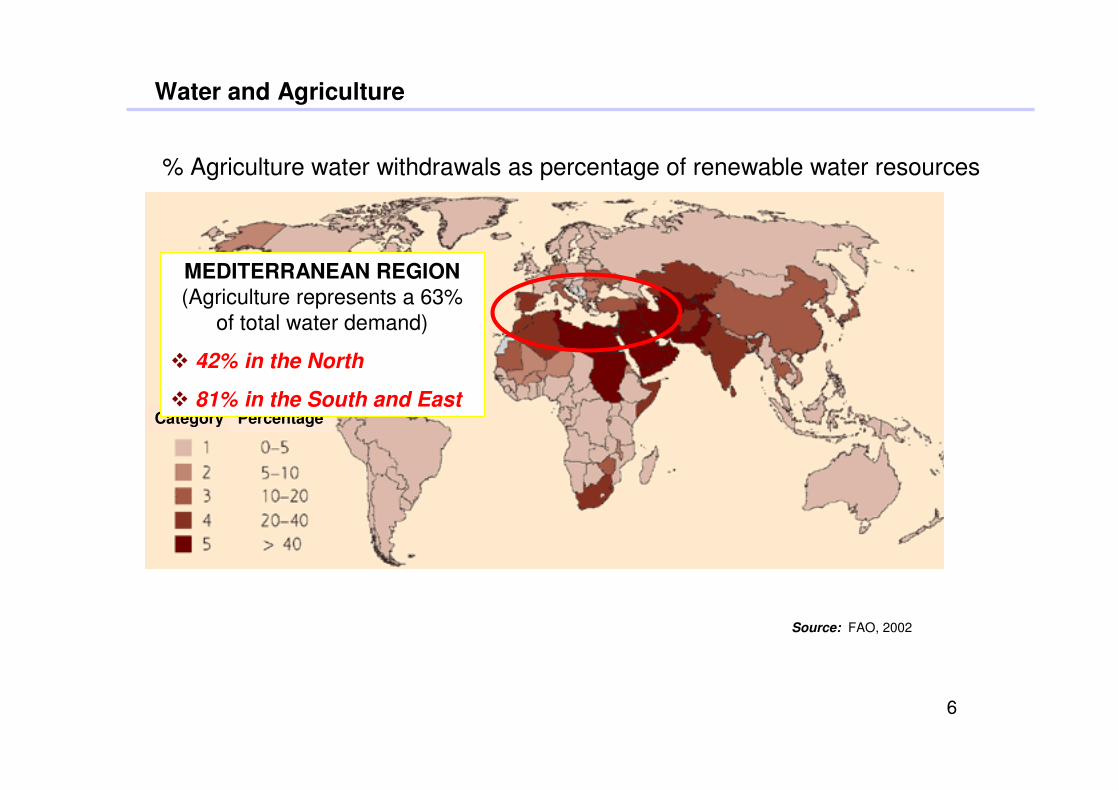
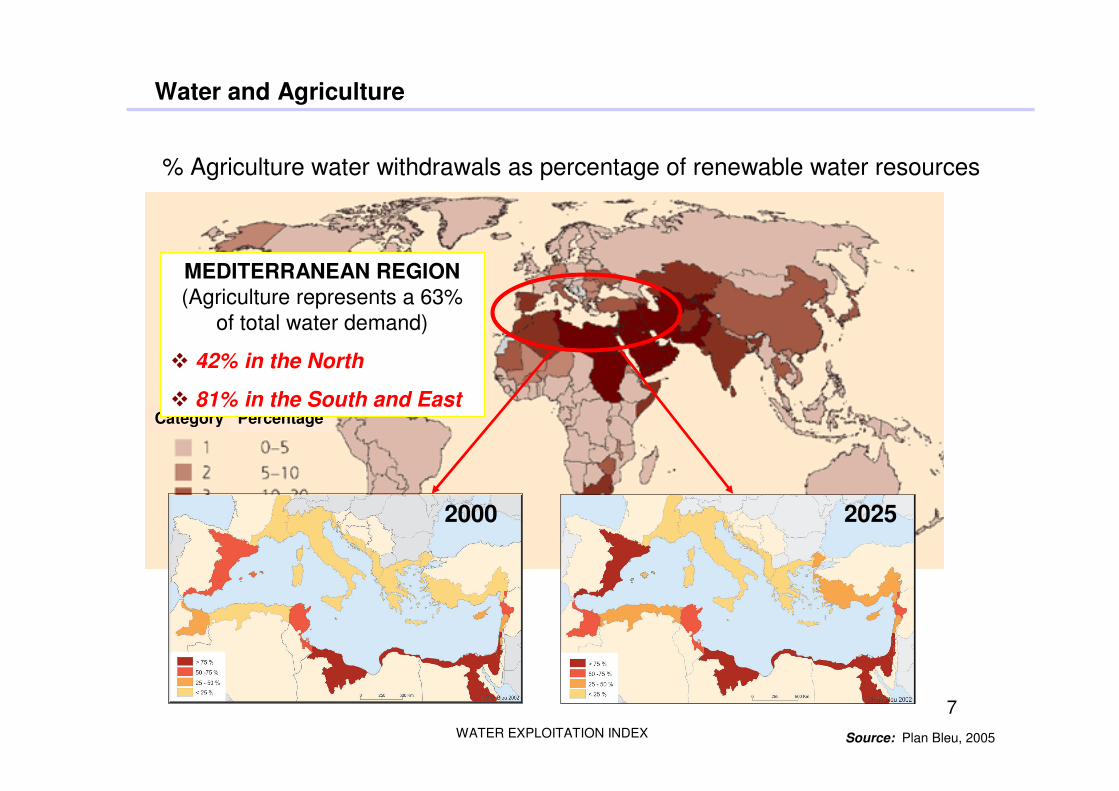
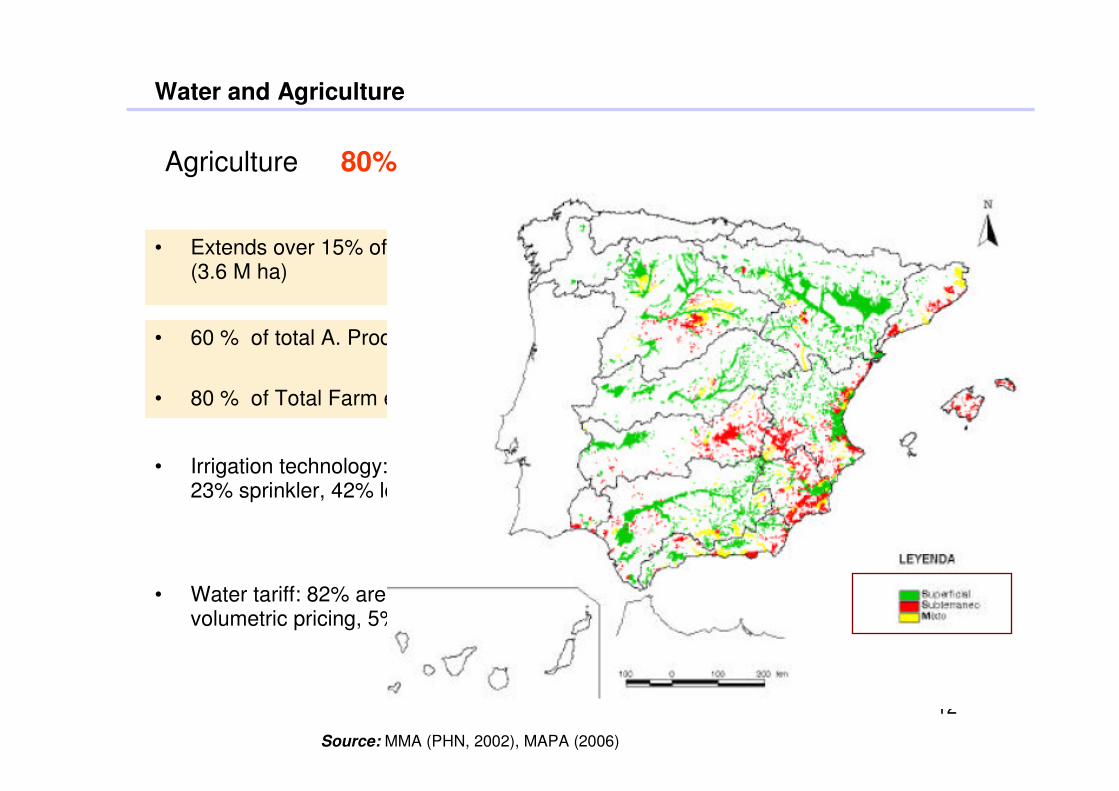
Water and Agriculture
% Agriculture water withdrawals as percentage of renewable water resources
Category Percentage
MEDITERRANEAN REGION (Agriculture represents a 63%
of total water demand)
: 42% in the North
: 81% in the South and East
Source: FAO, 2002
6
Source: FAO, 2002
Water and Agriculture
% Agriculture water withdrawals as percentage of renewable water resources
Category Percentage
MEDITERRANEAN REGION (Agriculture represents a 63%
of total water demand)
: 42% in the North
: 81% in the South and East
2000 2025
WATER EXPLOITATION INDEX Source: Plan Bleu, 2005
7
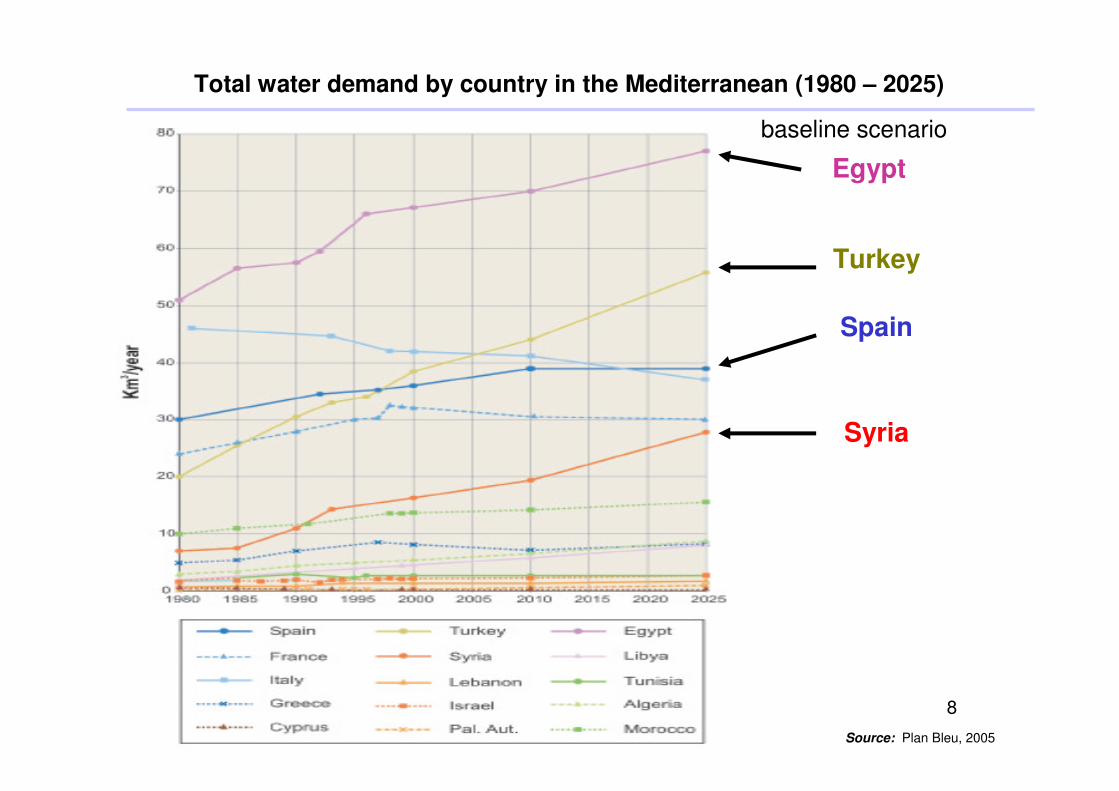
Total water demand by country in the Mediterranean (1980 – 2025)
baseline scenario
Egypt
Turkey
Spain
Syria
8
Source: Plan Bleu, 2005
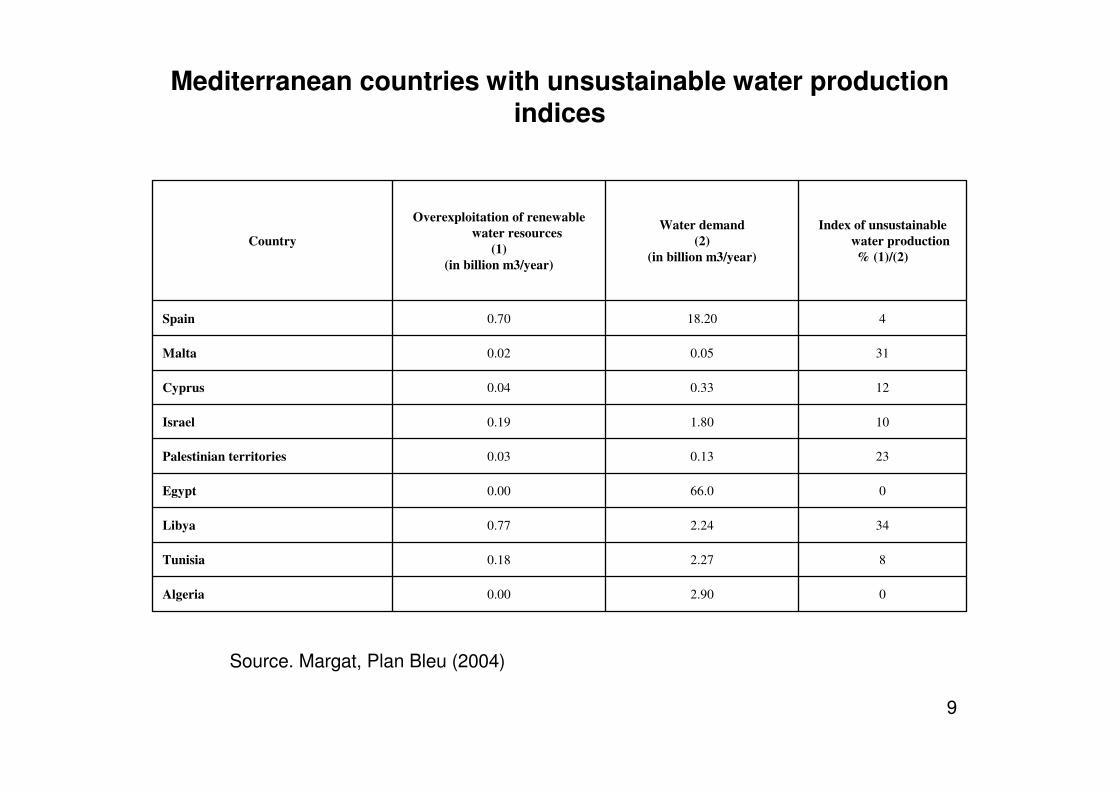
Mediterranean countries with unsustainable water production indices
Country
Spain
Malta
Cyprus
Israel
Palestinian territories
Egypt
Libya
Tunisia
Algeria
Overexploitation of renewable
water resources
(1)
(in billion m3/year)
0.70
0.02
0.04
0.19
0.03
0.00
0.77
0.18
0.00
Water demand
(2)
(in billion m3/year)
18.20
0.05
0.33
1.80
0.13
66.0
2.24
2.27
2.90
Index of unsustainable
water production
% (1)/(2)
4
31
12
10
23
0
34
8
0
Source. Margat, Plan Bleu (2004)
9
10
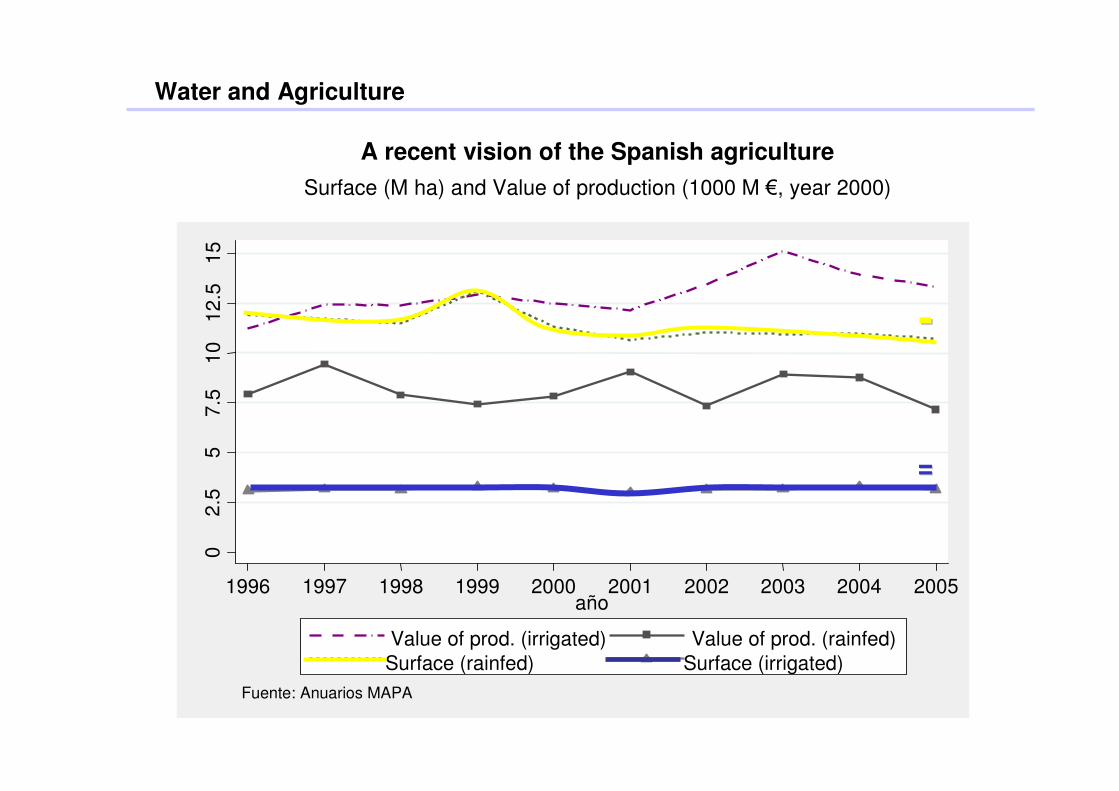
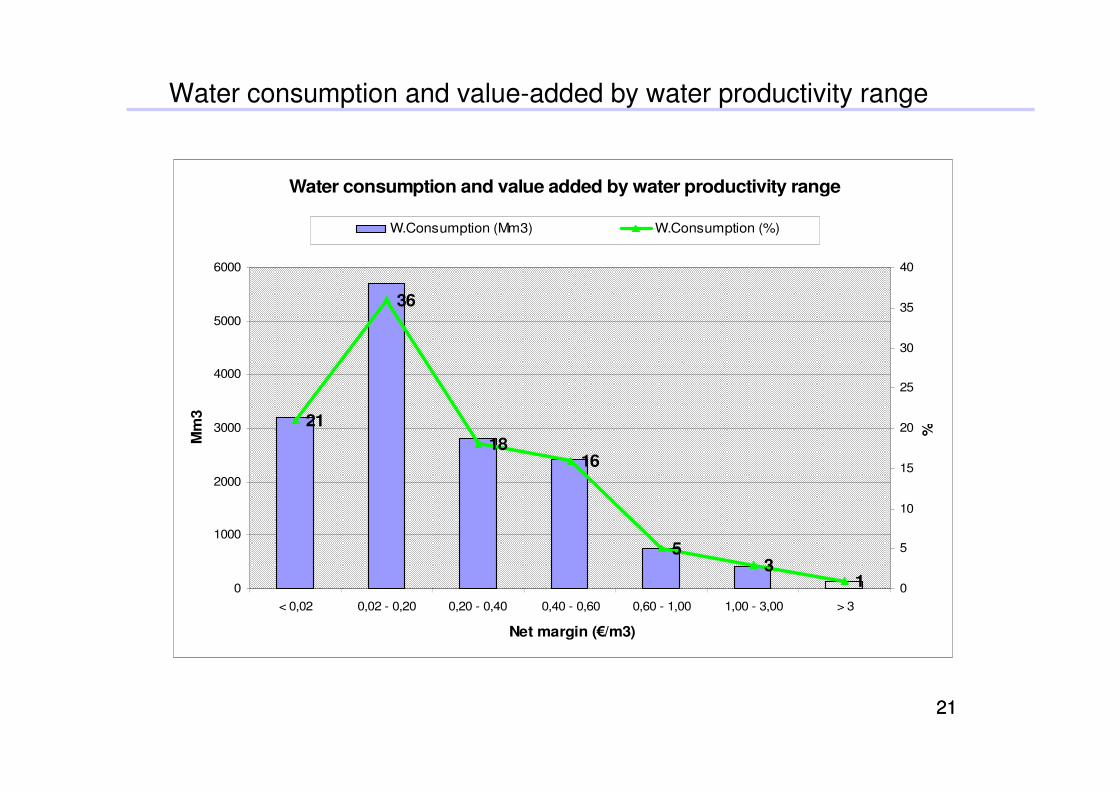
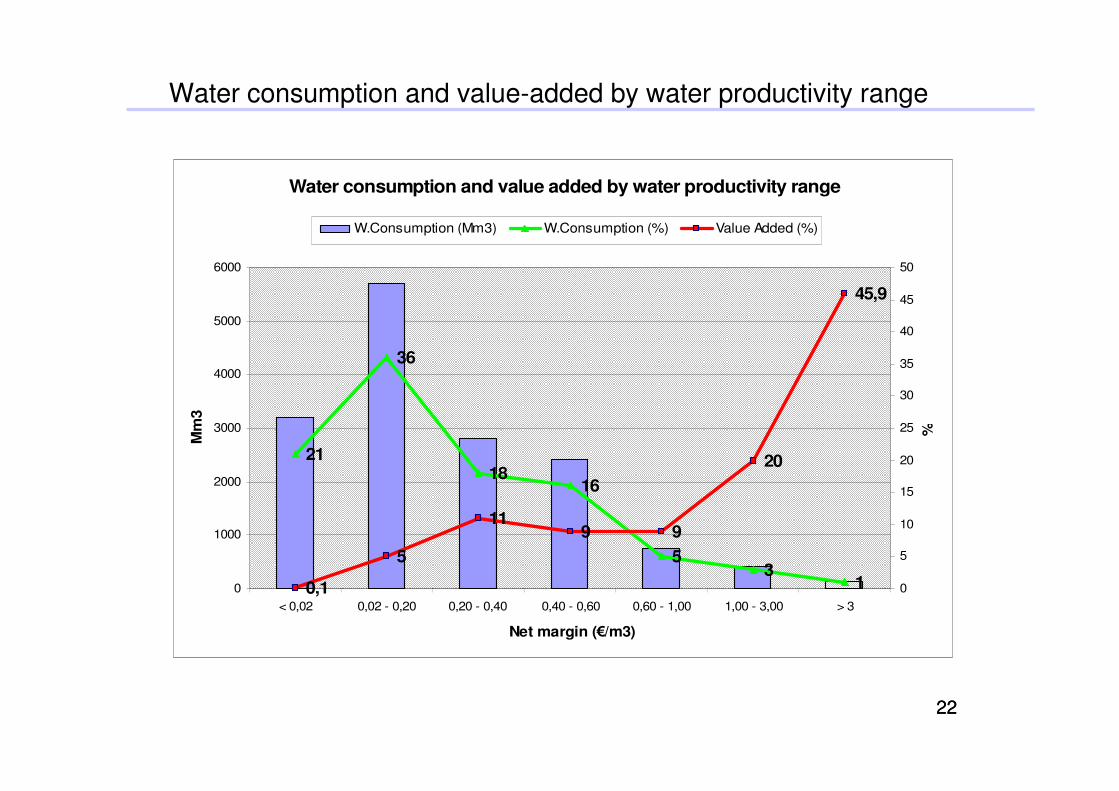
Water and Agriculture
A recent vision of the Spanish agriculture
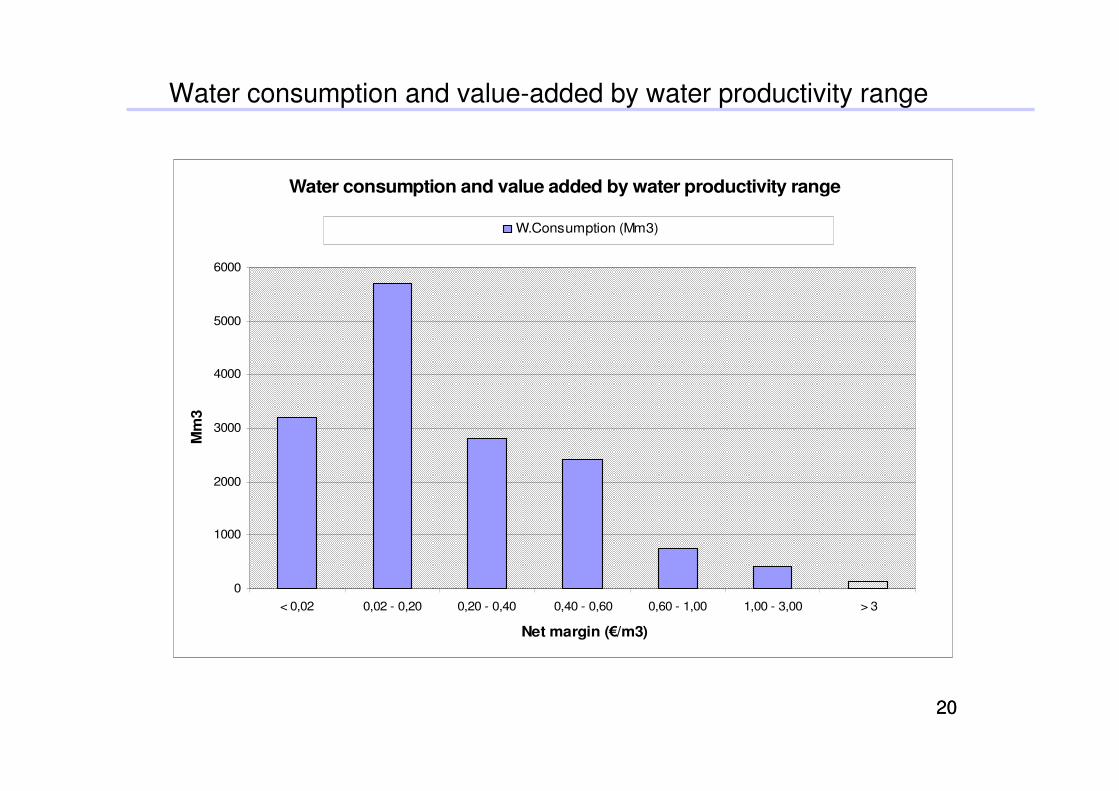
Surface (M ha) and Value of production (1000 M €, year 2000) 0
W.Consumption (Mm3) W.Consumption (%) Value Added (%)
2222
y e s or e per o -
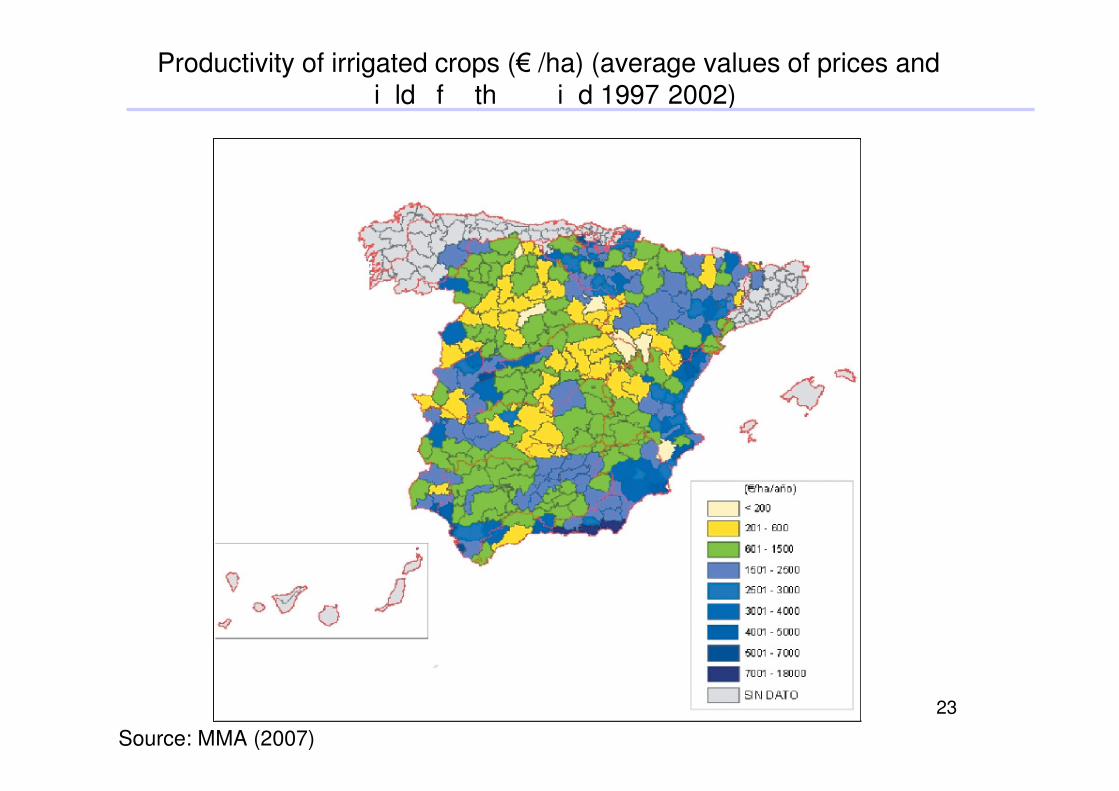
Productivity of irrigated crops (€ /ha) (average values of prices and i ld f th i d 1997 2002)
23
Source: MMA (2007)
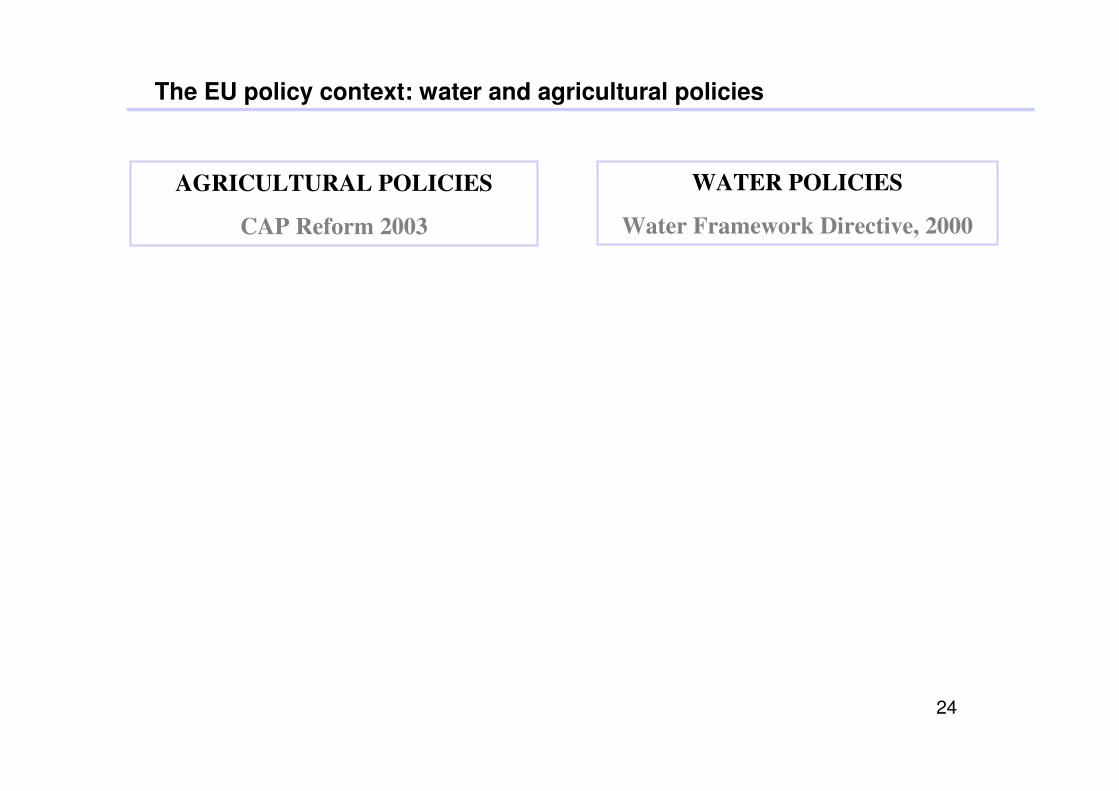
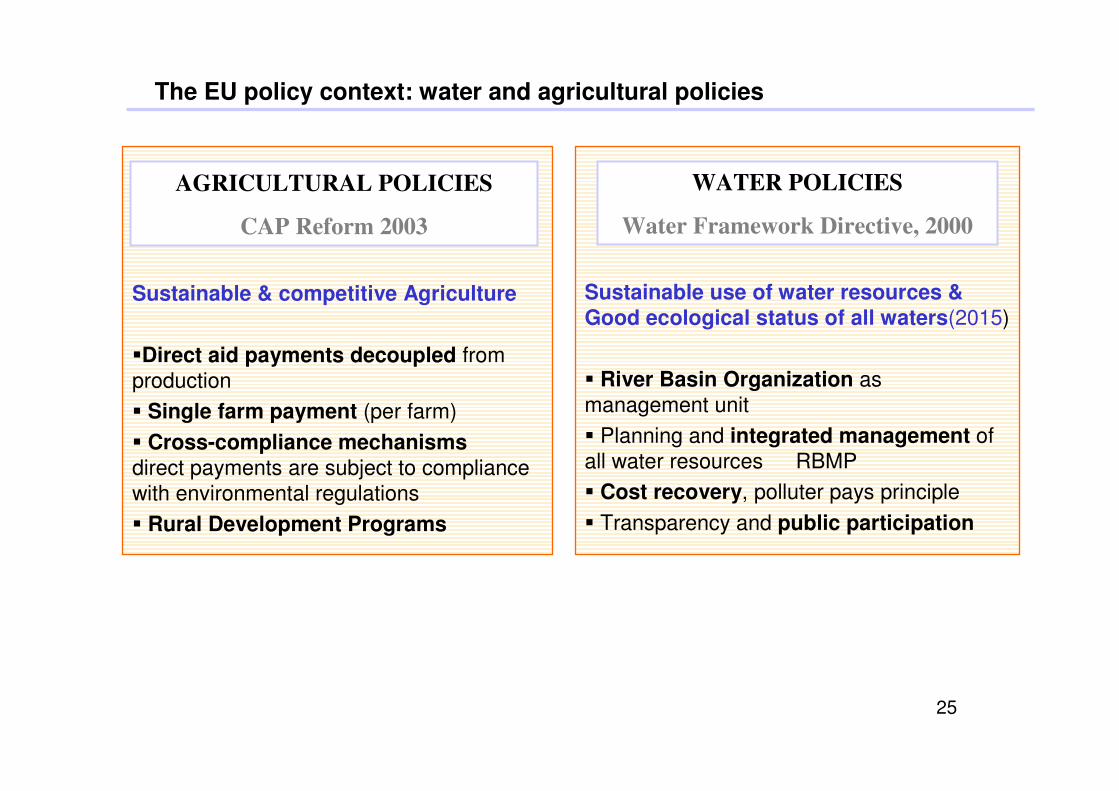
The EU policy context: water and agricultural policies
AGRICULTURAL POLICIES
CAP Reform 2003
WATER POLICIES
Water Framework Directive, 2000
24
The EU policy context: water and agricultural policies
Sustainable & competitive Agriculture
•Direct aid payments decoupled from
production
• Single farm payment (per farm)
• Cross-compliance mechanisms direct payments are subject to compliance
with environmental regulations
• Rural Development Programs
Sustainable use of water resources & Good ecological status of all waters(2015)
• River Basin Organization as
management unit
• Planning and integrated management of
all water resources RBMP
• Cost recovery, polluter pays principle
• Transparency and public participation
AGRICULTURAL POLICIES
CAP Reform 2003
WATER POLICIES
Water Framework Directive, 2000
25
The EU policy context: water and agricultural policies
Sustainable & competitive Agriculture
•Direct aid payments decoupled from
production
• Single farm payment (per farm)
• Cross-compliance mechanisms direct payments are subject to compliance
with environmental regulations
• Rural Development Programs
Sustainable use of water resources & Good ecological status of all waters(2015)
• River Basin Organization as
management unit
• Planning and integrated management of
all water resources RBMP
• Cost recovery, polluter pays principle
• Transparency and public participation
AGRICULTURAL POLICIES
CAP Reform 2003
WATER POLICIES
Water Framework Directive, 2000
IRRIGATED AGRICULTURE
Multifunctional Competitive
26 Environmentally sustainable
Adaptable to new challenges (i.e. climate change)
The EU policy context: water and agricultural policies
Sustainable & competitive Agriculture
•Direct aid payments decoupled from
production
• Single farm payment (per farm)
• Cross-compliance mechanisms direct payments are subject to compliance
with environmental regulations
• Rural Development Programs
Sustainable use of water resources & Good ecological status of all waters(2015)
• River Basin Organization as
management unit
• Planning and integrated management of
all water resources RBMP
• Cost recovery, polluter pays principle
• Transparency and public participation
AGRICULTURAL POLICIES
CAP Reform 2003
WATER POLICIES
Water Framework Directive, 2000
IRRIGATED AGRICULTURE
Multifunctional Competitive
27 Environmentally sustainable
Adaptable to new challenges (i.e. climate change)
Agriculture
upled from
r farm)
Sustainable use of Good ecological sta
• River Basin Organ
management unit
• Plannin and inte
The EU policy context: water and agricultural policies
Sustainable & competitive
•Direct aid payments deco production
• Single farm payment (pe
• Cross-compliance mechanisms direct payments are subject to compliance
with environmental regulations
• Rural Development Programs
water resources & tus of all waters(2015)
ization as
g grated management of
all water resources RBMP
• Cost recovery, polluter pays principle
• Transparency and public participation
AGRICULTURAL POLICIES
CAP Reform 2003
WATER POLICIES
Water Framework Directive, 2000
IRRIGATED AGRICULTURE
CAP ‘HEALTH CHECK’ 2009…
•Water management
•Climate change
•Biofuels
Multifunctional Competitive
28 Environmentally sustainable
Adaptable to new challenges (i.e. climate change)
• River B
managem
The EU policy context: water and agricultural policies
29
Sustainable & competitive Agriculture
•Direct aid payments decoupled from
production
• Single farm payment (per farm)
• Cross-compliance mechanisms direct payments are subject to compliance
with environmental regulations
• Rural Development Programs
Sustainable use of water resources & Good ecological status of all waters(2015)
asin Organization as
ent unit
• Planning and integrated management of
all water resources RBMP
• Cost recovery, polluter pays principle
• Transparency and public participation
AGRICULTURAL POLICIES
CAP Reform 2003
WATER POLICIES
Water Framework Directive, 2000
Multifunctional Competitive
Environmentally sustainable
Adaptable to new challenges (i.e. climate change)
National Policies
IRRIGATED AGRICULTURE
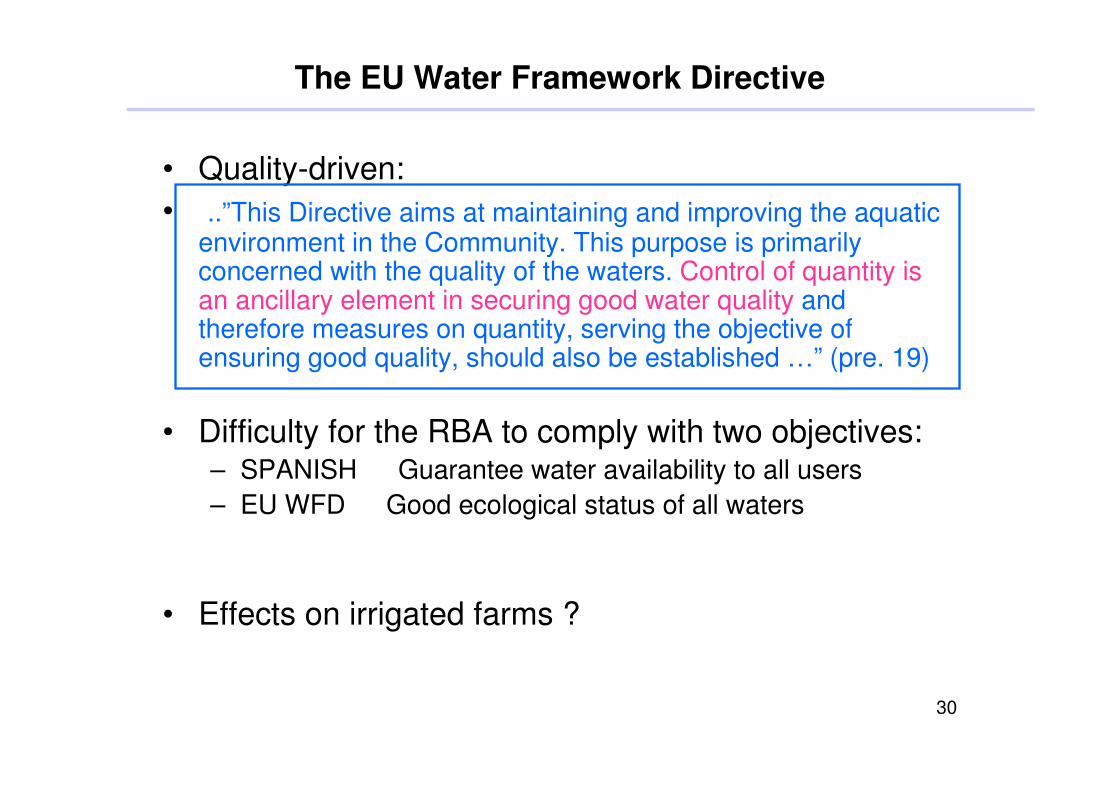
The EU Water Framework Directive
• Quality-driven:
• ..”This Directive aims at maintaining and improving the aquatic environment in the Community. This purpose is primarily concerned with the quality of the waters. Control of quantity is an ancillary element in securing good water quality and therefore measures on quantity, serving the objective of ensuring good quality, should also be established …” (pre. 19)
• Difficulty for the RBA to comply with two objectives: – SPANISH Guarantee water availability to all users
– EU WFD Good ecological status of all waters
• Effects on irrigated farms ?
30
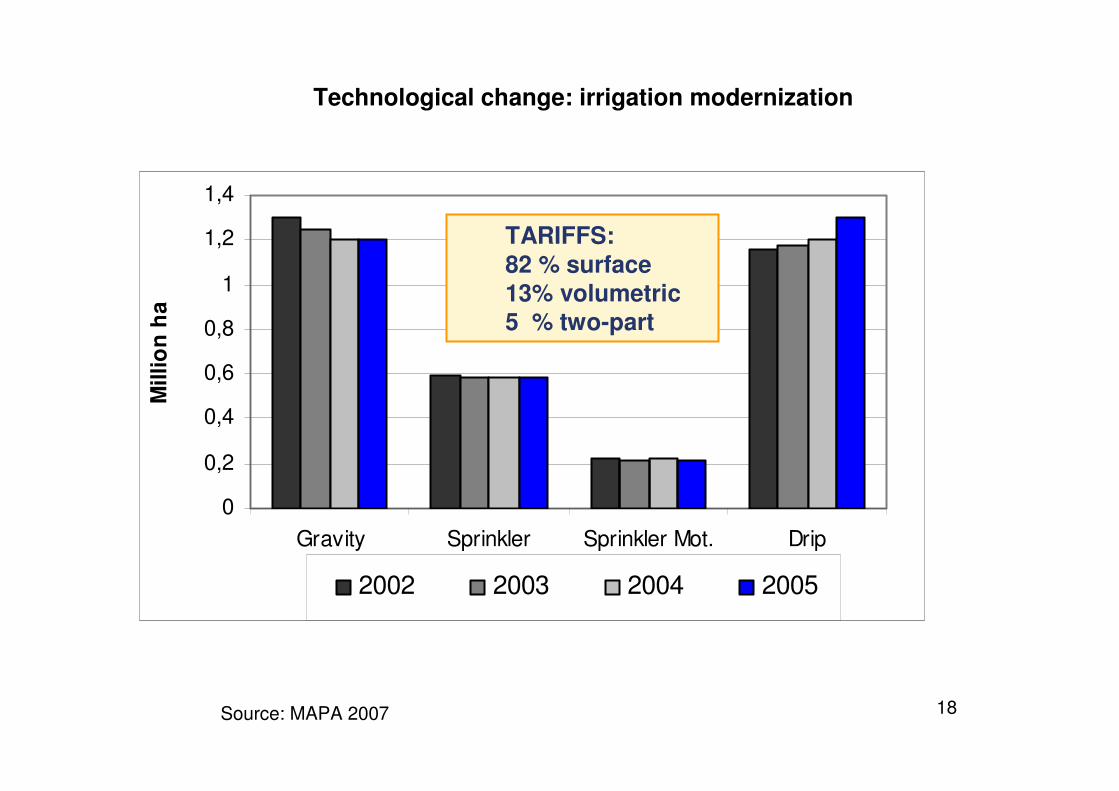
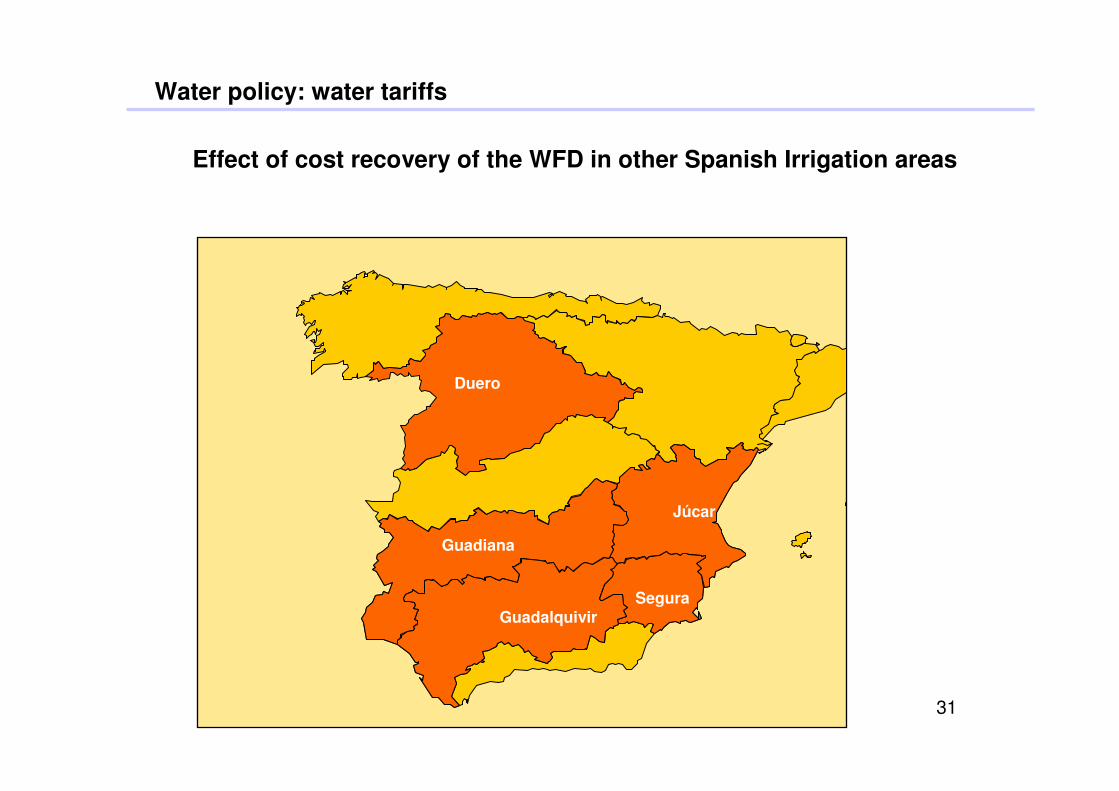
Water policy: water tariffs
Effect of cost recovery of the WFD in other Spanish Irrigation areas
Duero
Segura
Júcar
Guadalquivir
Guadiana
31
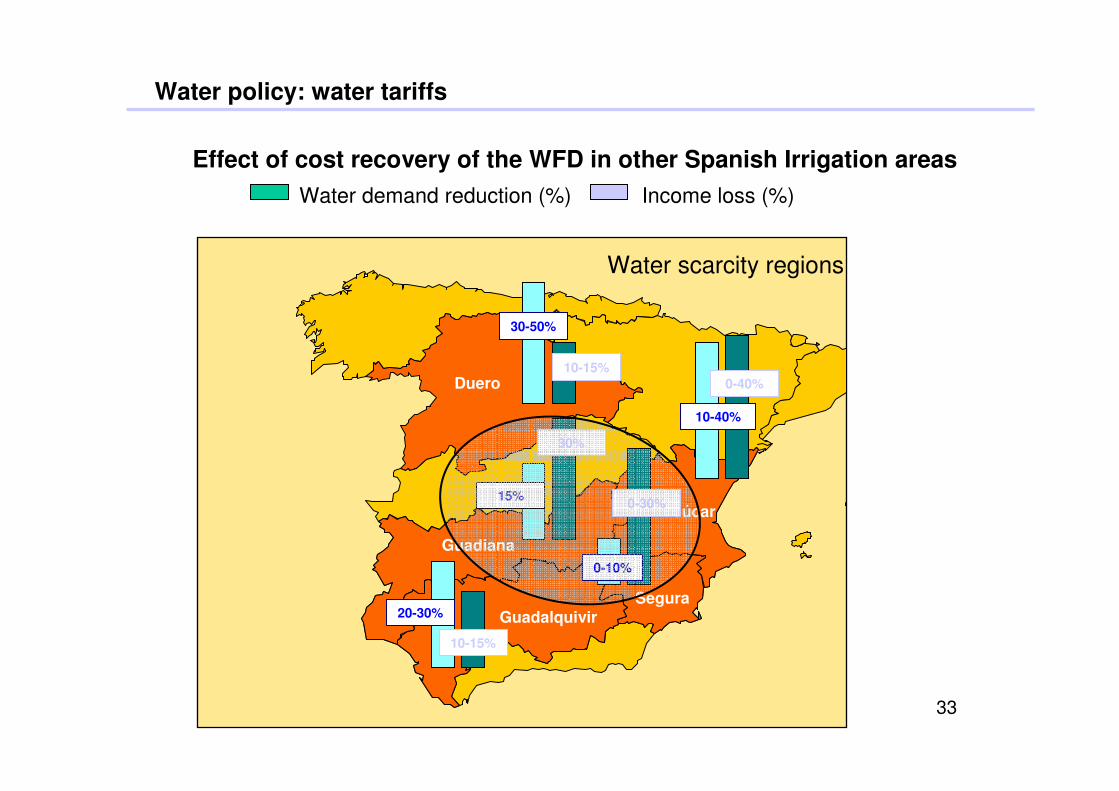
Water policy: water tariffs
Effect of cost recovery of the WFD in other Spanish Irrigation areas
Water demand reduction (%) Income loss (%)
Duero
Segura
Júcar
Guadalquivir
Guadiana
30-50%
10-15%
10-40%
0-40%
30%
20-30%
10-15%
0-10%
0-30%
Water scarcity regions
15%
32
Water policy: water tariffs
Effect of cost recovery of the WFD in other Spanish Irrigation areas
Water demand reduction (%) Income loss (%)
Duero
Segura
Júcar
Guadalquivir
Guadiana
30-50%
10-15%
10-40%
0-40%
30%
20-30%
10-15%
0-10%
0-30%
Water scarcity regions
15%
33
THE EU COMMON AGRICULTURAL POLICY (CAP)
• Effects on land use and cropping patterns
• Can the CAP reform induce water savings?
• The ‘water dimension’ of the CAP
34
Win
ter ce
real
s
Mai
ze
Legu
mes
Tube
r crop
s In
dust
rial c
rops
Forra
gecr
ops
Hor
ticul
ture
Citr
us Fru
ittre
es
Vine
Oliv
e
35
Effects of the CAP reform: Changes in crop surface
Source: Data from MAPA (2007)
Spain - Irrigated crops
0
100
200
300
400
500
600
Su
rfac
e (x
1000
ha)
2004
2006
XX
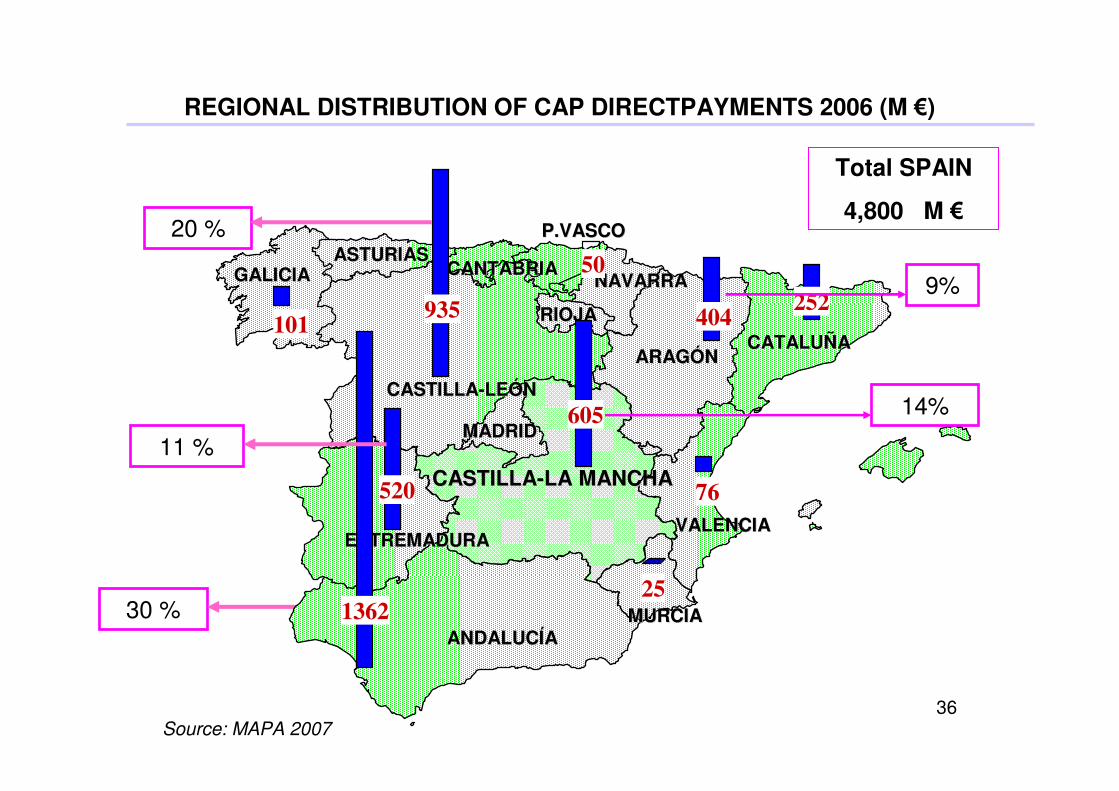
REGIONAL DISTRIBUTION OF CAP DIRECTPAYMENTS 2006 (M €)
36
30 %
Source: MAPA 2007
ASTURIASASTURIAS GALICIAGALICIA
ARAGARAGÓÓNN CATALUCATALUÑÑAA
NAVARRANAVARRA
MADRIDMADRID
E TREMADURAE TREMADURA
ANDALUCANDALUCÍÍAA MURCIAMURCIA
VALENCIAVALENCIA
P.VASCOP.VASCO
RIOJARIOJA
CANTABRIACANTABRIA
CASTILLACASTILLA--LELEÓÓNN
CASTILLACASTILLA--LA MANCHALA MANCHA
605
1362
404935
520
252
76
25
101
50
Total SPAIN
4,800 M €
14%
20 %
11 %
9%
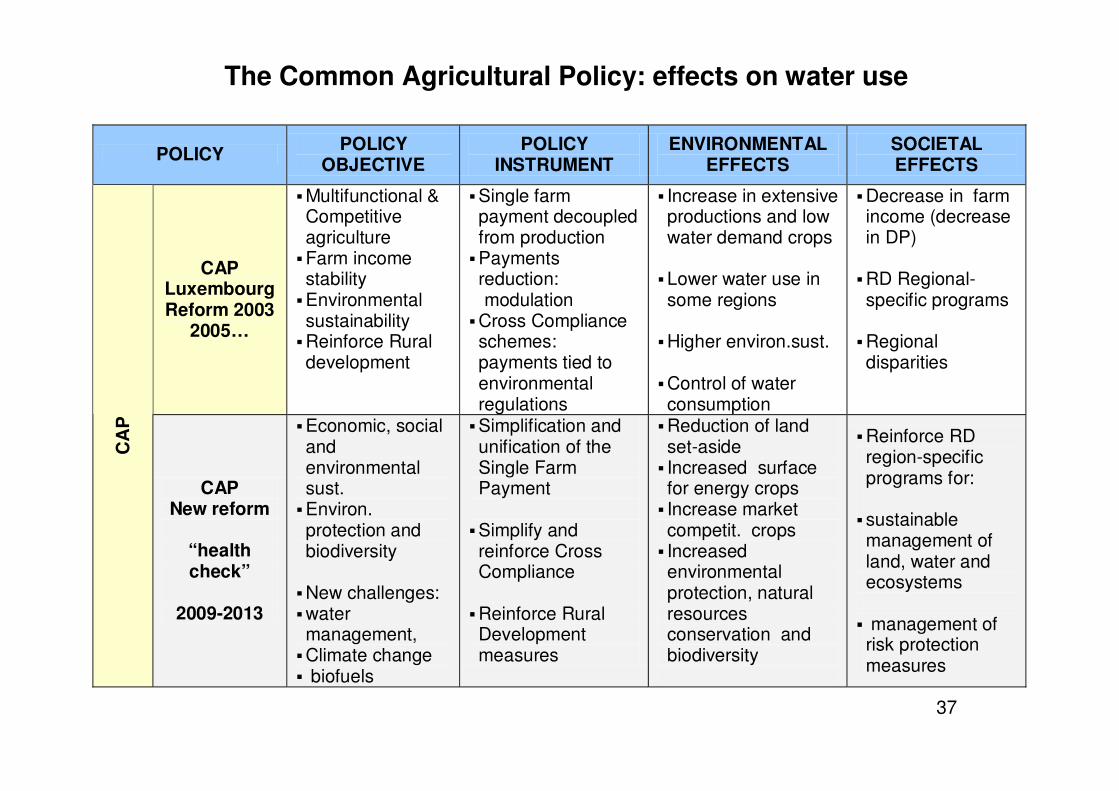
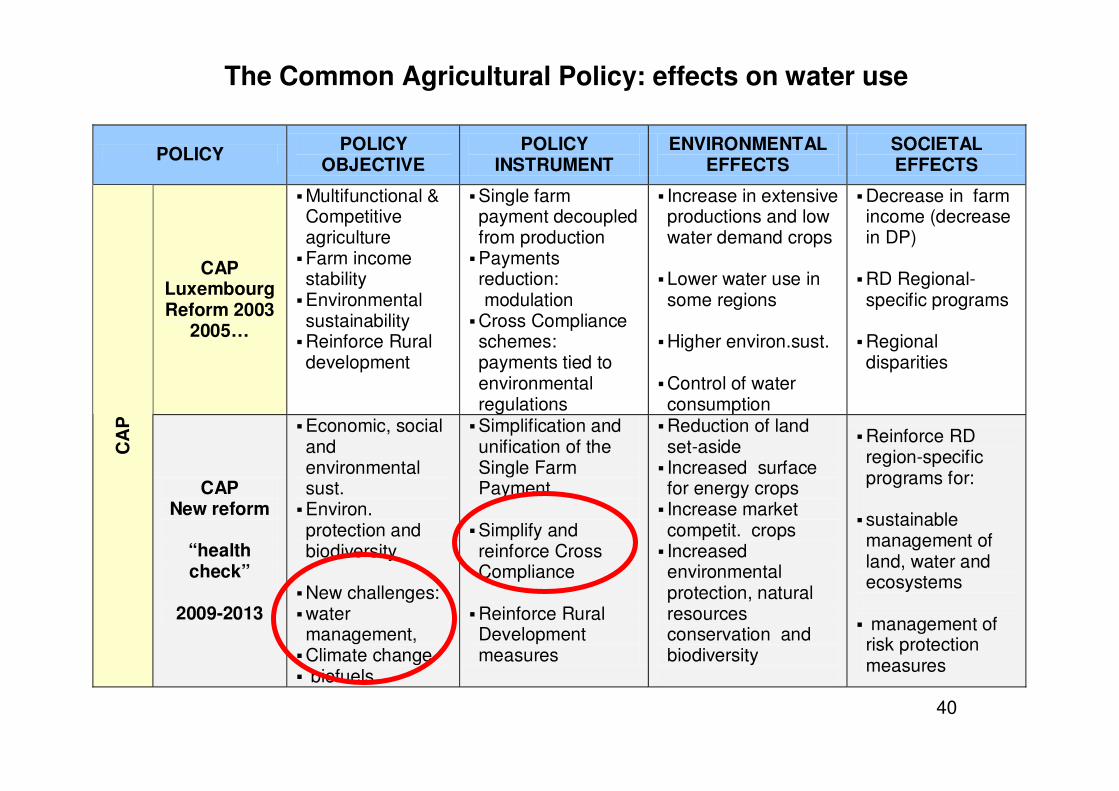
The Common Agricultural Policy: effects on water use
POLICY POLICY OBJECTIVE
POLICY INSTRUMENT
ENVIRONMENTAL EFFECTS
SOCIETAL EFFECTS
CAP Luxembourg Reform 2003
2005…
• Multifunctional & Competitive agriculture • Farm income stability • Environmental sustainability • Reinforce Rural development
• Single farm payment decoupled from production • Payments reduction: modulation
• Cross Compliance schemes: payments tied to environmental regulations
• Increase in extensive productions and low water demand crops
• Lower water use in some regions
• Higher environ.sust.
• Control of water consumption
• Decrease in farm income (decrease in DP)
• RD Regionalspecific programs
• Regional disparities
CA
P
CAP New reform
“health check”
2009-2013
• Economic, social and environmental sust. • Environ. protection and biodiversity
• New challenges: • water management, • Climate change • biofuels
• Simplification and unification of the Single Farm Payment
• Simplify and reinforce Cross Compliance
• Reinforce Rural Development measures
• Reduction of land set-aside • Increased surface for energy crops • Increase market competit. crops • Increased environmental protection, natural resources conservation and biodiversity
• Reinforce RD region-specific programs for:
• sustainable management of land, water and ecosystems
• management of risk protection measures
37
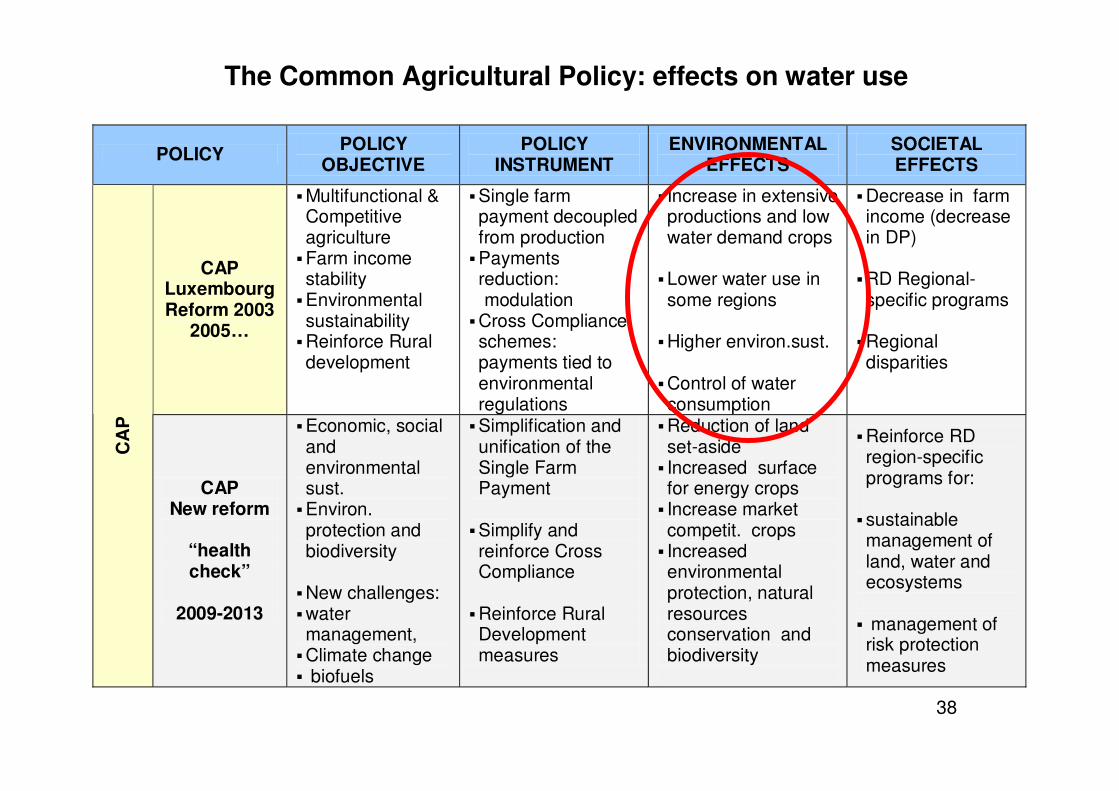
The Common Agricultural Policy: effects on water use
POLICY POLICY OBJECTIVE
POLICY INSTRUMENT
ENVIRONMENTAL EFFECTS
SOCIETAL EFFECTS
CAP Luxembourg Reform 2003
2005…
• Multifunctional & Competitive agriculture • Farm income stability • Environmental sustainability • Reinforce Rural development
• Single farm payment decoupled from production • Payments reduction: modulation
• Cross Compliance schemes: payments tied to environmental regulations
• Increase in extensive productions and low water demand crops
• Lower water use in some regions
• Higher environ.sust.
• Control of water consumption
• Decrease in farm income (decrease in DP)
• RD Regionalspecific programs
• Regional disparities
CA
P
CAP New reform
“health check”
2009-2013
• Economic, social and environmental sust. • Environ. protection and biodiversity
• New challenges: • water management, • Climate change • biofuels
• Simplification and unification of the Single Farm Payment
• Simplify and reinforce Cross Compliance
• Reinforce Rural Development measures
• Reduction of land set-aside • Increased surface for energy crops • Increase market competit. crops • Increased environmental protection, natural resources conservation and biodiversity
• Reinforce RD region-specific programs for:
• sustainable management of land, water and ecosystems
• management of risk protection measures
38
The Common Agricultural Policy: effects on water use
POLICY POLICY OBJECTIVE
POLICY INSTRUMENT
ENVIRONMENTAL EFFECTS
SOCIETAL EFFECTS
CAP Luxembourg Reform 2003
2005…
• Multifunctional & Competitive agriculture • Farm income stability • Environmental sustainability • Reinforce Rural development
• Single farm payment decoupled from production • Payments reduction: modulation
• Cross Compliance schemes: payments tied to environmental regulations
• Increase in extensive productions and low water demand crops
• Lower water use in some regions
• Higher environ.sust.
• Control of water consumption
• Decrease in farm income (decrease in DP)
• RD Regionalspecific programs
• Regional disparities
CA
P
CAP New reform
“health check”
2009-2013
• Economic, social and environmental sust. • Environ. protection and biodiversity
• New challenges: • water management, • Climate change • biofuels
• Simplification and unification of the Single Farm Payment
• Simplify and reinforce Cross Compliance
• Reinforce Rural Development measures
• Reduction of land set-aside • Increased surface for energy crops • Increase market competit. crops • Increased environmental protection, natural resources conservation and biodiversity
• Reinforce RD region-specific programs for:
• sustainable management of land, water and ecosystems
• management of risk protection measures
39
The Common Agricultural Policy: effects on water use
POLICY POLICY OBJECTIVE
POLICY INSTRUMENT
ENVIRONMENTAL EFFECTS
SOCIETAL EFFECTS
CAP Luxembourg Reform 2003
2005…
• Multifunctional & Competitive agriculture • Farm income stability • Environmental sustainability • Reinforce Rural development
• Single farm payment decoupled from production • Payments reduction: modulation
• Cross Compliance schemes: payments tied to environmental regulations
• Increase in extensive productions and low water demand crops
• Lower water use in some regions
• Higher environ.sust.
• Control of water consumption
• Decrease in farm income (decrease in DP)
• RD Regionalspecific programs
• Regional disparities
CA
P
CAP New reform
“health check”
2009-2013
• Economic, social and environmental sust. • Environ. protection and biodiversity
• New challenges: • water management, • Climate change • biofuels
• Simplification and unification of the Single Farm Payment
• Simplify and reinforce Cross Compliance
• Reinforce Rural Development measures
• Reduction of land set-aside • Increased surface for energy crops • Increase market competit. crops • Increased environmental protection, natural resources conservation and biodiversity
• Reinforce RD region-specific programs for:
• sustainable management of land, water and ecosystems
• management of risk protection measures
40
The Common Agricultural Policy: effects on water use
POLICY POLICY OBJECTIVE
POLICY INSTRUMENT
ENVIRONMENTAL EFFECTS
SOCIETAL EFFECTS
CAP Luxembourg Reform 2003
2005…
• Multifunctional & Competitive agriculture • Farm income stability • Environmental sustainability • Reinforce Rural development
• Single farm payment decoupled from production • Payments reduction: modulation
• Cross Compliance schemes: payments tied to environmental regulations
• Increase in extensive productions and low water demand crops
• Lower water use in some regions
• Higher environ.sust.
• Control of water consumption
• Decrease in farm income (decrease in DP)
• RD Regionalspecific programs
• Regional disparities
CA
P
CAP New reform
“health check”
2009-2013
• Economic, social and environmental sust. • Environ. protection and biodiversity
• New challenges: • water management, • Climate change • biofuels
• Simplification and unification of the Single Farm Payment
• Simplify and reinforce Cross Compliance
• Reinforce Rural Development measures
• Reduction of land set-aside • Increased surface for energy crops • Increase market competit. crops • Increased environmental protection, natural resources conservation and biodiversity
• Reinforce RD region-specific programs for:
• sustainable management of land, water and ecosystems
• management of risk protection measures
41
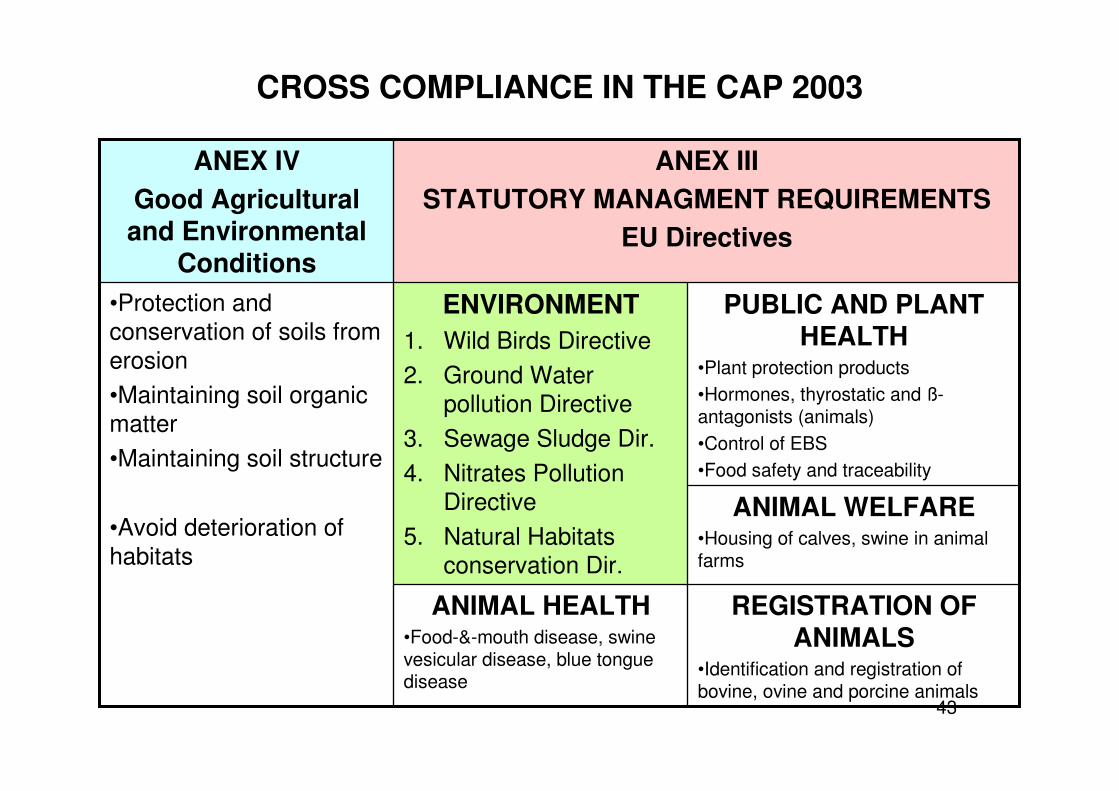
CROSS COMPLIANCE IN THE CAP 2003
42
REGISTRATION OF ANIMALS
•Identification and registration of bovine, ovine and porcine animals
ANIMAL HEALTH •Food-&-mouth disease, swine vesicular disease, blue tongue disease
ANIMAL WELFARE •Housing of calves, swine in animal farms
PUBLIC AND PLANT HEALTH
•Plant protection products
•Hormones, thyrostatic and ßantagonists (animals)
•Control of EBS
•Food safety and traceability
ENVIRONMENT 1. Wild Birds Directive
2. Ground Water
pollution Directive
3. Sewage Sludge Dir.
4. Nitrates Pollution
Directive
5. Natural Habitats
conservation Dir.
•Protection and
conservation of soils from
erosion
•Maintaining soil organic
matter
•Maintaining soil structure
•Avoid deterioration of
habitats
ANEX III STATUTORY MANAGMENT REQUIREMENTS
EU Directives
ANEX IV Good Agricultural and Environmental
Conditions
CROSS COMPLIANCE IN THE CAP 2003
43
REGISTRATION OF ANIMALS
•Identification and registration of bovine, ovine and porcine animals
ANIMAL HEALTH •Food-&-mouth disease, swine vesicular disease, blue tongue disease
ANIMAL WELFARE •Housing of calves, swine in animal farms
PUBLIC AND PLANT HEALTH
•Plant protection products
•Hormones, thyrostatic and ßantagonists (animals)
•Control of EBS
•Food safety and traceability
ENVIRONMENT 1. Wild Birds Directive
2. Ground Water
pollution Directive
3. Sewage Sludge Dir.
4. Nitrates Pollution
Directive
5. Natural Habitats
conservation Dir.
•Protection and
conservation of soils from
erosion
•Maintaining soil organic
matter
•Maintaining soil structure
•Avoid deterioration of
habitats
ANEX III STATUTORY MANAGMENT REQUIREMENTS
EU Directives
ANEX IV Good Agricultural and Environmental
Conditions
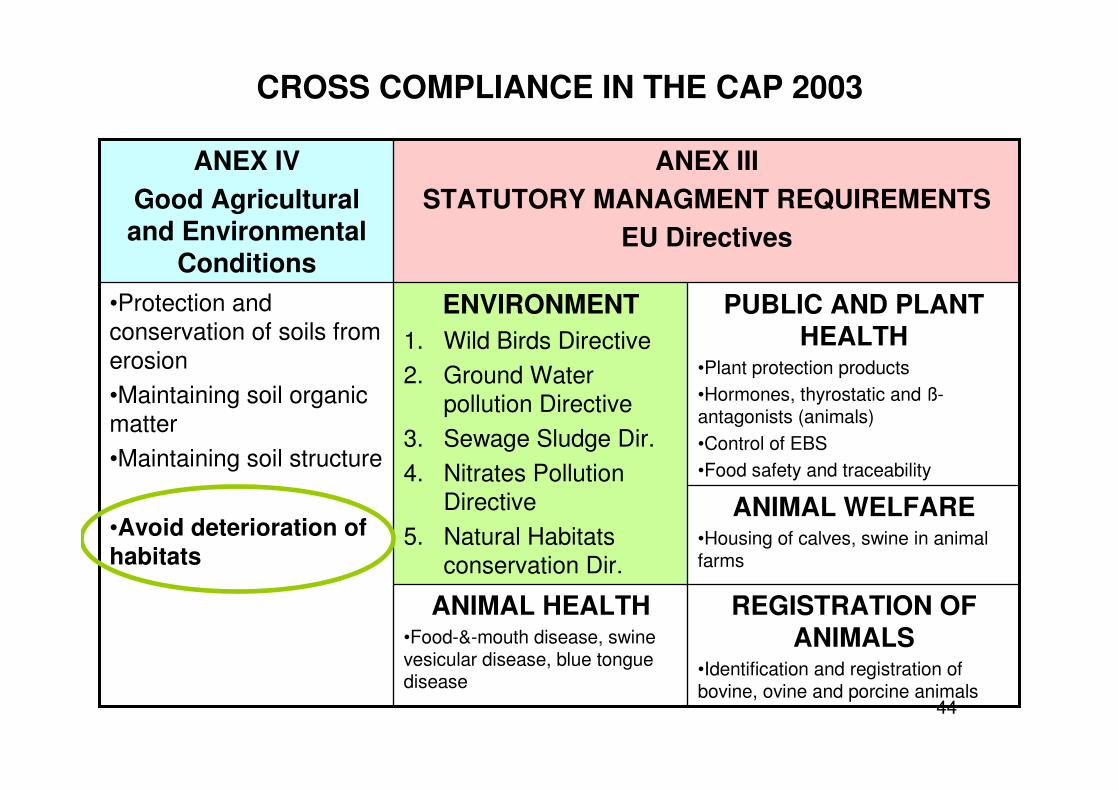
CROSS COMPLIANCE IN THE CAP 2003
44
REGISTRATION OF ANIMALS
•Identification and registration of bovine, ovine and porcine animals
ANIMAL HEALTH •Food-&-mouth disease, swine vesicular disease, blue tongue disease
ANIMAL WELFARE •Housing of calves, swine in animal farms
PUBLIC AND PLANT HEALTH
•Plant protection products
•Hormones, thyrostatic and ßantagonists (animals)
•Control of EBS
•Food safety and traceability
ENVIRONMENT 1. Wild Birds Directive
2. Ground Water
pollution Directive
3. Sewage Sludge Dir.
4. Nitrates Pollution
Directive
5. Natural Habitats
conservation Dir.
•Protection and
conservation of soils from
erosion
•Maintaining soil organic
matter
•Maintaining soil structure
•Avoid deterioration of habitats
ANEX III STATUTORY MANAGMENT REQUIREMENTS
EU Directives
ANEX IV Good Agricultural and Environmental
Conditions
CROSS COMPLIANCE IN THE CAP 2003
45
REGISTRATION OF ANIMALS
•Identification and registration of bovine, ovine and porcine animals
ANIMAL HEALTH •Food-&-mouth disease, swine vesicular disease, blue tongue disease
ANIMAL WELFARE •Housing of calves, swine in animal farms
PUBLIC AND PLANT HEALTH
•Plant protection products
•Hormones, thyrostatic and ßantagonists (animals)
•Control of EBS
•Food safety and traceability
ENVIRONMENT 1. Wild Birds Directive
2. Ground Water
pollution Directive
3. Sewage Sludge Dir.
4. Nitrates Pollution
Directive
5. Natural Habitats
conservation Dir.
•Protection and
conservation of soils from
erosion
•Maintaining soil organic
matter
•Maintaining soil structure
•Avoid deterioration of habitats
ANEX III STATUTORY MANAGMENT REQUIREMENTS
EU Directives
ANEX IV Good Agricultural and Environmental
Conditions
Overexploited aquifers
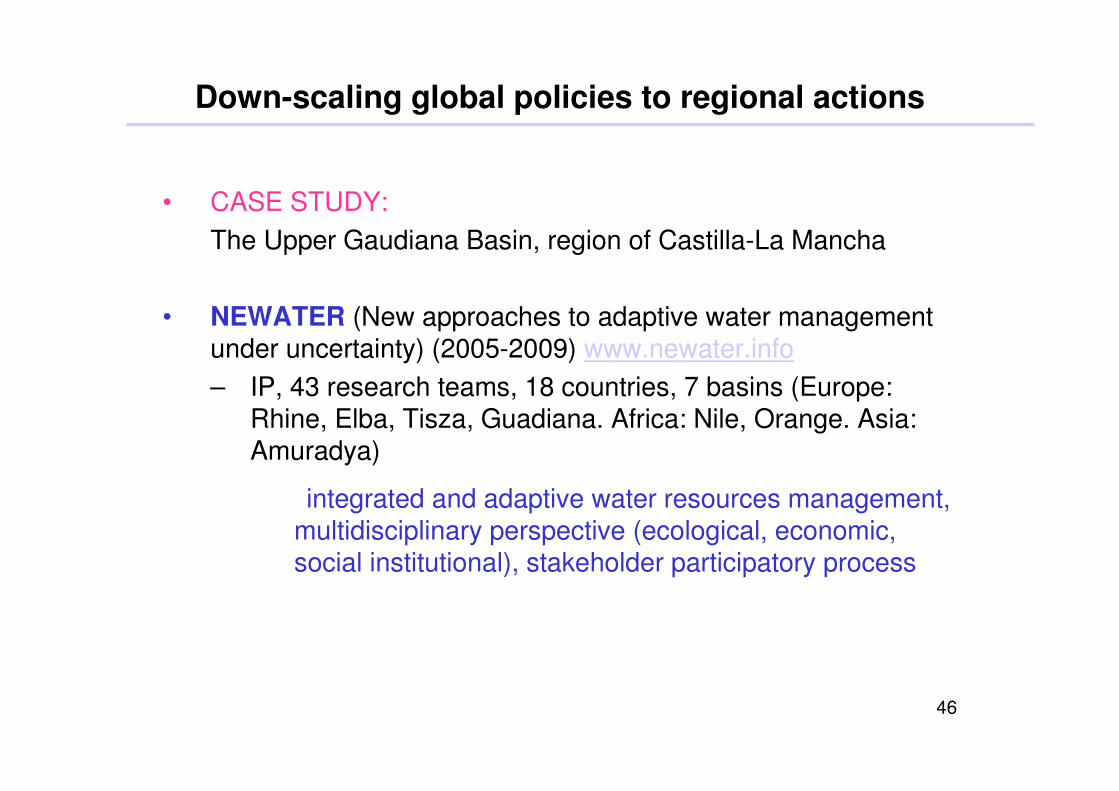
Down-scaling global policies to regional actions
• CASE STUDY:
The Upper Gaudiana Basin, region of Castilla-La Mancha
• NEWATER (New approaches to adaptive water management under uncertainty) (2005-2009) www.newater.info
– IP, 43 research teams, 18 countries, 7 basins (Europe: Rhine, Elba, Tisza, Guadiana. Africa: Nile, Orange. Asia: Amuradya)
integrated and adaptive water resources management, multidisciplinary perspective (ecological, economic, social institutional), stakeholder participatory process
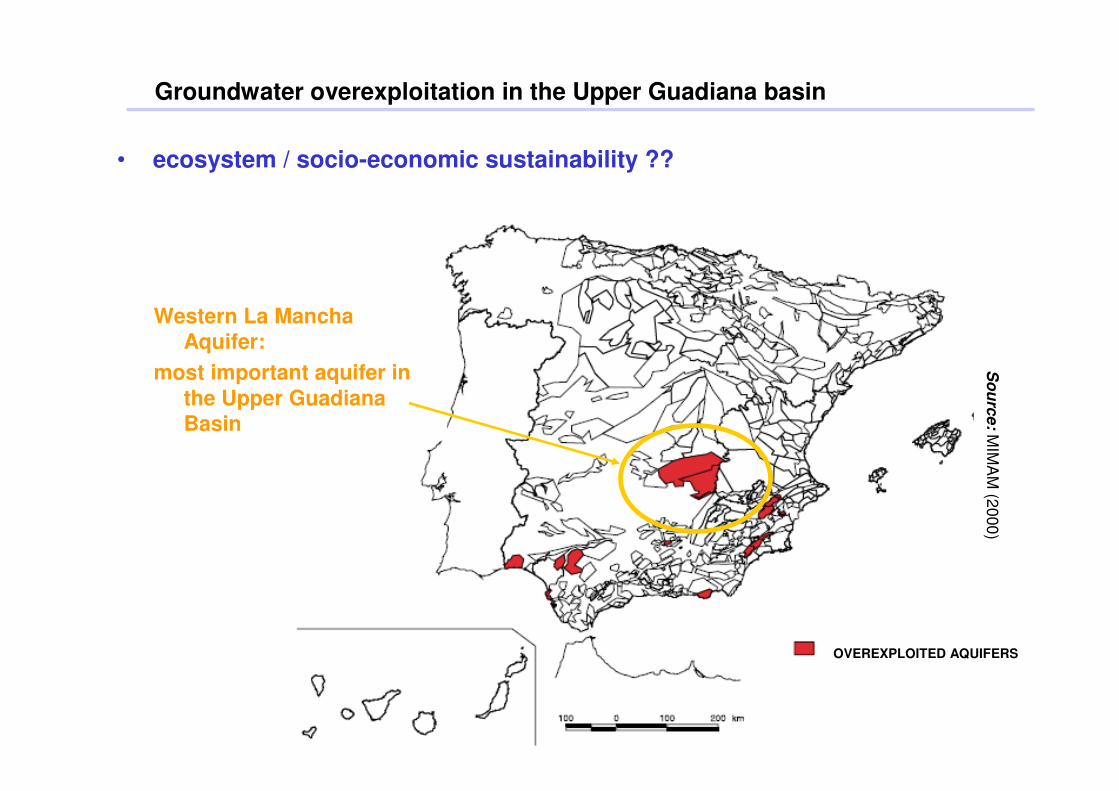
Groundwater overexploitation in the Upper Guadiana basin
• ecosystem / socio-economic sustainability ??
OVEREXPLOITED AQUIFERS
Western La Mancha Aquifer:
most important aquifer in the Upper Guadiana Basin
So
urc
e: M
IMA
M (2
000
)
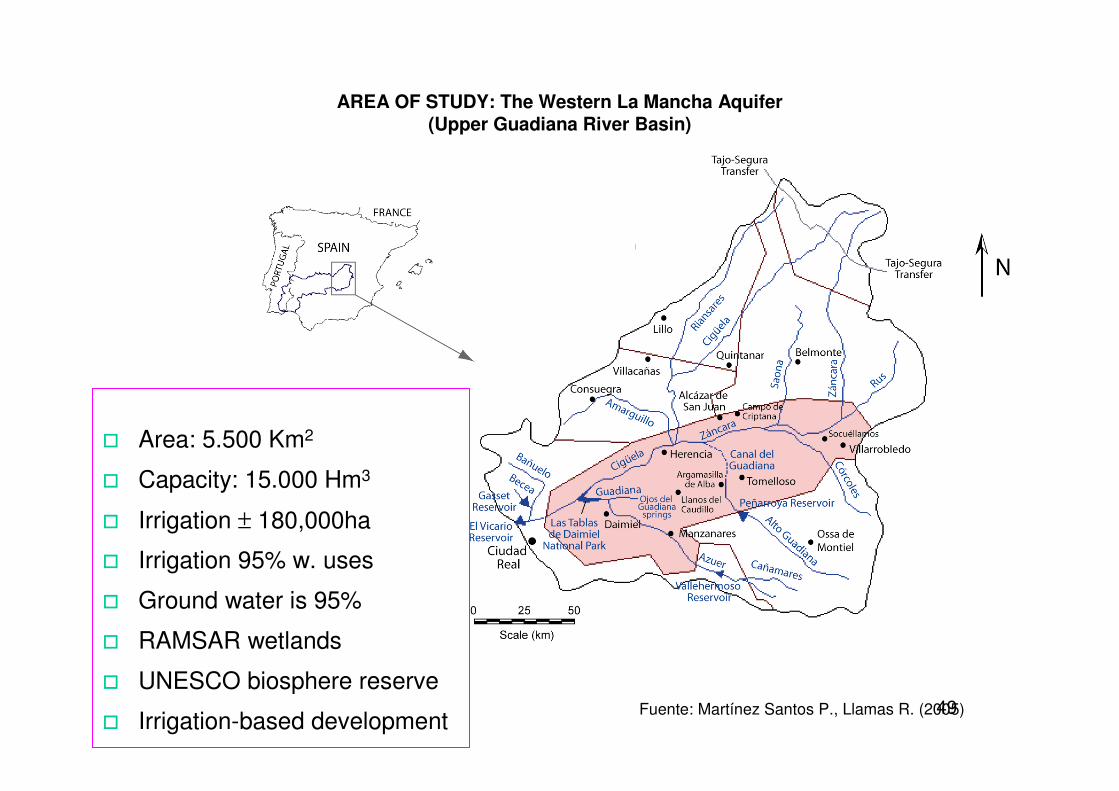
AREA OF STUDY: The Western La Mancha Aquifer (Upper Guadiana River Basin)
O Area: 5.500 Km2
O Capacity: 15.000 Hm3
O Irrigation ± 180,000ha
O Irrigation 95% w. uses
O Ground water is 95%
O RAMSAR wetlands
O UNESCO biosphere reserve
O Irrigation-based development Fuente: Martínez Santos P., Llamas R. (2005) 49
05) 5
Fuente: Martínez Santos P., Llamas R. (20
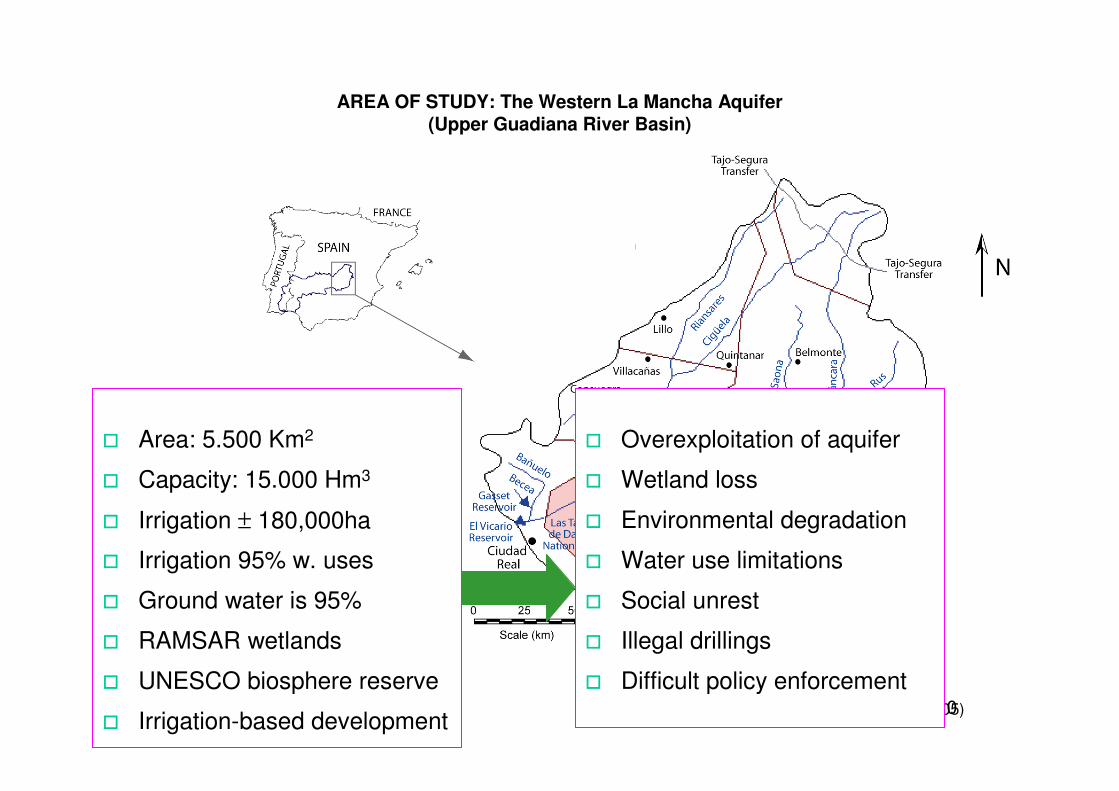
AREA OF STUDY: The Western La Mancha Aquifer (Upper Guadiana River Basin)
O Area: 5.500 Km2
O Capacity: 15.000 Hm3
O Irrigation ± 180,000ha
O Irrigation 95% w. uses
O Ground water is 95%
O RAMSAR wetlands
O UNESCO biosphere reserve
O Irrigation-based development
O Overexploitation of aquifer
O Wetland loss
O Environmental degradation
O Water use limitations
O Social unrest
O Illegal drillings
O Difficult policy enforcement 0
51
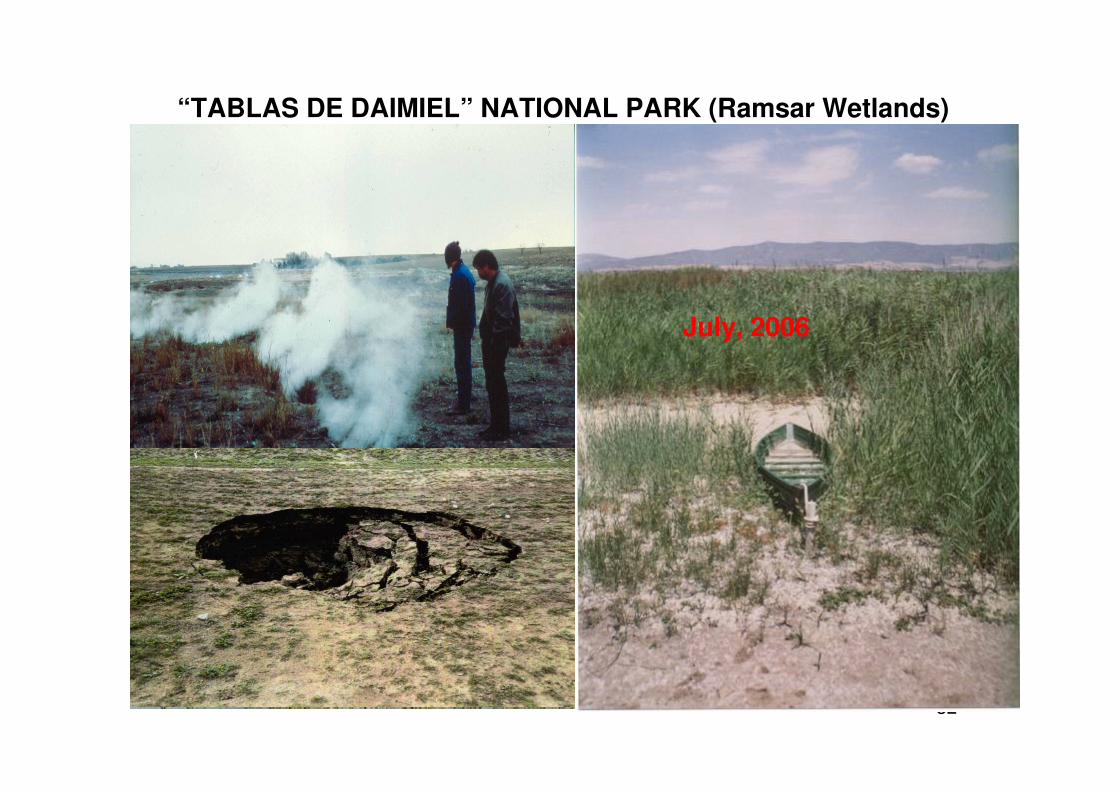
“TABLAS DE DAIMIEL” NATIONAL PARK (Ramsar Wetlands)
52
July, 2006
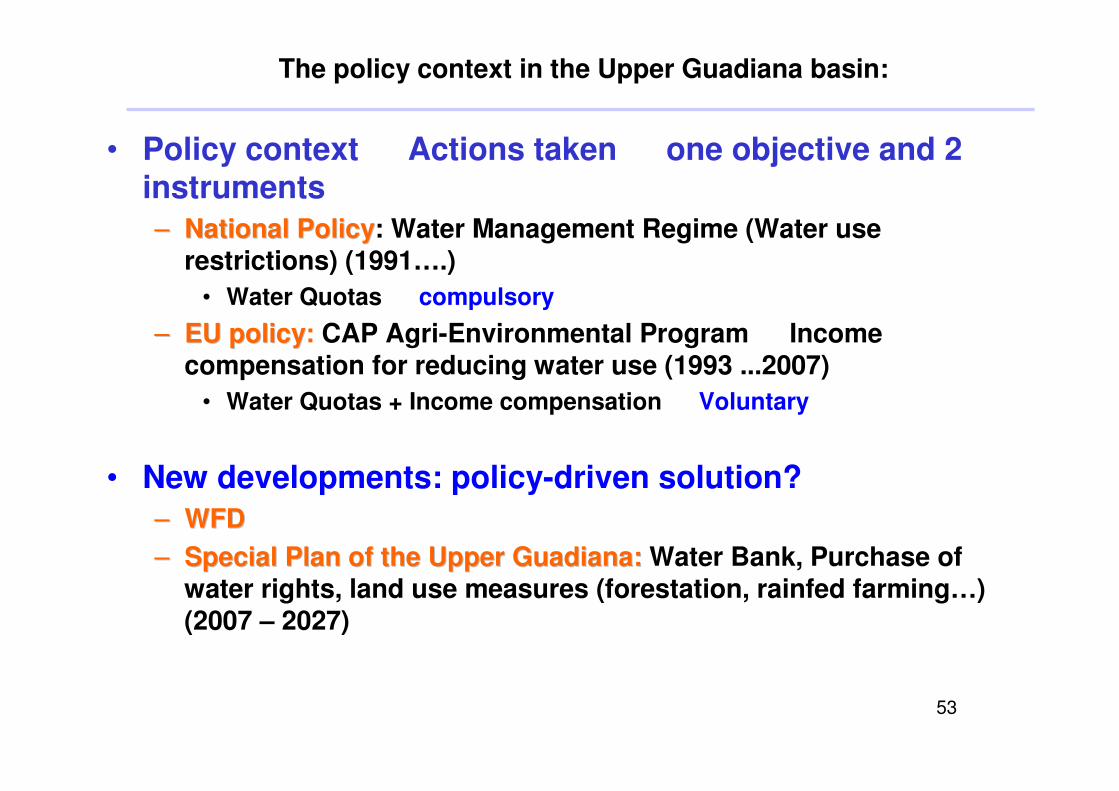
The policy context in the Upper Guadiana basin:
• Policy context Actions taken one objective and 2 instruments –– NNaattiioonnaall PPoolliiccyy: Water Management Regime (Water use
restrictions) (1991….) • Water Quotas compulsory
–– EEUU ppoolliiccyy: CAP Agri-Environmental Program Income compensation for reducing water use (1993 ...2007)
• Water Quotas + Income compensation Voluntary
• New developments: policy-driven solution? –– WWFFDD
–– SSppeecciiaall PPllaann ooff tthhee UUppppeerr GuGuaaddiiaannaa:: Water Bank, Purchase of water rights, land use measures (forestation, rainfed farming…) (2007 – 2027)
53
-
The policy context: centralized management
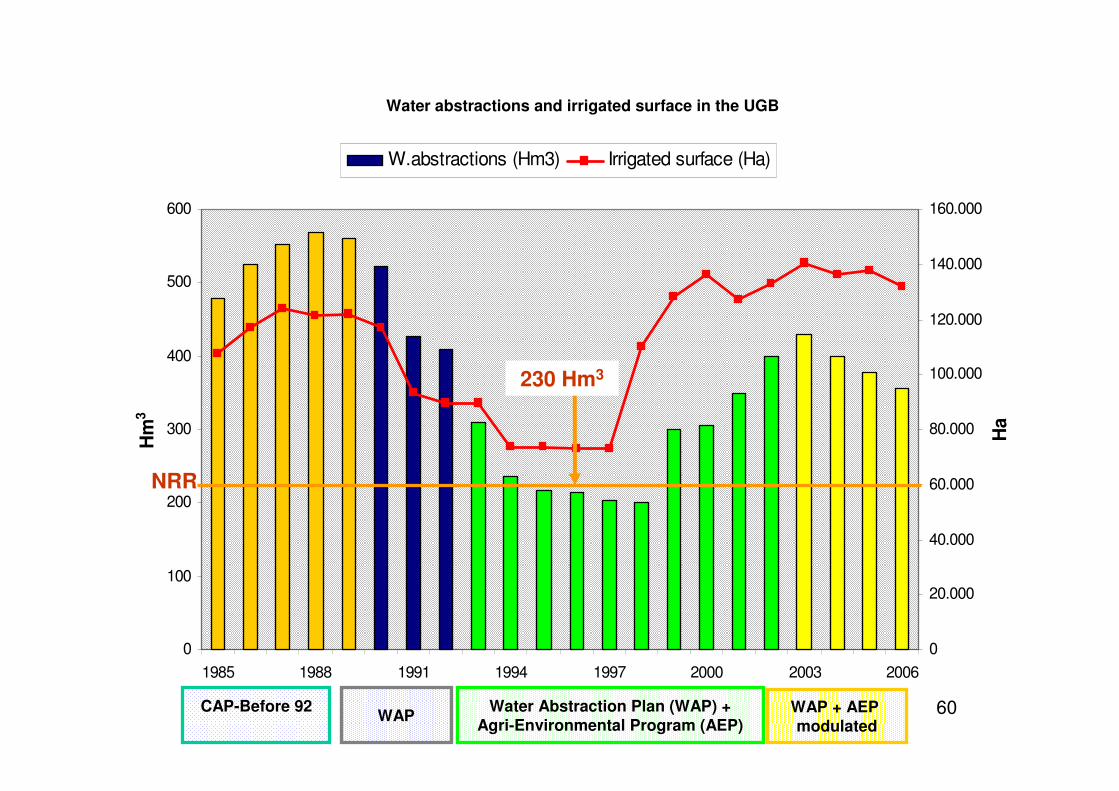
Water policies have not been capable to attain water conservation targets – Water abstraction Plan (National Policy, 1991)
Water quotas: reduction from
5000 2000 m3/ha
Compulsory
No compensation of income
loss
Unsuccessful
Social unrest
Farmers’ litigations
– Agri-Environmental Program (CAP, 1993…..)
- Water quotas: % reduction (50-70
100%)
Voluntary
Compensation of income loss
Highly successful
Reduction of social conflicts
Low cost-effectiveness
Source: Varela-Ortega (2007) 54
55
Water abstractions and irrigated surface in the UGB
W. abstractions (Hm3)
0
100
200
300
400
500
600
Hm
3
0
20000
40000
60000
80000
100000
120000
140000
160000
Ha
1985 1988 1991 1994 1997 2000 2003 2006
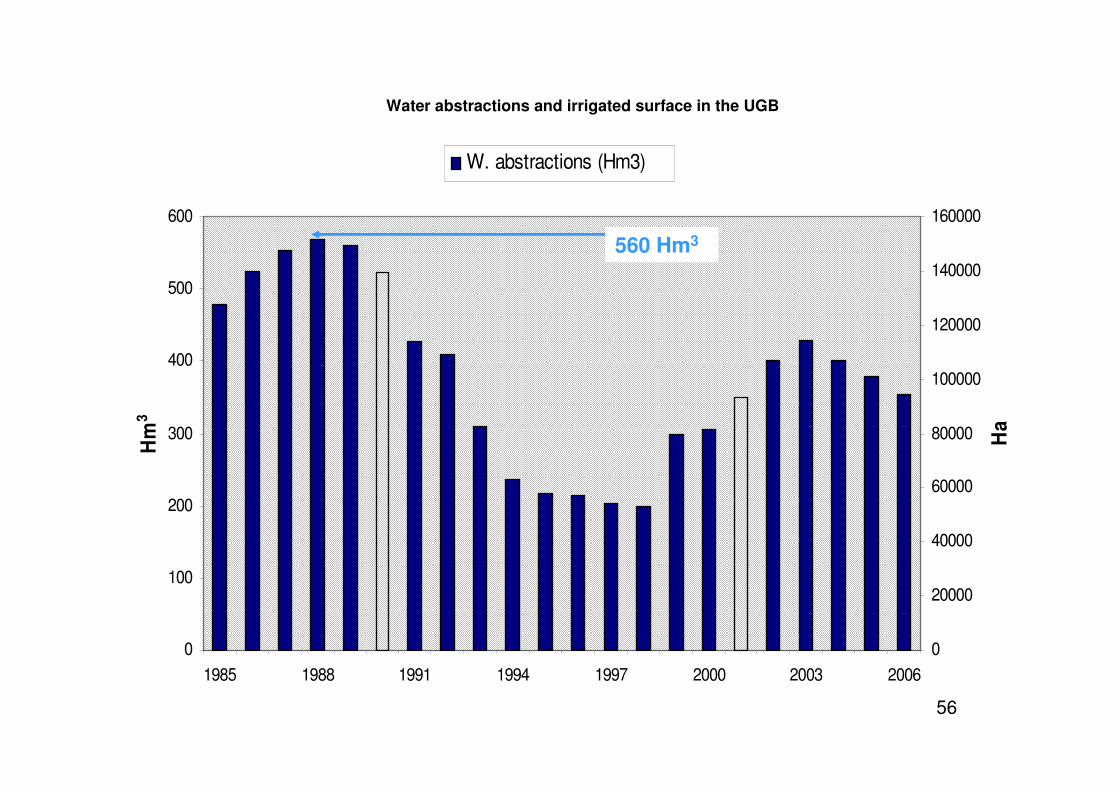
Water abstractions and irrigated surface in the UGB
W. abstractions (Hm3)
0
100
200
300
400
500
600
Hm
3
0
20000
40000
60000
80000
100000
120000
140000
160000
Ha
560 Hm3
1985 1988 1991 1994 1997 2000 2003 2006
56
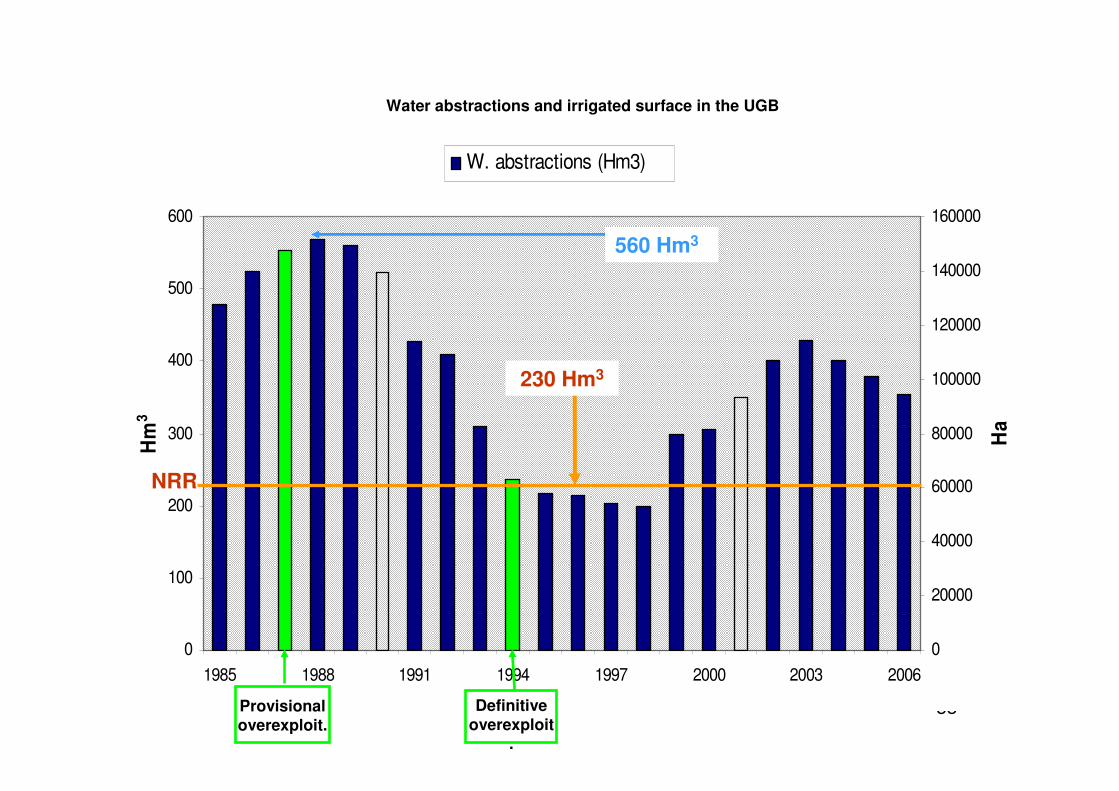
Water abstractions and irrigated surface in the UGB
W. abstractions (Hm3)
0
100
200
300
400
500
600
Hm
3
0
20000
40000
60000
80000
100000
120000
140000
160000
Ha
NRR
230 Hm3
560 Hm3
1985 1988 1991 1994 1997 2000 2003 2006
57
58
Water abstractions and irrigated surface in the UGB
W. abstractions (Hm3)
0
100
200
300
400
500
600
1985 1988 1991 1994 1997 2000 2003 2006
Hm
3
0
20000
40000
60000
80000
100000
120000
140000
160000
Ha
NRR
230 Hm3
560 Hm3
Provisional overexploit.
Definitive overexploit
.
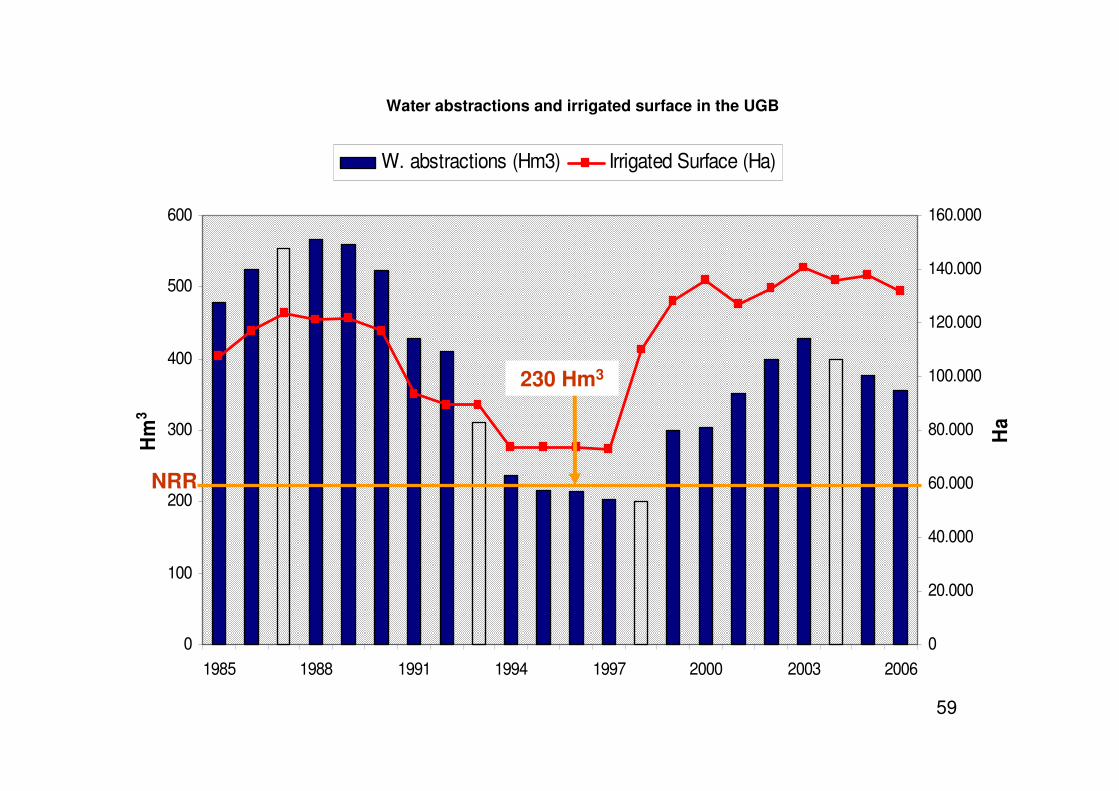
Water abstractions and irrigated surface in the UGB
W. abstractions (Hm3) Irrigated Surface (Ha)
0
100
200
300
400
500
600
Hm
3
0
20.000
40.000
60.000
80.000
100.000
120.000
140.000
160.000
Ha
NRR
230 Hm3
1985 1988 1991 1994 1997 2000 2003 2006
59
Water abstractions and irrigated surface in the UGB
W.abstractions (Hm3) Irrigated surface (Ha)
60
0
100
200
300
400
500
600
1985 1988 1991 1994 1997 2000 2003 2006
Hm
3
0
20.000
40.000
60.000
80.000
100.000
120.000
140.000
160.000
Ha
NRR
230 Hm3
CAP-Before 92 WAP
Water Abstraction Plan (WAP) + Agri-Environmental Program (AEP)
WAP + AEP modulated
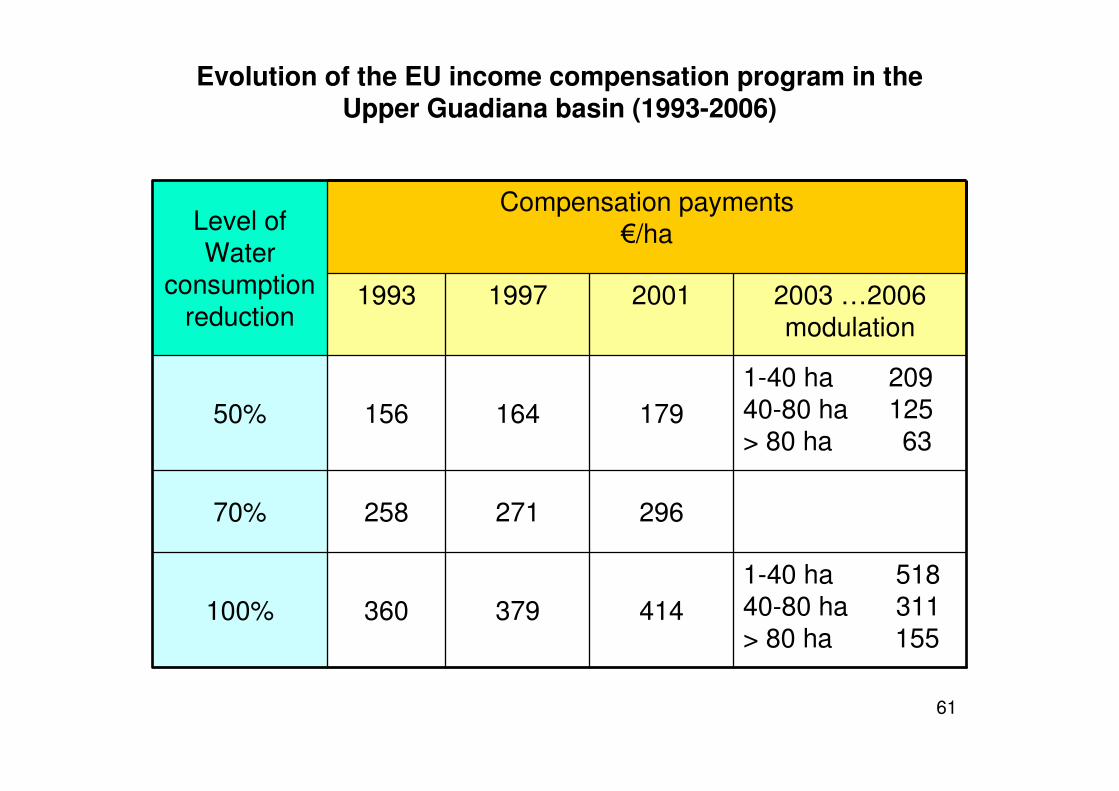
Evolution of the EU income compensation program in the Upper Guadiana basin (1993-2006)
Level of Water
consumption reduction
Compen pay€/ha
sation ments
1993 1997 2001 2003 …2006 modulation
50% 156 164 179
1-40 ha 209 40-80 ha 125 > 80 ha 63
70% 258 271 296
100% 360 379 414
1-40 ha 518 40-80 ha 311 > 80 ha 155
61
300
400
Water abstractions and irrigated surface in the UGB
W.abstractions (Hm3) Surface joining the program (Ha) Irrigated surface (Ha)
600 160.000
140.000 500
120.000
230 Hm3
1985 1988 1991 1994 1997 2000 2003 2006
100.000
80.000
NRR 60.000 200
40.000
100 20.000
0 0
Hm
3
Ha
62 CAP-Before 92 WAP
Water Abstraction Plan (WAP) + Agri-Environmental Program (AEP)
WAP + AEP modulated
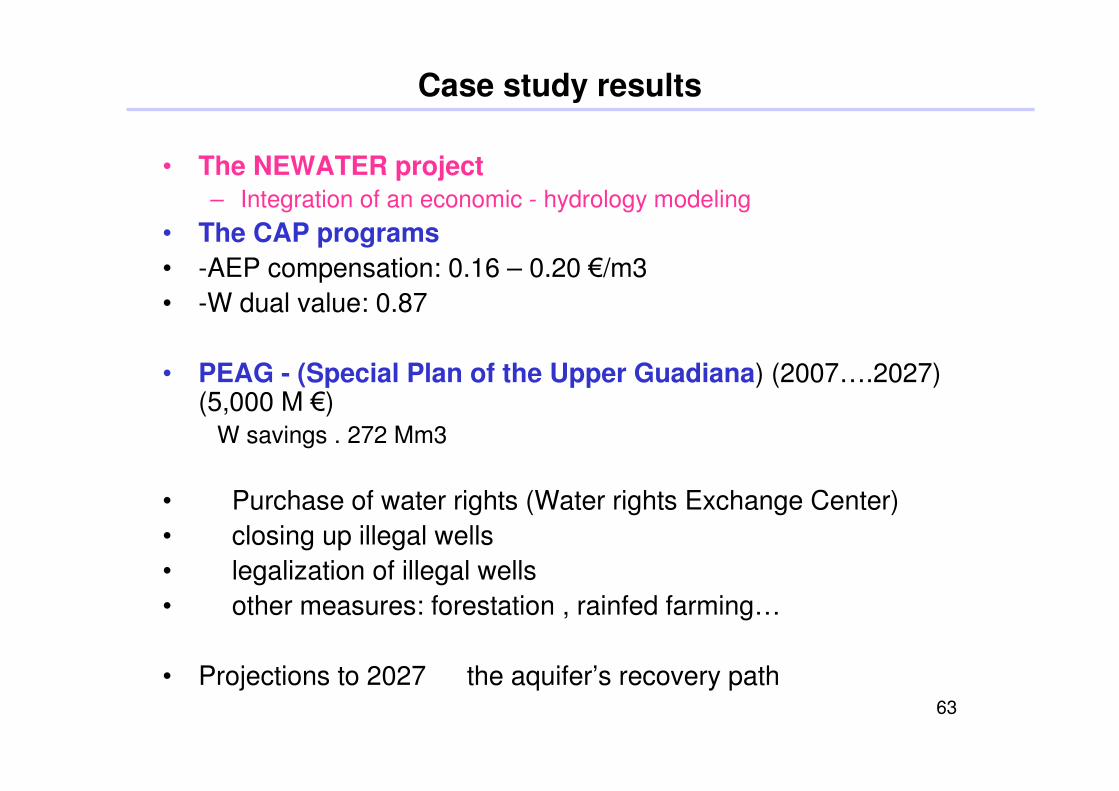
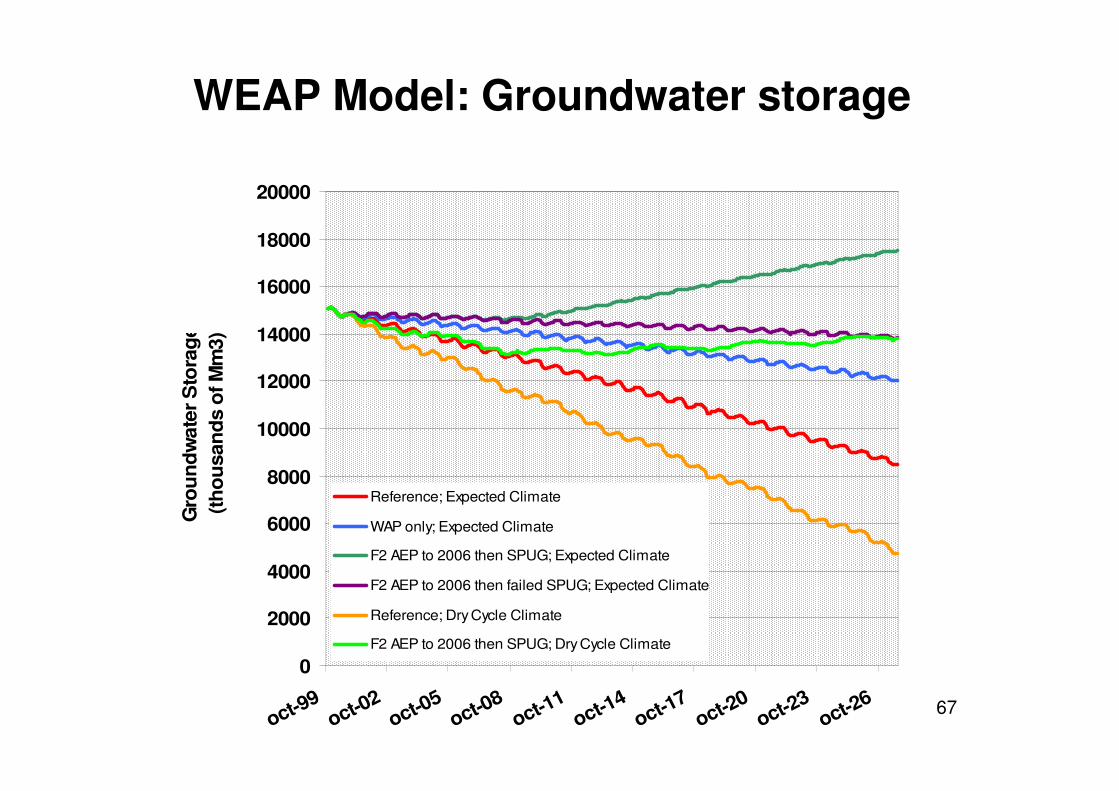
Case study results
• The NEWATER project – Integration of an economic - hydrology modeling
• The CAP programs • -AEP compensation: 0.16 – 0.20 €/m3
• -W dual value: 0.87
• PEAG - (Special Plan of the Upper Guadiana) (2007….2027) (5,000 M €)
W savings . 272 Mm3
• Purchase of water rights (Water rights Exchange Center)
• closing up illegal wells
• legalization of illegal wells
• other measures: forestation , rainfed farming…
• Projections to 2027 the aquifer’s recovery path 63
oct-99oct-02
oct-05oct-08
oct-11oct-14
oct-17oct-20
oct-23oct-26
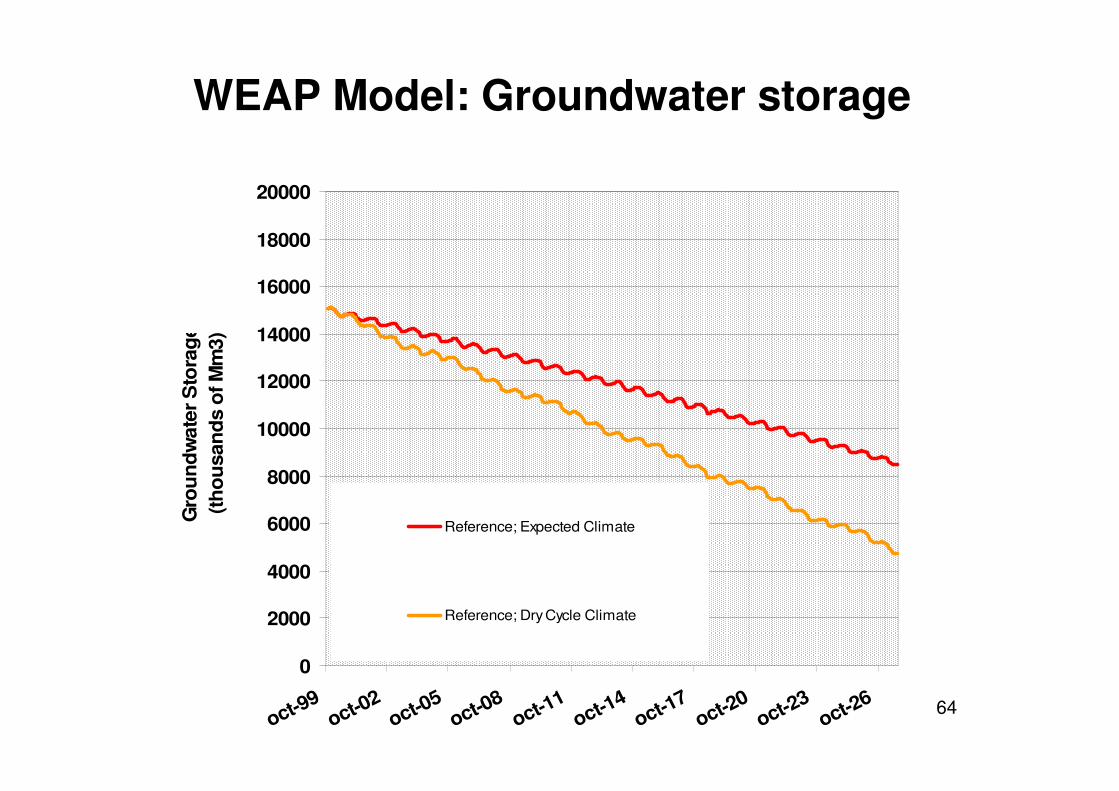
WEAP Model: Groundwater storage
0
2000
4000
6000
8000
10000
12000
14000
16000
18000
20000 G
rou
nd
wat
er S
tora
ge
(th
ou
san
ds
of M
m3)
Reference; Expected Climate
Reference; DryCycle Climate
64
oct-99oct-02
oct-05oct-08
oct-11oct-14
oct-17oct-20
oct-23oct-26
WEAP Model: Groundwater storage
0
2000
4000
6000
8000
10000
12000
14000
16000
18000
20000 G
rou
nd
wat
er S
tora
ge
(th
ou
san
ds
of M
m3)
Reference; Expected Climate
WAP only; Expected Climate
Reference; DryCycle Climate
65
oct-99oct-02
oct-05oct-08
oct-11oct-14
oct-17oct-20
oct-23oct-26
WEAP Model: Groundwater storage
0
2000
4000
6000
8000
10000
12000
14000
16000
18000
20000 G
rou
nd
wat
er S
tora
ge
(th
ou
san
ds
of M
m3)
Reference; Expected Climate
WAP only; Expected Climate
F2 AEP to 2006 then failed SPUG; Expected Climate
Reference; DryCycle Climate
66
oct-99oct-02
oct-05oct-08
oct-11oct-14
oct-17oct-20
oct-23oct-26
WEAP Model: Groundwater storage
0
2000
4000
6000
8000
10000
12000
14000
16000
18000
20000 G
rou
nd
wat
er S
tora
ge
(th
ou
san
ds
of M
m3)
Reference; Expected Climate
WAP only; Expected Climate
F2 AEP to 2006 then SPUG; Expected Climate
F2 AEP to 2006 then failed SPUG; Expected Climate
Reference; DryCycle Climate
F2 AEP to 2006 then SPUG; DryCycle Climate
67
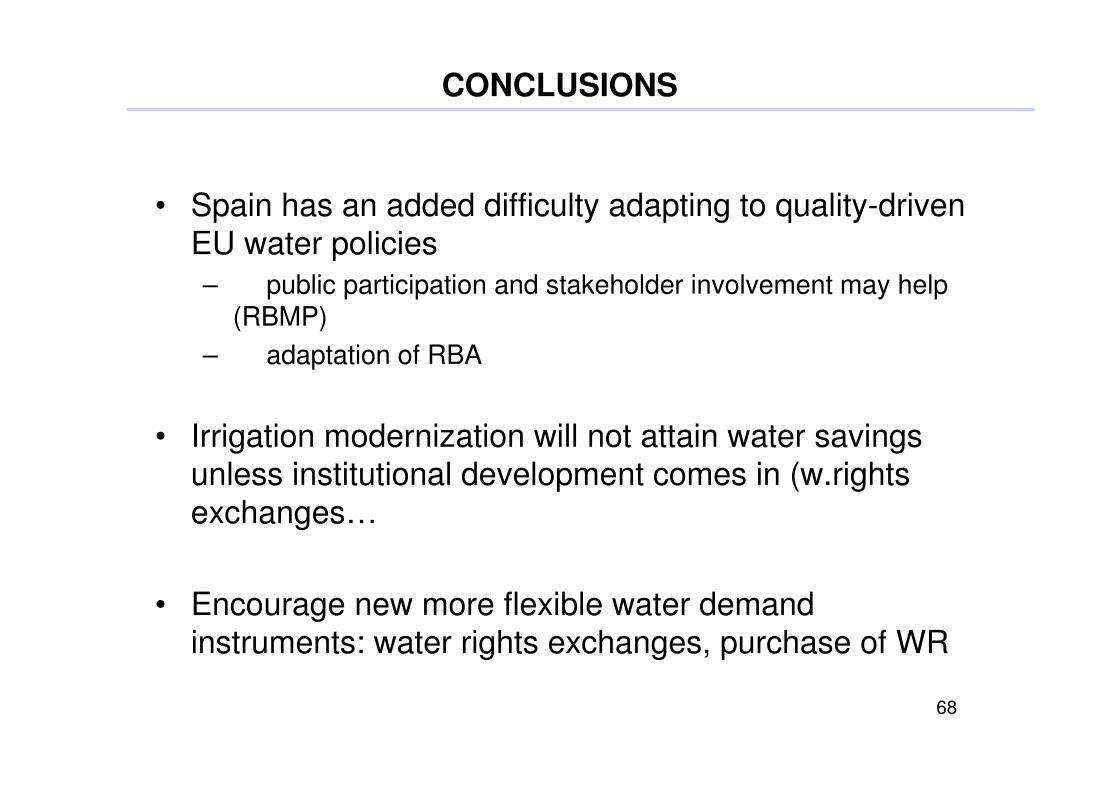
CONCLUSIONS
• Spain has an added difficulty adapting to quality-driven EU water policies
– public participation and stakeholder involvement may help (RBMP)
– adaptation of RBA
• Irrigation modernization will not attain water savings unless institutional development comes in (w.rights
exchanges…
• Encourage new more flexible water demand instruments: water rights exchanges, purchase of WR
68
CONCLUSIONS
• CAP and water:
• Crop shift, water use may not change
• Tendency to reinforce environmental requirements
• The future reform: Include water management and CC