63
Rosneft – On the Road to Global NOC Status? James Henderson WPM 44 January 2012 i

Rosneft – On the Road to Global NOC Status?
James Henderson
WPM 44
January 2012
i

The contents of this paper are the authors’ sole responsibility. They do not necessarily represent the views of the Oxford Institute for Energy Studies or
any of its members.
Copyright © 2012
Oxford Institute for Energy Studies
(Registered Charity, No. 286084)
This publication may be reproduced in part for educational or non-profit purposes without special permission from the copyright holder, provided acknowledgment of the source is made. No use of this publication may be made for resale or for any other commercial purpose whatsoever without prior permission in writing from the Oxford Institute for Energy Studies.
ISBN
978-1-907555-42-8
ii

Contents
Abbreviations and Units of Measurement ............................................................................. v
Conversion Factors .................................................................................................................. v
Acknowledgements ................................................................................................................. vi
1 Introduction ...................................................................................................................... 1
2 A Short History of Rosneft to 2006 ................................................................................. 4
3 Rosneft’s Development Relative to its Peers since Privatization ............................... 12
Rosneft and its Russian Oil Peer Group ............................................................................... 12
4 Rosneft in comparison with Petrobras and Statoil ...................................................... 23
5 Rosneft’s Peer NOCs – Petrobras and Statoil.............................................................. 29
Petrobras ............................................................................................................................... 29
Statoil ................................................................................................................................... 34
6 Key Themes in the Potential Development of Rosneft as a Global NOC .................. 39
International diversification, partnership and development of technical expertise .............. 39
Diversification into Gas ....................................................................................................... 45
Corporate Governance, Shareholder Structure, and State Influence .................................... 46
7 Overall Conclusions ........................................................................................................ 53
Bibliography ........................................................................................................................... 56
iii

Figures
Figure 1: The Top 20 Oil Producing Companies in the World (2010) ...................................... 1
Figure 2: Russian Oil Production by Company, 1990–9 ........................................................... 5
Figure 3: Rosneft Production Profile Since 2000 ...................................................................... 9
Figure 4: Current Shareholder Structure of Rosneft ................................................................ 10
Figure 5: Upstream/Downstream Split of Business for ‘Partial NOCs’ .................................. 11
Figure 6: Production from Rosneft and Russian Peers since 2006 .......................................... 13
Figure 7: Comparative Reserves of Russian Oil Companies (2006–10) ................................. 14
Figure 8: The Growth of Rosneft’s Refining Business Relative to its Russian Peers ............. 15
Figure 9: Upstream Profitability for Russian Oil Companies (2006–10) ................................ 16
Figure 10: EBITDA per Barrel for Russian Oil Companies (2006–10) .................................. 16
Figure 11: Rosneft’s Production Costs versus the Russian Average ....................................... 17
Figure 12: Rosneft Reserve Replacement and Reserve Replacement Cost versus Russian
Average .................................................................................................................................... 18
Figure 13: Rosneft’s Upstream Tax payments versus Russian Average ................................. 18
Figure 14: Rosneft License Ownership versus Domestic Peer Group ..................................... 20
Figure 15: Rosneft’s Social Spending per Barrel Compared to Domestic Peers (2010) ......... 21
Figure 16: Rosneft’s Production per Employee Compared to Domestic Peers ....................... 21
Figure 17: Rosneft’s ROACE Relative to Russian peers......................................................... 22
Figure 18: Proved Reserves of Rosneft, Statoil and Petrobras (2006–10) .............................. 24
Figure 19: Total Production of Rosneft, Petrobras, and Statoil (2006–10) ............................. 24
Figure 20: Reserve Replacement for Rosneft, Petrobras, and Statoil (2006–10) .................... 25
Figure 21: Refinery Utilization for Rosneft, Petrobras and Statoil ......................................... 26
Figure 22: EBITDA perBarrel for Rosneft, Petrobras, and Statoil .......................................... 27
Figure 23: ROACE for Rosneft, Petrobras, and Statoil ........................................................... 27
Figure 24: Split of Rosneft Production Profile between Mature and Newly Developed Assets
40
Figure 25: Split of Oil and Gas Production for Statoil, Petrobras, and Rosneft (2010) .......... 45
Figure 26: Shareholding Structures of Statoil, Petrobras, and Rosneft ................................... 47
Tables Table 1: Valuation metrics for Rosneft, LUKOIL, TNK–BP and GazpromNeft .................... 22
Table 2: Relative Valuation Metrics for Rosneft, Petrobras, and Statoil ................................. 28
iv
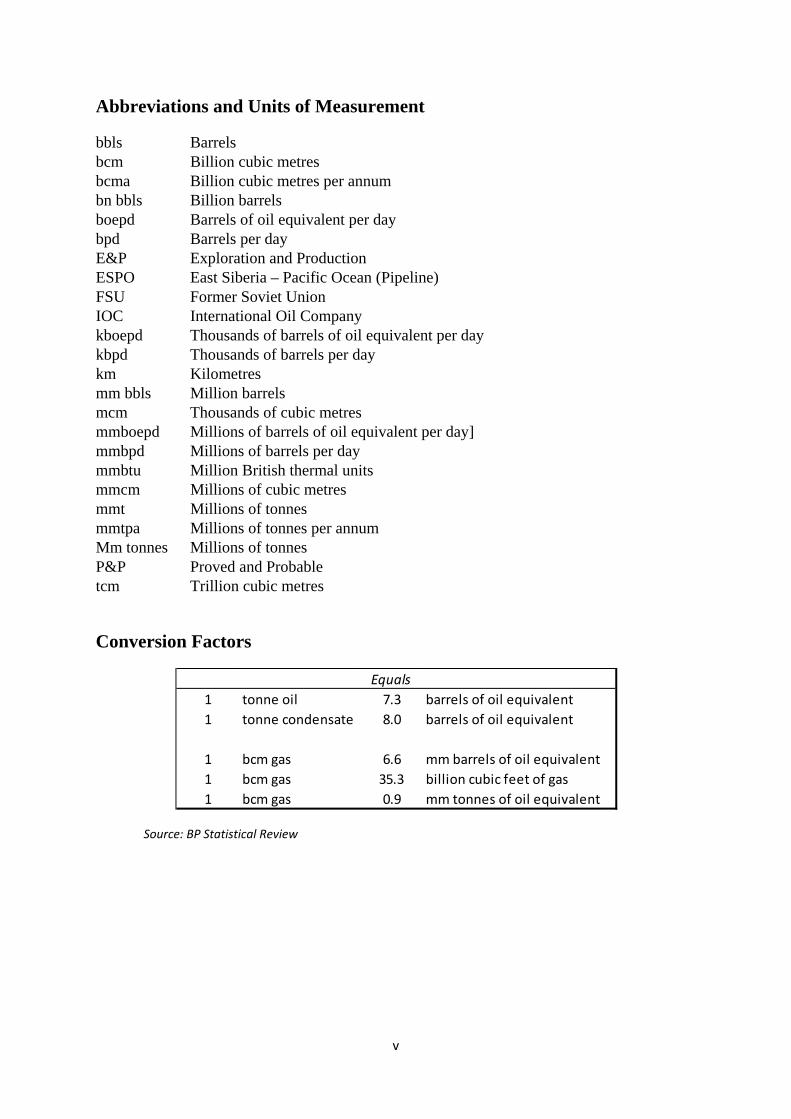
Abbreviations and Units of Measurement
bbls Barrels bcm Billion cubic metres bcma Billion cubic metres per annum bn bbls Billion barrels boepd Barrels of oil equivalent per day bpd Barrels per day E&P Exploration and Production ESPO East Siberia – Pacific Ocean (Pipeline) FSU Former Soviet Union IOC International Oil Company kboepd Thousands of barrels of oil equivalent per day kbpd Thousands of barrels per day km Kilometres mm bbls Million barrels mcm Thousands of cubic metres mmboepd Millions of barrels of oil equivalent per day] mmbpd Millions of barrels per day mmbtu Million British thermal units mmcm Millions of cubic metres mmt Millions of tonnes mmtpa Millions of tonnes per annum Mm tonnes Millions of tonnes P&P Proved and Probable tcm Trillion cubic metres
Conversion Factors
Equals1 tonne oil 7.3 barrels of oil equivalent1 tonne condensate 8.0 barrels of oil equivalent
1 bcm gas 6.6 mm barrels of oil equivalent1 bcm gas 35.3 billion cubic feet of gas1 bcm gas 0.9 mm tonnes of oil equivalent
Source: BP Statistical Review
v
vi
Acknowledgements
I would like to thank my colleagues at the OIES for their help with this research. In particular I am very grateful for the support and comments provided by Bassam Fattouh, Jonathan Stern and Juan Carlos Boue, whose contributions were all vital to the completion of my analysis. I would also like to thank my editor, Catherine Riches, for her detailed corrections and useful comments.
I would also like to acknowledge the contribution of my colleagues at Lambert Energy Advisory, who as always have been generous with their time and support, and in particular to Olga Mordvinova, Alexander Landia, Rajeev Madhavan, Patrick Agar and Tore Sandvold for their editorial comments.
Thanks also to the many industry executives, consultants and analysts with whom I have discussed this topic, and in particular to Ivan Sandrea for his detailed thoughts, but as always the results of the analysis remain entirely my responsibility.
1 Introduction
Following its formation in 1993 Rosneft was the largest oil company in Russia, but during the
mid-1990s it was stripped of almost all of its major assets as new oil companies were formed
and privatized under the Yeltsin regime. As a result Rosneft – Russia’s National Oil
Company (NOC) – controlled only 4 per cent of the country’s output by 1998 and, but for the
financial crisis in that year, might have disappeared completely in a planned, but ultimately
aborted, sale process. The election of Vladimir Putin as president of Russia marked a change
in the company’s fortunes, as it became one of the cornerstones of the new government’s
strategy for the state to retake control over the ‘commanding heights’ of the economy, and in
particular the energy sector. Through a combination of acquisitions and organic growth
Rosneft reasserted itself as a major player in the Russian oil sector by the end of 2005, and
following its privatization in 2006 has gone on to become Russia’s largest oil producer and
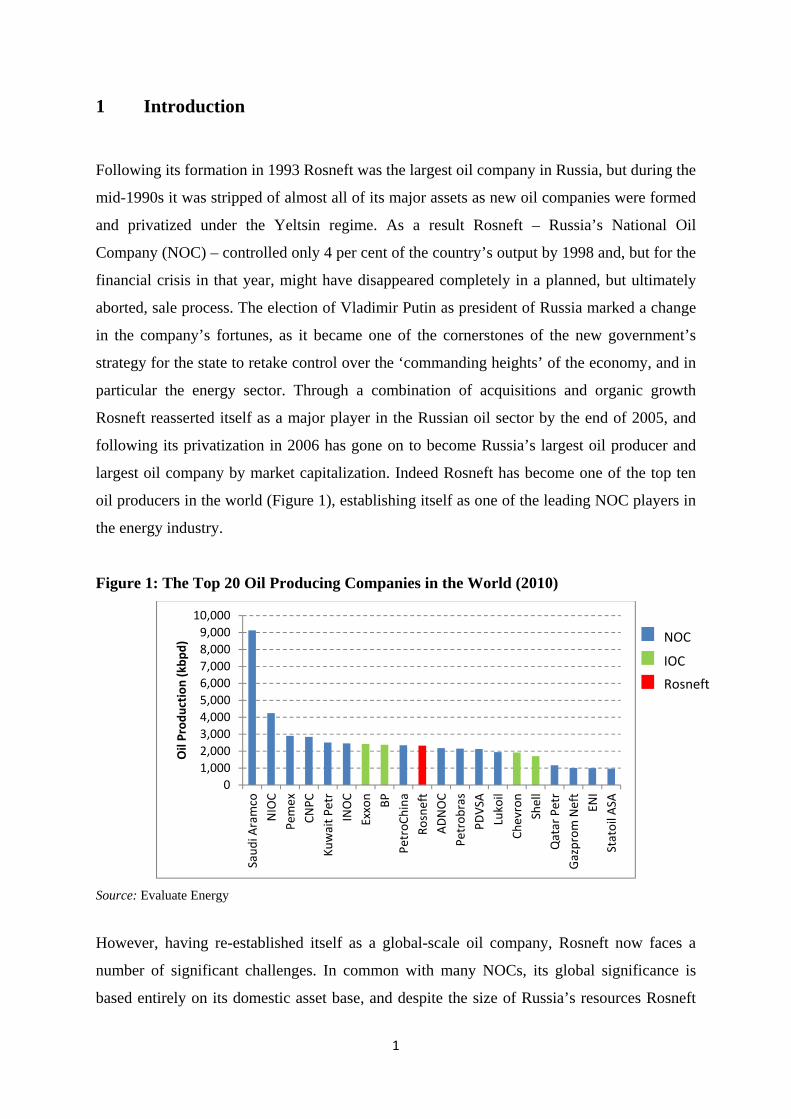
largest oil company by market capitalization. Indeed Rosneft has become one of the top ten
oil producers in the world (Figure 1), establishing itself as one of the leading NOC players in
the energy industry.
Figure 1: The Top 20 Oil Producing Companies in the World (2010)
01,0002,0003,0004,0005,0006,0007,0008,0009,000
10,000
Saud
i Aramco
NIOC
Pemex
CNPC
Kuwait P
etr
INOC
Exxon BP
PetroC
hina
Rosneft
ADNOC
Petrob
ras
PDVS
ALukoil
Chevron
Shell
Qatar Petr
Gazprom
Neft
ENI
Statoil A
SA
Oil Prod
uctio
n (kbp
d)
IOC
Rosneft
NOC
Source: Evaluate Energy
However, having re-established itself as a global-scale oil company, Rosneft now faces a
number of significant challenges. In common with many NOCs, its global significance is
based entirely on its domestic asset base, and despite the size of Russia’s resources Rosneft
1

does face the problem that its existing assets in the core areas of West Siberia and European
Russia are going into gradual decline. This decline can be offset by the development of new
areas such as East Siberia, the Arctic, and offshore fields, but these regions are remote and
their exploitation will require advanced and expensive new technology. In parallel with this
issue Rosneft is also facing pressure from its majority owner, the Russian government, to act
as a catalyst for establishing a greater role for Russia in the global economy, using its energy
resources as an important tool. The company is therefore looking to increase the diversity of
its asset base by investing overseas at a time when the competition for global oil reserves is
high and when Rosneft itself has limited experience of dealing in the international asset
market.
This paper explores how Rosneft may be attempting to meet these twin challenges, using the
example of peer NOCs that have experienced similar problems. Petrobras and Statoil are both
partially privatized, upstream focused NOCs who have established international businesses
both as a way of supplementing and diversifying their domestic resource bases and also as a
means of acquiring and exploiting technological and operating experience that could be
applied across their asset portfolios. Both companies also have a much longer history as
corporate entities than Rosneft, and gained listings on an international stock exchange (in
New York) in 2000-2001, five to six years before Rosneft’s own privatization. As a result,
they can provide a clear analogy for the strategy and tactics that Rosneft may use in the
development of its own business model, and indeed it appears that in 2011 Russia’s NOC is
already taking a similar path to its ‘Partial NOC’ peers.1
The analysis of this thesis is organized in the paper as follows. Section 2 provides a short
history of Rosneft from its formation in 1993 to its privatization in 2006, highlighting the
fluctuations in the company’s status and its emerging role as a key state-controlled actor
under Putin’s presidency. Section 3 then charts the development of Rosneft in the five years
following its privatization, using a comparison with its domestic peer group to highlight the
continuing operational and financial progress that the company has made. Section 4 then
continues this peer group analysis, but contrasts Rosneft with Petrobras and Statoil,
demonstrating that although Rosneft has performed well operationally, it is lagging on other
globally important measures. Section 5 then provides brief histories of Petrobras and Statoil, 1 Partial NOC is a term defined in a recent working paper by P. Stevens entitled ‘A Methodology for Assessing the Performance of National Oil Companies’, published by the World Bank in 2011
2

highlighting some of the strategies that both companies have used that may be pertinent to
Rosneft. Section 6 then discusses a number of relevant areas in which the development of
Rosneft’s current strategy appears to bear comparison with the business models of Petrobras
and Statoil. These include analysis of international asset diversification, partnership with
IOCs, and development of technical expertise, diversification into gas, and the establishment
of new corporate governance and ownership structures. An overall conclusion is then
presented in Section 7.
3

2 A Short History of Rosneft to 2006
The history of Rosneft as an institution began in 1993, when it was established as a state
enterprise based on the assets previously held by Rosneftegaz, a state holding company in the
oil and gas sector.2 Two years later, in 1995, it then became a legally defined corporate entity
when it was formed as an Open Joint Stock Company (OJSC) by the Russian government.3
However, the origin of its assets dates back well into the Soviet era, when many of its current
upstream and downstream subsidiaries were formed. Rosneft’s initial relative uniqueness in
the NOC universe, therefore, lies in the fact that it was not created to establish a state
presence in the early stages of the development of a hydrocarbon province, but that it
emerged as a conglomeration of mature assets that required some government presence to
ensure an adequate level of control and administration.
However, Rosneft’s standing within the Russian oil and gas industry has been very volatile in
the 18 years leading up to 2011, when it became the country’s leading oil producer.
Following the collapse of the Soviet Union in 1991, Russia’s oil enterprises formed a
voluntary association under the name of the Rosneftegaz Corporation, an entity which
essentially replaced the USSR Ministry of Oil (Lane & Seifulmulukov, 1999). However, by
November 1992 the decision to privatize the industry had been taken4 and the first three
vertically integrated Russian oil companies were formed – LUKOIL, Surgutneftegas, and
Yukos. The managers of these companies created their entities from various production
associations, refineries, and marketing companies which they had previously controlled in the
Soviet era, but these only accounted for 42 of the 301 oil enterprises operating in Russia at
the time. The remaining 259 were then left under the stewardship of the new state entity
Rosneft, which acted as the manager in trust of the state’s interests in the domestic oil sector
with responsibility for establishing a semblance of order in the chaotic post-Soviet industry.
Following the initial aggregation of Russia’s non-privatized oil assets, Rosneft became the
country’s largest oil company in 1993, controlling approximately half of domestic oil
production. However, the huge complexity of the company’s geographical and management
structures, combined with the volatile economic situation prevalent in Russia at that time,
2 History of Rosneft posted on company website at www.rosneft.ru/about/history, accessed on 24 Nov 2011. 3 Decree Number 971, 29 September 1995. 4 Presidential Decree Number 1403, November 1992.
4

meant that its continuation as a sustainable entity was always in doubt, and the catalyst for its
initial deconstruction was the ongoing privatization process. The formation of the new OJSCs
Sidanco, Eastern Oil, ONACO, Tyumen Oil, Slavneft, Bashneft, Tatneft, and Sibneft between
1993 and 1995 meant that Rosneft was forced to give up the majority of its prime assets to
companies – many of whose ultimate owners were among the group of businessmen widely
known as the ‘oligarchs’ who supported Boris Yeltsin’s presidency during the 1990s. As a
result, by the time Rosneft itself became an OJSC in 1995, its asset base had been reduced to
eight oil producing subsidiaries, four refineries, and 17 marketing companies spread diversely
around Russia as a disparate set of rump assets with no particular cohesive link or strategy.
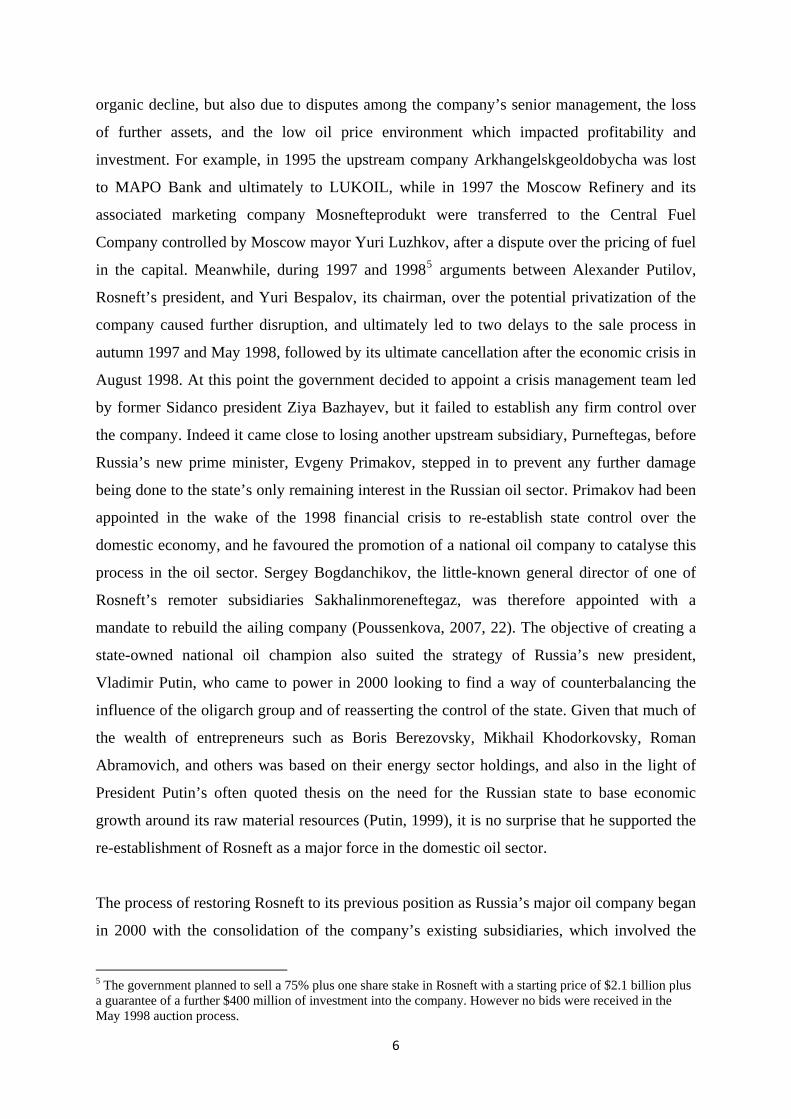
Figure 2 shows how Rosneft’s production profile fell from 1990 to 1999 in comparison with
the rest of the Russian oil sector, emphasizing the extent of the company’s decline as its
assets were stripped away to form the bulk of the domestic oil companies that were privatized
in the early 1990s. Indeed even as early as 1996, the company’s contribution to total Russian
oil output had fallen to only 4 per cent, and it remained at this level for the remainder of the
decade (IEA, 2002, 69).
Figure 2: Russian Oil Production by Company, 1990–9
0
2000
4000
6000
8000
10000
12000
1990 1991 1992 1993 1994 1995 1996 1997 1998 1999
Oil Prod
uctio
n (kbp
d)
Others
Eastern Oil
Tyumen
Sibneft
Onako
Slavneft
Sidanko
Surgut
Yukos
LUKoil
Rosneft
Source: IEA data interpreted by author
Given this somewhat chaotic situation, it is therefore no great surprise that the years 1995–8
saw a period of stagnation for Rosneft, not only due to operational problems that led to
5
organic decline, but also due to disputes among the company’s senior management, the loss
of further assets, and the low oil price environment which impacted profitability and
investment. For example, in 1995 the upstream company Arkhangelskgeoldobycha was lost
to MAPO Bank and ultimately to LUKOIL, while in 1997 the Moscow Refinery and its
associated marketing company Mosnefteprodukt were transferred to the Central Fuel
Company controlled by Moscow mayor Yuri Luzhkov, after a dispute over the pricing of fuel
in the capital. Meanwhile, during 1997 and 19985 arguments between Alexander Putilov,
Rosneft’s president, and Yuri Bespalov, its chairman, over the potential privatization of the
company caused further disruption, and ultimately led to two delays to the sale process in
autumn 1997 and May 1998, followed by its ultimate cancellation after the economic crisis in
August 1998. At this point the government decided to appoint a crisis management team led
by former Sidanco president Ziya Bazhayev, but it failed to establish any firm control over
the company. Indeed it came close to losing another upstream subsidiary, Purneftegas, before
Russia’s new prime minister, Evgeny Primakov, stepped in to prevent any further damage
being done to the state’s only remaining interest in the Russian oil sector. Primakov had been
appointed in the wake of the 1998 financial crisis to re-establish state control over the
domestic economy, and he favoured the promotion of a national oil company to catalyse this
process in the oil sector. Sergey Bogdanchikov, the little-known general director of one of
Rosneft’s remoter subsidiaries Sakhalinmoreneftegaz, was therefore appointed with a
mandate to rebuild the ailing company (Poussenkova, 2007, 22). The objective of creating a
state-owned national oil champion also suited the strategy of Russia’s new president,
Vladimir Putin, who came to power in 2000 looking to find a way of counterbalancing the
influence of the oligarch group and of reasserting the control of the state. Given that much of
the wealth of entrepreneurs such as Boris Berezovsky, Mikhail Khodorkovsky, Roman
Abramovich, and others was based on their energy sector holdings, and also in the light of
President Putin’s often quoted thesis on the need for the Russian state to base economic
growth around its raw material resources (Putin, 1999), it is no surprise that he supported the
re-establishment of Rosneft as a major force in the domestic oil sector.
The process of restoring Rosneft to its previous position as Russia’s major oil company began
in 2000 with the consolidation of the company’s existing subsidiaries, which involved the
5 The government planned to sell a 75% plus one share stake in Rosneft with a starting price of $2.1 billion plus a guarantee of a further $400 million of investment into the company. However no bids were received in the May 1998 auction process.
6

purchase of shares owned by minority investors. In common with the consolidation processes
undertaken by privatized companies in the industry, accusations of abuse of shareholders’
rights, and lack of transparency abounded (Moser & Oppenheimer, 2001), but the Russian
government was prepared to countenance this behaviour (which was not illegal, but
emphasized the weakness of corporate governance legislation in Russia) to ensure that its
NOC gradually gained at least a 75 per cent plus one share stake in all of its major subsidiary
companies by 2006. However, this consolidation process could, on its own, only offer a small
boost to Rosneft’s profile in the sector, because the companies involved were relatively minor
producers (with the exception of Purneftegas). To become a true national oil champion,
Rosneft required the ability to increase in size both organically and by acquisition in order to
expand its influence over current oil output as well as future production strategy.
Rosneft’s first acquisition occurred in 2003 when it bought the small Timan Pechora-based
company Severnaya Neft, a purchase that brought not only 450 million barrels of proved
reserves, but also the potential to create a company-owned export scheme at Archangelsk,
thus bypassing the state-owned and restricted pipeline system controlled by Transneft.6
However, the major impact of this purchase was less the assets acquired, but more the signal
of Rosneft’s intention to reassert a more dominant role for itself in the sector. As President
Putin described the situation ‘[Rosneft] is a state company that needs to increase its
insufficient reserves’,7 and despite the protests from a number of industry players that
Rosneft was using its ‘privileged position as a state company’8 to gain unfair advantage, the
company not only assimilated Severnaya Neft but also improved its performance, achieving a
production growth rate of 10 per cent+ per annum by 2005 (Rosneft, 2006, 141).
However, despite this success, the 12 months from July 2004 to mid-2005 almost saw the
demise of Rosneft as an independent institution, due to a proposed merger with state gas
company Gazprom. The rationale for the merger was that the Russian government could sell
100 per cent of Rosneft to Gazprom for a 10.74 per cent stake in the latter, thus taking the
state’s interest in the gas monopoly, which would then also have become a major oil player,
from 38.4 per cent to a controlling 50.1 per cent. However, the bankruptcy of Yukos and the
auction of its major upstream subsidiary Yuganskneftegas, which was proceeding at the same 6 Oil and Gas Eurasia, March 2004, 60. 7 Quoted in N. Simonia, ‘Russian Energy Policy in East Siberia and the Far East’, Baker Institute Publications, 2004. 8 Vedomosti, 16 Feb 2005.
7

time, provided Rosneft, and its new chairman Igor Sechin, with the means to demonstrate its
continued usefulness to the state as a separate entity. The sale of Yukos’ main producing
asset, Yuganskneftegas, had been undermined by an application by Yukos for protection
under Chapter 11 of the US bankruptcy law, as a result of which a Houston court warned
Gazprom (a publicly quoted, if state-dominated, company) and its banking advisors not to bid
in any auction for Yukos assets. Gazprom, under pressure from international regulatory
authorities and unable to gain bank financing for any deal related to Yukos, therefore
withdrew from the auctions, leaving the Russian state with the problem of resolving the
Yukos situation. The answer was for Rosneft, as a 100 per cent state-owned company, to step
in and buy Yuganskneftegas for $9.35 billion,9 although it did this via an intermediary
company (BaikalFinanceGroup) which actually bid at the auction before itself being
purchased by Rosneft.10 It appears that Rosneft’s NOC status allowed it to raise the finance
for the acquisition via short-term loans from the state-owned banks Sberbank and
Vnesheconombank (Poussenkova, 2007, 62). Rosneft ultimately refinanced these loans via a
forward sale of oil deliveries to China that raised $6 billion.11
Whatever the rights and wrongs of the Yukos bankruptcy auctions, they undoubtedly allowed
Rosneft to avoid being merged into Gazprom, and to transform itself into an entity of a size
worthy of the status of Russia’s NOC (National Oil Company). The company’s proven oil
reserve base leapt from 3.4 billion barrels prior to the Yuganskneftegas acquisition, to 14.9
billion barrels after the deal, while oil production rose by a factor of three from 430 kbopd in
2004 to 1.5 mmbopd in 2005, instantly making Rosneft the country’s third largest producer
(Rosneft, 2006). Further acquisitions in later Yukos bankruptcy auctions saw Samaraneftegas
and Tomskneft added to the Rosneft portfolio by 2007. In 2006, in a separate deal, the
company also purchased a 50 per cent share in Udmurtneft from TNK–BP, in a joint venture
with the Chinese company Sinopec. As a result by 2007 Rosneft had become Russia’s largest
oil producer, a status that it has retained ever since (Burgansky, 2010, 25).
9 The $9.35bn included the assumption of outstanding tax and other liabilities. 10 BaikalFinanceGroup was registered in the town of Tver shortly before the auction for Yuganskneftegas took place. It then bid $9.35 billion in the bankruptcy auction on 19 December 2004, but four days later was itself purchased by Rosneft for 10,000 roubles (approximately $350). The $9.35 billion was then paid by Rosneft to the Russian authorities on 31 December 2004, completing the process of repaying Yukos’ alleged tax debts which had been the ostensible cause of the bankruptcy auction in the first place. 11 Bloomberg, 1 Feb 2005, ‘Rosneft borrowed $6 billion from China through Vnesheconombank’, Moscow.
8

Figure 3: Rosneft Oil Production Profile Since 2000
0
500
1000
1500
2000
2500
2000 2001 2002 2003 2004 2005 2006 2007 2008 2009 2010
Oil Prod
uctio
n (kbp
d)
Sources: Rosneft company data, Interfax
The transformation of Rosneft into a major player in the Russian oil industry, rather than a
small owner of peripheral assets, also provided the opportunity for the Russian state to
capitalize on its new status by raising finance through an IPO (initial public offering) to
international investors, and also to establish its NOC among the peer group of publicly
quoted oil majors. Rosneft’s IPO was launched in the summer of 2006, and the company sold
14.8 per cent of its total equity for $10.4 billion, implying a value for the whole company of
just under $80 billion. Rosneftegas, Rosneft’s main shareholder, took $8.5 billion of the
receipts to repay loans it had raised to help finance the Yuganskneftegas acquisition, while
the remaining $1.9 billion was used by Rosneft itself to repay some of its own debts. The
shares were sold to a combination of institutional and private investors in London and
Moscow, as well as to three strategic investors, BP (1.2 per cent), Petronas (1 per cent), and
CNPC (0.5 per cent), with the government retaining an 85 per cent stake. Following the IPO
the government’s share was reduced to 75 per cent+1 share due to the further consolidation of
Rosneft subsidiaries, during which Rosneft itself acquired 9.4 per cent of its own shares from
Yukos, which had in turn gained a large stake in Rosneft via the sale of its preferred shares in
Yuganskneftegas. By 2007, however, Rosneft’s shareholder structure had arrived at its
current position (shown in Figure 4), with the Russian state owning a super-majority12 and
12 Ownership of more than 75% of the equity of any company in Russia gives the shareholder a super-majority, meaning that it can force through any major strategic decisions. Under Russian law these can only be blocked by shareholders owning a combined stake of more than 25%.
9

the company having an effective stock market float of around 15 per cent of its total equity
capital.
Figure 4: The Shareholder Structure of Rosneft in 2011
State, 75%
Treasury Shares, 10%
BP, 1%
Petronas, 1%
CNPC, 1%
Institutions, 13%
Source: Rosneft
The emergence of Rosneft as a publicly quoted, if still state-controlled, oil company not only
allowed finance to be raised for the government and the company, but also changed the
dynamics of the company’s development as a business. Prior to the IPO, Rosneft’s role had
been as a consolidator of assets under state ownership, providing the Russian government
with a vehicle to reassert its influence over a major strategic sector of the economy. After the
IPO Rosneft not only had additional responsibilities towards its new broader range of
shareholders, but also began to adopt the role of a quasi-intermediary between the private
sector oil companies and the state authorities regulating the oil industry. Indeed, the company
itself now describes its overall target as being to reach the status of ‘Super-NOC’, with a
blended approach to developing its strategy. On the one hand it can benefit from the
advantages of being a state-controlled NOC – access to resources and M&A opportunities,
insulation from political risk, access to policy makers, and co-operation with the state. On the
other, its corporate goals now include those common with the global oil ‘supermajors’13 –
creating shareholder value, good corporate governance, cost efficiency, capital discipline, and
transparency (Rosneft, 2011a, 28).
13 The supermajors are generally defined as the largest international oil companies, including ExxonMobil, Shell, BP, Chevron, and Total.
10

This combination of objectives, and its status as a partially privatized NOC, places the
company in a peer group defined by the World Bank as ‘Partial NOCs’ (Stevens, 2011, 34), a
group that also includes Petrobras, Statoil, Repsol, and Sinopec. The linking of all five
companies is essentially based on their shareholder structure, with all the companies being
partially privatized, but as can be seen from Figure 5 their business models are somewhat
different. Repsol and Sinopec have a much greater downstream (refining and marketing) bias,
while Rosneft, Petrobras, and Statoil are more focused on the upstream (exploration and
production) business. As a result, Rosneft bears fairer comparison with Petrobras and Statoil,
as similar metrics can be used to judge company performance and to draw conclusions about
the potential future direction of Rosneft’s business strategy.
Figure 5: Upstream/Downstream Split of Business for ‘Partial NOCs’ (2010)
0
1,000
2,000
3,000
4,000
5,000
6,000
Statoil Rosneft Petrobras Sinopec Repsol
kboe
pd
Upstream Production Downstream Throughput
Source: Evaluate Energy, data from company reports
However, given the company’s primarily domestic focus as well as the overall idiosyncrasies
of the Russian oil and gas sector (for example its vast resource base, huge overland transport
distances and high oil tax rates) it is important to develop the history of Rosneft post its
privatisation in comparison both with its domestic peer group and the international “Partial
NOCs”. As such Section 3 analyses the development of Rosneft since 2006 in comparison
with LUKoil, TNK-BP, GazpromNeft and, where data is available, Surgutneftegas, while
Section 4 uses similar metrics to broaden the comparison to include Petrobras and Statoil.
11

3 Rosneft’s Development Relative to its Peers since Privatization
Since joining the ranks of the privatized NOCs in 2006 Rosneft has continued to reassert its
position as a leading player in the Russian oil industry, both in the upstream and downstream
sectors. Using a combination of domestic acquisitions and organic growth in both areas, it has
managed to establish itself as the country’s largest oil producer as well as its biggest refiner,
and has also placed itself amongst the leading ranks of global oil producers. However, a key
question is whether this success can be replicated over the next decade if a similar
domestically focused strategy is followed, or whether Rosneft, and indeed the Russian oil
industry as a whole, would benefit from adopting a broader strategic focus, in order to
emulate the development trajectories of Statoil and Petrobras over the past two decades. As
will be demonstrated below, it would appear that Rosneft and the Russian government have
already reached the conclusion that this second course is a necessity if Russia is to retain its
place at the heart of the global energy economy. However, before addressing Rosneft’s
future, it is important to assess where it currently stands relative to both its domestic and
international peers.
In order to compare the performance of Rosneft since 2006 with its domestic peers I have
used a range of measures suggested in Stevens (2011). These include financial metrics such
as EBITDA per barrel and return on capital employed, and operational measures such as
reserve and production growth, reserve replacement, production per employee, and refinery
utilization. I have also deepened the analysis in some areas to investigate a number of the
drivers behind the overall performance, including comparisons of taxes paid per barrel or
social costs per barrel, in order to make specific points about the position of Rosneft in the
Russian oil industry.
Rosneft and its Russian Oil Peer Group
The IPO of Rosneft in 2006 saw it become the last of the major Russian oil companies to be
privatized, more than a decade after the initial sales of LUKOIL, Yukos, and Surgutneftegas,
and also five to six years after the New York listings of its most relevant global NOC peers –
Statoil and Petrobras. As such, although it has clearly had less time to incorporate many of
the operational and governance practices of its peer companies, it has nevertheless, both in
the years preceding its 2006 IPO and in the five years since, enjoyed the privileges of
12
government support and favour, while also suffering some of the obligations of being a state-
controlled company. Overall, though, Rosneft’s performance and current valuation reflect a
company that has benefitted greatly from the desire of the Russian state to see it return to a
position of primacy in the Russian oil industry.
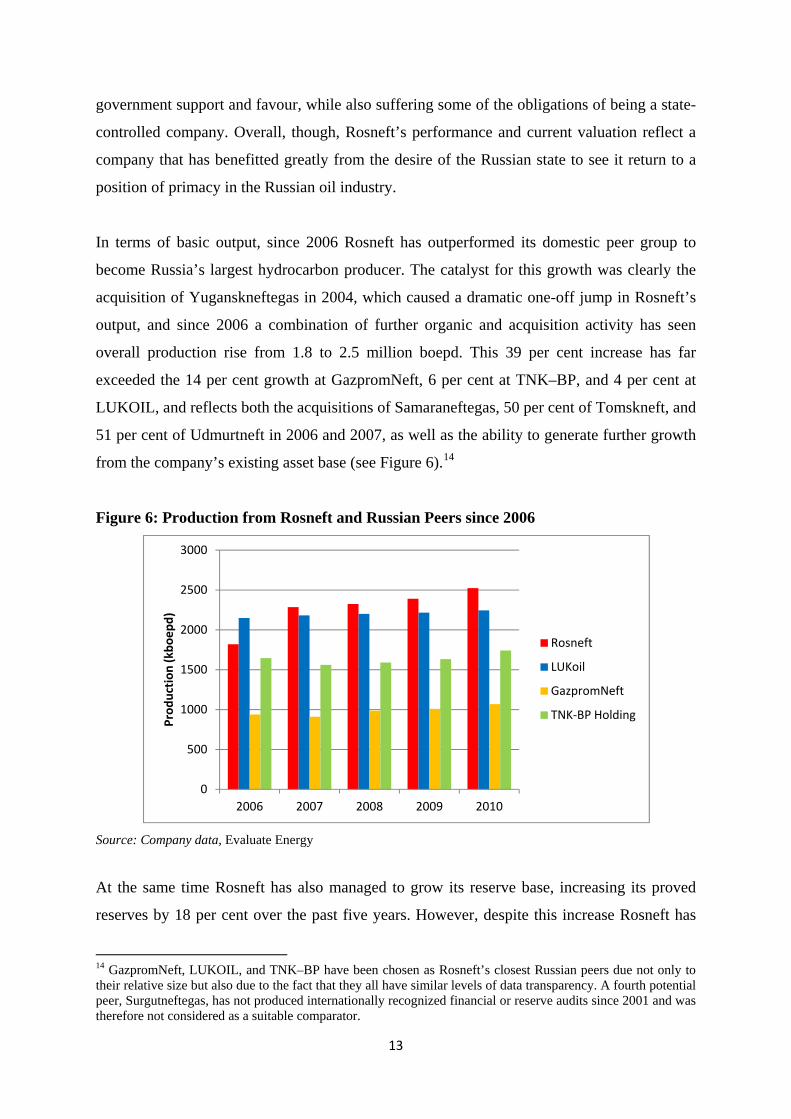
In terms of basic output, since 2006 Rosneft has outperformed its domestic peer group to
become Russia’s largest hydrocarbon producer. The catalyst for this growth was clearly the
acquisition of Yuganskneftegas in 2004, which caused a dramatic one-off jump in Rosneft’s
output, and since 2006 a combination of further organic and acquisition activity has seen
overall production rise from 1.8 to 2.5 million boepd. This 39 per cent increase has far
exceeded the 14 per cent growth at GazpromNeft, 6 per cent at TNK–BP, and 4 per cent at
LUKOIL, and reflects both the acquisitions of Samaraneftegas, 50 per cent of Tomskneft, and
51 per cent of Udmurtneft in 2006 and 2007, as well as the ability to generate further growth
from the company’s existing asset base (see Figure 6).14
Figure 6: Production from Rosneft and Russian Peers since 2006
0
500
1000
1500
2000
2500
3000
2006 2007 2008 2009 2010
Prod
uctio
n (kbo
epd)
Rosneft
LUKoil
GazpromNeft
TNK‐BP Holding
Source: Company data, Evaluate Energy
At the same time Rosneft has also managed to grow its reserve base, increasing its proved
reserves by 18 per cent over the past five years. However, despite this increase Rosneft has
14 GazpromNeft, LUKOIL, and TNK–BP have been chosen as Rosneft’s closest Russian peers due not only to their relative size but also due to the fact that they all have similar levels of data transparency. A fourth potential peer, Surgutneftegas, has not produced internationally recognized financial or reserve audits since 2001 and was therefore not considered as a suitable comparator.
13

not yet become either the largest reserve holder or the most diversified company. As Figure 7
shows, LUKOIL holds first position in terms of oil and gas reserves – effectively due to the
extra dimension of LUKOIL’s international portfolio of assets that includes producing fields
located in the Caspian region (specifically in Kazakhstan, Uzbekistan, and Azerbaijan). By
contrast Rosneft’s reserve base is entirely dominated by Russian assets, and its growth has
been driven by a combination of the asset acquisitions in 2006 and 2007 mentioned above, as
well as the operational outperformance of its exploration department that is discussed in
further detail below. However, it is clear that Rosneft’s growth has been no better than that
seen at GazpromNeft (18 per cent) and TNK–BP (13 per cent) over a similar time period,
reflecting the company’s strategic focus not just on size but also on exploiting the productive
capacity of its newly acquired asset base. Indeed ‘efficient growth in production’ has a higher
priority than mere size in the company’s strategic objectives (Rosneft, 2011b), and as such it
is perhaps possible to see the gradual shift in emphasis in Rosneft’s strategy away from being
a consolidator of assets with the goal of increasing state control, to a more commercial
organization focused on generating increased returns from its asset base.
Figure 7: Comparative Reserves of Russian Oil Companies (2006–10)
0
5000
10000
15000
20000
25000
2006 2007 2008 2009 2010
Total Proved Re
serves (m
mbo
e)
LUKOIL
Rosneft
TNK‐BP
Gneft
Source: Company data, Evaluate Energy
This focus on commercial returns can also be seen in the expansion of the company’s
downstream business, which has also grown dramatically over the past five years. On
privatization in 2006 Rosneft had refining capacity totalling 10.8 million tonnes (79 million
barrels) per annum, which accounted for only 14 per cent of the company’s crude oil
14

production at the time, compared to a Russian average refining cover15 of 46 per cent.
Furthermore, its refineries were of low quality, producing only a 48 per cent share of light
(higher value) products compared to a Russian average of 65 per cent, and having a Nelson
complexity ranking of 2.3 compared to a Russian average of 5.2.16 The small amount of
refining capacity that the company owned was, not surprisingly, fully utilized and Rosneft
was thus forced to use a significant number of third party refineries to process its remaining,
non-exported, crude. This situation changed in the second quarter of 2007 when Yukos’
refining assets were acquired, increasing Rosneft’s refining capacity to almost 57 million
tonnes per annum (418 million barrels) with a higher average Nelson complexity of 4.2,
while throughput more than trebled to over 350 million barrels (Figure 8). Thanks to this
acquisition Rosneft has now become Russia’s largest crude oil refiner, but the company has
also invested to rationalize its plant and to increase the quality of its output. Rosneft’s overall
Nelson complexity score has now risen to 4.4, with light product output now at 56 per cent
compared to a Russian average of 63 per cent in 2010, while refinery utilization is amongst
the highest in the Russian oil industry at 98 per cent, compared to a countrywide average of
89 per cent (Interfax, 2011). With refining cover now at 50 per cent Rosneft is well placed to
exploit the opportunities presented by liberalized prices and a preferential tax regime in the
domestic downstream business, given that 45–50 per cent of its production is exported as
crude oil without any need to pass through the company’s refineries.
Figure 8: The Growth of Rosneft’s Refining Business Relative to its Russian Peers
0
50
100
150
200
250
300
350
400
2006 2007 2008 2009 2010
Refin
ery Th
roug
hput (m
mbb
ls)
Rosneft
LUKoil
GazpromNeft
TNK‐BP
Surgut
Source: Company Data, Evaluate Energy
15 Refining cover is defined as ‘available refining capacity’ divided by ‘crude oil production’. 16 The Nelson complexity index measures the ability of a refinery to produce higher quality light products such as gasoline, jet fuel, and diesel. The US average refinery has a complexity of 9.6, the global average is 6.1, and the Russian average in 2009 was 5.2.
15
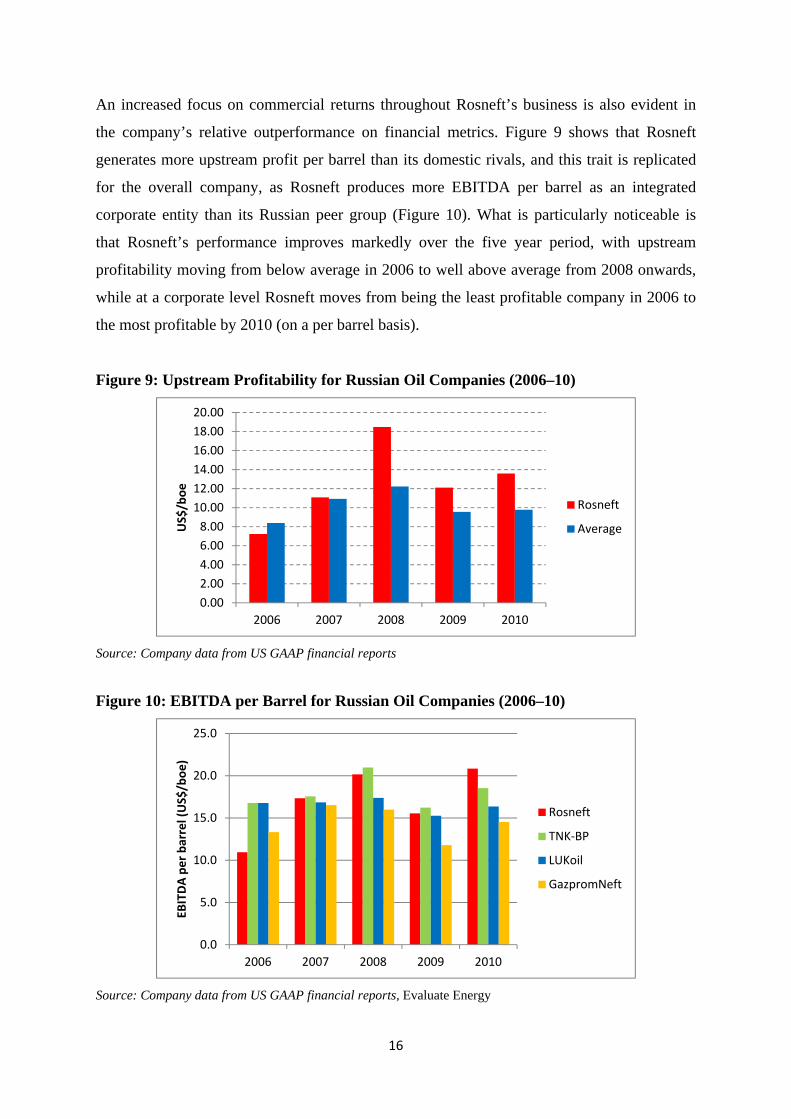
An increased focus on commercial returns throughout Rosneft’s business is also evident in
the company’s relative outperformance on financial metrics. Figure 9 shows that Rosneft
generates more upstream profit per barrel than its domestic rivals, and this trait is replicated
for the overall company, as Rosneft produces more EBITDA per barrel as an integrated
corporate entity than its Russian peer group (Figure 10). What is particularly noticeable is
that Rosneft’s performance improves markedly over the five year period, with upstream
profitability moving from below average in 2006 to well above average from 2008 onwards,
while at a corporate level Rosneft moves from being the least profitable company in 2006 to
the most profitable by 2010 (on a per barrel basis).
Figure 9: Upstream Profitability for Russian Oil Companies (2006–10)
0.002.004.006.008.0010.0012.0014.0016.0018.0020.00
2006 2007 2008 2009 2010
US$/boe
Rosneft
Average
Source: Company data from US GAAP financial reports
Figure 10: EBITDA per Barrel for Russian Oil Companies (2006–10)
0.0
5.0
10.0
15.0
20.0
25.0
2006 2007 2008 2009 2010
EBITDA pe
r barrel (US$/boe
)
Rosneft
TNK‐BP
LUKoil
GazpromNeft
Source: Company data from US GAAP financial reports, Evaluate Energy
16

This transformation of Rosneft from a below-average domestic performer to a peer group
leading entity illustrates the potential that can be realized from the twin advantages of the
company being the Russian NOC while also having an increasing focus on shareholder
returns. On the one hand Rosneft has undoubtedly improved its operational performance,
managing to keep its production costs per barrel well below the industry average (Figure 11),
and to replace its reserves organically at a faster rate and lower cost than its Russian peers.
Figure 12 illustrates that Rosneft has consistently had an organic reserve replacement ratio
(excluding the impact of acquisitions) above 100 per cent since 2006, and that its cost to find
and develop each barrel has improved from being 3 per cent above the industry average in
2007 to 35 per cent below it by 2010.
Figure 11: Rosneft’s Production Costs versus the Russian Average
0.00
1.00
2.00
3.00
4.00
5.00
6.00
2006 2007 2008 2009 2010
Prod
uctio
n Co
st (U
S$/boe
)
Rosneft
Average
Source: Company data from US GAAP financial reports On the other hand, this operational success has also been supplemented by the benefit of
being Russia’s oil NOC, and the clearest gain would seem to be in the lower levels of tax that
Rosneft has paid over the past three years compared to its industry peers. As Figure 13
shows, the amount paid by Rosneft in overall taxes per barrel (defined in US GAAP reports
as export tax, taxes other than income and corporate income tax) has averaged between 90
and 95 per cent of the industry average, equivalent to approximately $3-5 per barrel. This can
largely be explained by the tax exemptions that have been granted to certain new field
developments, especially in East Siberia, where Rosneft’s Vankor field has been the most
significant producer among the 22 fields in the region which have been granted zero export
17

tax status until a 15 per cent rate of return is reached. Nevertheless, although Rosneft might
argue that its lower tax bill is a reflection of the commercial realities of the Vankor field, the
fact that it has benefitted most from the exemptions in East Siberia could still be interpreted
as a clear demonstration of the benefits of a close relationship with the Russian state. Figure 12: Rosneft Reserve Replacement and Reserve Replacement Cost versus Russian
Average
0.00
2.00
4.00
6.00
8.00
10.00
12.00
0%20%40%60%80%100%120%140%160%180%
2006 2007 2008 2009 2010
Organ
ic Reserve
Rep
lacemen
t Cost
($/boe
)
Organ
ic Reserve
Rep
lacemen
t
Rosneft ORR Average ORR
Rosneft ORR Cost Average ORR Cost
Source: Company data from US GAAP financial reports
Figure 13: Rosneft’s Tax payments versus Russian Average
0.00
10.00
20.00
30.00
40.00
50.00
60.00
2008 2009 2010
US$/boe
of R
ussian
Produ
ction
Rosneft
Average*
Source: Company data from US GAAP financial reports. NB * Average is for Rosneft, TNK-BP, GazpromNeft and LUKOIL (Russian production only)
18

A further example of this benefit is the superior access which Rosneft appears to receive for
new licences. Figure 14 shows that since the end of 2006, Rosneft’s licence ownership has
increased by 64 per cent compared with growth of 17 per cent for TNK–BP, 4 per cent for
LUKOIL, and 2 per cent for GazpromNeft. Even allowing for the acquisitions Rosneft made
during the period, the contrast between the Russian NOC and its domestic peers in terms of
total licences owned and the growth in ownership over the past five years is stark. One driver
of this growth in licence ownership is that, as one of the ‘Strategic Enterprises and
Organizations’ identified by the Russian authorities,17 Rosneft has been playing a key role in
the development of new fields and regions since its inception, becoming the state
representative in the Sakhalin 1 PSA (production sharing agreement) as early as 1996. It is
now leading the way in the development of the new ‘greenfield’ regions, and is able to utilize
its privileged status for the benefit of the company and all its shareholders. In its 2009
‘Energy Strategy to 2030’ the Russian government outlined a number of new regions that
would be key to the continued long-term development of the Russian oil industry, including
the Russian continental shelf, the Arctic region (some of which is also offshore), and East
Siberia, in recognition of the fact that the more traditional producing regions such as West
Siberia and Volga–Urals have reached maturity and are likely to go into gradual decline.
Rosneft has been given priority access to these new regions of Russia, and in East Siberia, for
example, it has been acquiring the majority of the licences on offer, making itself the key
player in the area. It has also exploited its preferential rights (with the other state-owned
companies Gazprom and Zarubezhneft) to licences on the Russian continental shelf, where it
has acquired acreage in the South Kara, Laptev, Okhotsk, Barents, Pechora, and Black Seas.
However, growth in these new areas cannot account for the 220 licence increase in Rosneft’s
acreage portfolio, suggesting that the company has also expanded its onshore presence via
traditional licence auctions, and may at times have been given preferred access to licences in
core areas of the country. Some of this access will not always have been desirable, as Rosneft
has, for example, been responsible for the rebuilding of the oil industry in the Caucasus
following the Chechen Wars in the 1990s, and has therefore acquired licences in a region
where other oil companies have not been keen to invest. Nevertheless, it has also been able to
gain new licences in areas such as West Siberia and Timan Pechora, where prospectivity is
much greater and security is less of an issue, and this is likely to have helped the company to
achieve the relative exploration success shown in Figure 12 above.
17 www.rosneft.com/about/.
19
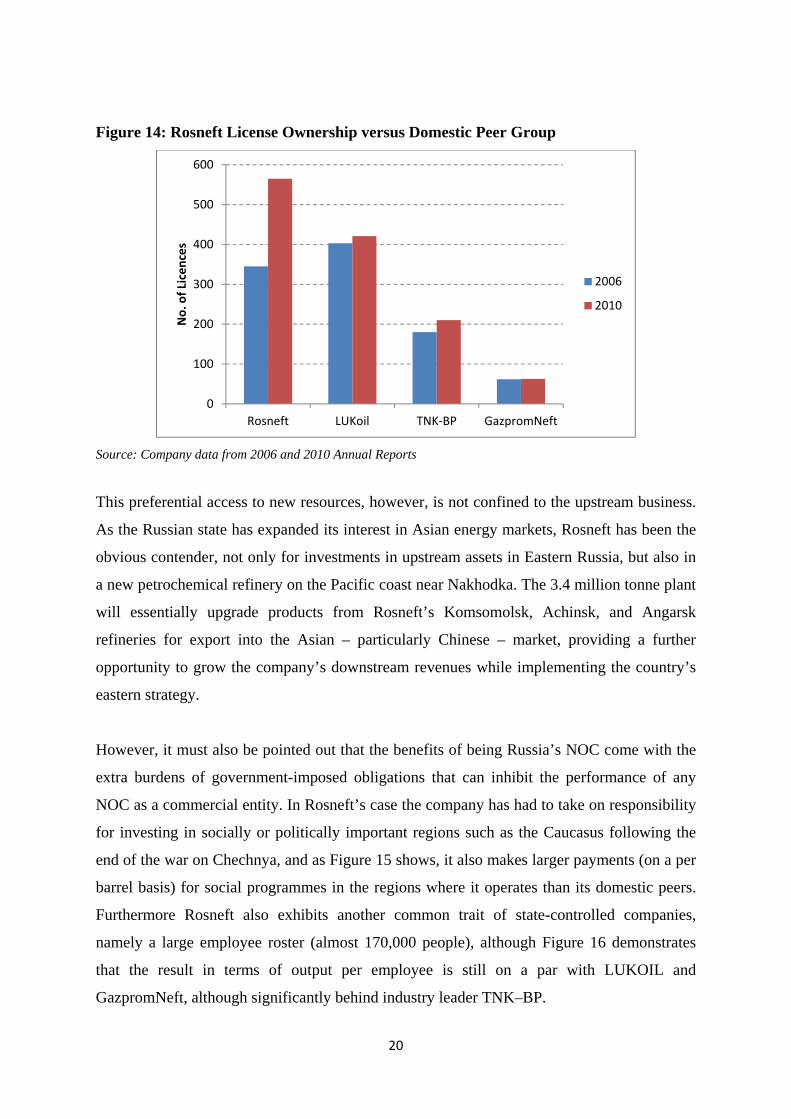
Figure 14: Rosneft License Ownership versus Domestic Peer Group
0
100
200
300
400
500
600
Rosneft LUKoil TNK‐BP GazpromNeft
No. of Licen
ces
2006
2010
Source: Company data from 2006 and 2010 Annual Reports
This preferential access to new resources, however, is not confined to the upstream business.
As the Russian state has expanded its interest in Asian energy markets, Rosneft has been the
obvious contender, not only for investments in upstream assets in Eastern Russia, but also in
a new petrochemical refinery on the Pacific coast near Nakhodka. The 3.4 million tonne plant
will essentially upgrade products from Rosneft’s Komsomolsk, Achinsk, and Angarsk
refineries for export into the Asian – particularly Chinese – market, providing a further
opportunity to grow the company’s downstream revenues while implementing the country’s
eastern strategy.
However, it must also be pointed out that the benefits of being Russia’s NOC come with the
extra burdens of government-imposed obligations that can inhibit the performance of any
NOC as a commercial entity. In Rosneft’s case the company has had to take on responsibility
for investing in socially or politically important regions such as the Caucasus following the
end of the war on Chechnya, and as Figure 15 shows, it also makes larger payments (on a per
barrel basis) for social programmes in the regions where it operates than its domestic peers.
Furthermore Rosneft also exhibits another common trait of state-controlled companies,
namely a large employee roster (almost 170,000 people), although Figure 16 demonstrates
that the result in terms of output per employee is still on a par with LUKOIL and
GazpromNeft, although significantly behind industry leader TNK–BP.
20

Figure 15: Rosneft’s Social Spending per Barrel of Production Compared to Domestic
Peers (2010)
0.00
0.10
0.20
0.30
0.40
0.50
0.60
0.70
0.80
0.90
Rosneft LUKoil GazpromNeft TNK‐BP
US$/boe
pd
Source: Company data from 2010 Annual Reports
Figure 16: Rosneft’s Production per Employee Compared to Domestic Peers (2010)
0
5
10
15
20
25
30
35
40
Rosneft LUKoil GazpromNeft TNK‐BP
Outpu
t per Employee
(boe
pd)
Source: Company data from 2010 Annual Reports
Despite these additional costs, however, Rosneft has performed well relative to its domestic
peer group and has been rewarded by investors with a premium rating that reflects not only
its operational and financial performance but also the hope that its relationship with the state
will continue to provide more benefits than burdens. Indeed this latter hope appears to be the
dominant driver of the company’s valuation, as in terms of Return on Average Capital
Employed (ROACE), although Rosneft has improved its performance relative to its Russian
21

peers, in 2010 it was only on a par with LUKOIL and GazpromNeft, and trailed significantly
behind TNK–BP (Figure 17). Despite this investors continue to be prepared give Rosneft a
premium rating over its domestic peer group, as shown in Table 1. The stock market value for
each Rosneft barrel of reserves (EV/boe) is 48 per cent higher than the average for LUKOIL,
TNK–BP, and GazpromNeft, the value for each barrel produced is 40 per cent higher
(EV/boe of annual production), and the company trades on a 37 per cent premium over the
average on the basis of its price–earnings ratio. All these metrics imply that investors view
Rosneft as having relatively better growth prospects than its domestic peers, due to its
perceived greater access to resources, and the greater opportunity it may have to exploit them
profitably, thanks to its relationship with the Russian state
Figure 17: Rosneft’s ROACE Relative to Russian peers
0
10
20
30
40
50
60
2006 2007 2008 2009 2010
ROAC
E (%
) Rosneft
LUKoil
GazpromNeft
TNK‐BP
Source: Evaluate Energy, with data sourced from company US GAAP financial reports
Table 1: Valuation metrics for Rosneft, LUKOIL, TNK–BP and GazpromNeft18 Mkt Cap. EV EV/Reserves EV/Production PE RatioUS$bn US$bn US$/boe US$/boe 2011 x
Rosneft 69.2 87.2 5.78 103.7 5.4LUKoil 44.7 50.5 2.88 62.1 3.5TNK-BP 42.5 44.0 4.99 69.0 4.8GazpromNeft 18.6 23.8 3.85 91.9 3.5Average ex Rosneft 3.91 74.32 3.93Rosneft Premium 48% 40% 37%
Source: UBS, Citigroup. Data as of 14 November 2011
18 Mkt.Cap. = Market Capitalization, calculated as share price x no. of shares in issue. EV = Enterprise Value, calculated as Market Capitalization plus Net Debt. EV/reserves = Enterprise Value / total proved reserves. EV/Production = Enterprise Value / total annual oil and gas production. PE Ratio = price earnings ratio, calculated as price per share / earnings per share. GazpromNeft data includes 50% interest in Slavneft.
22
4 Rosneft in comparison with Petrobras and Statoil
On many operating and financial measures Rosneft appears to outperform its Russian peer
group, and investors certainly seem to be prepared to give it a premium stock market rating,
based both on this performance and on the anticipation of future benefits from its close
relationship with the Russian state. However, the Russian government clearly has ambitions
in a wider geopolitical sphere and plans to use its state-owned energy companies as one
means of expanding Russia’s global importance. As President Putin stated in 2006 ‘Our
welfare at present, and to a great degree in the future, directly depends on the place we
[Russia] take in the global energy context’,19 while Deputy Prime Minister Igor Sechin,
within his responsibilities as the leading politician in charge of the Russian energy industry,
reiterated in January 2011 that the Russian government recognizes ‘the fact that the Russian
oil and gas industry is an inseparable part of the unified global energy market.’20 As such
‘national energy champions should strengthen their international positions’,21 and they should
therefore be compared not only to their domestic peer group but also to relevant companies
across the global oil and gas industry. As noted above, in the case of Rosneft, the most direct
relevant comparisons are with partial NOCs with an upstream bias, namely Statoil and
Petrobras.
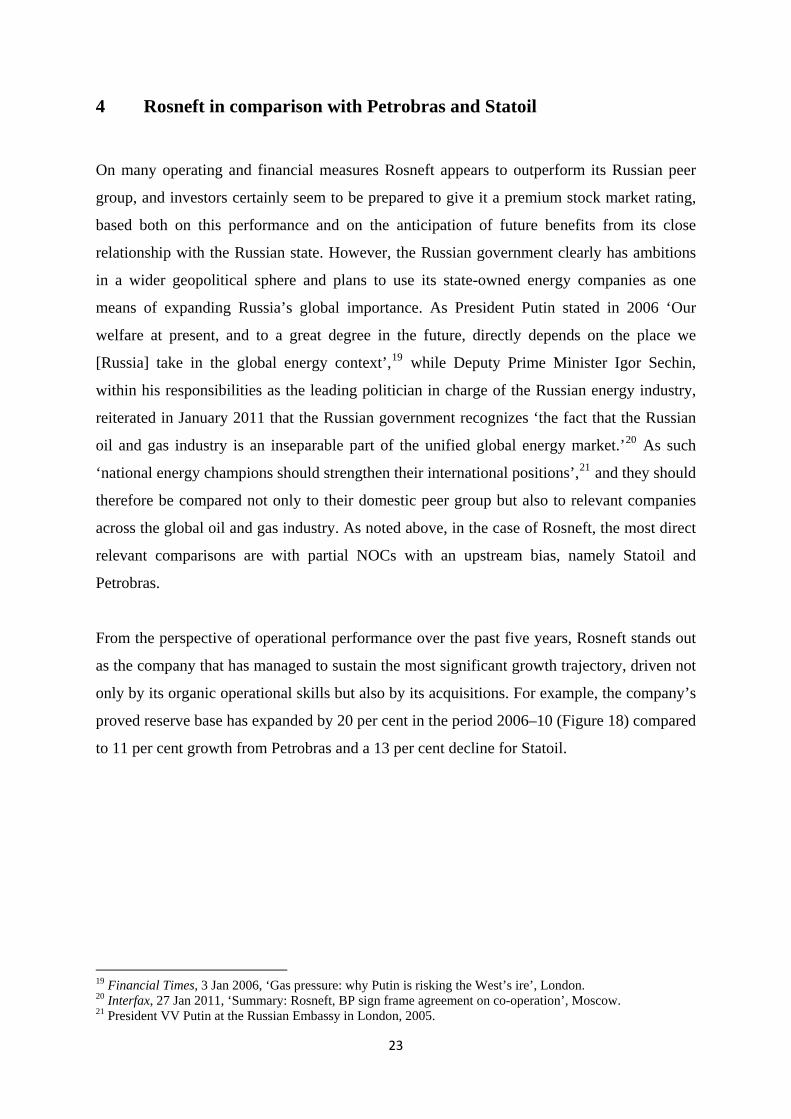
From the perspective of operational performance over the past five years, Rosneft stands out
as the company that has managed to sustain the most significant growth trajectory, driven not
only by its organic operational skills but also by its acquisitions. For example, the company’s
proved reserve base has expanded by 20 per cent in the period 2006–10 (Figure 18) compared
to 11 per cent growth from Petrobras and a 13 per cent decline for Statoil.
19 Financial Times, 3 Jan 2006, ‘Gas pressure: why Putin is risking the West’s ire’, London. 20 Interfax, 27 Jan 2011, ‘Summary: Rosneft, BP sign frame agreement on co-operation’, Moscow. 21 President VV Putin at the Russian Embassy in London, 2005.
23

Figure 18: Proved Reserves of Rosneft, Statoil and Petrobras (2006–10)
Source: Evaluate Energy, with data sourced from company US GAAP reports
0
2,000
4,000
6,000
8,000
10,000
12,000
14,000
16,000
2006 2007 2008 2009 2010
Proved
Reserves (m
mbo
e)
Statoil ASA
Petrobras
Rosneft
Rosneft’s production growth has been even more impressive, with an increase of 39 per cent
over the five year period, compared to 13 per cent growth for Petrobras and a flat production
profile for Statoil (Figure 19). The growth appears slightly less impressive if acquisitions in
2006 and 2007 are removed (31 per cent growth in production and 1 per cent growth in
reserves),22 but nevertheless Rosneft has certainly performed in line with its NOC peers
organically while benefitting from its ability to buy domestic assets with government support.
Figure 19: Total Production of Rosneft, Petrobras, and Statoil (2006–10)
Source: Evaluate Energy, with data sourced from company US GAAP reports
0
500
1,000
1,500
2,000
2,500
3,000
2006 2007 2008 2009 2010
Prod
uctio
n (kbo
epd)
Statoil ASA
Rosneft
Petrobras
22 The acquisitions of Samaraneftegas, 51% of Udmurtneft, and 50% of Tomskneft brought approximately 135 kboepd of production and 2,385 mmboe of proved reserves to Rosneft’s portfolio.
24

Rosneft’s upstream operating performance is confirmed by a comparison of reserve
replacement ratios (Figure 20) which shows that it has managed to achieve 100 per cent
replacement or more throughout the period, and has only underperformed Petrobras in the
past two years as the Brazilian NOC has made its huge new ultra-deep water offshore
discoveries. Further confirmation of Rosneft’s performance is demonstrated by its cost of
reserve replacement, which totalled $7.31 per barrel in 2010, the figure for Petrobras being
$14.41 per barrel (a figure for Statoil is not available because its reserves declined).23
Figure 20: Reserve Replacement for Rosneft, Petrobras, and Statoil (2006–10)
0%
50%
100%
150%
200%
250%
300%
2006 2007 2008 2009 2010
Statoil ASA
Rosneft
Petrobras
Source: Evaluate Energy, with data sourced from company US GAAP reports
In the downstream business, Rosneft has also performed in line with or better than its
international peer group, despite the dramatic difference in size of the respective businesses.
Statoil has a very small refining business based in Norway and Denmark, with refining
capacity of just over 300 kbpd that is generally fully utilized to supply Scandinavian
customers, but which provides Statoil with an outlet for only 32 per cent of its total liquids
production. In contrast Petrobras has total refining capacity of 2100 kbpd, providing 98 per
cent cover for its liquids output. With such a huge downstream capacity it is perhaps not
surprising that Petrobas runs at a lower 85 per cent utilization rate, as it is much more
sensitive to swings in consumer demand. Rosneft ranks between its two peers, with just over
1000 kbpd of capacity providing almost 50 per cent cover and operating (in 2010) at a 98 per
23 Data from Evaluate Energy, based on company published data in US GAAP reports
25

cent utilization rate. As such, Rosneft would appear to have the most balanced portfolio of
the three companies (given that crude oil exports have historically been a key focus for
Russian oil companies) and operates its downstream business in a highly efficient manner.
Figure 21: Refinery Utilization for Rosneft, Petrobras and Statoil
50%
60%
70%
80%
90%
100%
110%
120%
2006 2007 2008 2009 2010
Statoil
Rosneft
Petrobras
Source: Evaluate Energy, with data sourced from company US GAAP reports
However, although Rosneft has demonstrated that it can be at least the equal of its partial
NOC peer group from an operational perspective, analysis of the relative financial
performance of the three companies reveals a less flattering comparison. From a profitability
perspective, Rosneft generates significantly less pre-tax cash flow on a unit of production
basis than its peers (measured by EBITDA per barrel) and also provides on average a lower
return on its capital employed, a key measure of the financial efficiency of the company.
Figure 22 shows that Rosneft’s EBITDA per barrel is approximately 50 per cent lower than
the figure for Petrobras, but is consistently far less than half that of Statoil, with this outcome
largely being driven by high transportation costs to market and a high operating tax burden
(in particular an export tax that has historically taken 65 per cent of any revenue from export
sales above $25 per barrel).24
24 The top rate for crude export tax in Russia has been reduced to 60% in the fourth quarter of 2011, but was 65% during the time period of this analysis.
26

Figure 22: EBITDA per Barrel for Rosneft, Petrobras, and Statoil
0.0
10.0
20.0
30.0
40.0
50.0
60.0
70.0
2006 2007 2008 2009 2010
EBITDA/
boe (US$/boe
)
Statoil ASA
Petrobras
Rosneft
Source: Evaluate Energy, with data sourced from company US GAAP reports
Rosneft’s lower profitability has largely fed directly through to its return on capital
employed, although the comparison here has been somewhat mitigated by the company’s
relatively lower investment levels, especially when compared with Petrobras. Nevertheless,
Figure 23 demonstrates that Rosneft has underperformed both its peers in all but one year
since 2006.
Figure 23: ROACE for Rosneft, Petrobras, and Statoil
0.0%
10.0%
20.0%
30.0%
40.0%
50.0%
60.0%
70.0%
80.0%
90.0%
2006 2007 2008 2009 2010
ROAC
E Statoil ASA
Rosneft
Petrobras
Source: Evaluate Energy, with data sourced from company US GAAP reports
27
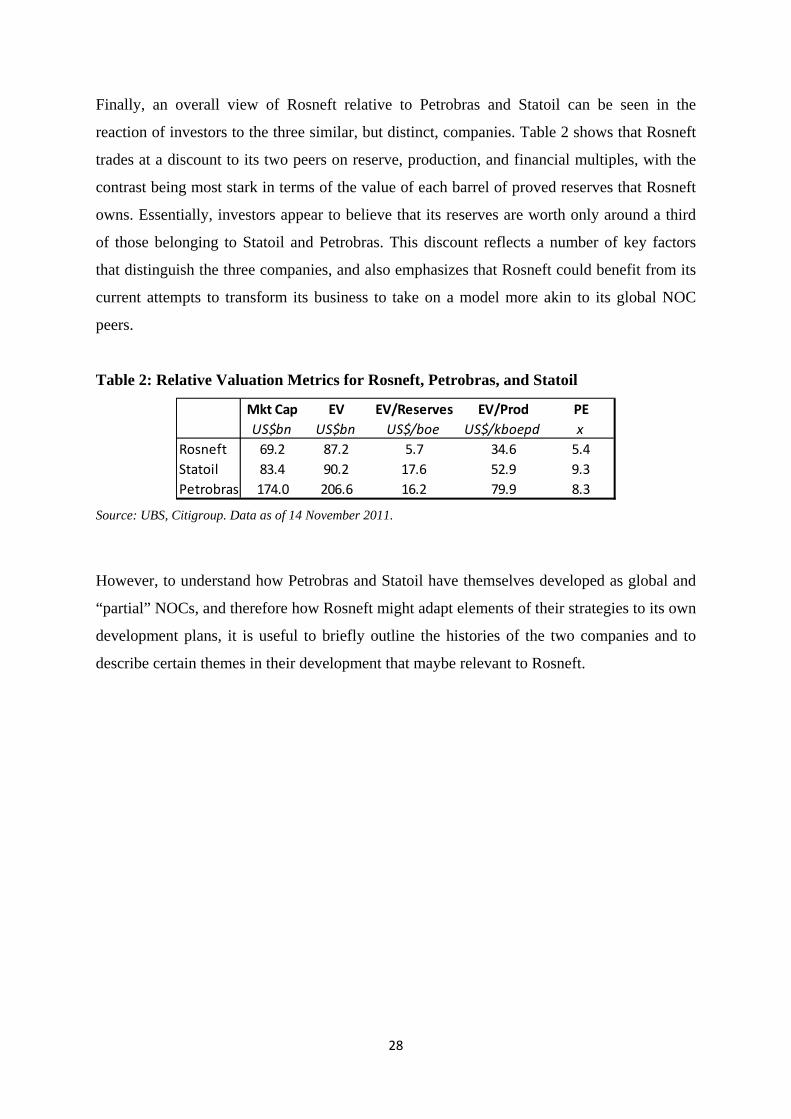
Finally, an overall view of Rosneft relative to Petrobras and Statoil can be seen in the
reaction of investors to the three similar, but distinct, companies. Table 2 shows that Rosneft
trades at a discount to its two peers on reserve, production, and financial multiples, with the
contrast being most stark in terms of the value of each barrel of proved reserves that Rosneft
owns. Essentially, investors appear to believe that its reserves are worth only around a third
of those belonging to Statoil and Petrobras. This discount reflects a number of key factors
that distinguish the three companies, and also emphasizes that Rosneft could benefit from its
current attempts to transform its business to take on a model more akin to its global NOC
peers.
Table 2: Relative Valuation Metrics for Rosneft, Petrobras, and Statoil
Mkt Cap EV EV/Reserves EV/Prod PEUS$bn US$bn US$/boe US$/kboepd x
Rosneft 69.2 87.2 5.7 34.6 5.4Statoil 83.4 90.2 17.6 52.9 9.3Petrobras 174.0 206.6 16.2 79.9 8.3
Source: UBS, Citigroup. Data as of 14 November 2011.
However, to understand how Petrobras and Statoil have themselves developed as global and
“partial” NOCs, and therefore how Rosneft might adapt elements of their strategies to its own
development plans, it is useful to briefly outline the histories of the two companies and to
describe certain themes in their development that maybe relevant to Rosneft.
28

5 Rosneft’s Peer NOCs – Petrobras and Statoil
Petrobras and Statoil both have histories that date back at least 25 years before the formation
of Rosneft, having been created in the 1950s and 1970s to champion the oil industries in
Brazil and Norway respectively. Following their establishment as their respective country’s
national oil champion and leading player, both have subsequently been privatized, have
expanded internationally, and have developed technological expertise that has not only been
relevant to the further development of their domestic asset bases but has given them industry-
leading capability on a global scale. Furthermore, they have enhanced their global status
through embracing the corporate governance rules necessitated by an international share
listing, but have also retained close links with their home government either through direct
involvement or via a tight regulatory system. As such, the histories and strategies of both
companies, as well as their corporate performance, provide an instructive comparison with
Rosneft as it continues to emerge into the international oil arena.
Petrobras
Petrobras has been the dominant player in the Brazilian oil sector since its foundation in 1953
(Petrobras, 2011a, 4), although initially it owned only 17mm barrels of proved oil reserves,
produced 2.6kbpd of crude, and operated 41kbpd of refining capacity. At this stage Brazil
was importing almost all of its oil requirements, and Petrobras was given the task of reducing
this dependence through the exploitation of its monopoly over all new upstream and
downstream developments in the country. Over the next 40 years Petrobras had considerable
success in making new discoveries both onshore and offshore, with production increasing to
177 kbpd by 1974, 467 kbpd by 1984, and 1mmbpd by 1998. However, despite this increase
in production, rising domestic oil demand meant that the country’s reliance on imports was
only reduced from 80 per cent in the early 1970s to 50 per cent by the late 1990s (Tordo,
Tracy, & Arfaa, 2011a, 57). As a result of this slow rate of change, a number of core
decisions were taken by the company itself and by the Brazilian government. These decisions
would ultimately transform both Petrobras and the Brazilian oil industry.
Firstly, as early as 1972 Petrobras decided that it needed to diversify its asset base
internationally in order to increase its resource base, reduce Brazil’s dependency on imported
oil and to gain international experience and expertise. It formed an international subsidiary,
29
BrasPetro, and began a process of investment in joint ventures across the main hydrocarbon
provinces of the world. This has resulted in an international business which now covers 27
countries and includes activities in the exploration & production, refining, distribution, and
gas & power sectors (Petrobras, 2011a, 90).
Secondly, and in tandem with this goal of international diversification, Petrobras also aimed
to become a technical leader in deep-water oilfield development. Expertise in this area was
developed both in the domestic arena, with the company first exploiting the resources of the
Campos Basin in the 1980s, and also internationally via Petrobras’ participation in assets
offshore West Africa and in the deep water Gulf of Mexico. The culmination of the
company’s growing technical capabilities came with the discovery and current development
of the ultra-deep-water resources in the Santos Basin in 2006-07, which has put Petrobras at
the forefront of the global deep-water industry and made it a leader in the development of
new technology in this frontier region. Indeed Petrobras’ status as a technology leader in this
area has been a driver of, as well as a consequence of, its international expansion. The
company’s investments in international deep-water assets have not only provided a training
ground for developing the company’s expertise but have also benefitted from Petrobras’
existing knowledge gained in the Campos Basin, providing a virtuous circle of technical
capability improvement. Ironically the significant recent exploration success in the Santos
Basin and the implications for Petrobras’ future capital expenditure may result in the
importance of the company’s international business being reduced, but nevertheless it
remains the case that international diversification has played a key role in Petrobras’
development over the past 30-40 years.
Furthermore, a third key strategic driver of Petrobras’ development was the Brazilian
government’s decision that interaction and competition with global oil companies should act
as an important means of improving Petrobras’ performance, and the decision in 1997 to end
Petrobras’ monopoly over the domestic oil sector was the key catalyst in this direction.25
Foreign companies were invited to compete for onshore and offshore licences as well as to
operate downstream assets, and furthermore Petrobras was encouraged to participate in joint
ventures with private companies. This not only encouraged the private sector’s focus on
25 Petroleum Law 9478/97.
30

efficiency and profitability to be adopted by Brazil’s state-owned NOC but also stimulated
additional transfer of upstream and downstream technology.
A fourth key step in the development of Petrobras was the decision to expose it to the
international investment community via a listing on the New York Stock Exchange (NYSE)
in 2000. The company had initially been privatized in 1992, with domestic shareholders
being offered 45 per cent of the company’s equity while the state retained 55 per cent and
approximately two-thirds of the voting rights. The state now owns 64 per cent of the common
(voting shares), with the remaining 36 per cent being owned by a combination of domestic
and international institutions (Petrobras, 2011a, 5). Exposure to US and global investors in
2000 brought a much greater need for transparency and good corporate governance, as well
as a more specific focus on the creation of shareholder value. With this in mind, the Brazilian
state was finally persuaded to deregulate the prices of crude oil, oil products, and gas in the
domestic market in 2002, providing further encouragement to international oil companies and
investors looking to co-operate with Petrobras.
Each of these strategic decisions has had different consequences and results, but overall they
have helped to transform Petrobras into a major global oil company. Primarily, the
exploration of the deep-water oil provinces off Brazil, and more recently the pre-salt
reservoirs in ultra-deep water (>2,000 metres water depth), has turned Petrobras into one of
the world’s largest oil companies by reserves, production, and market capitalization. Using its
growing technological experience, gained from its domestic and overseas activities, Petrobras
increasingly exploited its deep-water fields during the 2000s, with overall company
production levels in Brazil rising by 57 per cent over the decade to 2010, to reach over 2
million barrels per day, of which 80 per cent was from deep-water fields (Petrobras, 2011a,
24). This growth in output allowed Brazil to reach oil self-sufficiency in 2006,26 achieving
one of Petrobras’ original goals 53 years after its foundation. An important contribution to
this success has been provided by Petrobras’ partnerships with international companies such
as Shell, BG, Repsol, Anadarko, and Chevron, whose involvement in Brazil was encouraged
by the ending of the Petrobras monopoly. These have played a role in the discovery and
current exploitation of the pre-salt layers of the Santos Basin, where new technology is not
only allowing the development of oil reserves in very deep water but is also seeing drilling
26 www.iea.org, by country – Brazil.
31
into, and production from, some of the deepest geological structures ever addressed by the
global oil industry (between 6 and 7,000 metres below the surface of the water, 4–5,000
metres below the seabed). Petrobras’ own domestically-developed experience of deep-water
exploration has also clearly brought much expertise to bear in these new discoveries, but
partnership with international oil companies has not only contributed a diversity of
knowledge, it has also allowed Petrobras to spread its risk and to share the enormous capital
costs of the projects (Economist, 2011). Although the discoveries are too recent to have had
much impact on the company’s proved reserve base (which now stand at 15 billion barrels), it
is now estimated that Petrobras’ proved and probable reserves total over 30 billion barrels,
while the inclusion of technical reserves (discovered but not fully appraised) could extend
this to over 50 billion barrels, compared with the 10 billion barrels of reserves which the
company possessed in 2000.
The impact of the international listing of Petrobras’ shares has also played a key role in
providing both financing and a new corporate governance outlook that has aided the
company’s development. Since 2000, when the company listed on NYSE, Petrobras’ market
capitalization has risen by a factor of nine, from $26bn to $240bn in 2011, providing the
Brazilian government with a significant return on its investment, but more importantly
offering important access to capital for its NOC. Petrobras’ plans to develop the country’s
ultra-deep reserves will involve $214 billion of capital investment domestically during the
period 2011–15, and a major part of the funding for this outlay has been provided by a $70
billion equity share sale that took place in September 2010.27 The funds from the sale
benefitted both Petrobras and the Brazilian government, as a share of the proceeds was paid
by the company to the state to secure access to new concessions, demonstrating that
Petrobras’ success as an oil explorer and its established 10-year track record for corporate
governance and financial transparency have now reaped benefits for its major shareholder.
However, Petrobras’ growth as an internationally significant oil company has not removed its
obligations as Brazil’s domestic NOC; for example in 2010 the company spent $402 million
on social programmes (Petrobras, 2011b). More significantly, given the company’s major
capital expenditure commitments, Petrobras has a responsibility to ensure significant local
27 Financial Times, 24 Sept 2010, ‘Petrobras offering raises $70bn’Sao Paolo.
32

content in all its field developments. The requirement for the most recent licences28 is for
local content of 37–55 per cent in the exploration phase and 55–65 per cent in the
development and production phase. Furthermore Petrobras is also playing a key role in the
strategic growth of Brazil’s oil service industry, providing the vital planning and expenditure
schedule, as well as identifying the key services that will need to be developed. Petrobras
itself expects to employ more than 210,000 professional staff across almost 200 disciplines
by 2015 (up from 81,000 in 2010) in order to sustain its growth trajectory, which will make it
Brazil’s largest single employer (apart from the state).
Petrobras’ domestic obligations as Brazil’s NOC have also led it to increase its exposure to
the refining, gas and power industries, which are all now making or are set to make important
contributions to the company’s growth. Petrobras already dominates the downstream business
in Brazil, with throughput at its refineries reaching 1.8 million bpd in 2010 (Petrobras,
2011c), but the company plans to increase its refining capacity by a further 1.4 million bpd by
2020 in order to meet rising domestic oil product demand (Petrobras, 2011a). Growth in the
gas sector is also being driven by rising demand across all sectors of the Brazilian economy,
and Petrobras’ role in meeting this demand is not only as a producer but also as a transporter
of gas. Total domestic gas production is estimated to exceed 100bcm by 2020, with Petrobras
providing much of this via associated gas from its new offshore oil discoveries, but the
company is also managing the additional import of LNG into Brazil as well as piped imports
from Bolivia. In order to distribute this gas across the major population centres of Brazil
Petrobras has also constructed almost 10,000 km of pipeline infrastructure as well as 40
compressor stations (Petrobras, 2011a, p. 85). Allied to this growth in its gas business
Petrobras also now operates almost 6GW of power generation capacity in Brazil.
Nonetheless, the need for Petrobras to support the Brazilian economy as the country’s NOC
also brings it the benefit of being the country’s state representative in the oil sector. The
discovery of vast new offshore reserves since 2007 has caused the government to re-think its
model for corporate participation in the domestic oil sector, with Petrobras’ dominant
position being reinforced. Following the removal of its monopoly position, Petrobras was
forced to compete with international and domestic oil companies for interests in concessions
issued by the Brazilian authorities, although its extensive experience of the country’s
28 Licences awarded in Rounds 7, 9, and 10.
33

petroleum basins allowed it to remain the largest player, despite the increased competition
(Tordo, 2009). This competitive concession regime has now been replaced by a production
sharing agreement regime, under which Petrobras will become the operator of every field in
the pre-salt layers, and will have a minimum 30 per cent stake, thus partially reintroducing
the NOC monopoly model for new fields. As a result of this increased access Petrobras
already anticipates a doubling of its proved reserve base over the next few years from
existing discoveries alone, and total company production is forecast to increase from 2.6
million boepd29 in 2010 to 6.4 million boepd in 2020 (Petrobras, 2011a).
In summary, the combined strategies of Petrobras and the Brazilian state have created a
company that provides a blend of NOC access and domestic focus with a world-leading
technological expertise in deep-water development, financial capital and exposure to
international assets. This has catalysed the successful establishment of Brazil’s oil sector as a
major exporting, rather than importing, industry. International partners have played a role in
the exploration and initial development of a major new hydrocarbon province in the deep
water offshore and Petrobras’ international assets now contribute approximately 20 per cent
of the company’s total output, bringing welcome risk diversification as well as broad
operating experience. Having said that, Petrobras’ future will be driven by its domestic
exposure as Brazil’s state-controlled NOC and its dominant player, albeit with wider
responsibilities as an internationally quoted company, with its favoured status at home further
underlining its attractiveness as a partner for foreign oil companies.
Statoil
The history of Statoil has some interesting similarities with that of Petrobras, although there
are also some key differences. These are mainly driven by the fact that significant exploration
success in Norway came at a relatively much earlier stage than in Brazil, and also that
Norway has been an oil and gas exporter since 1975, only four years after first production
from the Norwegian Continental Shelf (NCS). Furthermore, Petrobras had to take significant
exploration risk in order to discover its reserves while many of Statoil’s discoveries have
been transferred to it under the original Norwegian oil sector regulations. Nevertheless, both
companies are major oil and gas producers who dominate their domestic industries, both have
developed a position as technology leaders in frontier areas for oil and gas exploration and
29 Barrels of oil equivalent per day, a measure of combined oil and gas production.
34

development, both have developed significant international operations as a result of this
expertise and also in order to enhance their operational capabilities and to diversify their
overall businesses, both have extensive partnerships with international oil companies, and
both have been quoted on international stock exchanges since the early years of the 21st
century30 while retaining government control over at least 51 per cent of their voting shares.
As such, their combined history provides interesting parallels and contrasts with that of
Rosneft.
Statoil was formed in 1971, two years after the first major discovery on the NCS (the Ekofisk
field) when the Norwegian government decided to assert its control over the development of
the country’s oil industry (Tordo, Tracy, & Arfaa, 2011b). It received its first licences two
years later in 1973, but unlike Petrobras was not given a monopoly over the domestic oil
sector, with Norsk Hydro, another state-owned company, Saga Petroleum, a publicly owned
Norwegian company, and IOCs also permitted to bid for licences during the regular bidding
rounds. However, Statoil was given two key privileges – a minimum 50 per cent stake in all
exploration licences (with costs carried by the other partners) and the right to increase this
stake to as much as 80 per cent if any commercial discovery was made – in return for which
it had to ensure that the interests of the Norwegian government were fully supported in the
development of the domestic oil sector. Statoil essentially became the commercial arm of the
Norwegian state, learning from its experience of competing with domestic and foreign
companies, but also using its special access privileges to acquire technical and operating
expertise from all its partners. It was also very deliberately separated from the influence of
the country’s politicians, who were forbidden to sit on the company’s board and instead
regulated the sector via the Norwegian Petroleum Directorate (NPD) and the Ministry of
Industry (Thurber & Istad, 2010, 15).
However, the success of Norway’s oil industry, where oil production grew from 32 kbpd in
1973 to 1100 kbpd by 1987, meant that Statoil’s position in the relatively tiny Norwegian
economy inevitably caused it to become an increasingly influential political vehicle.
Concerns about the growing power of the company’s management, combined with
complaints from international companies that Statoil’s dominance was undermining the
attractiveness of Norway as a place to do business, led to a major change in January 1985
30 Petrobras was listed in New York in 2000, Statoil in New York and Oslo in 2001
35

with the creation of the State’s Direct Financial Interest (SDFI), a state-owned entity which
took ownership of more than half of Statoil’s licence interests. This reduction in Statoil’s
influence on the NCS, combined with a scandal concerning cost over-runs at its Mongstad
refinery, led to a radical overhaul of strategy at the company, with a new CEO (Harald
Norvik, appointed in 1988) determined to broaden both Statoil’s international exposure
(beyond its initial investment in the Netherlands made in 1985) and its ownership base.
The internationalization process had three main drivers. The first was to allow Statoil to
diversify away from what was perceived as an increasingly mature NCS, the second was to
allow a greater exposure to international operating and governance standards against which
the company could benchmark its performance, and the third was to reinforce the identity of
Statoil as a company separate from the Norwegian state. With these goals in mind, an
international exploration partnership was formed with BP in 1990. During the decade to
1999, this partnership allowed Statoil to gain access to overseas assets, many of which remain
vital to its portfolio in 2011,31 and to broaden its experience of operating in the international
oil industry from both a technical and commercial perspective. In return Statoil provided cash
to help fund the joint investments that BP could not afford alone as well as potential access to
the NCS for BP, although this never truly materialised in practise. Following the end of the
alliance with BP (in 1999) Statoil continued to broaden its international upstream exposure
under the leadership of new CEO Helge Lund32 and now has interests in oil and gas fields in
18 countries, focussing its activities on the exploitation of its technological advantages in
complex offshore assets that can have a high impact on the company33 as well as on new
technologies such as the development of shale oil and gas.
Further confirmation of Statoil’s increasing autonomy was provided in 2001 when the
company was privatized via a share sale on the Oslo and New York Stock Exchanges, with a
19 per cent stake in the company being sold for $16bn. The state’s interest was further
reduced to 70 per cent in 2005 via a second share sale, and then gradually fell to 67 per cent
over the following 12 months. However, during this period Statoil increasingly found itself in
competition with Norway’s other state-controlled energy company, Norsk Hydro, which had
acquired Norway’s third oil company, Saga Petroleum, in 1999. By 2006 the two state-owned 31 Statoil entered into projects in Kazakhstan, Vietnam, China, Nigeria, Azerbaijan, and Angola as a result of its alliance with BP. Angola, Azerbaijan, and Nigeria remain vital parts of the company’s asset portfolio in 2011. 32 Helge Lund was appointed CEO of Statoil in 2004 33 Helge Lund, in a presentation to investors in June 2011, “Positioned for long‐term growth”
36
companies found themselves bidding against each other in a variety of international arenas –
for example to become partners of Gazprom at the Shtokman field in the Russian sector of
the Barents Sea. It became increasingly clear that Norway should, as a result, have one rather
than two NOCs in order to maximize the combined company’s expertise and financial
capability as well as to avoid unnecessary confusion as to the true representative of Norway’s
oil interests at home and abroad. The merger of the two companies occurred in 2007, as a
result of which Statoil once again controlled approximately 80 per cent of production
operatorship in Norway (Thurber & Istad, 2010, 17), and while the Norwegian state’s interest
in the larger entity initially fell to 62.5 per cent, it has since returned to 67 per cent thanks to
the purchase of shares in the open market.
In summary, the company as it exists today, following 40 years of development, has a
number of key characteristics. Firstly, it dominates its domestic oil sector in Norway, but
does so under the spotlight of significant international competition. Secondly, while it
maintains a position of independence from the Norwegian state, it clearly has to be
responsive to its government’s needs both in Norway and overseas. Domestic issues such as
local content, employment, and the maintenance of a national service industry remain
important, and the company must also be sensitive to issues of public opinion (especially on
the environment) and politics. Internationally, Statoil can benefit from the backing of the
Norwegian state as an experienced oil sector government with a regulatory framework that is
held up as a model for the industry’s development, but must also respond to the wider foreign
policy interests of Norway (for example in the lengthy negotiations with Russia over the
‘Disputed Zone’ between the two countries in the Barents Sea).
Thirdly, Statoil has developed a model for international partnership in Norway combined
with the building of a significant international business overseas, which now goes well
beyond the original countries included in the BP Alliance. Investments in Brazil, Iraq,
Algeria, Canada, and the USA offer significant advantages for the company as well as further
opportunities for gaining experience that can be used in developing new areas in Norway,
such as the northern deeper waters of the Barents Sea. Fourthly, as a result both of its lengthy
experience of operating challenging fields in Norway and subsequently its international
exposure, Statoil has developed a reputation for technical innovation that is applicable across
its asset portfolio. This makes it an attractive partner for companies in challenging or remote
areas such as Arctic Russia or the deep-water regions of Brazil, and Statoil is further
37
developing its technical expertise by expanding into new areas such as unconventional gas
and oil sands, via acquisitions in the USA and Canada. Fifthly, Statoil has become not only
an important oil company but also one of the key players in the European gas market,
producing approximately 45bcm of gas from the NCS in 201034 when it was the second
largest seller of gas into the continent behind Gazprom (Statoil, 2011). The company is also
developing a significant gas business in the US, focussed predominantly on the development
of shale gas via its strategic co-operation with Chesapeake Energy and its 2010 joint venture
with Talisman. Statoil is also a producer and marketer of LNG from its domestic Snohvit
project, and has major gas interests in Azerbaijan and Algeria. As such it is a true oil and gas
company, with its production split almost equally between the two hydrocarbons.
Finally, Statoil’s position as a publicly quoted NOC has offered it a mixture of benefits, on
the one hand giving it a more commercial and transparent corporate culture that has been
forced to focus on shareholder value, while on the other retaining the benefits of being a
fellow NOC, which can smooth relations in countries such as Brazil, Russia, Azerbaijan, and
Algeria where other NOCs are the dominant players. However, it should also be
acknowledged that the regulatory and governance model developed in Norway has also
helped to improve Statoil’s standing in many emerging hydrocarbon-owning countries as it is
seen not only as an experienced industry player but also as a standard bearer for the widely
admired “Norwegian model” of oil and gas sector development. This does not detract from
Statoil’s achievement in becoming a global NOC, but is clearly an exogenous factor that
needs to be taken into account when considering any comparison with Rosneft.
Nevertheless, the combination of its corporate characteristics has brought Statoil to a position
where it is certainly a peer against which Rosneft can be compared, and it is potentially a
model for its future development. Statoil has faced the challenges of a maturing domestic oil
province, a need to diversify internationally, a desire to develop challenging new
hydrocarbon provinces, the necessity of satisfying a domestic political and social
constituency, and the requirement to meet international rules of governance and financial
transparency to satisfy its broader shareholder base. In the process, it has become one of the
world’s largest quoted oil companies, being valued among the top 20 oil companies in the
world (Petroleum Finance Corp, 2011).
34 Data from Evaluate Energy, sourced from company financial reports
38
6 Key Themes in the Potential Development of Rosneft as a Global NOC
As Rosneft develops its own growth strategy, with the overall goal of truly establishing itself
as the Super-NOC it aims to be, it is adopting a number of tactics that can be seen in the
histories of Petrobras and Statoil. These are a) international expansion and diversification,
linked in the case of Rosneft with b) partnership with an IOC and c) development of technical
expertise that is relevant in a domestic environment and also potentially on the global stage.
Further Rosneft also appears to be seriously considering d) diversification into the gas
business, and in terms of e) corporate governance and share ownership, is also planning a
broader ownership structure and a potential further reduction in the role of the State in its
operations.
International diversification, partnership and development of technical expertise
Three key interlinked elements in the development of both Statoil and Petrobras as global
companies have been international diversification, a willingness to partner with international
companies in the home market and overseas, and the development of technological expertise
that has enabled both companies to become industry leaders in specific areas of the oil and
gas industry. Petrobras initially used international expansion in its search for sources of oil
that could reduce Brazil’s import dependency, and in tandem with this strategy also
developed a leading deep-water capability that could be used across its entire asset portfolio.
It has now become a global leader in deep-water technology, and also uses partnerships with
IOCs to help it to spread the risk and maximize the technical expertise available for the
exploration and development of its deep-water oil reserves. Statoil’s motivation for
international expansion was a perception that the Norwegian continental shelf had become a
mature province and that corporate growth could therefore only be sustained by overseas
diversification. As a result of its alliance with BP and partnership with other IOCs, Statoil
managed not only to expand its resource base but also to continue the process of technology
acquisition (which had already begun in the development of complex fields in Norway) that
now makes it one of the world leaders in subsea developments and in the exploitation of
fields in harsh geographical offshore environments.
Rosneft finds itself with a mixture of the issues faced by Petrobras and Statoil. The company
has no reserves or production outside Russia, and only participates in four small exploration
39

projects in Algeria, Kazakhstan, Abkhazia, and the UAE. This contrasts starkly with
Petrobras, which now has operations in 25 countries, where 700 mmboe of reserves and 245
kboepd of production are located, and Statoil, which is spread across 42 countries and has 1.2
billion barrels of international proved reserves producing 330 kboepd of entitlement
production. As a result, Rosneft currently finds itself heavily reliant on a core asset base that,
as can be seen from the Yukos and Other assets bars in Figure 24, is in large part mature with
production that has effectively ceased to grow.
Figure 24: Rosneft Output Growth Only Generated by New Vankorneft Production
‐
500
1,000
1,500
2,000
2,500
2005 2006 2007 2008 2009 2010
Prod
uctio
n (kbo
epd)
Vankorneft
Other assets
Yukos assets
Source: Rosneft Databook, Q3 2011
Following the boost given by the acquisition of Yukos assets in the period 2004–7, Rosneft’s
core assets (seen in red and green in Figure 24) showed continued organic growth up to 2008,
but since then have started to go into gradual decline. Indeed the only reason why Rosneft’s
overall production has continued to grow has been the development of the Vankor field,
located in a previously undeveloped region on the border of East and West Siberia. This new
field is set to continue growing until it reaches peak output of over 500 kbpd in 2014/15, and
should offset any decline in Rosneft’s other assets until then, but it provides a specific
example of a trend that has become increasingly clear in Russia over the period since 2008.
This is that future production growth will only be sustained by the development of greenfield
sites in more remote and challenging parts of the country. The development of the Vankor
field required the construction of new pipeline infrastructure in a region that was previously
not connected to the main trunk pipe system, and which also needed tax breaks to stimulate
40
investment, even though that investment was being made by the country’s NOC and was part
of the country’s overall strategy to focus on the development of eastern Russia and its links
with Asia (Vankor crude is being exported via the ESPO pipeline to China and the Pacific
region).
While this trend of remote field development in harsh environments is set to provide Rosneft
with significant challenges, it will also bring opportunities for long-term growth and the
development of competitive advantage, as it potentially combines the Petrobras/Statoil
strategies of international diversification and partnership with the development of technical
expertise that can ultimately transform it into a leading global player. The main focus of this
opportunity is the Russian offshore, in particular the Arctic, a region where Russia controls
more than 70 per cent of the estimated oil and gas resources (USGS, 2009). Rosneft is one of
only three Russian companies, all state-owned or state-controlled, which are qualified to bid
for licences in the region, providing it with a significant competitive advantage – similar to
the opportunities offered to Petrobras in Brazil’s deep-water offshore fields.
Rosneft started to fully exploit this advantage in 2011, not only to address its long-term
domestic growth prospects but also its international ambitions. During 2010 the company
acquired four licences on the Arctic shelf, three in the south Kara Sea, and one in the Barents
Sea (Rosneft, 2011b, 50), and in 2011 the company took the decision to bring in an
international partner to assist with the technological and financial issues regarding
exploration and development in the area. An initial deal with BP, signed in January 2011,
subsequently collapsed,35 but was replaced by a partnership with ExxonMobil covering the
exploration and development of the three Kara Sea blocks.36 This second deal is set to
provide Rosneft with the opportunity to meet a number of its strategic growth objectives.
Primarily it will provide the immediate expertise and financing required to begin the
exploitation of a very promising area of the Russian Arctic, with the potential for huge oil
and gas discoveries (the three licences are estimated to contain 36 billion barrels and 10 tcm
of gas resources (Rosneft, 2011a, 21)), and will also provide the opportunity for long-term
knowledge acquisition by Rosneft and other Russian entities. An Arctic Research and Design
35 Interfax, 17 May 2011, ‘Rosneft out of BP deal due to unacceptable AAR terms’, Moscow. 36 Interfax, 30 Aug 2011, ‘Rosneft ExxonMobil ink strategic co-operation deal’, Moscow.
41

Centre for Offshore Developments has already been established in St. Petersburg,37 where
research and development, training, and environmental assessment work will be carried out,
while personnel exchanges and joint work programmes will also assist in the transfer of
knowledge from ExxonMobil – which has significant offshore Arctic experience in Canada –
to Rosneft.38 This could allow Rosneft to establish itself, and Russia, as a leader in Arctic
development technology at a time when increasing industry focus is being placed on the
region.
The partnership with ExxonMobil in Russia, however, stretches beyond the Arctic to include
offshore exploration in the Black Sea, and also the extraction of heavy oil in West Siberia,
where the US company has offered to share its technology.39 As a result of this broad co-
operation, Rosneft will also be offered the chance to participate in corresponding
international ventures in partnership with ExxonMobil, including in Canada (covering the
Arctic dimension), the Gulf of Mexico (offshore), and Texas (onshore tight oil). Therefore
Rosneft will have the opportunity not only to diversify its upstream portfolio away from
Russia, but also to gain direct experience of field development that can be used to optimize
its operational performance in Russia. Eduard Khudainatov, the president of Rosneft,
summarized the situation ‘We have a clear vision of Rosneft’s strategic direction – building
world-class expertise in offshore operations and enhancing oil recovery. The partnership
between Rosneft with its unique resource base, and the largest and most highly capitalized
company in the world [ExxonMobil] reflects our commitment to increasing the capitalization
of our business through application of best-in-class technology, innovative approach to
business management, and enhancement of our human resource potential’.40
In 2011 Rosneft also took steps to expand the reach of its downstream business. In May it
completed the acquisition of a 50 per cent stake in the Ruhr Oel joint venture in Germany,
buying out Venezuelan company PdVSA, and becoming a partner with BP. The purchase has
increased Rosneft’s refining capacity by 11.6 million tonnes per annum (an increase of more
than 20 per cent) and given it access to the European market where much of its crude exports
37 Established on 24 October 2011. 38 Interfax, 31 Aug 2011, ‘Sechin: Rosneft-ExxonMobil deal includes work in Kara, Black Seas, Gulf of Mexico, Texas’, Moscow. 39 Interfax, 31 Aug 2011, ‘ExxonMobil to help Rosneft extract hard-to-recover oil reserves in West Siberia’, Moscow. 40 Rosneft press release, 30 Aug 2011, ‘Rosneft and ExxonMobil to join forces in the Arctic and Black Sea Offshore, enhance co-operation through technology sharing and joint international projects’, Moscow.
42

flow (indeed the Russian Druzhba oil pipeline supplies Ruhr Oel’s four refineries).
Furthermore it has made Rosneft a partner with one of the most experienced European
refiners, giving it direct exposure to operational techniques and management that will enable
the company ‘to enrich our own refining and petrochemical business with the latest European
experience and most up-to-date technologies.’41
During 2011 progress was also made on Rosneft’s second international downstream project,
namely the construction of the Tianjin refinery in China. This plant provides an opportunity
for Rosneft to further cement its links in a key Asian growth market, following the start of
piped oil exports to China via the ESPO spur in January 2011, and again emphasizes how the
company is attempting to diversify its involvement in the entire oil industry value chain.
Overall, then, it would appear that during 2011 Rosneft has made significant steps towards
expanding the global scope of its business, acquiring new technology that could allow it to
become a leading global expert in an emerging new oil and gas province, diversifying its
upstream and downstream asset base, and gaining experience of operating international assets
that can be used to optimize the performance of its business in Russia. These tactics have
resonance with the strategies used by Petrobras and Statoil, but an additional interesting
comparison can also perhaps be made between Rosneft’s emerging international strategy and
that adopted by fellow Russian company LUKOIL in the 1990s and early 2000s. At that time,
prior to the resurgence of Rosneft, LUKOIL was widely regarded as Russia’s oil
representative in the global energy market, with an initial focus on former CIS countries. A
first upstream investment in Azerbaijan in 1994 was followed by the purchase of downstream
businesses in Romania, Bulgaria, Ukraine and the USA, and the company has since expanded
further into the Caspian region via asset purchases in Kazakhstan and Uzbekistan as well as
into West Africa, Venezuela, Egypt, Colombia, and Iraq. Interestingly, though, the majority
of these investments are now based on individual partnerships and joint ventures with
specific partners in each country, as both of LUKOIL’s attempts at strategic partnership with
IOCs have failed to produce material results.
In 1995 LUKOIL engineered a ground-breaking transaction with US oil company ARCO,
which saw the formation of a joint venture (LUKARCO) and the acquisition of a 7.99 per
41 Eduard Khudainatov, Rosneft president, in Rosneft press release, 5 May 2011.
43

cent equity stake by ARCO in LUKOIL. Although the intention was to build an international
partnership based on investments by both companies into LUKARCO, suitable reciprocal
offerings could never be found and the JV only ever owned its original assets, which were a
share in the Caspian Pipeline Consortium and two upstream assets in the Caspian region.
Ultimately ARCO was purchased by BP, the share stake in LUKOIL was sold in 2001,42 and
LUKARCO was dissolved in 2009.43 LUKOIL then made a further attempt at international
strategic partnership in 2004 when it encouraged a second US oil firm, CononoPhillips, to
buy shares and form another upstream joint venture. ConocoPhillips eventually purchased 20
per cent of LUKOIL’s equity by 2007 and also owned a 30 per cent stake in the
Naryanmarnefetgas JV in the Timan Pechora region of north-west Russia, but once again a
lack of sufficient reciprocity, as well as ConocoPhillips’ financial problems, led to the failure
of the overall concept. Essentially ConocoPhillips was unable to provide LUKOIL with the
international diversification that it desired to balance the joint Russian investment made by
the two companies, and when the financial crisis of 2009/10 forced ConocoPhillips to dispose
of assets in order to reinforce its balance sheet, its shares in LUKOIL were sold.44
Rosneft’s current plans to expand internationally, using partnership in Russia as a platform,
have clear similarities to LUKOIL’s tactics, and therefore it is important to consider whether
there may be any particular features of the Russian context that could undermine Rosneft’s
desire to emulate the internationalization strategy successfully employed by Petrobras and
Statoil. The key risk would appear to be that sufficient reciprocity between Russian and
international investment may be difficult to find. Russia’s huge resource base has long been
attractive to IOCs, but they have struggled to find international assets that can match in terms
of size and/or value for their Russian partners. In the case of Rosneft’s partnership with
ExxonMobil, it is too early, in January 2012, to tell whether this will be an issue, but
discussions about involving Rosneft in relevant international projects have clearly begun,
with involvement in the North American continent a primary focus. Importantly, too, the
Russian assets involved, namely licences in the Arctic, are very long term in nature and with
unclear value, as the resources have yet to be explored let alone developed. Furthermore it is
clear that at present there is an obvious balance between the technical expertise being brought
by the foreign partner, and the domestic access being brought by Rosneft, and that this
42 Daily Telegraph, 31 Jan 2001, ‘BP sells LUKOIL stake to focus on Siberia gas’, London. 43 BP press release, 11 Dec 2009, ‘BP sells LUKARCO stake to LUKOIL’, London. 44 Bloomberg, 28July 2010, ‘ConocoPhillips to sell LUKOIL stake after posting profit gain’, Moscow.
44
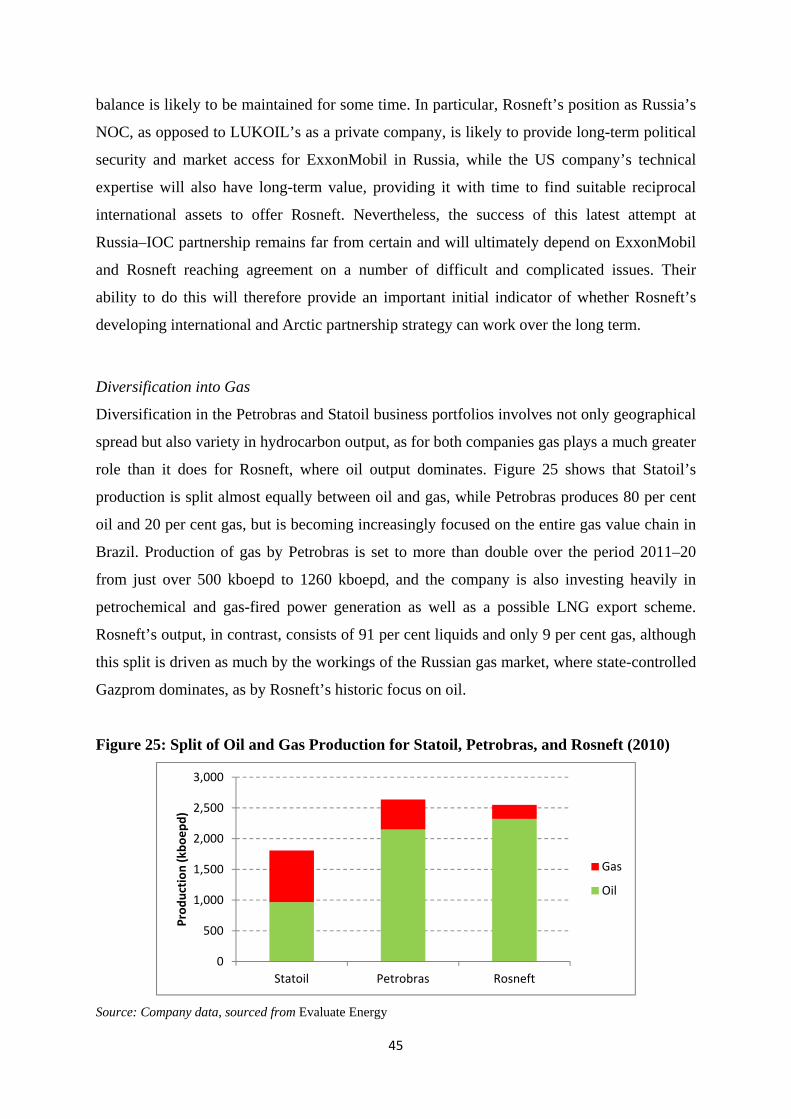
balance is likely to be maintained for some time. In particular, Rosneft’s position as Russia’s
NOC, as opposed to LUKOIL’s as a private company, is likely to provide long-term political
security and market access for ExxonMobil in Russia, while the US company’s technical
expertise will also have long-term value, providing it with time to find suitable reciprocal
international assets to offer Rosneft. Nevertheless, the success of this latest attempt at
Russia–IOC partnership remains far from certain and will ultimately depend on ExxonMobil
and Rosneft reaching agreement on a number of difficult and complicated issues. Their
ability to do this will therefore provide an important initial indicator of whether Rosneft’s
developing international and Arctic partnership strategy can work over the long term.
Diversification into Gas
Diversification in the Petrobras and Statoil business portfolios involves not only geographical
spread but also variety in hydrocarbon output, as for both companies gas plays a much greater
role than it does for Rosneft, where oil output dominates. Figure 25 shows that Statoil’s
production is split almost equally between oil and gas, while Petrobras produces 80 per cent
oil and 20 per cent gas, but is becoming increasingly focused on the entire gas value chain in
Brazil. Production of gas by Petrobras is set to more than double over the period 2011–20
from just over 500 kboepd to 1260 kboepd, and the company is also investing heavily in
petrochemical and gas-fired power generation as well as a possible LNG export scheme.
Rosneft’s output, in contrast, consists of 91 per cent liquids and only 9 per cent gas, although
this split is driven as much by the workings of the Russian gas market, where state-controlled
Gazprom dominates, as by Rosneft’s historic focus on oil.
Figure 25: Split of Oil and Gas Production for Statoil, Petrobras, and Rosneft (2010)
0
500
1,000
1,500
2,000
2,500
3,000
Statoil Petrobras Rosneft
Prod
uctio
n (kbo
epd)
Gas
Oil
Source: Company data, sourced from Evaluate Energy
45

However, once again Rosneft is taking active steps to try and redress the balance of its
portfolio. Non-Gazprom producers in Russia are being encouraged not only by rising
domestic prices (Henderson, 2011) but also by government policy that is encouraging
increased supply from ‘independent’ producers such as Novatek and the Russian oil
companies. Rosneft has significant gas reserves available (816bcm of proved reserves at the
end of 2010),45 either associated with its oil production or in specific gas fields, which it has
been keen to produce since 2006 but for which it has been unable to find a market due to the
difficulty of securing sufficient transport capacity in the trunk pipeline system. However, the
Russian government’s insistence that gas flaring be reduced to only 5 per cent of associated
gas output has forced Gazprom to make extra pipeline capacity available, as a result of which
a number of oil companies are now developing more active gas strategies (Henderson, 2010).
In early 2010 Rosneft signed agreements with Gazprom that will see 20bcma of pipeline
capacity made available for production from the Kharampur field in 2014,46 with a further
7bcma added in 2015, thus allowing Rosneft to triple output from the 12.5bcm produced in
2010. The company then believes that it has the potential to increase output further, to 55bcm
by 2020, on the assumption that it can gain additional concessions on access from Gazprom,
and if this can be achieved then gas could make up as much as 30 per cent of Rosneft’s total
hydrocarbon production by 2020. Furthermore, the company could also be involved in LNG
exports in the Far East, if gas from the Sakhalin 1 project, where is it a 20 per cent partner, is
ultimately included on an expanded Sakhalin LNG scheme or is sent to a new plant in
Vladivostok. In summary, despite the short-term constraints being placed upon Rosneft by
the workings of the Russian gas sector, the company has concrete plans to diversify its
hydrocarbon output to include a greater share of gas, and could realistically see some of its
eastern gas exported by the end of the decade.
Corporate Governance, Shareholder Structure, and State Influence
Issues of corporate governance and state influence are less easy to define in terms of the
specific differences between Statoil, Petrobras, and Rosneft. Figure 26 shows the government
shareholdings in each of the companies, but even this simple analysis does not provide a
definitive picture. Petrobras would appear to have the lowest level of state ownership, with
the Brazilian government owning less than 50 per cent of the company’s total equity and 64
45 Rosneft presentation, ‘Rosneft – Company Highlights’, Feb 2011. 46 Interfax, 16 Mar 2010, ‘Rosneft may receive greater access to Gazprom’s pipelines in 2014’, Moscow.
46

per cent of the voting shares (Petrobras, 2011a, 5). The Norwegian government has a 67 per
cent stake in Statoil, while the Russian government owns 75 per cent plus one share in
Rosneft, giving it a super-majority that enables it to decide on all strategic decisions of the
company. Its share rises to almost 85 per cent if the company’s treasury shares, which can be
voted by the Board, are included in the state total.
Figure 26: Shareholding Structures of Statoil, Petrobras, and Rosneft (2011)
0%
10%
20%
30%
40%
50%
60%
70%
80%
90%
100%
Rosneft Statoil Petrobras (Total)
Petrobras (Voting)
Equity Owne
rship
International
Domestic
Treasury
State
Source: Company Data
These bare facts do not reveal the full underlying story at the companies, however. For
example, as discussed above, the Norwegian government and Statoil have adopted a
fundamental principle of zero state interference in the operational and strategic management
of the company. This does not of course mean that management cannot be influenced by its
largest shareholder and does not take the geopolitical interests of Norway into account when
making key international decisions, but in practice there are no state representatives on the
Statoil board and the company’s main interaction with government is via regulators and
ministries. Personal influence continues to play a role, but Norway has made a strong effort
to remove politics and politicians from the direct running of its NOC (Thurber & Istad, 2010,
8).
Petrobras has a greater level of state governance, especially at Board level, where the state, as
the majority shareholder, asserts its right to a corresponding level of director representation.
Minority investors are guaranteed two directors on the nine-member Board, one to represent
47

ordinary shareholders and the other to represent those holding preferred equity, but otherwise
various government ministries and regulatory bodies make up the remaining seven places.
The Chairman is the Minister of the Treasury. Having said this, non-state shareholders have a
greater percentage membership of the Fiscal Council, which oversees the Board, with two
members as opposed to the government’s three. Petrobras is also subject to the governance
rules of four exchanges, in Brazil, Spain, Argentina, and New York, with the latter being of
particular importance because its rules are generally regarded as being the strictest of all the
world’s stock exchanges (Lipman, 2006, 32). Furthermore, since 1997 the government has
denied Petrobras its monopoly position, strengthened competition within the domestic oil and
gas sector (with a strong regulator, the ANP), and encouraged joint ventures with
international companies. As a result, although Petrobras clearly retains its strong links with
the Brazilian government, and has recently been granted the right to a 30 per cent share and
operatorship of all pre-salt exploration and development licences, it nevertheless is
constrained by strict governance rules that ensure the interests of all stakeholders are taken
into account.
The history of Board representation at Rosneft shows that Russian state influence over the
country’s NOC remains strong, but again demonstrates how the company appears to be trying
to emulate the ‘Partial NOC’ model by increasing the role of independent directors. When
Rosneft was privatized in 2006, the company’s nine member Board comprised five
representatives of the Russian government, Sergey Bogdanchikov the CEO of Rosneft, and
three other directors. The chairman, Igor Sechin, was deputy head of the Presidential
Administration while a deputy prime minister, two deputy ministers, and a department head
of the Russian State Property Agency were the other government appointees. Of the
remaining four directors, the CEO was clearly appointed by the state, while one of the other
directors was the chairman of state-controlled bank VTB. As a result, the only directors
independent from the Russia State were Hans-Joerg Rudloff, the chairman of Barclays
Capital, and Alexander Nekipelov, the vice president of the Russian Academy of Sciences
(Rosneft, 2007).
Over the five years since privatization the level of direct government influence has decreased,
with more independent directors being introduced. However, the concept of independence is
somewhat subjective, as although many of the new appointees are independent of Rosneft
they nevertheless continue to have close ties to the Russian state, with the result that
48

government influence has arguably not been significantly reduced. In 2009, for example,
direct government representation on Rosneft’s board had fallen to three members (including
the chairman and CEO), while Rudloff, Nekipelov, and the chairman of VTB (Andrey
Kostin) remained as independent directors. The remaining directors were the CEO of
OBORONPROM (a state-controlled aerospace and technology company), the chairman of
Transneft (the state-controlled oil pipeline transport company), and the CEO of
Surgutneftegas (a privatized oil company with alleged close links to the Russian
government). As a result, although a shift in government representation had been made, real
majority state influence remained through representatives from state-owned companies.
However, an important change occurred in March 2011 when Russia’s President Dmitry
Medvedev announced that there should no longer be government representatives on the
boards of companies over which they had any regulatory influence.47 This led to the
resignation of Igor Sechin as chairman of Rosneft and the re-election of the Board in
September 2011 to allow for the replacement of other government representatives. As a result
Rosneft’s Board now has an independent chairman (Nekipelov, one of the original
independent directors), plus an extra member from state-controlled bank VTB, and an extra
member from Transneft. Therefore the only Rosneft/state member of the Board is the
company CEO Eduard Khudainatov, while the other eight directors are independent of the
company. However, seven of these eight do have close links with the Russian state, meaning
that government influence remains high.
Nevertheless, Rosneft is at least taking steps towards a more independent governance
structure, and this progress could be further enhanced if the Russian government’s plans to
sell more shares in the company through another privatization event come to fruition. A need
to generate revenues for the Russian budget, as well as a desire to see the state interest in
Rosneft gradually reduced towards 51 per cent by 2015, has spurred the government to
action, and an announcement by the Ministry of Economic Development in September 2011
suggested that 15 per cent of Rosneft could be sold in 2012.48 This could be followed by a
further 10 per cent sale before 2015, with the possibility of the state share in the company
being reduced to zero by 2017 (although a golden share would be retained to maintain a
47 Interfax, 30 Mar 2011, ‘Government officials mustn’t sit on boards of rival companies – Medvedev’, Moscow. 48 Interfax, 9 Sept 2011, ‘Russia could sell Rosneft, VTB, Sovcomflot stakes in 2012, RZD in 2014’, Moscow.
49

government veto over strategic decisions) if the most radical plans are implemented.49
Disagreement on the exact timing of future sales centres on the optimum timetable to extract
the highest price, especially as Rosneft’s share price in November 2011 was below the level
at which it was privatized in 2006,50 but the momentum towards reducing state ownership
appears clear from statements by President Medvedev at the St. Petersburg Forum in June
2011 when he declared ‘There must be preparation for the privatization of … supermajor
companies such as Rosneft.’51
The effects of this expanded privatization programme on Rosneft could be profound in a
number of areas, and could further drive the company towards the global status achieved by
Petrobras and Statoil. The most immediate impact of wider share ownership would be to
reduce the state share in Rosneft below 75 per cent, a crucial level under Russian law. Major
strategic initiatives undertaken by any company in Russia must be approved by an
extraordinary meeting of shareholders, at which a 75 per cent plus one share majority is
required to carry a decision. As such, the Russian government can currently impose its will
on Rosneft, but after an additional share sale, minority shareholder support would be
required. Although the importance of such a change should not be overstated, as the Russian
government has successfully controlled Gazprom with a 51 per cent equity stake for a
number of years, it would nevertheless mark another step in the development of Rosneft’s
corporate governance that would not only give minority shareholders some greater say in the
approval of key strategic decisions, but would also allow them to increase their board
representation. The Russian government could, of course, elect a majority of the directors
while it retained a minimum 51 per cent stake in the company (as it does at Gazprom), but the
share of truly independent directors would increase if share ownership of Rosneft began to
include a greater proportion of domestic and international financial institutions.
A further benefit of larger non-state ownership would be to increase the float of Rosneft
equity that could be freely traded in global financial markets. This would have the triple
benefit of increasing trading activity, attracting a new investor base, and creating the
possibility of the company being able to raise money via the issue of new shares. At present
the fact that the company’s shares are not widely owned, and are dominated by the state, acts 49 Interfax, 4 Aug 2011, ‘Russia Pulling Out of Oil Companies’, Moscow. 50 Interfax, 21 Nov 2011, ‘Sechin proposes prohibiting privatization of state companies at prices lower than IPO’, Moscow. 51 Interfax, 21 July 2011, ‘Rosneft will only be privatized if state reckons it is worthwhile’ Gorki.
50

as a disincentive to many global investors, some of whom are forbidden by their constitutions
from purchasing the shares of companies with too low a ‘free float’.52 A further privatization
process would therefore make Rosneft’s shares available to a broader potential ownership
base, which could benefit the company’s share price (by creating more demand for the
shares) and in future could allow Rosneft to use further equity issues to raise funds for on-
going activity or acquisitions. In September 2010 Petrobras provided the perfect example of
this process, raising $70 billion in the biggest share issue in global financial market history,
just 10 years after its initial listing on the New York Stock Exchange.53 The funds were used
to purchase new concessions from the Brazilian government as well as to help finance the
company’s $224bn capital investment programme to 2015.
An additional privatization process at Rosneft could also catalyse the sale of the company’s
treasury shares, which are a corporate governance anomaly that also undermines Rosneft’s
status in the international business arena. Rosneft essentially owns 100 per cent of a company
(RN–Razvitie LLC) which owns 9.5 per cent of Rosneft’s own shares. Under many
international stock exchange rules these shares, which are classified as treasury stock, would
need to be used within 12 months or cancelled, but Rosneft has now owned them for four
years and the company management can effectively use them to vote on Board level
decisions. Removal of these shares from Rosneft management control (either by their
cancellation or sale) could demonstrate a further commitment to the adoption of international
governance rules, which could be further enhanced if Rosneft also followed another of the
strategies used by Petrobras and Statoil, namely a full listing of its shares on an international
stock exchange. Petrobras and Statoil have both chosen to list their shares in New York (as
well as on various local exchanges) while Rosneft’s equity can only be purchased outside
Russia in the form of a GDR (Global Depository Receipt).54 Rosneft’s GDRs are currently
quoted on the London Stock Exchange, but the company is not obliged to abide by the stricter
governance rules that a full listing would imply (Financial Services Authority, 2010, 8). A
further sale of Russian state shares in the company, combined with a full listing in London
(and perhaps even entry into one of the main indices such as the FTSE 100 with its additional
52 The free float of a company is defined as the percentage of its shares that can be freely traded on an open market, and specifically would not include any shares held by the home government. 53 Financial Times, 29 Oct 2010, ‘Brazil: Jubilant mood as country taps fresh reserves’, London. 54 A Global Depository Receipt is a bank certificate issued in more than one country for shares in a foreign company. The shares are held by a foreign branch of an international bank. The shares trade as domestic shares, but are offered for sale globally through the various bank branches.
51

governance requirements),55 could therefore put Rosneft on an equivalent level of regulatory
governance with its NOC peer group.
Overall, in terms of governance, share ownership, and state control, Rosneft therefore appears
to be taking steps to reduce government influence, and has certainly established an improving
reputation for corporate governance and transparency, as its numerous awards for investor
relations testify (Rosneft, 2010, 22). The Russian government’s plans for further privatization
could bring the company into line with, or even ahead of, Statoil and Petrobras in terms of
non-state share ownership, but issues such as the company’s treasury shares and the quality
of its share listing probably need to be addressed before the opportunity to use an equity issue
to raise significant capital for the company (as Petrobras has just achieved) can be
contemplated.
55 Russian metals companies Polymetal and Evraz are contemplating entering the FTSE100 with a full London listing for this reason, as the higher corporate governance standards required by the FTSE100 index attract the interest of a new range of investors. See article in Bloomberg, 7 December 2011, ‘Evraz, Polymetal to join FTSE100 to escape Putin Political Risk’, London. However, it should be noted that a requirement is for afree float of 50% or more, meaning that it would only be possible for Rosneft if the Russian government decided to reduce its ownership below 50%.
52

7 Overall Conclusions
Following a period in the mid-1990s when the future of Rosneft as a viable entity seemed
precarious, the company has now become Russia’s largest oil producer. Government support
has clearly played a significant role in this turnaround, as successive Russian leaders decided
that Rosneft should become a state champion and the country’s NOC. With this overall
strategic aim in mind, Rosneft was used to consolidate assets in the early 2000s, in particular
those belonging to the bankrupted Yukos, and to re-establish state leadership over the oil
sector while competing with the influence of the entrepreneurs who had come to dominate the
industry and its main companies in the post-Soviet era.
Rosneft’s IPO in 2006 has been followed by a period of operational and financial
outperformance relative to its domestic peers, although the company has also had to maintain
its NOC status by undertaking investments and obligations imposed upon it by the Russian
government. However, Rosneft, in common with much of the Russian oil industry, has now
reached a crucial turning point in its development, as its traditional core producing
subsidiaries are going into gradual decline, and the development of new, more challenging,
regions, such as East Siberia, the Russian continental shelf, and the Arctic, will be needed to
sustain growth. In the face of this challenge, the examples of Rosneft’s peer NOCs, in
particular Petrobras and Statoil, can provide a model for future strategic development, and the
Russian NOC does appear to be adopting a mixture of tactics based on this analogy.
The most significant step would appear to be the formation of a growing number of
partnerships with international oil companies (IOCs) in Russia and overseas. The growth of
Petrobras as a leading global oil company was based both on its success domestically in
exploring deeper offshore waters and on its international expansion and operating experience
in joint ventures with IOCs, as well as on the Brazilian government’s insistence that it both
compete and partner with foreign companies in its domestic market. Statoil similarly
developed a highly successful and technologically advanced domestic business before
enhancing its growth prospects through an international exploration joint venture with BP,
which provided both growth in the company’s asset base and also wide exposure to global oil
industry management and operating techniques. As a result, while both Petrobras and Statoil
retain natural advantages in their domestic market thanks to their NOC status, they have used
53

their international experiences to diversify their asset bases, to gain invaluable operational
experience that has been combined with their domestic capability to turn both companies into
leaders in specific fields of oil industry expertise, and to enhance their financial performance.
Rosneft has now started to develop its business along similar lines. In the upstream business a
desire to internationalize, driven by a Russian government strategy to see its major companies
take a larger role in the global economy, has been combined with a tactic to partner with
IOCs on technically and financially challenging projects. In particular, the need to develop
reserves offshore Russia and in the Arctic has led to a strategic relationship with ExxonMobil
to explore in the Black Sea in the south-west of Russia, and in the south Kara Sea in the
north. This partnership in Russia is to be reciprocated internationally, with Rosneft gaining
access to ExxonMobil projects in the USA, Canada, and other regions where technology
relevant to Rosneft’s domestic challenges is being used. The overall result could therefore be
to allow Rosneft both to diversify its asset base and to make itself a technical expert in the
development of Arctic resources, a skill that would be applicable both domestically and
internationally. Meanwhile, in the downstream sector, Rosneft has acquired a 50 per cent
interest in a German refining company that will bring it into partnership with BP and will
allow it to increase its knowledge of the latest global refining practices as well as to develop
new markets for its Russian oil exports.
Another step along the route to becoming a more diversified global NOC is the development
of Rosneft’s gas business. Both Statoil and Petrobras have a greater proportion of gas in their
production portfolio than Rosneft, with Statoil being a major gas supplier to Europe, and
Petrobras developing a Brazilian and international gas business. Rosneft has historically been
constrained by the dominance of Gazprom in Russia, but is using the encouragement of the
Russian government for ‘independent’ producers to plan significant increases in its gas output
over the next five to ten years, which could even include involvement in the international
LNG business if its Sakhalin project is allowed to export gas.
A more intangible, but equally important, strategic development has been the gradual
decrease in state influence on Rosneft’s Board, combined with the company’s increasing
transparency, and its plans to reduce the share ownership of the Russian government below
the significant level of 75 per cent plus one share. Statoil and Petrobras both remain majority
state-owned, with government voting equity levels of 67 per cent and 64 per cent
54

respectively, but each has managed to reduce the influence of domestic politicians without
removing the benefits of being an NOC. Statoil and the Norwegian government have
maintained a rule that no politicians should sit on the Statoil Board, and the company is
therefore controlled by powerful regulators who are independent of any corporate activity.
Petrobras retains government representatives on its Board, but has handed over significant
influence to independent shareholder representatives, and is also bound by the strict corporate
governance rules of the New York Stock Exchange.
In many ways Rosneft already matches Petrobras, at least in its levels of state influence and
the presence of independent directors. In particular, the demand by President Medvedev in
March 2011 that all government representatives should leave the Boards of state-owned
companies, has meant that there are now no politicians on Rosneft’s Board, although many of
the current directors do still have close links to the state via their involvement in other state-
owned companies. The position of independent directors and minority shareholder
representatives would be improved if planned government share sales in the period 2012–15
were implemented, and the company’s corporate governance record, although among the best
in Russia, would be further improved if its treasury shares were sold or cancelled. A full
listing on an international stock exchange, similar to those of Statoil and Petrobras, would put
Rosneft on a par with its NOC peers, and could enhance the prospects for the company to
raise extra financing for organic or acquisition expenditure in future.
Overall, then, it would appear that Rosneft’s strategy is being modelled on a number of the
themes prevalent in the development of its peer NOCs, with a particular initial focus on
establishing an international business and developing a specific technical expertise (in this
case in Arctic offshore exploration and development) in co-operation with an IOC partner.
With this in mind, continued progress in establishing a firm partnership with ExxonMobil to
develop three licenses in the South Kara Sea and to jointly invest in international assets
would appear to be the crucial first stepping stone to achieving Rosneft’s goal of becoming
an NOC that can operate on the global oil and gas stage. Development of more diverse
production through the establishment of a significant gas business could then enhance the
company’s status as a more broad-based hydrocarbon producer, while further improvements
in the company’s corporate governance position can also help to confirm Rosneft’s among its
global oil company peer group.
55
Bibliography
Burgansky, A. (2010). Oil and Gas Yearbook 2010, Moscow: Renaissance Capital.
Economist. (2011). ‘Brazil’s Oil Boom: Filling Up The Future’, Economist.
Financial Services Authority. (2010). Listing Regime FAQs, London: FSA.
Henderson, J. (2010). Non-Gazprom Gas Producers in Russia, Oxford: Oxford Institute for Energy Studies.
Henderson, J. (2011). Domestic Gas Prices in Russia: Towards Export Netback?, Oxford: Oxford Institute for Energy Studies.
IEA. (2002). Russia Energy Survey 2002, Paris: IEA.
Interfax. (2011). Russia’s Oil Industry in 2010, Moscow: Interfax.
Lane, D., & Seifulmulukov, I. (1999). ‘Structure and Ownership’, in D. Lane, The Political Economy of Russian Oil (15–45), Oxford: Rowman & Littlefield.
Lipman, F. D. (2006). Corporate Governance Best Practice, New Jersey: Wiley & Sons.
Moser, N., & Oppenheimer, P. (2001). ‘The Oil Industry: Structural Transformation and Corporate Governance’, in B. Granville, & P. Oppenheimer, Russia’s Post Communist Economy (18–40), Oxford: Oxford University Press.
Petrobras. (2011a). Petrobras At A Glance, Rio de Janeiro: Petrobras.
Petrobras. (2011b). Petrobras Fact Sheet 1H 11, Sao Paolo: Petrobras.
Petrobras. (2011c). Petrobras Annual Report 2010, Rio de Janeiro: Petrobras
Petroleum Finance Corp. (2011). PFC Energy 50, Washington: Petroelum Finance Corp.
Poussenkova, N. (2007). Lord of the Rigs: Rosneft as a Mirror of Russia’s Evolution, Houston: James Baker III Institute for Public Policy: Rice University.
Putin, V. V. (1999). Mineral and Raw Material Resourcesand the Development Strategy for the Russian Economy, St Petersburg.
Rosneft. (2006). Offer Document, Moscow: Rosneft.
Rosneft. (2007). Annual Report 2006, Moscow: Rosneft.
Rosneft. (2010). Company Highlights, Moscow: Rosneft.
Rosneft. (2011a). Rosneft: Company Highlights, Moscow: Rosneft.
Rosneft. (2011b). Annual Report 2010, Moscow: Rosneft.
56

57
Stevens, P. (2011). ‘A Methodology For Assessing The Performance of National Oil Companies’, Washington: World Bank.
Thurber, M., & Istad, B. T. (2010). Norway’s Evolving Champion: Statoil and the Politics of State Enterprise, Stanford: PESD Stanford.
Tordo, S. (2009). Petroleum Exploration and Production Rights. Allocation Strategies and Design Issues, Washington: World Bank.
Tordo, S., Tracy, B., & Arfaa, N. (2011a). ‘Petroleos Brasileiro S.A. (Brazil)’, in S. Tordo, B. Tracy, & N. Arfaa, National Oil Companies and Value Creation, (54–65), Washington: World Bank.
Tordo, S., Tracy, B., & Arfaa, N. (2011b). ‘StatoilHydro ASA (Norway)’, in W. Bank, NOC Case Studies (118–27), Washington: World Bank.
USGS. (2009). Circum-Arctic Resource Appraisal: Estimates of Undiscovered Oil and Gas North of the Arctic Circle, California: USGS.


