Stoneflies are sensitive indicators of healthy streams. Unlike other insects, winter stoneflies develop into adult flies in the winter. The Winter Stonefly Search is part of Friends of the Rouge volunteer benthic macroinvertebrate monitoring program. Marygrove College students look for stoneflies at Johnson Creek Wayne State University students on the Lower Rouge Lovebug refreshments! Rouge River Watershed 2016 Winter Stonefly Search www.therouge.org Ninety-two volunteers participated in Friends of the Rouge’s 2016 Winter Stonefly Search on February 13 th on one of the only frigid days of this mild winter. The University of Michigan-Dearborn’s Environmental Interpretive Center hosted the event. Participating were four teams from Wayne State University, two teams from Marygrove College, two teams from the 4H Critter Science Investigation Club, one group from Franklin High School and many other volunteers. Volunteers were able to sample 26 sites in 13 teams. A total of 38 sites were sampled. Wayne County Department of Public Services Water Quality Management Division sampled an additional six sites, Schoolcraft College students sampled one site and Sue Thompson sampled five sites. Stoneflies were found at ten of the thirty-eight sites (26%) (see map and Table 1). This was higher than the past two years. Nine sites had slender winter stoneflies (Capniidae) and two sites had Perlodid stoneflies (one site had both). All stoneflies were found on the Middle or Lower branches. Other branches that were sampled included one site on the Main branch and three sites on the Upper branch including Bell Creek. All but three of the ten sites with stoneflies were in the Johnson Creek watershed. Four of these were on Sump Creek, a Johnson Creek tributary in and around Maybury State Park. The highest number of stoneflies at one site was at MR-22 with 22 stoneflies. Both sites with Perlodid stoneflies were on Sump Creek. Two other Johnson Creek sites had stoneflies – John1 at Five Mile and Salem Road and John7 in the Arcadia Ridge subdivision. Surprisingly, the Marygrove College team at John1 also found a Rhyacophilid caddisfly, a type of caddisfly first identified in Michigan through Friends of the Rouge’s program. Usually found in April, this is the earliest in the year they have been found. On the Lower Rouge, Fellows Creek had one site with stoneflies (LR-9) and Fowler Creek had two sites with them (Fowl1 & Fowl2). Fowl2 has not had stoneflies since 2011. Thank you to all the volunteers! The Winter Stonefly Search is part of Friends of the Rouge’s long term volunteer monitoring program. Spring Bug Hunt – Sat. April 16 9am-4 pm UM-D EIC *Register by 4/1* Team Leader Training March 19 (must have previously attended an event) www.therouge.org (register online) (313) 792-9621 [email protected]Coordinated by Friends of the Rouge and funded by the Alliance of Rouge Communities. Additional data collection by Wayne County and Schoolcraft College
Transcript
Stoneflies are sensitive indicators of healthy
streams. Unlike other insects, winter stoneflies
develop into adult flies in the winter. The Winter
Stonefly Search is part of Friends of the Rouge
volunteer benthic macroinvertebrate
monitoring program.
Marygrove College students look for stoneflies at Johnson Creek
Wayne State University students on the Lower Rouge
Lovebug refreshments!
Rouge River Watershed 2016 Winter Stonefly Search
www.therouge.org Ninety-two volunteers participated in Friends of the Rouge’s 2016 Winter Stonefly Search on February 13th on one of the only frigid days of this mild winter. The University of Michigan-Dearborn’s Environmental Interpretive Center hosted the event. Participating were four teams from Wayne State University, two teams from Marygrove College, two teams from the 4H Critter Science Investigation Club, one group from Franklin High School and many
other volunteers. Volunteers were able to sample 26 sites in 13 teams. A total of 38 sites were sampled. Wayne County Department of Public Services Water Quality Management Division sampled an additional six sites, Schoolcraft College students sampled one site and Sue Thompson sampled five sites. Stoneflies were found at ten of the thirty-eight sites (26%) (see map and Table 1). This was higher than the past two years. Nine sites had slender winter stoneflies
(Capniidae) and two sites had Perlodid stoneflies (one site had both). All stoneflies were found on the Middle or Lower branches. Other branches that were sampled included one site on the Main branch and three sites on the Upper branch including Bell Creek. All but three of the ten sites with stoneflies were in the Johnson Creek watershed. Four of these were on Sump Creek, a Johnson Creek tributary in and around Maybury State Park. The highest number of stoneflies at one site was at MR-22 with 22 stoneflies. Both sites with Perlodid stoneflies were on Sump Creek. Two other Johnson Creek sites had stoneflies – John1 at Five Mile and Salem Road and John7 in the Arcadia Ridge subdivision. Surprisingly, the Marygrove College team at John1 also found a Rhyacophilid caddisfly, a type of caddisfly first identified in Michigan through Friends of the Rouge’s program. Usually found in April, this is the earliest in the year they have been found.
On the Lower Rouge, Fellows Creek had one site with stoneflies (LR-9) and Fowler Creek had two sites with them (Fowl1 & Fowl2). Fowl2 has not had stoneflies since 2011. Thank you to all the volunteers! The Winter Stonefly Search is part of Friends of the Rouge’s long term volunteer monitoring program.
Spring Bug Hunt – Sat. April 16 9am-4 pm UM-D EIC
*Register by 4/1* Team Leader Training March 19 (must have previously attended an event)
Coordinated by Friends of the Rouge and funded by the Alliance of Rouge Communities. Additional data collection by
Wayne County and Schoolcraft College
Table 1: 2016 Stonefly Search Results Branch FIELDID Stream Name Location Collector* ST16 Capnids Perlodids Lower Fel1 Fellows Creek Top of Hill Ct FOTR N Lower Fel2 Fellows Creek Vintage Valley FOTR N Lower Fel4 Fellows Creek Flodin Pk FOTR N Lower Fel5 Fellows Creek Warren Ridge FOTR N Lower Fel6 Fellows Creek Hanford Ridge FOTR N Lower LR-9 Fellows Creek Fellows Beck Warren FOTR Y 1 Lower Fowl1 Fowler Creek Prospect FOTR Y 14 Lower Fowl2 Fowler Creek Fowler Beck FOTR Y 2 Lower Low2 Lower Rouge Cherry Hill FOTR N Lower LR-12 Lower Rouge Morton Taylor WC N Lower LR-3 Lower Rouge Goudy Park WC N Lower LR-8 Lower Rouge Ridge Proctor FOTR N Main MN-5 Main Rouge Bridge St WC N
Middle John1 Johnson Creek 5M Salem FOTR Y 10 Middle John2 Johnson Creek 5M NV FOTR N Middle John3 Johnson Creek 6M NV FOTR N Middle John5 Johnson Creek Fish Hatchery Pk FOTR N Middle John6 Johnson Creek Hines FOTR N Middle John7 Johnson Creek Arcadia FOTR Y 3 Middle John8 Johnson Creek Maybury Angell FOTR Y 3 Middle MR-22 Johnson Creek Maybury south ST Y 22 Middle MR-23 Johnson Creek Maybury north ST Y 5 1 Middle MR-25 Johnson Creek Maybury East ST Y 8 Middle MR-26 Johnson Creek Napier Rd ST N Middle MR-27 Johnson Creek Ridge ST Y 2 Middle Mid1 Middle Rouge Northville Rec E FOTR N Middle MR-1 Middle Rouge Northville Rec W FOTR N Middle MR-18 Middle Rouge Springbrook Rec FOTR N Middle MR-2 Middle Rouge Reservoir Rd WC N Middle MR-20 Middle Rouge Waterford Bd FOTR N Middle MR-2a Middle Rouge Reservoir Rd W FOTR N Middle MR-3 Middle Rouge Plym Riverside WC N Middle Ton1 Tonquish Creek Plym Twp Pk FOTR N Middle Ton1/2 Tonquish Creek Canton Ctr Rd FOTR N Upper Bell2 Bell Branch Schoolcraft College Sch N Upper Up1 Upper Rouge Heritage Park FOTR N Upper Up2 Upper Rouge Shiawasee Park FOTR N Upper UR-1 Upper Rouge Lola Valley WC N
C*Collector - FOTR=Stonefly Search team, ST=Sue Thompson, WC=Wayne County
Stoneflies are sensitive indicators of healthy streams. Unlike other insects, winter stoneflies develop into adult flies in the winter. The Winter Stonefly Search is part of Friends of the Rouge volunteer
benthic macroinvertebrate monitoring program.
Rouge River Watershed 2017 Winter Stonefly Search www.therouge.org
Eighty-two volunteers participated in Friends of the Rouge’s 2017 Winter Stonefly Search on January 21 on an unusually warm winter day where the temperatures reached 57 degrees. The University of Michigan-Dearborn’s Environmental Interpretive Center hosted the event. Participating were three teams from Wayne State University, a group from Marygrove College, two new teams from Fordson High School, and one new team from Boy Scout Pack 854 and many other volunteers. A total of 31 sites were sampled. On January 21, ten teams sampled 20 sites. An additional five sites were sampled by Wayne County Department of Public Services Water Quality Management Division, one site on Bell Creek by Schoolcraft College students, and five sites on Johnson and Tonquish Creeks by Sue Thompson. Stoneflies were found at eighteen of the thirty-one sites (58%) (map and Table 1). Four different types of stoneflies were found: Capnids, Perlodids, Nemourids and Taeniopteryx with the majority being Capnids. All stoneflies were found on the Middle or Lower branches. Eight sites on the Lower Branch had stoneflies. This included four sites on Fellows Creek, three sites on Fowler Creek and one site on the main Lower Branch. All eight sites had slender winter stoneflies (Capnids) and one site (Fel6) also had Perlodids. The highest number of stoneflies on the Lower was at Fowl1 where 45 were found. Nine sites on the Middle branch had stoneflies including one site on the main Middle branch (MR-2a). All nine sites had slender winter stoneflies (Capnids). In addition, one site also had Perlodids (John8), one site had Nemourids (John2) and two sites had Taeniopteryx (John1 and John3). The highest number of stoneflies was found at MR-27 (56). For the first time since 2009, stoneflies were found in the Tonquish Creek. They were found at Ton1. This was an unusual Stonefly Search. In past years, we have been unable to sample some of our small streams because they have been frozen all the way to the bottom. This year, temperatures were so mild that there was no ice at all. But, the thaw did pose a problem in that water levels at some of our sites were too high to safely sample. Rather than postpone the event, we selected only small stream sites. This, along with better access to iceless streams contributed to finding more stoneflies than usual. Thank you to all the volunteers, Team Leaders, Daisy Lovain for running registration, the University of Michigan-Dearborn for providing meeting space, Esma Tuncay for identifying specimens, the Alliance of Rouge Communities for funding, and Schoolcraft College, Wayne County and Susan Thompson for additional sampling. Thank you to those who shared their photos. There were so many good ones we are including as many as we can (see next two page). The Winter Stonefly Search is part of Friends of the Rouge’s long term volunteer monitoring program.
Spring Bug Hunt – Sat. April 22 9am-4 pm UM-D EIC *Register by 4/7*
Team Leader Training April 1 (must have previously attended an event) www.therouge.org (register online) (313) 792-9621 [email protected]
Coordinated by Friends of the Rouge and funded by the Alliance of Rouge Communities. Additional data collection by
Wayne County and Schoolcraft College
Table 1: 2017 Stonefly Search Results Branch FIELDID Stream Name Location Collector* ST17 Capnids Perlodids Nemourids Taeniopteryx Lower Fel5 Fellows Creek Warren Ridge FOTR Y 6 Lower Fel1 Fellows Creek Top of Hill Ct FOTR N Lower Fel6 Fellows Creek Hanford FOTR Y 3 3 Lower Fel2 Fellows Creek Vintage Valley FOTR N Lower LR-9 Fellows Creek Beck Warren FOTR Y 5 Lower Fel7 Fellows Creek Napier Court FOTR Y 15 Lower Fowl1 Fowler Creek Prospect FOTR Y 45 Lower Fowl3 Fowler Creek Harris FOTR Y 1 Lower Fowl5 Fowler Creek Fowler Denton FOTR Y 5 Lower Nfowl Fowler Creek Fowler Ridge FOTR N Lower LR-8 Lower Rouge Ridge Proctor FOTR Y 20 Lower Low2 Lower Rouge Cherry Hill FOTR N Main MN-5 Main Rouge Bridge St WC N Middle John1 Johnson Creek 5M Salem FOTR Y 5 1 Middle John2 Johnson Creek 5M NV FOTR Y 3 1 Middle John8 Johnson Creek Maybury Angell FOTR Y 4 2 Middle MR-27 Johnson Creek Ridge FOTR Y 56 Middle John3 Johnson Creek 6M NV FOTR Y 18 1 Middle John7 Johnson Creek Arcadia FOTR Y 11 Middle MR-22 Johnson Creek Maybury south ST Y 50 Middle MR-25 Johnson Creek Maybury East ST Y 14 Middle MR-23 Johnson Creek Maybury north ST N Middle MR-26 Johnson Creek Napier Rd ST N Middle MR-3 Middle Rouge Plym Riverside WC N Middle MR-1 Middle Rouge Northville Rec W WC N Middle MR-18 Middle Rouge Springbrook Rec WC N Middle MR-2a Middle Rouge Reservoir Rd W WC Y 4 Middle Ton1 Tonquish Creek Plym Twp Pk FOTR Y 2 Middle Ton1/2 Tonquish Creek Canton Ctr Rd FOTR N Middle MR-28 Tonquish Creek N Branch ST N Upper Bell2 Bell Branch Schoolcraft College Sch N
* FOTR=Stonefly Search team, Sch=Schoolcraft College, ST=Sue Thompson, WC=Wayne County
1
FRIENDS OF THE ROUGE BENTHIC MONITORING PROGRAM
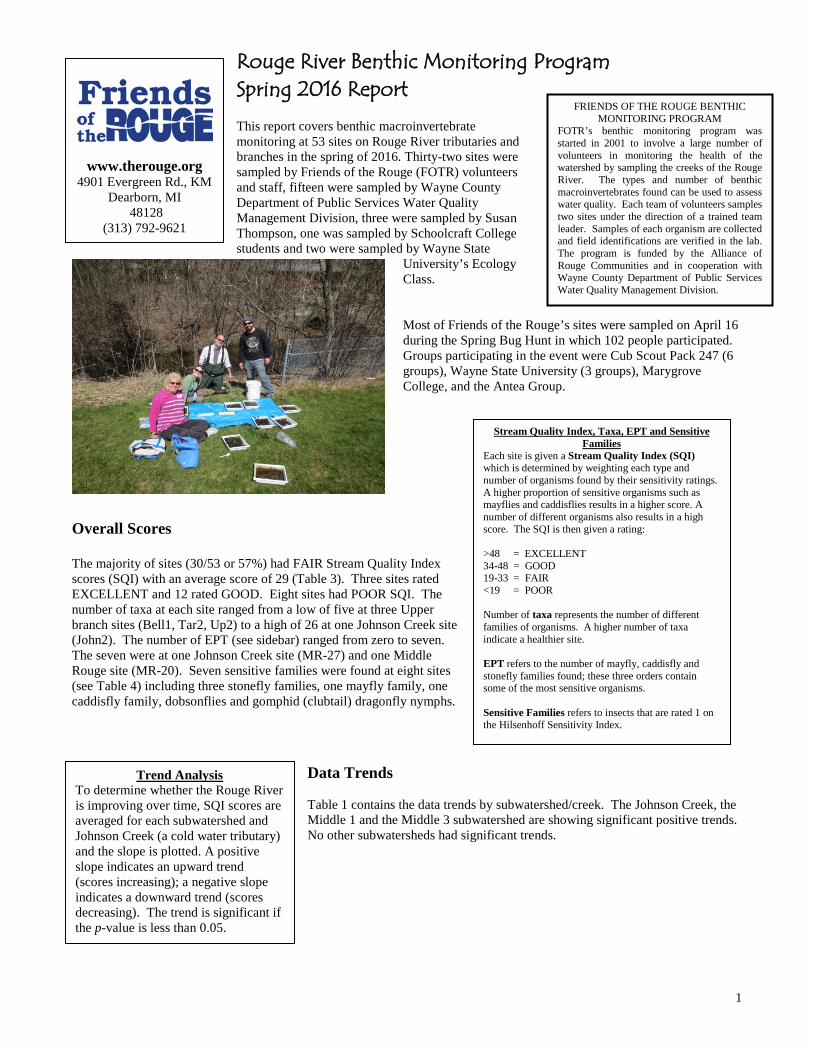
FOTR’s benthic monitoring program was started in 2001 to involve a large number of volunteers in monitoring the health of the watershed by sampling the creeks of the Rouge River. The types and number of benthic macroinvertebrates found can be used to assess water quality. Each team of volunteers samples two sites under the direction of a trained team leader. Samples of each organism are collected and field identifications are verified in the lab. The program is funded by the Alliance of Rouge Communities and in cooperation with Wayne County Department of Public Services Water Quality Management Division.
www.therouge.org 4901 Evergreen Rd., KM
Dearborn, MI 48128
(313) 792-9621
Trend Analysis To determine whether the Rouge River is improving over time, SQI scores are averaged for each subwatershed and Johnson Creek (a cold water tributary) and the slope is plotted. A positive slope indicates an upward trend (scores increasing); a negative slope indicates a downward trend (scores decreasing). The trend is significant if the p-value is less than 0.05.
Rouge River Benthic Monitoring Program Spring 2016 Report This report covers benthic macroinvertebrate monitoring at 53 sites on Rouge River tributaries and branches in the spring of 2016. Thirty-two sites were sampled by Friends of the Rouge (FOTR) volunteers and staff, fifteen were sampled by Wayne County Department of Public Services Water Quality Management Division, three were sampled by Susan Thompson, one was sampled by Schoolcraft College students and two were sampled by Wayne State
University’s Ecology Class. Most of Friends of the Rouge’s sites were sampled on April 16 during the Spring Bug Hunt in which 102 people participated. Groups participating in the event were Cub Scout Pack 247 (6 groups), Wayne State University (3 groups), Marygrove College, and the Antea Group.
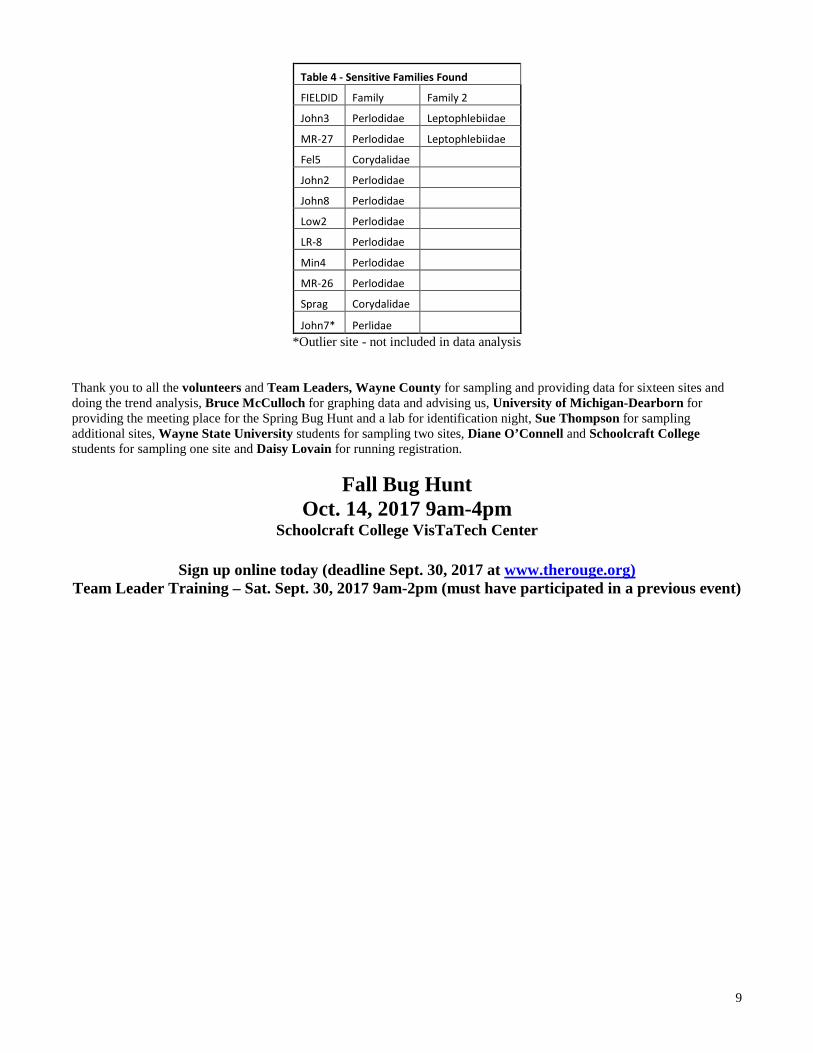
Overall Scores The majority of sites (30/53 or 57%) had FAIR Stream Quality Index scores (SQI) with an average score of 29 (Table 3). Three sites rated EXCELLENT and 12 rated GOOD. Eight sites had POOR SQI. The number of taxa at each site ranged from a low of five at three Upper branch sites (Bell1, Tar2, Up2) to a high of 26 at one Johnson Creek site (John2). The number of EPT (see sidebar) ranged from zero to seven. The seven were at one Johnson Creek site (MR-27) and one Middle Rouge site (MR-20). Seven sensitive families were found at eight sites (see Table 4) including three stonefly families, one mayfly family, one caddisfly family, dobsonflies and gomphid (clubtail) dragonfly nymphs.
Data Trends Table 1 contains the data trends by subwatershed/creek. The Johnson Creek, the Middle 1 and the Middle 3 subwatershed are showing significant positive trends. No other subwatersheds had significant trends.
Stream Quality Index, Taxa, EPT and Sensitive Families
Each site is given a Stream Quality Index (SQI) which is determined by weighting each type and number of organisms found by their sensitivity ratings. A higher proportion of sensitive organisms such as mayflies and caddisflies results in a higher score. A number of different organisms also results in a high score. The SQI is then given a rating: >48 = EXCELLENT 34-48 = GOOD 19-33 = FAIR <19 = POOR Number of taxa represents the number of different families of organisms. A higher number of taxa indicate a healthier site. EPT refers to the number of mayfly, caddisfly and stonefly families found; these three orders contain some of the most sensitive organisms. Sensitive Families refers to insects that are rated 1 on the Hilsenhoff Sensitivity Index.
2
Standard Deviation
Some sites have consistent scores where others vary greatly year to year. Standard deviation is a measure of how spread out your data is. 68% of your data will fall within one standard deviation of the mean (red areas shown above). On Charts 1-4, one standard deviation is represented by the vertical lines for each site. Standard deviation helps us to determine whether the current score is within normal for the site.
Table 1 - FOTR and WC Spring Bug Hunt Summary 2001-2016
Branch slope p-value True trend Subwatershed average score
Water Quality Rating
Main 1-2 0.4081 0.1219 no trend 27 Fair Main3-4* NA NA NA 25 Fair Upper -0.1824 0.2698 no trend 24 Fair Johnson Creek 0.6414 0.0045 yes, positive 39 Good Middle 1 0.7322 0.0017 yes, positive 29 Fair Middle 3 0.8782 0.0242 yes, positive 20 Fair Lower 1 0.0959 0.6126 no trend 30 Fair Lower 2 0.1170 0.6690 no trend 26 Fair *no sites sampled spring 2016
In addition to the trend analysis by subwatershed, a site-by-site analysis of all the sites was done (Table 2). The majority of the sites had no trend. Two sites had a statistically significant positive trend: John2 and Ton2. John2 is a Johnson Creek site that normally scores very high. Ton2 is a Tonquish Creek site impacted by urban development that suffers from poor macroinvertebrate diversity. One site had a statistically significant negative trend: Peb3. This site is located on Pebble Creek downstream of a recent dam removal.
Table 2 - FOTR & WC Spring Bug Hunt Significant Trends by site 2001-2016
Thirteen sites were sampled on the Lower Branch of the Rouge (see Table 3). McClaugherty Creek was sampled at one location (LR-7), Fellows Creek was sampled at three locations (Fel1, Fel2 LR-5) and Fowler Creek at one (Fowl2). On the main branch of the Lower, eight sites were sampled. While sampling Fel2, a team of WSU students were alarmed by a large amount of construction material dumped along the stream including concrete poured down the bank (see photo below). FOTR contacted Canton Township who sent out an inspector to meet with the homeowner and tell them to clean it up. This is a great example of how this program helps to unearth problems and get them addressed.
The Lower subwatershed did not have a significant trend and most sites scored FAIR (average 26). Three sites had GOOD scores (Fel2, LR-6 and Low3), all the rest scored FAIR. The number of taxa ranged from 8-16 and EPT: 0-3. One sensitive family was found: free-living (Rhyacophilidae) caddisflies at LR-8. This is the first time this species was found at LR-8 though it has been found upstream at Low2. Eleven sites had past data for three years or more (Chart 1). Three
sites were above a standard deviation of average (Fel2, LR-6 and LR-10) and two sites below (LR-8 and LR-12). No sites showed any trend when analyzed by site.
3
Chart 1: Lower Branch SQI and Mean with Standard Deviation
Main Branch
Ten sites on the Main Branch were sampled. Seven were on tributaries: Evans (Evan2), Franklin (Frank1, Frank2), Pebble (Peb1, Peb3), Sprague (Sprag) and Quarton Creeks (Main11). The Main1/2 subwatershed is not showing any trend (Table 1). The majority (8) of the scores were FAIR (average 25). There were two GOOD SQIs (MN-5, Sprag), three were POOR (Frank2, Peb1, Peb3). The number of taxa ranged from 6-19 and EPT 1-4. Sensitive clubtail dragonfly larvae (Gomphidae) and dobsonflies (Corydalidae) were found in Sprague Creek in Troy (Sprag).
Large native mussels including these white heelsplitters (Lasmigona complanata) were found at Firefighters Park in Troy (Main1). FOTR has identified four species of native mussels at this site and the Main branch has the highest diversity of native mussels in the watershed. There are only 11 species still found live in the Rouge River system. For the seven sites with three years or more of past data (Chart 2), three sites were below a standard deviation of the mean (Peb1, Peb3 and Frank2). Peb3 also had a negative trend when analyzed by site (Table 2)
Chart 2: Main Branch & Tributary SQI and Mean with Standard Deviation
4
Middle Branch Twenty sites were sampled on the Middle branch including four tributaries: Bishop (Bish2), Ingersoll (Ing1), Johnson (John2, MR-23, MR-26, John6, MR-22, MR-25, MR-27, John3) and Tonquish Creeks (Nton, Ton2, MR-16, Ton1). The team that sampled John3 found a 15 inch brown trout (see photo below), part of a population once stocked by the Department of Natural Resources. Stocking was discontinued when surveys revealed a decline in the number of redside dace(an endangered minnow) in areas where large numbers of these non-native fish were found.
Average scores for the Johnson Creek, the Middle1 and the Middle3 subwatersheds are all showing positive trends (Table 1). The average score was GOOD (35) and the Middle Branch had three EXCELLENT SQIs (John2, MR-27, MR-20). The score for MR-20 was unusually high at 52. There were no POOR scores, 7 GOOD and ten FAIR. The number of taxa ranged from 9-26 and EPT 1-7. Sensitive families were found in most of the Johnson Creek sites. Sensitive families included slender winter (Capniidae) stoneflies (MR-22) Perlodid stoneflies (John2, MR-25 and MR-27), Perlid stoneflies (MR-20 and John2, pronggill (Leptophlebiidae) mayflies (John3, MR-22, MR-25 and MR-27).
For the seventeen sites with past data (Chart 3 and 4), three site SQIs were above a standard deviation (John2, Bish2 and MR-16) and two site SQIs were below (John3, MR-23). When analyzed site by site, two sites showed a trend and both were positive: John2 and Ton2 (Table 2).
Chart 3: Middle Branch Tributary SQI and Mean with Standard Deviation
5
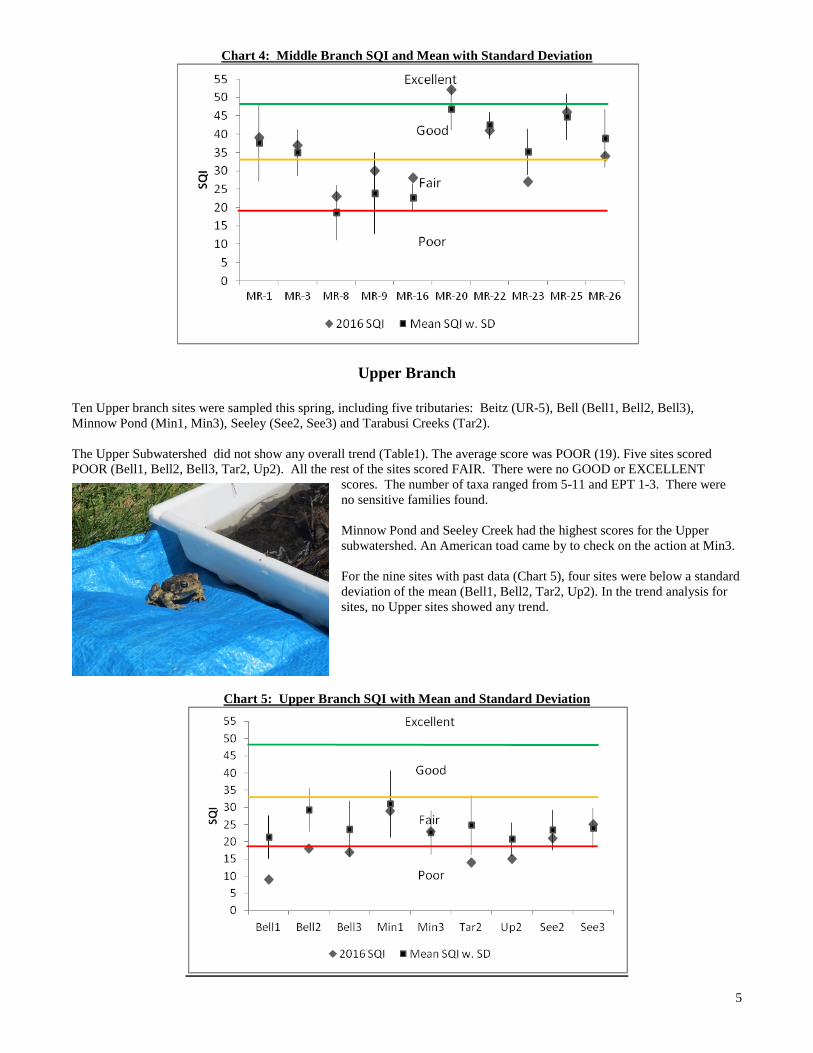
Chart 4: Middle Branch SQI and Mean with Standard Deviation
Upper Branch
Ten Upper branch sites were sampled this spring, including five tributaries: Beitz (UR-5), Bell (Bell1, Bell2, Bell3), Minnow Pond (Min1, Min3), Seeley (See2, See3) and Tarabusi Creeks (Tar2). The Upper Subwatershed did not show any overall trend (Table1). The average score was POOR (19). Five sites scored POOR (Bell1, Bell2, Bell3, Tar2, Up2). All the rest of the sites scored FAIR. There were no GOOD or EXCELLENT
scores. The number of taxa ranged from 5-11 and EPT 1-3. There were no sensitive families found. Minnow Pond and Seeley Creek had the highest scores for the Upper subwatershed. An American toad came by to check on the action at Min3. For the nine sites with past data (Chart 5), four sites were below a standard deviation of the mean (Bell1, Bell2, Tar2, Up2). In the trend analysis for sites, no Upper sites showed any trend.
Chart 5: Upper Branch SQI with Mean and Standard Deviation
6
7
Thank you to all the volunteers and Team Leaders, Wayne County for sampling and providing data for fifteen sites and doing the trend analysis, Bruce McCulloch for graphing data and advising us, University of Michigan-Dearborn for providing the meeting place for the Spring Bug Hunt and a lab for identification night, Sue Thompson for sampling additional sites, Wayne State University students for sampling two sites and Diane O’Connell and Schoolcraft College students for sampling one site.
Fall Bug Hunt - Oct. 15, 2016 9am-4pm Schoolcraft College VisTaTech Center Sign up online today (deadline Sept. 30, 2016 at www.therouge.org
Team Leader Training – Sat. Oct. 1, 2016 9am-2pm (must have participated in a previous event)
Branc h FIELDID Stream Name Site Name Loc ation Latitude Longitude SQI Sc ore Taxa EPT Sens Collec tor sensit iv e families
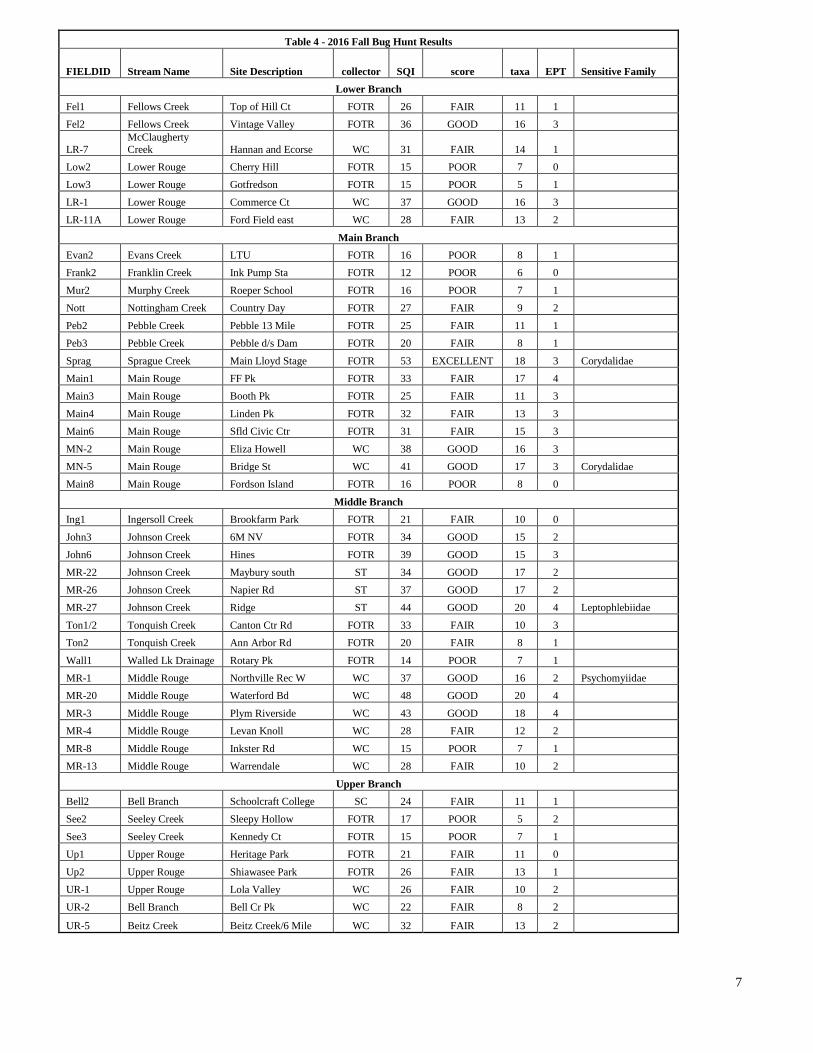
Rouge River Benthic Macroinvertebrate Monitoring Program Fall 2016 Report This report contains benthic macroinvertebrate sampling results from 44 Rouge tributary and river sites. The Fall Bug Hunt on October 15 had 89 participants. There were 13 teams that sampled 25 sites. Groups participating included five teams from Wayne State University and one CSI Team (Critter Science Investigation). The Schoolcraft College Geography Department once again provided the meeting space
and refreshments and volunteer Daisy Lovain ran the registration. This report also includes data from additional FOTR sampling, one site sampled by Schoolcraft College students, three sites sampled by Sue Thompson and 14 sites sampled by Wayne County DPS.
New Dragonfly Species Found Sue Thompson discovered a new dragonfly family and species for the watershed at two Middle Rouge sites above and below Newburgh Lake (MR-4 and MR-3). Its large size, long spidery legs and frontal horn led her to identify it in the Macromiidae family. Macromiidae naiads live in the muck and debris near the substrate surface in slow areas of streams where they wait to ambush prey (Hilsenhoff, 1995). The adult dragonflies “cruise” down the middle of streams and roads, thus the common family name Cruisers.
Because this was the first finding of this family in the Rouge River, the specimens from both sites were sent out for further identification. A late instar nymph from MR-4 was identified by Ethan Bright and Darrin O’Brien as a Royal River Cruiser, Macromia taeniolata. According to Julie Craves, co-author of the Michigan Odonata Atlas, this species was not recorded in Wayne County until 2001, and despite extensive work in the watershed, was not found in the Rouge during fieldwork from 2001-2010 (Craves and O’Brien 2013, http://bit.ly/2gRQgJ2). An earlier instar nymph collected at MR-3 is also in the Macromiidae family, and most likely the same species. Only three other members of this family have been found in Michigan. Stream Cruiser (Didymops transversa) and Swift River Cruiser (Macromia illinoiensis) are both fairly common and widespread, while M. taeniolata is much rarer and has only been documented in the southern Lower Peninsula. Alleghany River Cruiser (M. alleghaniensis) has only been recorded once in the state.
Royal River Cruiser Nymph photo credit: Nancy Gregor Wayne County DPS
Adult Royal River Cruiser, Huron River , Wayne County photo credit: Darrin O’Brien
The benthic macroinvertebrate monitoring program would not be possible without volunteers who are willing to come back year after year, going through training and taking on leadership roles. At the Fall Bug Hunt, we recognized six volunteers who have participated for ten years or more (see photo at left). Volunteers were recognized with certificates and special pins.
From left: Chester Marvin, Susan Thompson, Ralph Williams (Sally Petrella), Bruce McCulloch, Diane O’Connell, Steve Weis
Additionally, nine volunteers who have participated for five years or more were recognized with certificates. Thank you to the Michigan Clean Water Corps for providing certificates and pins.
From left: Stuart Steel, Lynn DeGrande, Lisa Agosta, Grant Faber, Daisy Lovain, (Sally Petrella), Dan Stowe, Alan Vankerckhove, Sandy & Doug Wallace Overall Scores Of the 44 sites sampled this fall, the average Stream Quality Index (SQI) was FAIR (28) (map p.6, Table 1 & 4). Sites averaged 12 taxa, two mayfly, stonefly and/or caddisfly families (EPT) and zero sensitive Families. One site had an EXCELLENT SQI: Sprag. Twelve sites were GOOD; 21 sites were FAIR and ten sites scored POOR. The number of taxa found at sites was highest at MR-20 and MR-27 (20) and lowest at Low3 and See 2(5).
Table 1: Averages Average
SQI Average # of
taxa Average #
EPT Average # Sensitive
Families 28 12 2 0
Some mayfly, stonefly and caddis fly families (EPT) were found at all but five sites. Three Johnson Creek sites and Sprag had the highest number of these families (4 at MR-3, MR-20, MR-27 & Main1).
Understanding Benthic Scores Each site is given a Stream Quality Index (SQI) which is determined by weighting each type and number of organisms found by their sensitivity ratings. A higher proportion of sensitive organisms such as mayflies and caddisflies results in a higher SQI. A greater number of different organisms also results in a high SQI. The SQI has four different levels: >48=EXCELLENT, 34-48=GOOD, 19-33=FAIR, <19=POOR. Number of taxa represents the number of different families of organisms. Like SQI, a higher number of taxa indicate a healthier site. Number of insect taxa – insects are more sensitive than the non-insect taxa. EPT refers to the number of mayfly, caddisfly and stonefly families found; these three orders contain some of the most sensitive organisms. Number of sensitive families refers to the number of families of insects that rate very sensitive on the Hilsenfhoff Biotic Index.
3
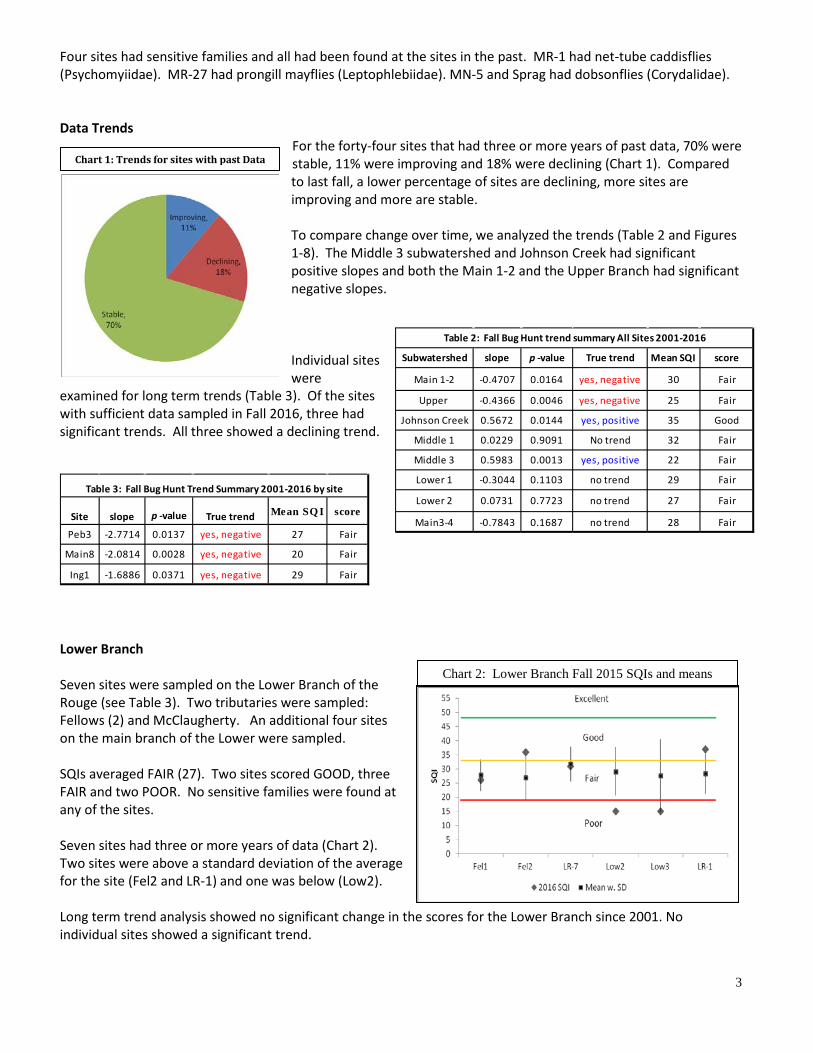
Chart 2: Lower Branch Fall 2015 SQIs and means
Chart 1: Trends for sites with past Data
Subwatershed slope p -value True trend Mean SQI score
Main 1-2 -0.4707 0.0164 yes, negative 30 Fair
Upper -0.4366 0.0046 yes, negative 25 Fair
Johnson Creek 0.5672 0.0144 yes, positive 35 Good
Middle 1 0.0229 0.9091 No trend 32 Fair
Middle 3 0.5983 0.0013 yes, positive 22 Fair
Lower 1 -0.3044 0.1103 no trend 29 Fair
Lower 2 0.0731 0.7723 no trend 27 Fair
Main3-4 -0.7843 0.1687 no trend 28 Fair
Table 2: Fall Bug Hunt trend summary All Sites 2001-2016
Four sites had sensitive families and all had been found at the sites in the past. MR-1 had net-tube caddisflies (Psychomyiidae). MR-27 had prongill mayflies (Leptophlebiidae). MN-5 and Sprag had dobsonflies (Corydalidae). Data Trends
For the forty-four sites that had three or more years of past data, 70% were stable, 11% were improving and 18% were declining (Chart 1). Compared to last fall, a lower percentage of sites are declining, more sites are improving and more are stable. To compare change over time, we analyzed the trends (Table 2 and Figures 1-8). The Middle 3 subwatershed and Johnson Creek had significant positive slopes and both the Main 1-2 and the Upper Branch had significant negative slopes. Individual sites were
examined for long term trends (Table 3). Of the sites with sufficient data sampled in Fall 2016, three had significant trends. All three showed a declining trend.
Site slope p -value True trend Mean SQ I score
Peb3 -2.7714 0.0137 yes, negative 27 Fair
Main8 -2.0814 0.0028 yes, negative 20 Fair
Ing1 -1.6886 0.0371 yes, negative 29 Fair
Table 3: Fall Bug Hunt Trend Summary 2001-2016 by site
Lower Branch Seven sites were sampled on the Lower Branch of the Rouge (see Table 3). Two tributaries were sampled: Fellows (2) and McClaugherty. An additional four sites on the main branch of the Lower were sampled. SQIs averaged FAIR (27). Two sites scored GOOD, three FAIR and two POOR. No sensitive families were found at any of the sites. Seven sites had three or more years of data (Chart 2). Two sites were above a standard deviation of the average for the site (Fel2 and LR-1) and one was below (Low2). Long term trend analysis showed no significant change in the scores for the Lower Branch since 2001. No individual sites showed a significant trend.
4
Chart 5: Middle Branch Tributaries SQIs and means
Chart 3: Main Branch Tributary Fall 2015 SQIs and means
Chart 4: Main Branch Fall 2015 SQIs and means
Main Branch
Fourteen sites on the Main Branch were sampled. This included six tributaries: Evans, Franklin, Murphy, Nottingham, Pebble (2) and Sprague and seven sites on the Main. SQIs averaged FAIR (28). There was one EXCELLENT, two GOOD, seven FAIR, and four POOR SQIs. The EXCELLENT site was Sprag at the Stage Nature Center in Troy. GOOD sites were MN-2 and MN-5. Sensitive dobsonflies (Corydalidae) were found at both MN-5 and Sprag. Thirteen sites on the Main had three or more years of data (Charts 3 & 4). Three sites (Sprag, Main1 and MN-2) were above a standard deviation of the mean and three were below (Mur2, Peb3, Main8).
Long term trend analysis shows a significant negative trend for the Main 1/2 subwatershed (Table 2, Figures 1-8). Two Main Branch sites also showed a decline (Peb3 and Main8).
Middle Branch Fifteen sites were sampled on the Middle Branch including Ingersoll, Johnson (5), Tonquish (2) and the Walled Lake drainage (Table 3). SQI scores averaged a high FAIR (32). There were 8 GOOD, 5 FAIR and one POOR (MR-8) SQIs. Sensitive families were found at MR-27 (Leptophlebiidae) & MR-1(Psychomyiidae). Fourteen sites had three years or more of data (Charts 5 & 6). Of these, one was above a standard deviation of the mean (MR-13) and two were below (Wall1, MR-8). In long term trend analysis, the Middle 3 and Johnson Creek had positive trends (Table 2, Figures 1-8). One Middle Branch site showed a negative trend (Ing1 – see Table 3)
5
Chart 7: Upper Branch SQIs and means
Upper Branch
Eight Upper branch sites were sampled this fall, including the Bell (2), Beitz and Seeley(2) (Table 3). SQIs averaged a low FAIR (22). Six sites were FAIR and two POOR (See2 & See3). No sensitive families were found in the Upper Branch. Seven sites had three years or more of data (Chart 7). Two sites were below a standard deviation of the norm (See3 & UR-2). Long term trend analysis shows a significant decline in scores since 2001. No individual sites had significant trends.
THANK YOU!!!!!
Thank you to all the volunteers and Team Leaders, Schoolcraft College for hosting the event, professor Diane O’Connell and the Geography Department for providing refreshments, Daisy Lovain for running registration, Wayne County for sampling and providing data for 14 sites, Bill Eisenman for assisting with Fordson Island sampling, Sue Thompson for sampling additional sites, helping with identification, trend analysis and reviewing the report, biologist Bruce McCulloch for identifying most of the specimens, SQI comparison graphs and reviewing the report, Julie Craves, Darrin O’Brien and Ethan Bright for identifying and info on the Royal River Cruiser and the Alliance of Rouge Communities for funding the program through a SAW Grant.
Join us for the
Winter Stonefly Search Sat. Jan. 21, 2017 9 am – 3 pm at UM-D
MN-2 Main Rouge Eliza Howell WC 38 GOOD 16 3 MN-5 Main Rouge Bridge St WC 41 GOOD 17 3 Corydalidae Main8 Main Rouge Fordson Island FOTR 16 POOR 8 0
Middle Branch Ing1 Ingersoll Creek Brookfarm Park FOTR 21 FAIR 10 0
John3 Johnson Creek 6M NV FOTR 34 GOOD 15 2 John6 Johnson Creek Hines FOTR 39 GOOD 15 3
MR-22 Johnson Creek Maybury south ST 34 GOOD 17 2 MR-26 Johnson Creek Napier Rd ST 37 GOOD 17 2 MR-27 Johnson Creek Ridge ST 44 GOOD 20 4 Leptophlebiidae
Ton1/2 Tonquish Creek Canton Ctr Rd FOTR 33 FAIR 10 3 Ton2 Tonquish Creek Ann Arbor Rd FOTR 20 FAIR 8 1
Figure 1- Lower1 Subwatershed Mean SQIs Figure 2- Lower2 Subwatershed Mean SQIs
Figure 3- Main 1/2 Subwatershed Mean SQIs Figure 4- Main 3/4Subwatershed Mean SQIs
9
Figure 5 – Johnson Creek Mean SQIs Figure 6 – Middle 1 Subwatershed Mean SQIs
Figure 7 – Middle 3 Subwatershed Mean SQIs Figure 8 – Upper Subwatershed Mean SQIs
1
Rouge River Benthic Monitoring Program Spring 2017 Report This report covers benthic macroinvertebrate monitoring at 48 sites on Rouge River tributaries and branches in the spring of 2017. Twenty-six sites were sampled by Friends of the Rouge (FOTR) volunteers and staff, sixteen were sampled by Wayne County Department of Public Services Water Quality Management Division, three were sampled by Susan Thompson, one was sampled by
Schoolcraft College students and two were sampled by Wayne State University’s Ecology Class. Most of Friends of the Rouge’s sites were sampled on May 6 during the Spring Bug Hunt in which 78 people participated. Groups participating in the event were Scout Pack 247, Wayne State University and Marygrove College. The event had been rescheduled from the original April 22 date due to high water but water levels were high again on May 6.
Overall Scores Rain prior to sampling days can affect scores as water levels rise rapidly, washing bugs downstream and making it difficult to sample each site completely. Downstream sites cannot be accessed at all when the water becomes too deep to wade. It also becomes difficult to see the bugs when sediment is washed into the streams. With the high water, the list of sites was changed to smaller headwater streams but some sites were still difficult to sample. In analyzing the results, four sites had scores that were significantly different than what would be expected. These are considered outliers and will not be considered in the analysis. The majority of sites (28/44 or 64%) had FAIR Stream Quality Index scores (SQI) with an average score of 32 (Table 3). Fifteen sites rated GOOD and one sites had a POOR score of 14. The number of taxa at each site ranged from a low of seven on the Lower Rouge at Ford Field (LR-11A) to a high of 23 at one Johnson Creek site (MR-27). The number of EPT (see sidebar) ranged from zero to seven. The seven were found at one Johnson Creek site (MR-27). Eleven sites had sensitive families (see Table 4) including two stonefly families, one mayfly family and dobsonflies.
A new family of insects was found by biologist Susan Thompson at MR-4: little stout crawler mayflies. Though all mayflies are considered sensitive, this family is adapted to silty conditions like those often found in the Rouge after rain (see below).
Little Stout Crawler Mayflies by Susan Thompson Family name: Leptohyphidae (Tricorithidae) Little Stout Crawler mayflies have triangular plate-like gill coverings that protect the breathing gills underneath from becoming clogged with silt. This adaptation allows these mayflies to live in silty habitats. The mayfly breathes by lifting the plate-like gills slightly and waving the gills underneath. They live in flowing waters in small to large rivers and prefer areas with slow current as they are not really good swimmers. They are primarily crawlers (like their name) and can be found in a variety of substrate: silt, fine sand, woody debris or on vegetation. They are primarily collector/gatherers, feeding on vegetation. Tricorithidae is one of the mayfly families that is more tolerant, since they can live in silty substrates and slower moving current where less dissolved oxygen is present. (Voshell , 2002)
FRIENDS OF THE ROUGE BENTHIC MONITORING PROGRAM
FOTR’s benthic monitoring program was started in 2001 to involve a large number of volunteers in monitoring the health of the watershed by sampling the creeks of the Rouge River. The types and number of benthic macroinvertebrates found can be used to assess water quality. Each team of volunteers samples two sites under the direction of a trained team leader. Samples of each organism are collected and field identifications are verified in the lab. The program is funded by the Alliance of Rouge Communities and in cooperation with Wayne County Department of Public Services Water Quality Management Division.
www.therouge.org 4901 Evergreen Rd., KM
Dearborn, MI 48128
(313) 792-9621
Stream Quality Index, Taxa, EPT and Sensitive Families
Each site is given a Stream Quality Index (SQI) which is determined by weighting each type and number of organisms found by their sensitivity ratings. A higher proportion of sensitive organisms such as mayflies and caddisflies results in a higher score. A number of different organisms also results in a high score. The SQI is then given a rating: >48 = EXCELLENT 34-48 = GOOD 19-33 = FAIR <19 = POOR Number of taxa represents the number of different families of organisms. A higher number of taxa indicate a healthier site. EPT refers to the number of mayfly, caddisfly and stonefly families found; these three orders contain some of the most sensitive organisms. Sensitive Families refers to insects that are rated 1 on the Hilsenhoff Sensitivity Index.
Spiny crawler mayfly nymph credit: Aquatic Insects of Central Virginia
2
Data Trends Table 1 contains the data trends by subwatershed/creek. The Johnson Creek, the Middle 1 and the Middle 3 subwatersheds are showing significant positive trends. No other subwatershed had significant trends.
Table 1 - FOTR and WC Spring Bug Hunt Summary 2001-2017
Branch slope p-value True trend Subwatershed average score
Water Quality Rating
Main 1-2 0.2228 0.1095 no trend 27 Fair
Main3-4 -0.1351 0.7504 no trend 25 Fair
Upper -0.1112 0.4582 no trend 24 Fair
Johnson Creek 0.4828 0.0184 yes, positive 39 Good
Middle 1 0.9185 0.00003 yes, positive 30 Fair
Middle 3 0.7935 0.0046 yes, positive 20 Fair
Lower 1 0.0953 0.5791 no trend 30 Fair
Lower 2 0.0328 0.8934 no trend 26 Fair
In addition to the trend analysis by subwatershed, a site-by-site analysis of all the sites was done (Table 2). Only one site had a trend – UR-5.
Table 2 - FOTR & WC Spring Bug Hunt Significant Trends by site 2001-2017
Site p-value Slope True trend Site average score
Water Quality Rating
UR-5 0.0298 3.7 yes, positive 23 Fair
Trend Analysis To determine whether the Rouge River is
improving over time, SQI scores are averaged for each subwatershed and Johnson Creek (a
cold water tributary) and the slope is plotted. A positive slope indicates an upward trend (scores
increasing); a negative slope indicates a downward trend (scores decreasing). The trend
is significant if the p-value is less than 0.05.
3
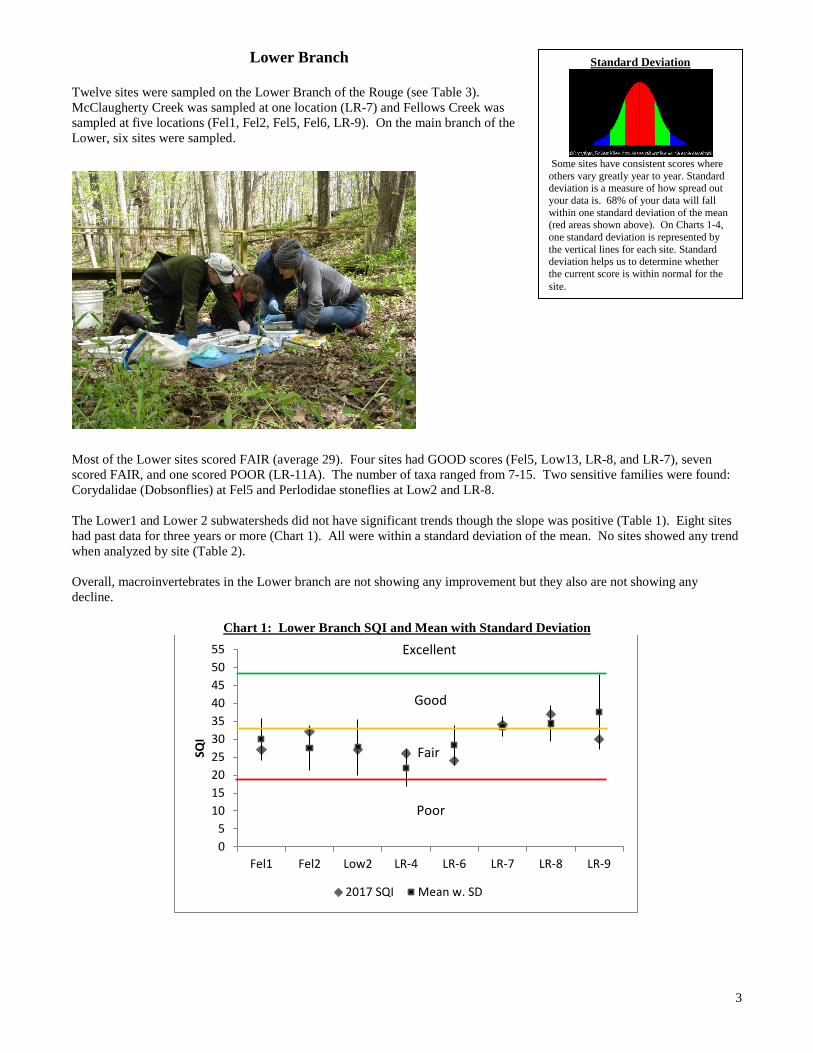
Lower Branch
Twelve sites were sampled on the Lower Branch of the Rouge (see Table 3). McClaugherty Creek was sampled at one location (LR-7) and Fellows Creek was sampled at five locations (Fel1, Fel2, Fel5, Fel6, LR-9). On the main branch of the Lower, six sites were sampled.
Most of the Lower sites scored FAIR (average 29). Four sites had GOOD scores (Fel5, Low13, LR-8, and LR-7), seven scored FAIR, and one scored POOR (LR-11A). The number of taxa ranged from 7-15. Two sensitive families were found: Corydalidae (Dobsonflies) at Fel5 and Perlodidae stoneflies at Low2 and LR-8. The Lower1 and Lower 2 subwatersheds did not have significant trends though the slope was positive (Table 1). Eight sites had past data for three years or more (Chart 1). All were within a standard deviation of the mean. No sites showed any trend when analyzed by site (Table 2). Overall, macroinvertebrates in the Lower branch are not showing any improvement but they also are not showing any decline.
Chart 1: Lower Branch SQI and Mean with Standard Deviation
05
10152025303540455055
Fel1 Fel2 Low2 LR-4 LR-6 LR-7 LR-8 LR-9
SQI
2017 SQI Mean w. SD
Poor
Fair
Good
Excellent
Standard Deviation
Some sites have consistent scores where others vary greatly year to year. Standard deviation is a measure of how spread out your data is. 68% of your data will fall within one standard deviation of the mean (red areas shown above). On Charts 1-4, one standard deviation is represented by the vertical lines for each site. Standard deviation helps us to determine whether the current score is within normal for the site.
4
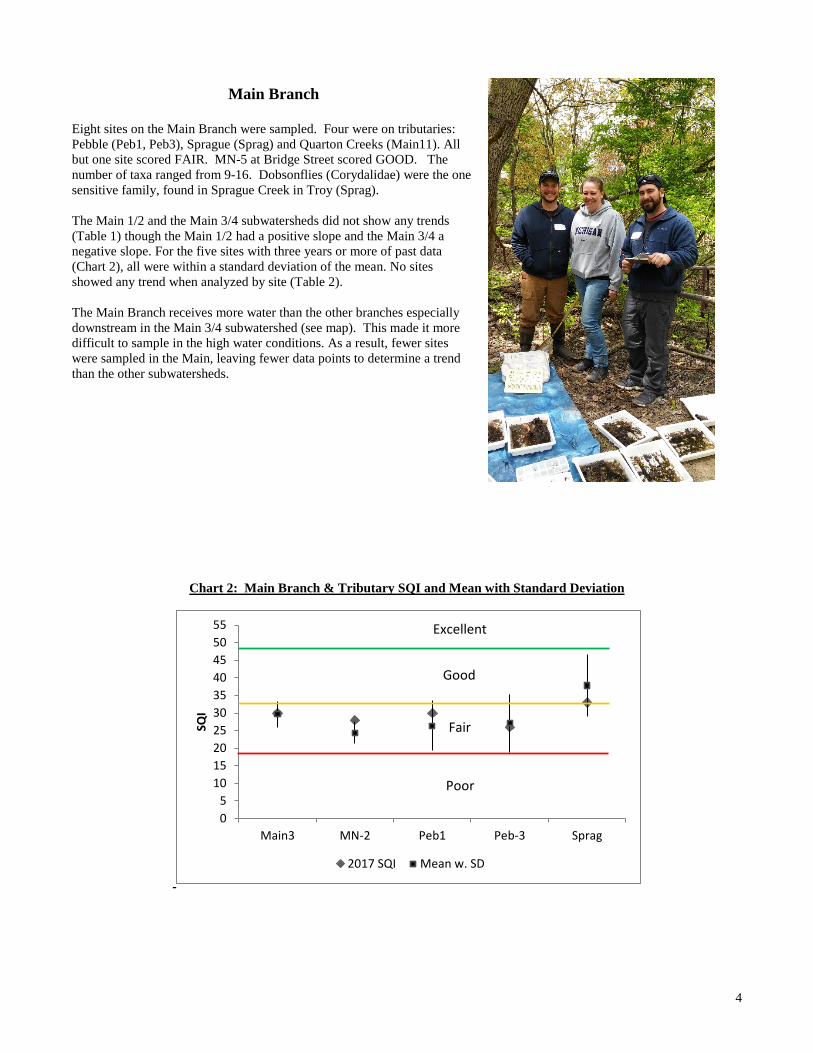
Main Branch
Eight sites on the Main Branch were sampled. Four were on tributaries: Pebble (Peb1, Peb3), Sprague (Sprag) and Quarton Creeks (Main11). All but one site scored FAIR. MN-5 at Bridge Street scored GOOD. The number of taxa ranged from 9-16. Dobsonflies (Corydalidae) were the one sensitive family, found in Sprague Creek in Troy (Sprag). The Main 1/2 and the Main 3/4 subwatersheds did not show any trends (Table 1) though the Main 1/2 had a positive slope and the Main 3/4 a negative slope. For the five sites with three years or more of past data (Chart 2), all were within a standard deviation of the mean. No sites showed any trend when analyzed by site (Table 2). The Main Branch receives more water than the other branches especially downstream in the Main 3/4 subwatershed (see map). This made it more difficult to sample in the high water conditions. As a result, fewer sites were sampled in the Main, leaving fewer data points to determine a trend than the other subwatersheds.
Chart 2: Main Branch & Tributary SQI and Mean with Standard Deviation
05
10152025303540455055
Main3 MN-2 Peb1 Peb-3 Sprag
SQI
2017 SQI Mean w. SD
Poor
Fair
Good
Excellent
5
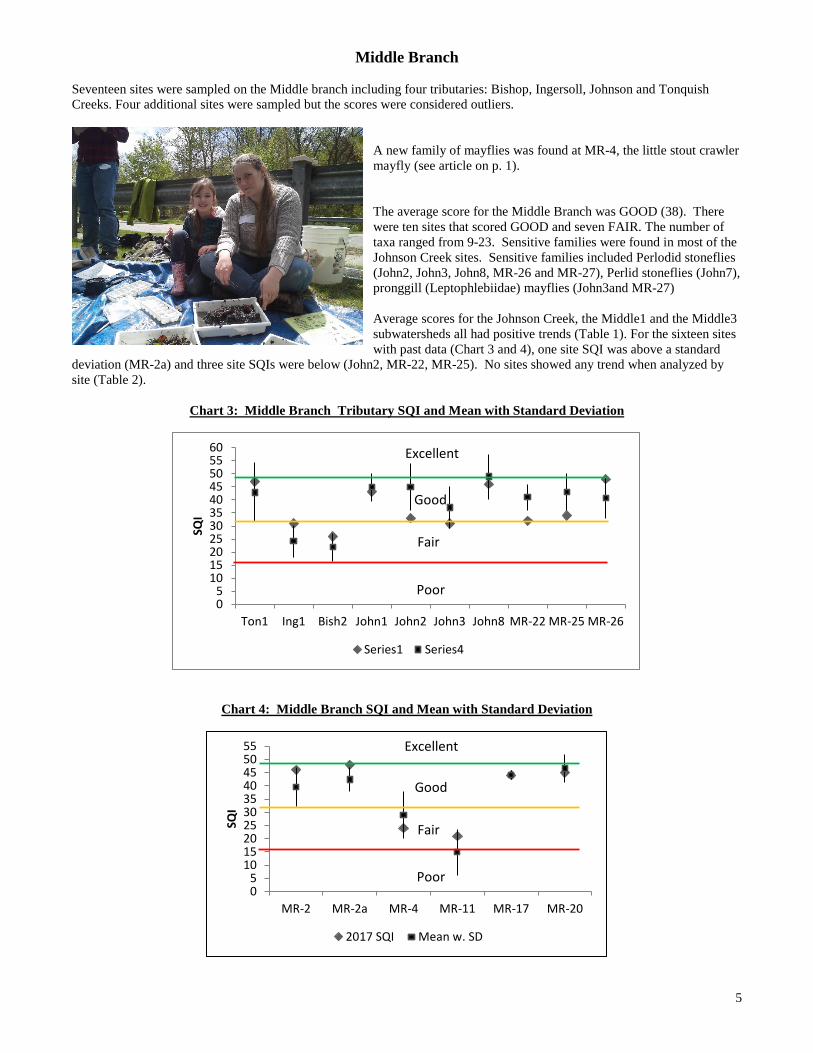
Middle Branch Seventeen sites were sampled on the Middle branch including four tributaries: Bishop, Ingersoll, Johnson and Tonquish Creeks. Four additional sites were sampled but the scores were considered outliers.
A new family of mayflies was found at MR-4, the little stout crawler mayfly (see article on p. 1). The average score for the Middle Branch was GOOD (38). There were ten sites that scored GOOD and seven FAIR. The number of taxa ranged from 9-23. Sensitive families were found in most of the Johnson Creek sites. Sensitive families included Perlodid stoneflies (John2, John3, John8, MR-26 and MR-27), Perlid stoneflies (John7), pronggill (Leptophlebiidae) mayflies (John3and MR-27) Average scores for the Johnson Creek, the Middle1 and the Middle3 subwatersheds all had positive trends (Table 1). For the sixteen sites with past data (Chart 3 and 4), one site SQI was above a standard
deviation (MR-2a) and three site SQIs were below (John2, MR-22, MR-25). No sites showed any trend when analyzed by site (Table 2).
Chart 3: Middle Branch Tributary SQI and Mean with Standard Deviation
Chart 4: Middle Branch SQI and Mean with Standard Deviation
Seven Upper branch sites were sampled this spring, including five tributaries: Beitz, Bell, Minnow Pond and Tarabusi Creeks. No main Upper branch sites were sampled due to dangerous high water.
The average score for the Upper branch was 26 with all seven sites scoring FAIR. The number of taxa ranged from 8-11 and EPT 1-3. Perlodid stoneflies were found for the first time in Minnow Pond at Min4, a new upstream site. The Upper Subwatershed did not show any overall trend though the slope was negative (Table1). For the five sites with past data (Chart 5), one site was below a standard deviation of the mean (Bell2). When analyzed by site, UR-5 showed a positive trend (Table 2).
Chart 5: Upper Branch SQI with Mean and Standard Deviation
05
10152025303540455055
Bell1 Bell2 Min1 Tar2 UR-2
SQI
2017 SQI Mean w. SD
Poor
Fair
Good
Excellent
7
8
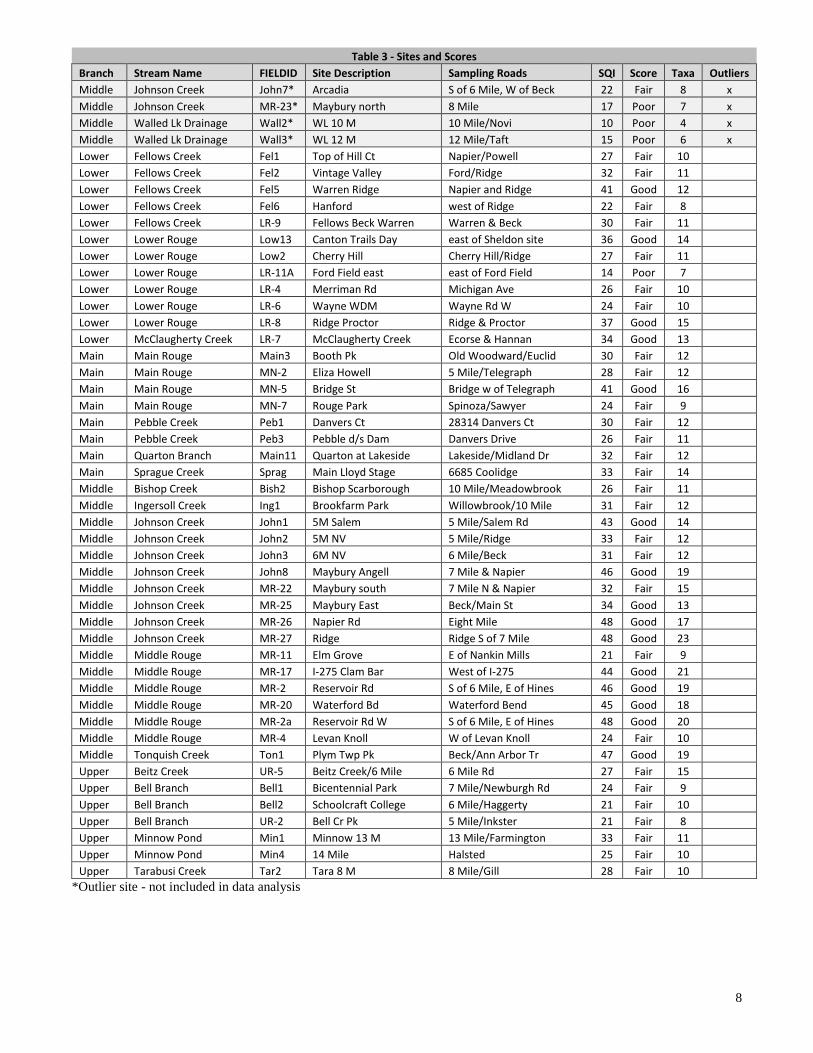
Table 3 - Sites and Scores Branch Stream Name FIELDID Site Description Sampling Roads SQI Score Taxa Outliers Middle Johnson Creek John7* Arcadia S of 6 Mile, W of Beck 22 Fair 8 x Middle Johnson Creek MR-23* Maybury north 8 Mile 17 Poor 7 x Middle Walled Lk Drainage Wall2* WL 10 M 10 Mile/Novi 10 Poor 4 x Middle Walled Lk Drainage Wall3* WL 12 M 12 Mile/Taft 15 Poor 6 x Lower Fellows Creek Fel1 Top of Hill Ct Napier/Powell 27 Fair 10 Lower Fellows Creek Fel2 Vintage Valley Ford/Ridge 32 Fair 11 Lower Fellows Creek Fel5 Warren Ridge Napier and Ridge 41 Good 12 Lower Fellows Creek Fel6 Hanford west of Ridge 22 Fair 8 Lower Fellows Creek LR-9 Fellows Beck Warren Warren & Beck 30 Fair 11 Lower Lower Rouge Low13 Canton Trails Day east of Sheldon site 36 Good 14 Lower Lower Rouge Low2 Cherry Hill Cherry Hill/Ridge 27 Fair 11 Lower Lower Rouge LR-11A Ford Field east east of Ford Field 14 Poor 7 Lower Lower Rouge LR-4 Merriman Rd Michigan Ave 26 Fair 10 Lower Lower Rouge LR-6 Wayne WDM Wayne Rd W 24 Fair 10 Lower Lower Rouge LR-8 Ridge Proctor Ridge & Proctor 37 Good 15 Lower McClaugherty Creek LR-7 McClaugherty Creek Ecorse & Hannan 34 Good 13 Main Main Rouge Main3 Booth Pk Old Woodward/Euclid 30 Fair 12 Main Main Rouge MN-2 Eliza Howell 5 Mile/Telegraph 28 Fair 12 Main Main Rouge MN-5 Bridge St Bridge w of Telegraph 41 Good 16 Main Main Rouge MN-7 Rouge Park Spinoza/Sawyer 24 Fair 9 Main Pebble Creek Peb1 Danvers Ct 28314 Danvers Ct 30 Fair 12 Main Pebble Creek Peb3 Pebble d/s Dam Danvers Drive 26 Fair 11 Main Quarton Branch Main11 Quarton at Lakeside Lakeside/Midland Dr 32 Fair 12 Main Sprague Creek Sprag Main Lloyd Stage 6685 Coolidge 33 Fair 14 Middle Bishop Creek Bish2 Bishop Scarborough 10 Mile/Meadowbrook 26 Fair 11 Middle Ingersoll Creek Ing1 Brookfarm Park Willowbrook/10 Mile 31 Fair 12 Middle Johnson Creek John1 5M Salem 5 Mile/Salem Rd 43 Good 14 Middle Johnson Creek John2 5M NV 5 Mile/Ridge 33 Fair 12 Middle Johnson Creek John3 6M NV 6 Mile/Beck 31 Fair 12 Middle Johnson Creek John8 Maybury Angell 7 Mile & Napier 46 Good 19 Middle Johnson Creek MR-22 Maybury south 7 Mile N & Napier 32 Fair 15 Middle Johnson Creek MR-25 Maybury East Beck/Main St 34 Good 13 Middle Johnson Creek MR-26 Napier Rd Eight Mile 48 Good 17 Middle Johnson Creek MR-27 Ridge Ridge S of 7 Mile 48 Good 23 Middle Middle Rouge MR-11 Elm Grove E of Nankin Mills 21 Fair 9 Middle Middle Rouge MR-17 I-275 Clam Bar West of I-275 44 Good 21 Middle Middle Rouge MR-2 Reservoir Rd S of 6 Mile, E of Hines 46 Good 19 Middle Middle Rouge MR-20 Waterford Bd Waterford Bend 45 Good 18 Middle Middle Rouge MR-2a Reservoir Rd W S of 6 Mile, E of Hines 48 Good 20 Middle Middle Rouge MR-4 Levan Knoll W of Levan Knoll 24 Fair 10 Middle Tonquish Creek Ton1 Plym Twp Pk Beck/Ann Arbor Tr 47 Good 19 Upper Beitz Creek UR-5 Beitz Creek/6 Mile 6 Mile Rd 27 Fair 15 Upper Bell Branch Bell1 Bicentennial Park 7 Mile/Newburgh Rd 24 Fair 9 Upper Bell Branch Bell2 Schoolcraft College 6 Mile/Haggerty 21 Fair 10 Upper Bell Branch UR-2 Bell Cr Pk 5 Mile/Inkster 21 Fair 8 Upper Minnow Pond Min1 Minnow 13 M 13 Mile/Farmington 33 Fair 11 Upper Minnow Pond Min4 14 Mile Halsted 25 Fair 10 Upper Tarabusi Creek Tar2 Tara 8 M 8 Mile/Gill 28 Fair 10
Thank you to all the volunteers and Team Leaders, Wayne County for sampling and providing data for sixteen sites and doing the trend analysis, Bruce McCulloch for graphing data and advising us, University of Michigan-Dearborn for providing the meeting place for the Spring Bug Hunt and a lab for identification night, Sue Thompson for sampling additional sites, Wayne State University students for sampling two sites, Diane O’Connell and Schoolcraft College students for sampling one site and Daisy Lovain for running registration.
Fall Bug Hunt Oct. 14, 2017 9am-4pm
Schoolcraft College VisTaTech Center
Sign up online today (deadline Sept. 30, 2017 at www.therouge.org) Team Leader Training – Sat. Sept. 30, 2017 9am-2pm (must have participated in a previous event)
Friends of the Rouge University of Michigan-Dearborn
4901 Evergreen Road KM Bldg, Dearborn, MI 48128 www.therouge.org
The Rouge River Watershed Frog and Toad Survey is a volunteer listening survey that has been coordinated by Friends of the Rouge since 1998. Volunteers are trained to recognize local frog and toad breeding calls and survey quarter-square-mile blocks within the Rouge River watershed from March through July. The purpose of the survey is to collect baseline data on the distribution of frogs and toads within the watershed as well as to give residents of an urbanizing area a positive experience with their local natural areas.
Summary of Volunteer Effort This was the nineteenth year of the Rouge River Watershed Frog and Toad Survey. One workshop was taught on February 27, 2016 at the Livonia Civic Center Library and 83 people attended. One hundred and fifty-five volunteers including 107 veteran volunteers signed up and collected data for 137 survey blocks. Ninety-five blocks were thoroughly surveyed (4 or more observations, observations made in early, mid and late season). Thank you to volunteer Sandra Hamilton who input the 2016 data.
2016 Survey Results For the 95 blocks that were fully surveyed, an average of 3.8 species was heard per block (Table 1). Only two blocks that were fully surveyed had no species calling. American toads and green frogs were the most commonly heard species while bullfrogs and leopard frogs were the least commonly heard (Table 2). The earliest species to call was the spring peeper on March 8 and the latest to start was the bullfrog on April 15 (Chart 2). The four headwaters subwatersheds (Main 1-2, Upper, Middle 1 and Lower 1) had the most diversity with 7-8 species heard. The Lower 1 had the highest diversity at 4.5 species per block. The downstream subwatersheds did not have enough blocks surveyed to make any comparisons.
Frog & Toad Diversity 1998-2016 We compiled the number of species that have been heard at least once in every survey block since we started the survey in 1998. The resulting map shows how many species have been found in each block. A high diversity of species is linked with high quality wetlands. This map is on FOTR’s website (www.therouge.org). You will be able to click on a block and find what species were heard which years.
Chart 2: First Calling Dates for each Species, 2002-2016
WoodFrog
ChorusFrog
SpringPeeper
AmericanToad
LeopardFrog
GrayTreefrog
GreenFrog
BullFrog
0 10 20 30 40 50 60 70 80 90
100
2001
20
02
2003
20
04
2005
20
06
2007
20
08
2009
20
10
2011
20
12
2013
20
14
2015
20
16
Axis
Titl
e
Wood Frog Yearly Distribution 2001-16
Yearly %
Average
Wood Frog (Rana sylvatica)
Wood frogs were heard in 33% of all survey blocks which is above average for the species (25%). They began calling on March 10 which is average for the species. They were not heard in the Lower 2 or Main 3/4 subwatersheds.
0 10 20 30 40 50 60 70 80 90
100
2001
20
02
2003
20
04
2005
20
06
2007
20
08
2009
20
10
2011
20
12
2013
20
14
2015
20
16 %
of b
lock
s with
spec
ies
calli
ng
Chorus Frog Yearly Distribution, 2001-16
Yearly %
Average
Western chorus frogs were heard in 55% of all survey blocks. This is higher than average (49%) for the species. They started calling on March 9 which is normal for the species. Chorus frogs were heard in all seven subwatersheds.
Western Chorus Frog (Pseudacris triseriata)
0 10 20 30 40 50 60 70 80 90
100
2001
20
02
2003
20
04
2005
20
06
2007
20
08
2009
20
10
2011
20
12
2013
20
14
2015
20
16 %
of b
lock
s with
spec
ies
calli
ng
Spring Peeper Yearly Distribution, 2001-16
Yearly %
Average
Spring Peeper (Pseudacris crucifer)
Spring peepers were calling in only 54% of the blocks, higher than average (50%). They began calling on March 8 which is normal for the species. They were not heard in the Lower 2, Middle 3 or Main3/4 subwatersheds.
0 10 20 30 40 50 60 70 80 90
100
2001
2002
2003
2004
2005
2006
2007
2008
2009
2010
2011
2012
2013
2014
2015
2016
% o
f blo
cks w
ith sp
ecie
s ca
lling
American Toad Yearly Distribution, 2001-16
Yearly %
Average
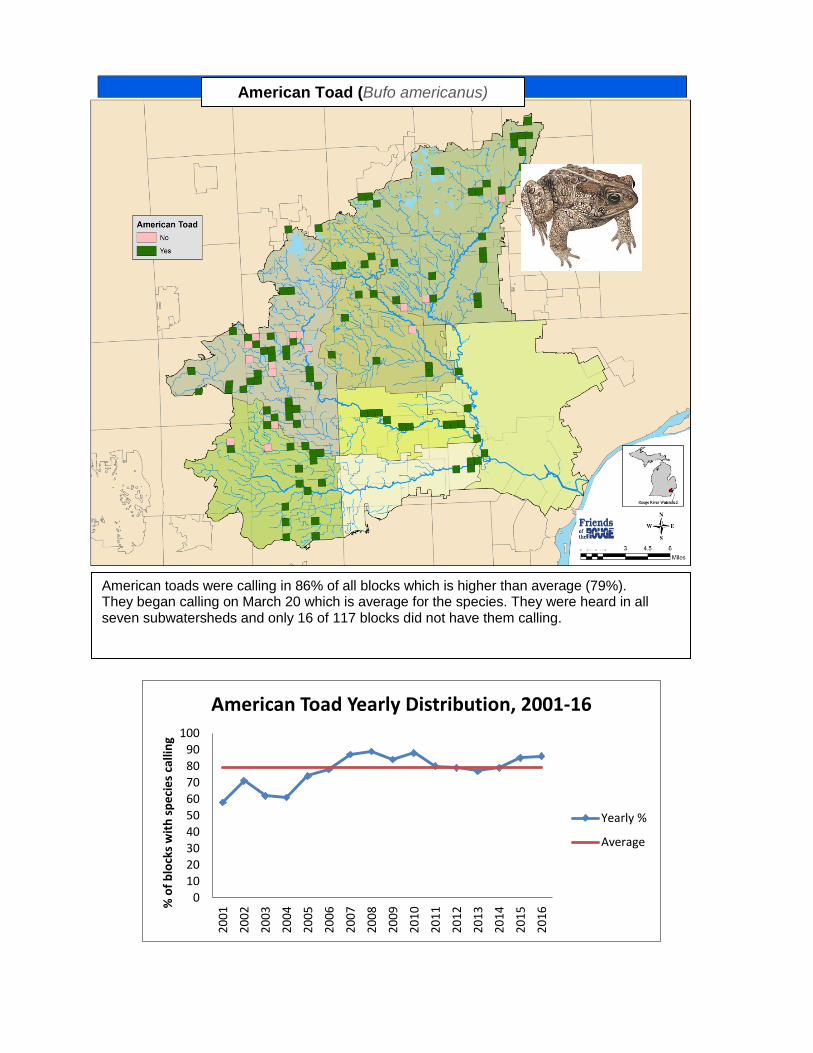
American toads were calling in 86% of all blocks which is higher than average (79%). They began calling on March 20 which is average for the species. They were heard in all seven subwatersheds and only 16 of 117 blocks did not have them calling.
American Toad (Bufo americanus)
0 10 20 30 40 50 60 70 80 90
100
2001
2002
2003
2004
2005
2006
2007
2008
2009
2010
2011
2012
2013
2014
2015
2016
% o
f blo
cks w
ith sp
ecie
s ca
lling
Leopard Frog Yearly Distribution, 2001-16
Yearly %
Average
Northern Leopard Frog (Rana pipiens)
Northern Leopard Frogs, one of the most sensitive species in the watershed, were calling in 16% of all blocks which is average for this species. They were not heard in the Middle 3 or Upper subwatersheds. They started calling on March 27 which is normal for the species.
Eastern gray treefrogs were heard in 69% of all blocks which is higher than average (51%). For the first time, they were heard in all seven subwatersheds. They began calling on April 12, an average first calling date for the species. (2014 was not included due to the early termination of the survey)
0 10 20 30 40 50 60 70 80 90
100
2001
2002
2003
2004
2005
2006
2007
2008
2009
2010
2011
2012
2013
2014
2015
2016
% o
f blo
cks w
ith sp
ecie
s ca
lling
Gray Treefrog Yearly Distribution, 2001-16
Yearly %
Average
Eastern Gray Treefrog (Hyla versicolor)
0 10 20 30 40 50 60 70 80 90
100
2001
2002
2003
2004
2005
2006
2007
2008
2009
2010
2011
2012
2013
2014
2015
2016
% o
f blo
cks w
ith sp
ecie
s ca
lling
Green Frog Yearly Distribution, 2001-16
Yearly %
Average
Green Frog (Rana clamitans)
Green frogs were heard in 70% of blocks which is above average (64%). They started calling on March 20 which is early for the species. They were heard in all seven subwatersheds. (2014 was not included due to the early termination of the survey)
0 10 20 30 40 50 60 70 80 90
100
2001
2002
2003
2004
2005
2006
2007
2008
2009
2010
2011
2012
2013
2014
2015
2016
% o
f blo
cks w
ith sp
ecie
s ca
lling
Bullfrog Yearly Distribution, 2001-16
Yearly %
Average
Bullfrogs were heard in 17% of blocks which is average for the species. They started calling on April 15 which is early for the species. They were heard in all but the Middle 3 subwatershed. (2014 was not included due to the early termination of the survey)