43
Pablo Antolin-Nicolas, OECD ROUND-TABLE DISCUSSION: The Endgame: Retiring with Dignity Overview of Pension Systems

Pablo Antolin-Nicolas, OECD
ROUND-TABLE DISCUSSION:
The Endgame: Retiring with Dignity
Overview of Pension Systems
Discuss how different pension systems go about at providing income at retirement (pensions): Canada, Japan, Sweden, USA
I first provide an overview of pension systems across OECD countries, byReviewing objectives of pension systems
Presenting criteria to assess different pension arrangements
Objective of this roundtable

1. Avoid people falling into poverty at old age
2. Redistribution
3. Save for retirement
− Objective 1 & 2: safety net (minimum pension, basic pension) to maintain certain level of income at retirement. Financed from the General Budget (taxes). Not enough
− Objective 3: make sure people set money aside regularly (e.g. every month) during their working life to finance their retirement
Three main objectives of pension systems
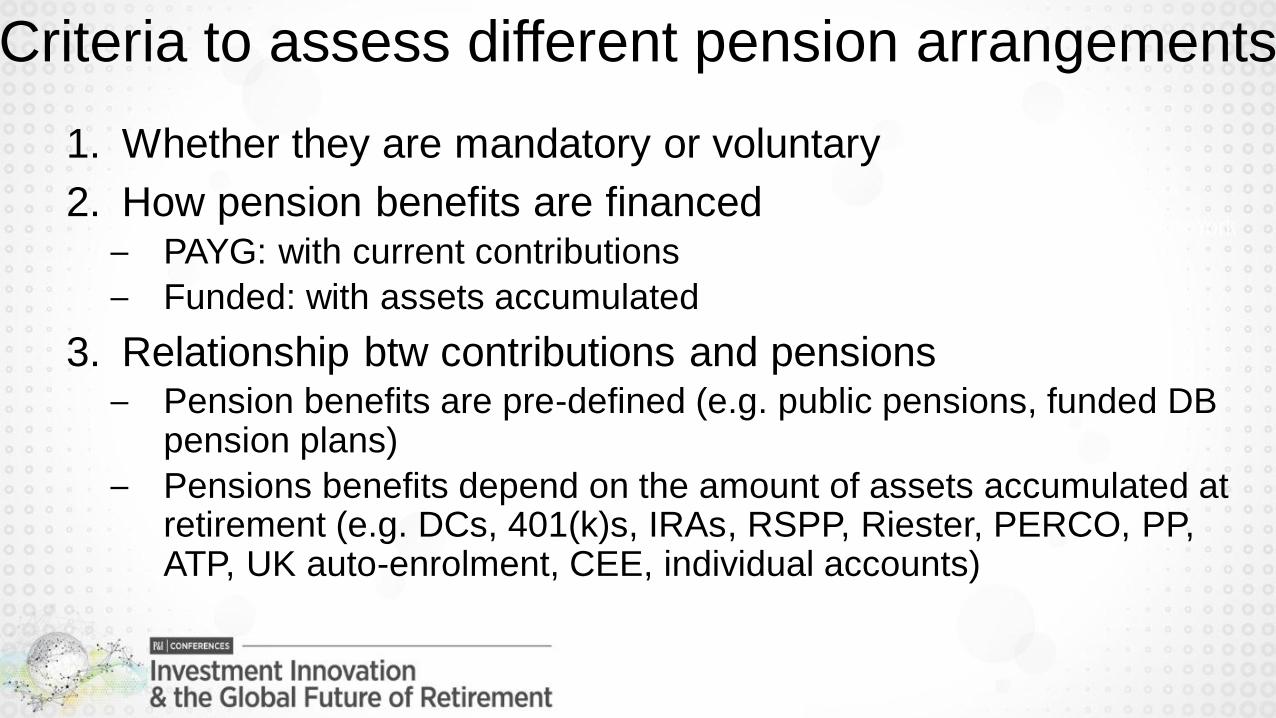
1. Whether they are mandatory or voluntary
2. How pension benefits are financed− PAYG: with current contributions
− Funded: with assets accumulated
3. Relationship btw contributions and pensions− Pension benefits are pre-defined (e.g. public pensions, funded DB
pension plans)
− Pensions benefits depend on the amount of assets accumulated at retirement (e.g. DCs, 401(k)s, IRAs, RSPP, Riester, PERCO, PP, ATP, UK auto-enrolment, CEE, individual accounts)
Criteria to assess different pension arrangements

4. Whether there is an employment relationship− Occupational: access through the employer.
They include employer-sponsored plans, and plans where employers are responsible for any shortfall; they could include plans where employers just make contributions, or just administer employees’ contributions.
− Personal: access is not through an employer relationship
5. Who bears the risks− The employer (employer-sponsored DB plans, the State as an employer,
and some plans in which benefits depend on assets accumulated with employer guarantees)
− The individual (DC plans)− The tax-payer (PAYG public pensions, Social Security)
6. Who manages the plans: public or private
Criteria
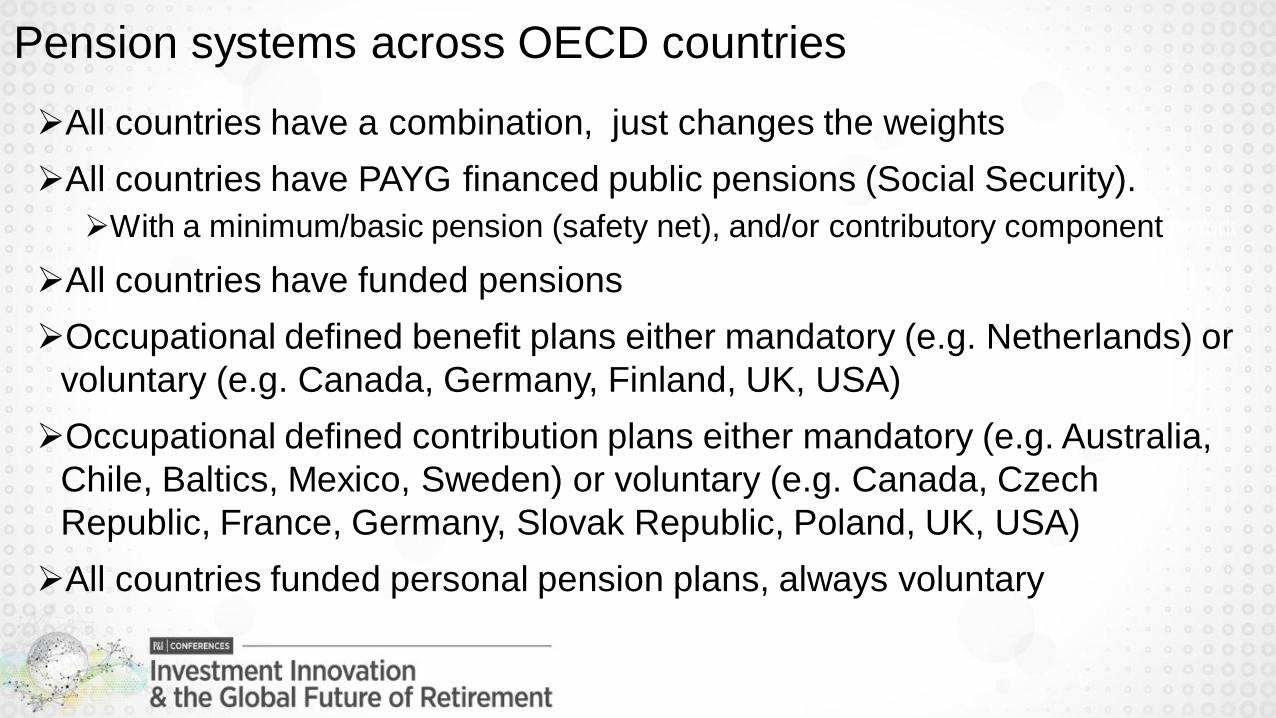
All countries have a combination, just changes the weights
All countries have PAYG financed public pensions (Social Security).
With a minimum/basic pension (safety net), and/or contributory component
All countries have funded pensions
Occupational defined benefit plans either mandatory (e.g. Netherlands) or
voluntary (e.g. Canada, Germany, Finland, UK, USA)
Occupational defined contribution plans either mandatory (e.g. Australia,
Chile, Baltics, Mexico, Sweden) or voluntary (e.g. Canada, Czech
Republic, France, Germany, Slovak Republic, Poland, UK, USA)
All countries funded personal pension plans, always voluntary
Pension systems across OECD countries
6

Replacement rate PAYG public pensions
41.6
0
10
20
30
40
50
60
70
80
Me
xic
oC
hil
eIc
ela
nd
Au
str
alia
Isra
el
Po
lan
dE
sto
nia
Ne
the
rla
…S
wit
zerl
a…
UK
De
nm
ark
Jap
an
Irela
nd
Slo
va
k R
ep
US
AS
lov
en
iaK
ore
aN
ew
…B
elg
ium
Av
era
ge
Germ
an
yS
we
de
nC
an
ad
aC
ze
ch
Re
pN
orw
ay
Gre
ec
eP
ort
ug
al
Fin
lan
dL
ux
em
b.
Fra
nc
eT
urk
ey
Ita
lyH
un
gary
Sp
ain
Au
str
ia
Source: OECD, Pensions at a Glance, 2013
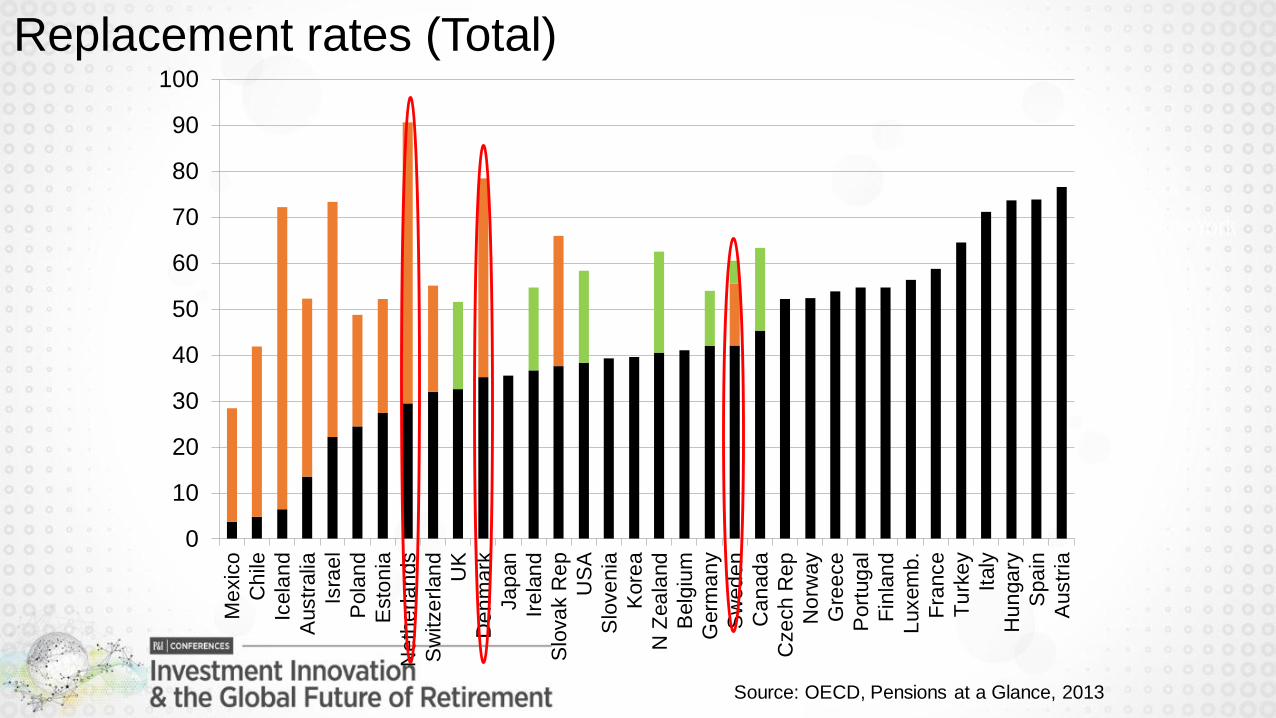
Replacement rates (Total)
0
10
20
30
40
50
60
70
80
90
100
Me
xic
o
Ch
ile
Icela
nd
Austr
alia
Isra
el
Pola
nd
Esto
nia
Ne
the
rla
nds
Sw
itze
rlan
d
UK
De
nm
ark
Ja
pan
Ire
lan
d
Slo
va
k R
ep
US
A
Slo
ve
nia
Kore
a
N Z
ea
land
Belg
ium
Germ
an
y
Sw
ed
en
Ca
nad
a
Cze
ch
Re
p
No
rway
Gre
ece
Port
ug
al
Fin
lan
d
Luxem
b.
Fra
nce
Tu
rke
y
Italy
Hu
nga
ry
Spa
in
Austr
ia
Source: OECD, Pensions at a Glance, 2013

Assets in pension funds (% GDP)
77.0
0
20
40
60
80
100
120
140
160
Gre
ece
Fra
nce
Luxem
b
Hu
nga
ry
Slo
ve
nia
Tu
rke
y
Belg
ium
Austr
ia
Kore
a
Italy
Germ
an
y
Cze
ch
…
No
rway
Spa
in
Esto
nia
Port
ug
al
Sw
ed
en
Slo
va
k…
Me
xic
o N…
Pola
nd
Ja
pan
Sim
ple
…
Ire
lan
d
De
nm
ark
Isra
el
Ch
ile
Ca
nad
a
US
A
We
igh
t…
Fin
lan
d
Austr
alia UK
Sw
itze
…
Icela
nd
Ne
the
r…
Source: OECD, Global Pension Statistics

Shift from DB (benefits pre-defined, employer bears risks) to DC
plans (uncertain pensions, individuals shoulder most of the risks)
(+) Direct and straightforward link between pension benefits and
contributions => No financial sustainability problems (DBs)
(-) There is not a promised retirement income any longer.
(-) Individuals are now exposed to many risks, and they may not
be best prepared to bear them: low financial literacy
Low contributions
Adequacy OECD Roadmap for the Good Design of Retirement Saving Plans
Demographic: people living longerPolicy options to address longevity risk
Main problems going forward

ROUND TABLE DISCUSSION: The Endgame – Retiring with Dignity
Current & Future Agenda in Pension Fund Scheme in JapanShort-term slow movement but Long-term improvement
June 2014
Sadayuki HorieSenior Researcher and Deputy Chairman of Investment Committee GPIF
Nomura Research Institute (NRI), Tokyo

Overview of Pension Scheme in JapanPublic Pillar is dominant plan in Japan
Public Pillar Occupational Pillar Personal Pillar
Basic Pension
Earnings‐related (employers may
partially contract‐out)
65 (Men and Women: in transition)
Contribution Rate (8.383% Employee,
8.383% Employer, for private company
employees)
Replacement rate(Note) – 62.3%
Will go down to around 50%
Voluntary
DB and DC occupational pension
plans
In DC: contribution rate employee ≤
contribution rate employer
Tax incentives
Pension Assets (2011) – 17% of GDP
Tax incentives
Reforms on Agenda:
Public pillar, basic pension ( flat‐rate part for employees): retirement age increase from 60 to 65 till
FY2014/FY2019 for men/women
Public pillar, earnings‐related pension: retirement age increase from 60 to 65 till FY2026/FY2031 for
women
(Note) By replacement rate, we mean the ratio of the total amount of pension benefits in the public pillar which an exemplifying couple aged 65 in FY
2009 was supposed to receive in the same fiscal year to the average amount of disposable income of working males in FY 2009. The exemplifying
couple consists of a husband who worked for a private company from age of 20 to age of 59 with the salary always being the average of male
workers' and was covered by the social security pension scheme for private employees for 40 years and a wife of the same age as her husbands’
who was always a dependent housewife from age of 20 to age of 59
Copyright© 2014 Nomura Research Institute, Ltd. All rights reserved.

Copyright© 2014 Nomura Research Institute, Ltd. All rights reserved.
National Pension (NP) Scheme
(66.7million)
Employees’ Pension
Insurance (EPI) Scheme
(34.5 million)
Occupational
Addition
(as of the end of March 2013)
← the 1st category →(the self-employed,
farmers, the
unemployed, etc.)
(19.0 million)
← the 3rd category →(dependent spouses
of employees)
(9.8 million)
← the 2nd category →
(employees)
(37.9 million)
The three mutual aid associations are to be merged with the EPI scheme on 1 October 2015. So the schemes for employees are
to be unified. Their occupational additions are to be abolished and new occupational pension schemes are to be introduced.
Mutual Aid Association
for Government Employees
(MAAGE)
(1.1 million)
Mutual Aid Association for
Local Government Employees
(MAALGE)
(2.9 million)
Mutual Aid Association for
Private School Employees
(MAAPSE)
(0.5million)
85 Billion US$
1.2 Trillion US$ 500 Billion US$
Reform of Pension Fund
Management is current
most important topic under
inflationary scenario
Social Security Pension Schemes in Japan1st Pillar & 2nd Pillar: Public Pension Schemes

2014 Action Plan Map of GPIF & other related partiesOther uncertainties: Governance structure change?
Organization
Time frameGPIF
Ministry of Health,
Labor, and Welfare
Japanese
Government
November 2013 Reform recommendation
March 2014
Announced infrastructure
investments with OMERS etc.
in next 5 years (2.7 billion
dollars)
Hired HR consultant (TW)
Replaced Japanese equity
managers to much focus on
benchmark agnostic
managers, smart beta,
quantitative strategies
Decided on expected
return of GPIF
=(wage growth rate)+1.7%
(5 years ago, wage+1.6%)
Redefined risk tolerance:
Probability to fail to
outperform wage growth
rate in comparison with the
probability by the 100%
bond portfolio
Less regulations on GPIF
such as cost constraints
April 2014Replaced most investment
committee members
May 2014 Stewardship code signature
June 2014Finalized ALM study/5 year (decision of risk/return target)
Announce growth strategy
of financial industries
September 2014 to March
2015December
Hire full-time investment
committee members?
Asset allocation change
Agree on GPIF’s decision
of policy asset allocation
Change of GPIF
Governance Structure??
Copyright© 2014 Nomura Research Institute, Ltd. All rights reserved.
(Source) Nomura Research Institute

Copyright© 2014 Nomura Research Institute, Ltd. All rights reserved.
Reform Roadmap of GPIFHiring full-time experts, diversification to alternative assets, index change …
Immediate Actions
(March 2014)
Actions after ALM study
will be done (2014)
Actions after related
regulation changes
Portfolio
Management
More flexible portfolio
management, higher active
weight
Change investment return
targets and degrees of risk
tolerance
Adoption of JPX Nikkei400
Decision of policy portfolio
after ALM study (Autumn)
Invest to new asset classes
(high liquidity, easy to evaluate
values)
Setting up baby funds
Invest to new asset classes
(low liquidity, difficult to
evaluate values)
Risk Management
Actions under post-deflationary
economy (invest to inflation-
linked bonds, risk hedge using
derivatives)
Adoption forward-looking risk
analysis
Portfolio construction after
ALM study and based on
forward-looking risk analysis
Advanced risk management
treating new asset classes
Governance
Structure
Adopt mid-long-term
performance based fee
Plan to hire expert staffs
Hiring full-time investment
committee members & expert
staffs after loosening strict
constraints
Setting up independent &
expert board of trustee after
adequate regulation changes
Need for parallel reform between portfolio management & risk management
(Source) “Panel for Sophisticating the Management of Public Funds”, 2013 November 20th
Ahead
Behind

Copyright© 2014 Nomura Research Institute, Ltd. All rights reserved.
Desirable Governance Structure of GPIFCurrent goal of Ministry of Health, Labour and Welfare is Pattern 1
Minister of Health, Labour and Welfare etc.
Investment Staffs
instruction
(Pattern 2)(Pattern 1)
Board of Directors
Investment Management
Investment Staffs
instruction
Chairman (and CEO), Managing Directors
Decision Making
Minister of Health, Labour and Welfare etc.
Board of Directors
Setting the mid-term goals & degree of risk-tolerance
Report
Request for approval of
specific investment plans and policies,
reporting
Appointment of the chairman & other board members
Setting the mid-term goals & degree of risk-tolerance
Investment Management
Appointment of the chairman & other board members
Report
Appointment of CEO and other
executive officers; setting out the fund’s key policies regarding
investments; determining specific
investment plans and policies; performance assessment;
monitoring and oversight
(*) The board deliberates and decides on the key goals and main policies such as policy asset mix and asset classes, while more specific
investment plan and policies are deliberated and decided at the investment committee consisting of the members of the board and others
where appropriate. Establishment of other sub-committees such as risk management committee and governance committee should also be
considered.
Chairman (and other executive officers)
Request for
approval of specific
investment
plans and policies,
reporting
Decision Making
Investment Committee*
Investment Committee
Appointment of Managing Directors;
setting out the fund’s key policies regarding investments; determining
specific investment plans and
policies; performance assessment; monitoring and oversight
(Source) NRI based on “Panel for Sophisticating the Management of Public Funds”, 2013 November 20th
Similar to CPPIBEmpowered by strong board of
directors or investment committee
Full time
managing
directors with
investment skills
can decide on
investment
decision
Separation of
oversight (board
of directors)
and execution
(fund)
Approved in December
2013
Currently try to hire multiple managing
directors in investment committee
Kathleen Kennedy Townsend
Former Lt. Governor MD, Chair, MD Task Force for Retirement Security
Georgetown University’s Center for Retirement Initiatives
ROUND TABLE DISCUSSION: The Endgame – Retiring with Dignity
WHAT U.S. STATES ARE DOING
Georgetown Center for Retirement InitiativesIn Collaboration With Rock Creek Group


California
SB 1234
• State-sponsored payroll deduction
• Pooled assets, professionally managed
• Board preparing to issue RFP for market analysis
2014 State Retirement Security Activity
Bill Defeated Task Force
Bill Passed Bill Pending
asdfasdfasdfasd
f
NYC
MD
RINJ
DE
DC
VT CT
MA
NH
Source: SEIU, Rock Creek Group

Building Momentum in States
• Studies and Original Research
• Clearinghouse for existing information
Building Awareness
• Through Media
• Thought Leaders
• Everyday People
Bi-Partisan Advisory Board
• Hon. Richard Mourdock—Treasurer of IN
• Hon. Nancy Kopp—Treasurer of MD
• Hon. Tom DiNapoli—Comptroller of NY
• Hon. Janet Cowell—Treasurer of NC
• Hon. Ted Wheeler—Treasurer of OR
• Hon. Mark Gordon—Treasurer of WY
• Hon. Scott Stringer—Treasurer of NYC
• Hon. Clint Zweifel—Treasurer of MO
• Hon. Bill Lockyer—Treasurer of CA

Pooled Assets
Professional Management
Payments for Life
Age Diversity
Georgetown Center for Retirement Initiatives
In Collaboration With Rock Creek Group

ROUND TABLE DISCUSSION: The Endgame – Retiring with Dignity
Pension Reform – The Third Rail
Jim Leech
Retired President and Chief Executive Officer
Ontario Teachers’ Pension Plan

Father of the “Canadian Model”
• Ranked #1 worldwide:
• Absolute return
• Value Add
• Customer service
Liability management as important as asset
management

Over the next 20 years 42% of
Canada’s work force will retire
Baby boomers, the 45- to 65-year-
olds, will join the largest job
exodus in Canadian history,
moving to the promised land of
retirement.
Unless our crumbling pension
system is reformed, many of
these retirees will find this
dreamland a bewildering and
disappointing mirage.

Why is there a problem?
• Low savings rate
• Not dying as fast as predicted
• Low projected investment returns
Against backdrop of:
• Reduced workplace pension coverage
• Many existing plans are not sustainable

Jurisdictions studied:
• New Brunswick
• Rhode Island
• Netherlands
Pensions are the political issue de jour

Three recommendations for Canadian system:
• Modest expansion of Canada Pension Plan
• The forgotten “middle”
• “Redefine” Defined Benefits
• Appropriate allocation of risk
• “Workable” Defined Contribution Plans
• Those currently without adequate workplace plan
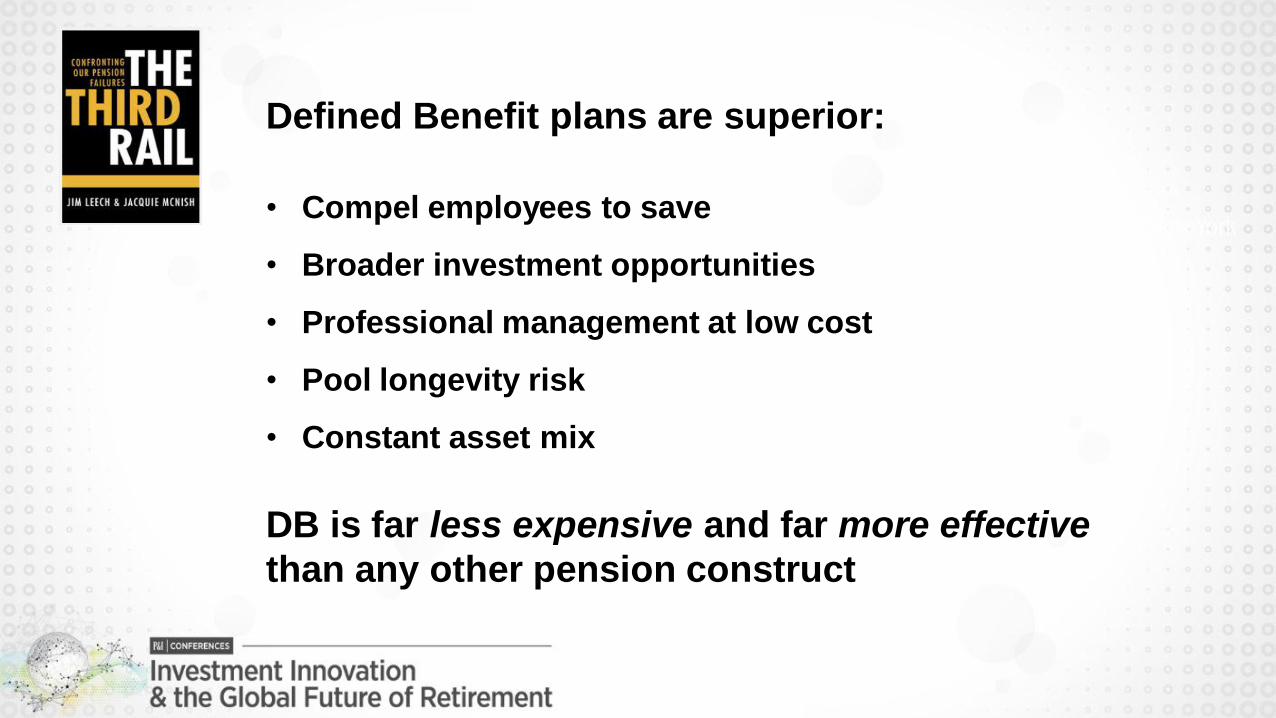
Defined Benefit plans are superior:
• Compel employees to save
• Broader investment opportunities
• Professional management at low cost
• Pool longevity risk
• Constant asset mix
DB is far less expensive and far more effective
than any other pension construct
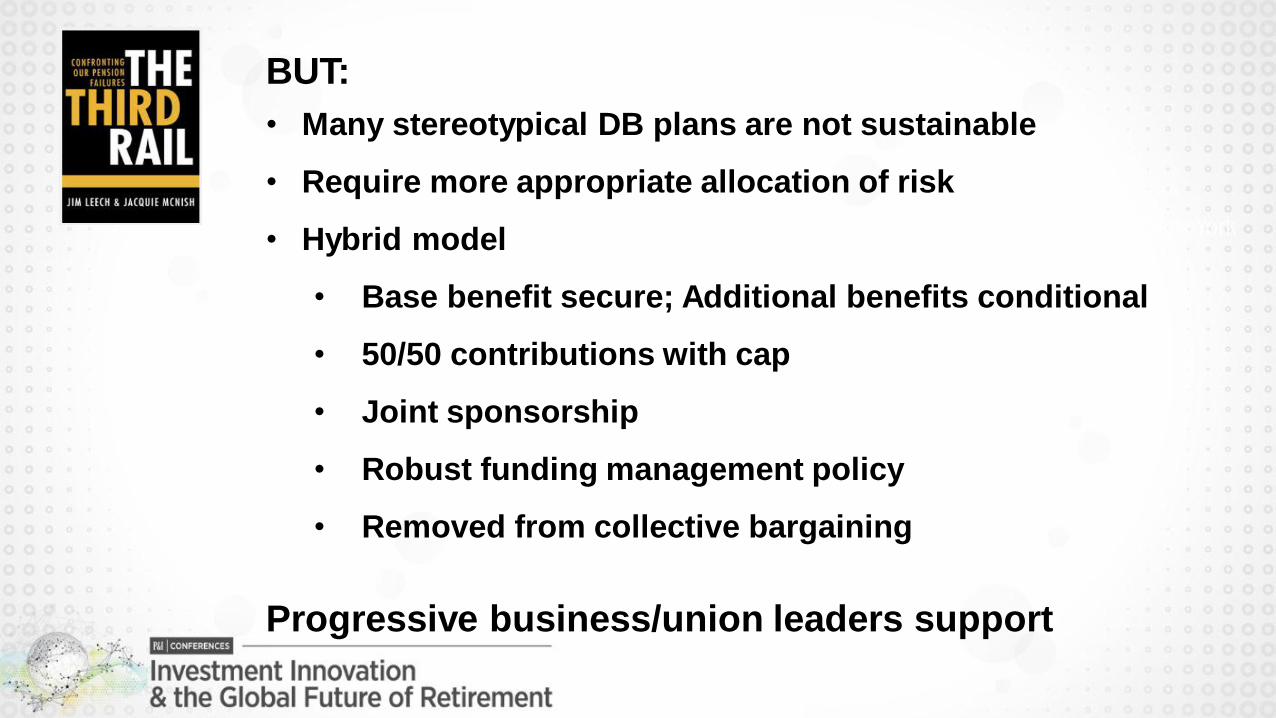
BUT:
• Many stereotypical DB plans are not sustainable
• Require more appropriate allocation of risk
• Hybrid model
• Base benefit secure; Additional benefits conditional
• 50/50 contributions with cap
• Joint sponsorship
• Robust funding management policy
• Removed from collective bargaining
Progressive business/union leaders support

Workable DC plan attributes:
• Enrolment is mandatory
• Large pools:
• Enhance investment opportunities
• Lower costs
• Fewer investment choices
• Annuitization
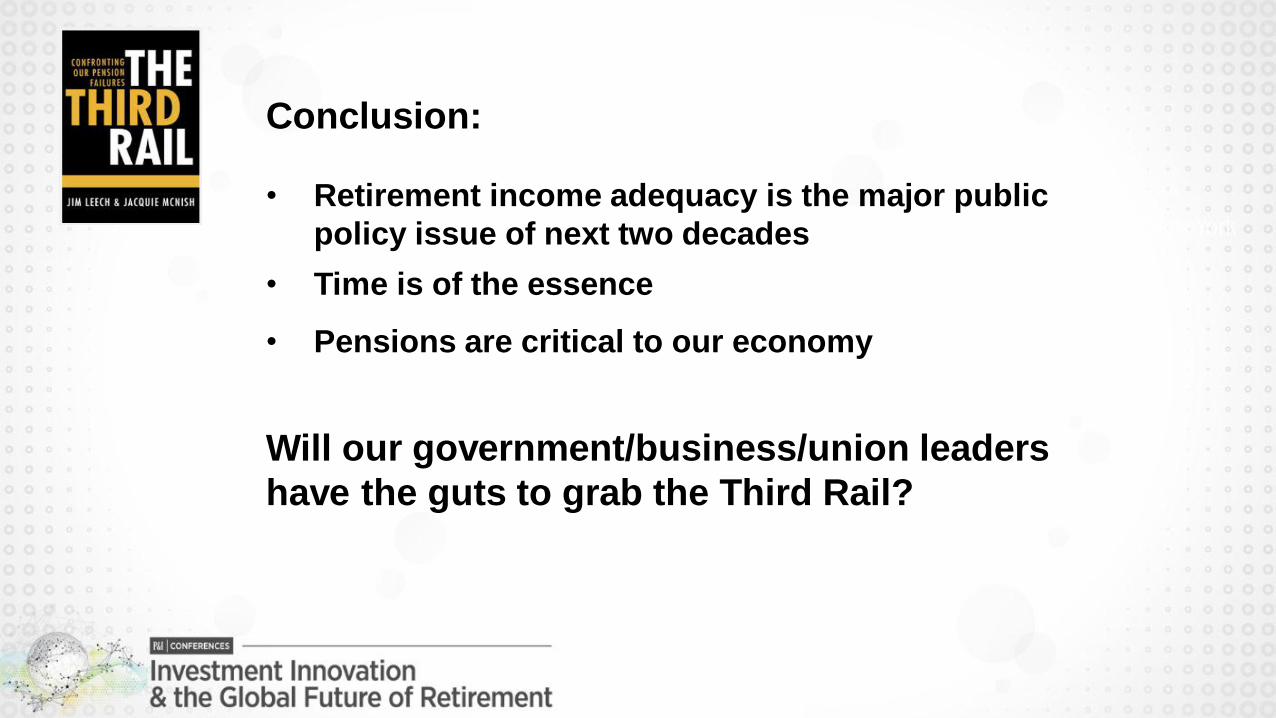
Conclusion:
• Retirement income adequacy is the major public
policy issue of next two decades
• Time is of the essence
• Pensions are critical to our economy
Will our government/business/union leaders
have the guts to grab the Third Rail?

Ole Settergren, Director Analysis,
Swedish Pensions Agency
ROUND TABLE DISCUSSION: The Endgame – Retiring with Dignity
15 Min Case Study: Sweden

35May 30, 2014
Swedish pensions provision
• Pillar 0 – basic income protection by Guaranteed pension, Housing allowance
(and tax deductions and various forms of assistance in kind or reduced prices)
• Pillar 1 – an earnings related public pension “DC” style: one scheme pay-as-you-
go (with buffer fund), one fully funded
• Pillar 2 – quasi mandatory occupational pension plans (4 large – private blue
collar, private white collar, government, municipalities & regions
• Pillar 3 private pensions (tax favored until 2014, abolished from 2015.)
Premium in %
of wage
Tax financed
17,21 % to ceiling
Ap. 4,5 % to ceiling
Ap. 30 % from ceiling

36May 30, 2014
Pillar flows and stocks in % of total Swedish wage sum*
Premiums Funded assets Pensions paid
Public (0-pillar) 0 0 3
Public earnings-related (1 pillar) 18 100 16
Occupational (2 pillar) 10 122 5
Private (3 pillar) 1 28 1
Total 28 251 26
*In 2012 wage sum was 1467 billions SEK

37May 30, 2014
Strategy 1 – High, costly, forced savings for future pension

38May 30, 2014
Relative importance of pillars in Swedish pension provision, % of total
Premiums Funded assets Pensions paid
Public (0-pillar) 0 0 10
Public earnings-related (1 pillar) 62 40 63
Occupational (2 pillar) 34 49 21
Private (3 pillar) 4 11 5
Total 100 100 100

39May 30, 2014
Strategy 2 – mix, or mess of all “strategies”Important tax financed zero pillar – quite cheap (?, 3 % of wage sum) for tax payers due to massive forced
savings and quasi mandatory occupational pensions.
DB – under replacement by DC - in Sweden we claim this to be true also for the PAY-AS-YOU-Go
financed major part
Major pension provision will always be PAY-AS-YOU-GO …
OECD recommends a pluralistic supply of pensions, public, occupational, private. I agree.
As a result pensions will remain “messy”. While most of us only receive salary from one employer at a time
we are saving to future pension, and receiving pensions, from several pension providers.
The “solution” is – holistic pension information … more on that soon
40May 30, 2014
Some arguments for life long forced savings for retirement income
• People in general are irrational, or myopic, or have an “inexplicable” high discount rate for future
income relative to income now
• It reduce “free riding” by those who would not save if they are free to decide (given that there exists
social ambitions for minimum standard )
• Large compulsory plans reduces administrative costs
• Political economy – democracies tend to introduce earnings-related pay-as-you-go financed pension
plans
• To free work places from unproductive older workers in a socially acceptable way

Born
in year
Turns
65 in
Life expectancy at 65
(actual and projected)
Retirement age that
neutralizes the effect life
expectancy increase has on
replacement rate (in DC)
Expected time as retiree from
“neutral retirement age”
1930 1995 82 years, 5 months 65 years, 0 months 17 years, 5 months
1945 2010 84 years, 8 months 65 years, 6 month 19 years, 4 months
1955 2020 85 years, 9 months 67 years, 1 month 19 years, 3 months
1965 2030 86 years, 9 months 67 years, 9 months 19 years, 8 months
1975 2040 87 years, 8 months 68 years, 4 months 20 years
1995 2060 89 years, 2 months 69 years, 4 months 20 years, 1 month
Increase 6 years, 9 months 4 years, 4 months 2 year, 8 months
Strategy 3 – significant increased retirement age

Strategy 4 – increased transparencyMicro level – detailed, individual and
holistic pension information
Macro level – balance sheet for national PAY-AS-
YOU-GO scheme & automatic financial balance

Strategy 4 – increased transparencyMicro level – detailed, individual and
holistic pension information
Macro level – balance sheet for national PAY-AS-
YOU-GO scheme & automatic financial balance


