Business Review: (2017) 12(2):65-83 Original Paper Route optimization for the cement industry under the CPEC initiative Moez Munir · Rameez Khalid · Muhammad Latif Abstract The China-Pakistan Economic Corridor (CPEC) initiative envisages substantial infrastructure development in Pakistan. This study ascertains op- timal transportation routes for the cement industry under the CPEC program using a mixed integer linear programming model and discrete-event simulation using Witness simulation software. The solution of the mathematical model presents the best combination of cement manufacturing clusters, road inter- changes and ports to connect. Policy makers and practitioners can use the find- ings of this study to optimize logistics decisions under CPEC. Keywords China Pakistan Economic Corridor · Interchange location · Mixed- integer linear optimization · Discrete-event simulation · Witness modeling 1 Introduction The world has become a global village with the advent and advancement of technology. One of the earliest technologies was a road or a path or a route, more specifically ‘a trade route’. These road networks enhanced communica- tion and then rail, air and electronic channels were further developed. These advancements made living more comfortable but simultaneously busier. Pakistan, a developing country, will soon be listed in the fastest growing economies after the construction of advanced road network routes under the China-Pakistan Economic Corridor (CPEC) Finance (2016). The development of western, central and eastern routes is central to CPEC, i.e. from Gwadar (Pakistan) to Kashghar (China). The CPEC project, a part of One Belt One Road (OBOR) strategy of China, is considered a game changer for Pakistan Moez Munir Institute of Business Administration, University Road, Karachi-Pakistan Rameez Khalid Institute of Business Administration, University Road, Karachi-Pakistan E-mail: [email protected]Muhammad Latif School of Engineering, Manchester Metropolitan University, Manchester, UK
Transcript
Business Review: (2017) 12(2):65-83Original Paper
Route optimization for the cement industry underthe CPEC initiative
Moez Munir · Rameez Khalid ·Muhammad Latif
Abstract The China-Pakistan Economic Corridor (CPEC) initiative envisagessubstantial infrastructure development in Pakistan. This study ascertains op-timal transportation routes for the cement industry under the CPEC programusing a mixed integer linear programming model and discrete-event simulationusing Witness simulation software. The solution of the mathematical modelpresents the best combination of cement manufacturing clusters, road inter-changes and ports to connect. Policy makers and practitioners can use the find-ings of this study to optimize logistics decisions under CPEC.
Keywords China Pakistan Economic Corridor · Interchange location · Mixed-integer linear optimization · Discrete-event simulation · Witness modeling
1 Introduction
The world has become a global village with the advent and advancement oftechnology. One of the earliest technologies was a road or a path or a route,more specifically ‘a trade route’. These road networks enhanced communica-tion and then rail, air and electronic channels were further developed. Theseadvancements made living more comfortable but simultaneously busier.
Pakistan, a developing country, will soon be listed in the fastest growingeconomies after the construction of advanced road network routes under theChina-Pakistan Economic Corridor (CPEC) Finance (2016). The developmentof western, central and eastern routes is central to CPEC, i.e. from Gwadar(Pakistan) to Kashghar (China). The CPEC project, a part of One Belt OneRoad (OBOR) strategy of China, is considered a game changer for Pakistan
Moez MunirInstitute of Business Administration, University Road, Karachi-Pakistan
Rameez KhalidInstitute of Business Administration, University Road, Karachi-PakistanE-mail: [email protected]
Muhammad LatifSchool of Engineering, Manchester Metropolitan University, Manchester, UK
M. Munir et al
and the region. It will not only result in the creation of infrastructure but willalso generate employment opportunities Abid and Ashfaq (2015). Highwaysare pivotal for Pakistan. They account for 96% of the freight transportationand only 4% is moved through railways Finance (2016). Ironically, Pakistanhas weak highway infrastructure. Highways account for only 3% of the entireroad network, freight journeys are 2-4 times longer than in Europe, and, 4-6% ofGDP is lost annually due to logistical inefficiencies Mohmand and Wang (2013).CPEC’s routes can fill this gap, however, projects of this scale and magnitudedo not come without challenges.
Emerging economies are characterized by insufficient use of quantitative ap-proaches in decision-making. Even if these approaches are used, foreign sup-port is usually sought Mudroch (1999). Furthermore, current literature Bengali(2015) Javaid (2016) Sial (2014) Abid and Ashfaq (2015) mostly discusses CPECat the macro-level and there is a dearth of sectoral research. Quantitative ap-proaches can therefore, help in strategic, tactical and operational level decisionmaking particularly under CPEC’s highway projects, for determining:(1) potential locations and capacities of highways (alignment Shahfahi andBagherian (2013), and number of lanes), interchanges, ports and Special Eco-nomic Zones (SEZs);(2) configuration of national logistics network;(3) forecasted locations and gravity of congestion, accidents Mitra (2016) Bo-lapragada et al (2016) and floods (or force majeure);(4) cheapest, quickest and shortest routes according to industrial sectors andzones;(5) the optimal mix of multi-modal transportations;(6) rationalizations of highway construction investments and returns;(7) traffic rules for better management in developing efficient and safer highwaysLi and Chow (2015), and(8) impact of decisions on costs of land acquisition, construction, Right of Way(ROW), tariff, toll Gonzalez Velarde et al (2015), transportation and fuel etc.
The objective of this study is to primarily present an application of selectedquantitative approaches to optimize CPEC’s routes. The secondary objectiveis to suggest better locations of interchanges on the proposed CPEC’s EasternRoute (CPEC-ER). This can further validate the locations of already suggestedinterchanges in the CPEC plan. Central and western routes are beyond thescope of this research.
These interchanges are proposed considering the case of the cement industry.The multi-methodological approach starts with the application of ‘mixed-integerlinear programming’ (MILP) followed by a ‘discrete-event simulation’ (DES).MILP is applied to CPEC considering it as a standard location-routing problem(LRP) Prodhon nad Prins (2014), however, this paper further creates a What-ifscenario for this problem using DES. Simulation is carried out on a powerfulsoftware package ‘Witness’, which is an industry standard for modeling andsimulating complex systems Lanner (2016).
Policy makers and practitioners can use the analytical findings of this studyin optimizing logistics and highway relevant decisions under CPEC. The nextsection will present the context of the study and discuss the facets of CPEC
66 Business Review: (2017) 12(2):65-83
Route optimization for the cement industry ...
and the cement industry relevant to this research. The subsequent section willdiscuss the research methodology. Next, we will present the mathematical andsimulation models applied to CPEC-ER. This will be followed by an analysis ofthe results, conclusion and proposed areas for future research.
2 Context
This section will first discuss the salient features of the CPEC project and thenpresent its various perceived benefits and challenges. It will end with a briefintroduction of Pakistan’s cement industry.
2.1 China Pakistan Economic Corridor (CPEC)
CPEC is a portfolio of USD 46 billion worth of projects that will transformPakistan into a central hub for trade (2016c). It includes projects relevant toenergy, road, and rail etc. Under CPEC, Gwadar Port (Balochistan, Pakistan)will be connected to Kashghar (Xinjiang, China) via three highway routes i.e.western, central and eastern. It will allow Pakistan to export locally producedgoods Market research provider (2017), and to increase the Foreign Direct In-vestment (FDI) flow up to USD 46 billion from USD 1.8 billion in 2014 Markeyand West (2016).
China will invest 170 billion yuan for the construction of the road network
Fig1: Map of National Highway Network (NHA, 2017)
Business Review: (2017) 12(2):65-83 67
M. Munir et al
of the CPEC routes (2017). The CPEC-ER is about 2,395 km long Finance(2016) which is the longest as compared to western and central routes Bengali(2015), and has 6 lanes, 3 on each side. In our study, as per one interviewee, it is2,769 km long. Figure 1 shows the suggested alignment of CPEC-ER (Khunjrabto Gwadar through Peshawar Karachi Motorway PKM). Table 1 highlights theadditional features of this route.
China will also construct 27 Special Economic Zones (SEZs) under CPEC.Three of these SEZ’s will be in Sindh, seven in Punjab and one over an area of3000 acres in Gwadar by the end of December, 2017 (2016b). China will alsobuild an oil refinery at Gwadar, which will transport 17 million barrels of oilper day (2016a) using these routes and pipelines Calabrese (2014).
Table 1: Travelling distances on the eastern alignment in km (NHA, 2017)
Since CPEC’s inception, numerous authors have discussed its benefits and chal-lenges for Pakistan, a summary of which is presented in table 2. A commontheme when considering benefits is infrastructure development, whereas, secu-rity related threats comes across as the major challenges. CPEC has the po-tential to boost the GDP of Pakistan at an annual growth rate of 2% Ramay(2016). Mostly, these studies discuss CPEC at a strategic-level and are qual-itative in nature. Moreover, majority of the studies have approached CPECfrom socio-economic and geo-political perspectives at the macro-level present-ing analyses similar to Strength-Weakness-Opportunity-Threat (SWOT) andPolitical-Economic-Social-Technological-Legal-Environmental (PESTLE).
Quantitative, tactical and operational level, and sectoral studies are rare.One reason for this is that CPEC is in its inception phase, and as such dataand issues are relatively unknown. Ahmed and Mustafa (2014) identified the
68 Business Review: (2017) 12(2):65-83
Route optimization for the cement industry ...
relationship between strategic level policy decisions and the associated opera-tional level impacts for the agriculture sector, however, conceptual frameworksare required to bridge this gap. Similarly, Zhang and Shi (2016) discussed themacro and micro-level risks and benefits of CPEC.
Studies similar to Sheu and Kundu (2017), who conducted a research forOBOR’s logistics network, can be benchmarked for CPEC. Our study presentsa case for reducing transportation costs for the cement sector using quantita-tive methods by gathering operational level details through interviews. Thisdata then becomes the input for mathematical and simulation models.
Table 2: CPEC’s benefits and challenges for Pakistan
Author(s) Benefits Challenges
Bengali(2015)
Western Route: cheapest toconstruct; jobs; national inte-gration
Eastern route: most expensiveto construct and can causepolitical instability betweenprovinces; western and centralroute: security threats
Javaid (2016) Energy and infrastructureprojects; Gwadar port devel-opment; FDI
Indian threat; security con-cerns
Sial (2014) Change in Govt. unlikelyto reverse development underCPEC; positive economic out-look
Political instability; economicconstraints; geostrategic dy-namics; security threats
Abid & Ash-faq (2015)
Economic development;overcoming energy crisis;infrastructure development;poverty eradication; prosper-ity
External and internal threats;political unrest; security; ad-ministrative issues
Zhiqin &Yang(2016)
Source of potential synergy Security, terrorism and politi-cal challenges; cultural differ-ences and practices
2.3 Cement industry of Pakistan
The cement industry is one of the oldest industries in Pakistan, as the rawmaterial limestone and clay is found in abundance in the country. Cement con-sumption is directly related to a nation’s economic growth. Pakistan is the5th largest exporter and 14th largest producer of cement, however, per capitaconsumption is low at 140 kg against the global average of 400 kg per capitaChhoangalia et al (2016). The annual installed cement production capacity ofPakistan is more than 45.6 million tons (APCMA, 2017c).
Business Review: (2017) 12(2):65-83 69
M. Munir et al
During the interviews, details of which are presented in the next section, oneof our interviewees indicated that cement’s local demand is going to rise due tovarious in-progress or up-coming developmental projects besides CPEC. This isin line with the rise in Public Sector Development Program’s (PSDP) budgetallocations by 29% in 2016 (2017).
For this study, the cement plants closer to CPEC-ER were identified forfurther analysis. Table 3 lists these 19 plants with their installed capacities.For this research, only cement (exported through sea) and coal (imported forheating purposes in this industry) are considered. Pakistan exports cement toAfghanistan, India, Sri Lanka, Africa and the Middle East, for which both in-land and sea transportation modes are utilized. However, cement exports are onthe decline, Pakistan’s total cement exports for 2016 are 13.5% of total installedcapacity.
This study considers the export capacity through sea, which is around 6.3%of the total installed capacity (APCMA, 2017b). According to one of our inter-views: cement in 50 kg bags is frequently loaded on 15,000 to 50,000 tons’ vesselsat the port. Cement is brought to the ports in cement bowsers with 50-55 tons’capacity. 75 tons’ bulkers are used for exporting loose cement, however, this isthe case with only one company in Pakistan, which also has loading infrastruc-ture at the port. Special weather tight vessels are required for the export ofloose bulk cement. This information becomes the input for our mathematicaland simulation models.
Coal is consumed at a rate of approximately 150 kg for producing one tonof cement, therefore large quantities are required to be imported. The cementindustry uses coal imported mostly from South Africa and Indonesia. Australianand Columbian coal is also used, however, its transportation costs are higher.Plants located in the north have to bear the costs of transporting coal from theports which are in the south, as well as transporting cement for export to theports. As per one interview, sometimes around 400 trucks worth of coal has tobe transported from the port all the way to a cement plant in the northern partof the country.
3 Research Methodology
Quantitative model based descriptive research was carried out using the em-pirical data. We conducted six unstructured interviews, as part of the primaryresearch, to collect data (operational details that were used as inputs for theemployed quantitative methods) and facts from relevant experts. All the inter-viewees gave their consent for participation.
Inclusion criteria for purposive sampling was that the interviewee should bea senior professional associated with one of the following sectors: cement, logis-tics, port or highway. The interviewees included two participants from differentcement companies, two government officials, one from highway management,one from port operations, and two from different logistics’ companies.
The employed multi-method optimization strategy Watson (2013) startedwith mathematical modeling and the creation of a simulation As-Is model. The
70 Business Review: (2017) 12(2):65-83
Route optimization for the cement industry ...
Table 3: Cement production capacity in tons of the selected 19 plants (APCMA, 2017a)
data collected from primary and secondary sources formed the input to themixed-integer linear programming (MILP) model and the simulation model de-veloped on Witness Simulation Software. A detailed and systematic modelingapproach was followed to gradually develop a sound and sensible model. Thisensures the model’s accuracy as we steadily built the required complexity intothe model Watson (2013).
The mathematical model was solved using the solver function of MS Excel,while, Witness simulation model was run to simulate a complete year. We veri-fied and validated the models by presenting these models to the representativesof a cement and a logistics company. These manifestations invoked a deeperdiscussion on the effectiveness and efficiency of the models. Output data, thedata of APCMA, are available, so simulation output was compared with theseas well, as suggested by Kleijnen (1999). A What-If or To-Be model was thendeveloped and simulated for improving the key outputs by proposing a newinterchange on the CPEC-ER.
4 CPEC’s route optimization model
The aim was to model the cement industry’s scenario and we started by iden-tifying the location of cement plants along the CPEC-ER. Two basic flows ofthe cement industry were recognized: (a) cement moving from plant ‘i’ to inter-
Business Review: (2017) 12(2):65-83 71
M. Munir et al
change ‘l’ and then to port ‘j’ for export, as shown in figure 2, and; (b) importedcoal moving from ports to plants, in the direction inverse of the cement flow.
l i j
Fig2: Schematic model of cement flow
4.1 Flow of cement
Bowsers, with cement from the cement plants, should travel on local roadsto the nearest (or cheapest to transport) interchange of CPEC-ER. Once onthe highway they head for the ports (Karachi and Gwadar). As the inventorymoves from the cement plant to the interchange and subsequently to the port,the model gives a sense of a multi-echelon model.
The MILP model, for the cement flow i.e. cement coming from plants toports, is defined as:
minimize: ∑.∑
distilfilKiyil +∑
.∑
distljfljxlj (1)
subject to: ∑xlj = Dj ;∀j ∈ J (2)
∑xlj ≤
∑Kiyil;∀l ∈ L (3)
∑Ki ≥
∑Dj (4)
72 Business Review: (2017) 12(2):65-83
Route optimization for the cement industry ...
∑yil = 1;∀i ∈ I (5)
yil ∈ 0, 1;∀i ∈ I, ∀l ∈ L (6)
xlj ≥ 0;∀l ∈ L,∀j ∈ J (7)
Ki, Dj ∈ integer;∀i ∈ I, ∀j ∈ J (8)
where i is the source (cement plant or cluster of cement plants); I is the set of nsources; l is the interchange on the CPEC-ER; L is the set of p interchanges; j isthe destination (port); J is the set of m destinations (set of two ports Karachiand Gwadar); xab is the number of trucks (cement bowser) travelling from a tob; distab = distance in kilometer from a to b; fab is the fuel cost per km; yilis a binary variable defining whether a cement bowser is travelling from sourcei to an interchange l or not; Ki is 6.3% of the total capacity of a source i intruckloads, and; Dj is the demand of a destination j.
The objective function in equation (1) has two parts and it minimizes costsas a classic optimization objective function. The first part defines the cost oftransporting cement from cement plants (or clusters) to the interchanges. Aplant will send all its capacity (Ki or ceiling value of a plant’s capacity intruckloads of cement) via only one interchange, the cheapest. The second partcalculates the cost of transporting cement from the interchanges to the port.
Equations (2) to (8) are the constraints of the model. The number of truckstravelling from interchanges to ports must cover the export demand at ports,as defined by equation (2). Constraint (3) enforces that the number of truckstravelling from a specific interchange l to all ports cannot exceed the cumulativecapacity of those plants that shipped to l. Constraint (4) further emphasizes thefact that total cumulative demand of ports cannot exceed total cumulative ca-pacity of the cement plants on the eastern route. Equation (5) and (6) enforcethat each plant can send all its truckload material to the port through onlyone interchange. The model ends with non-negativity and integer constraints.The size of the model is: four functional, one binary, one non-negativity andone integer constraint, with 35 decision variables (25 for each combination ofplant-interchange and 10 for each combination of interchange-port); as depictedby the mathematical derivative.
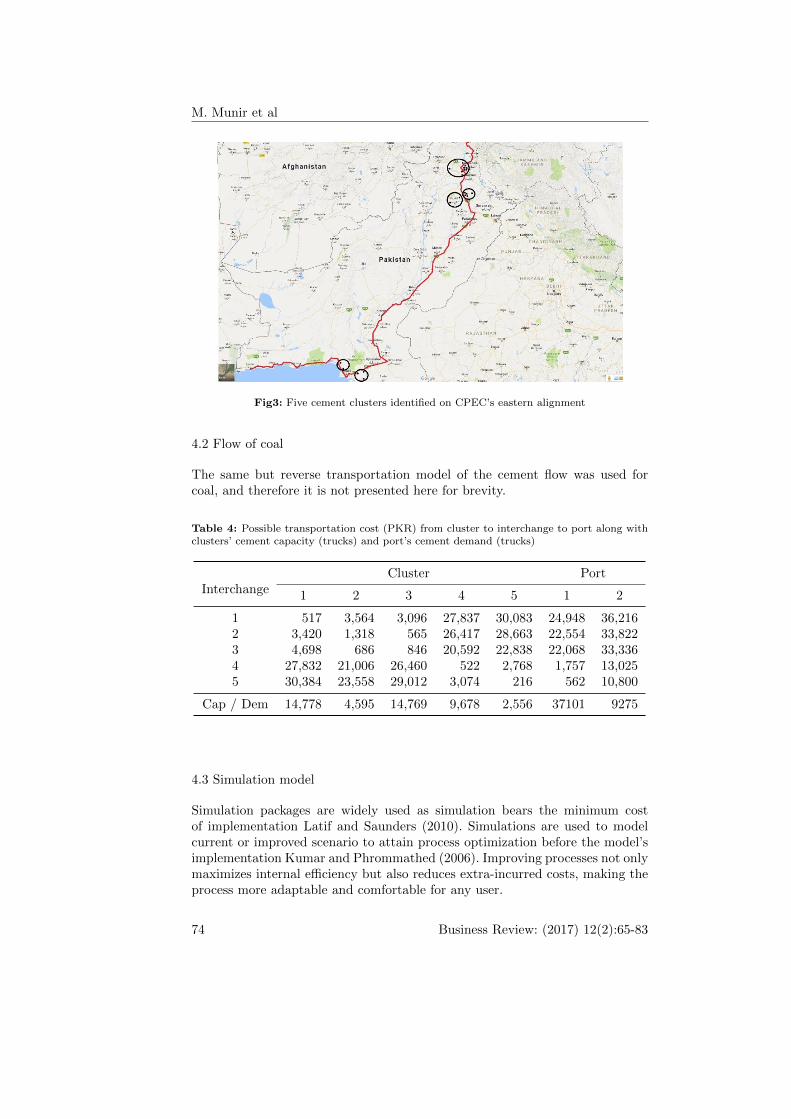
The cement plants on CPEC-ER are classified into five clusters as shown infigure 3. MS Excel produced the optimal solution i.e. the best combination ofcement plants and interchanges, to achieve minimum fuel costs. Possible dataof transportation costs (PKR), clusters’ cement production capacity (trucks)and ports’ demand (trucks) are shown in table 4. Comparing this table with thesolution in table 5, we observe that the model builds an optimal trade-off be-tween transportation costs from clusters to interchanges and from interchangesto ports. The cost of this optimal solution, in table 5 for cement bowsers, is PKR945.22 million. Interchange-2 was not found attractive for any cement cluster.
Business Review: (2017) 12(2):65-83 73
M. Munir et al
Fig3: Five cement clusters identified on CPEC’s eastern alignment
4.2 Flow of coal
The same but reverse transportation model of the cement flow was used forcoal, and therefore it is not presented here for brevity.
Table 4: Possible transportation cost (PKR) from cluster to interchange to port along withclusters’ cement capacity (trucks) and port’s cement demand (trucks)
Cap / Dem 14,778 4,595 14,769 9,678 2,556 37101 9275
4.3 Simulation model
Simulation packages are widely used as simulation bears the minimum costof implementation Latif and Saunders (2010). Simulations are used to modelcurrent or improved scenario to attain process optimization before the model’simplementation Kumar and Phrommathed (2006). Improving processes not onlymaximizes internal efficiency but also reduces extra-incurred costs, making theprocess more adaptable and comfortable for any user.
74 Business Review: (2017) 12(2):65-83
Route optimization for the cement industry ...
Table 5: Routing of cement trucks from clusters to interchange to port
The simulation model was designed on Witness simulation software which hasthe ability to model complex processes and operational tasks Lanner (2016). Thesimulation model reflects the logistics operations as discussed previously underthe mathematical model; however, it only focuses on the export and import viaKarachi, as Gwadar port is not currently catering to any cement exports or coalimports.
Following figure 3, average distance was computed (using (Google, n.d.))from each cluster to its nearest interchange, as shown in table 6. The route’salignment shown in figure 3 is indicative and alternatively the exact alignmenthinted in figure 1 can be used in subsequent modeling.
4.3.2 Aims of the model
The purpose of this model is to gauge the impact of an interchange’s locationon CPEC-ER, on the transportation costs borne by the cement industry. Forinstance, what impact will the location of a new interchange have on the dis-tances travelled and eventually the fuel costs? Such a model has direct utilityfor national highway management authorities. First hand data regarding aver-age travelling times, average fuel consumption, number of trucks needed, specificcoal demands and per ton transportation costs of company-owned or third-partylogistics, were collected through interviews.
Business Review: (2017) 12(2):65-83 75
M. Munir et al
Table
6:
Dis
tan
cefr
om
clu
ster
sto
the
nea
rest
inte
rch
an
ge
Clu
ster
sN
am
eof
cem
ent
pla
nt
Inte
rch
an
ge
Dis
t(k
m)
Avg
Clu
ster
1
Ask
ari
Cem
ent
Niz
am
pu
r
Jan
gB
hata
r
75.2
28.7
Ask
ari
Cem
ent
Lim
ited
Wah
12.2
Bes
tway
Cem
ent
Lim
ited
Hatt
ar
37.8
Bes
tway
Faro
oqia
Cem
ent
Lim
ited
Hatt
ar
21.2
Dew
anH
att
ar
Cem
ent
Lim
ited
Hatt
ar
24.9
Fec
toC
emen
tL
imit
edS
an
gja
ni
21.1
Fau
jiC
emen
tC
om
pany
Lim
ited
Fate
hJan
g8.5
Clu
ster
2F
lyin
gC
emen
tL
imit
edL
illa
Lil
lah
29
52
Pio
nee
rC
emen
tL
imit
edK
hu
shab
75
Clu
ster
3
Bes
tway
Cem
ent
Lim
ited
Ch
akw
al
Kall
ar
Kah
ar
22.3
31.4
Bes
tway
PakC
emC
om
pany
Lim
ited
Ch
akw
al
10.3
Dan
dot
Cem
ent
Lim
ited
Jeh
lum
48.3
D.G
.Kh
an
Cem
ent
Lim
ited
Ch
akw
al
9.8
Gh
arib
Wal
Cem
ent
Lim
ited
Jeh
lum
66.2
Clu
ster
4
Lu
cky
Cem
ent
Lim
ited
Indu
sH
ighw
ay
Noori
ab
ad
1
29
Dew
anH
att
ar
Cem
ent
Lim
ited
Dh
ab
eji
30
Pow
erC
emen
tL
imit
edN
oori
ab
ad
1T
hat
taC
emen
tL
imit
edT
hatt
a84
Clu
ster
5A
ttock
Cem
ent
Pakis
tan
Hu
bC
how
ki
Hu
b11
12
76 Business Review: (2017) 12(2):65-83
Route optimization for the cement industry ...
4.3.3 Modelling the system
Witness model is built using basic modeling elements. Details of the elementsused are:(1) Entity: Entities are elements that flow in a simulation model. Cementbowsers and coal trucks are entities in our model.(2) Activity: It processes the entities flowing through it, i.e. it will perform someoperations as desired. In this model interchanges and ports are activities.(3) Paths: It shows the entity’s flow and makes the model more interactive andrealistic. Here the path is the CPEC-ER.(4) Variable: It displays the data available in the model. Variables can be realor integer.For developing a visual interactive system (VIS) in Witness, following elementsare used in the basic model:(1) Track: CPEC-ER track is modelled using path. Multiple paths represent thetracks between interchanges and this sequence develops the whole alignment.Cement bowsers or coal trucks travel along a path following speed-varying trian-gular distribution that has defined maximum and minimum speeds. This makesthe model stochastic, representing the dynamic nature of the problem at hand.(2) Coal trucks and cement bowsers: Represented by an entity. The entity iscreated as per the cement or coal demand for a particular cement plant or portrespectively.(3) Total distance travelled: Calculated as each cement bowser /coal truckreaches destination.(4) Fuel cost: Calculated as each cement bowser or coal truck reaches its desti-nation. Average fuel consumption is four km per litre.
4.3.4 As-Is and What-If scenarios
Subsequently, an As-Is Model was developed and then a What-If or To-Be sce-nario was created and compared with the As-Is model. The simulation was madeto run for one year to fulfill the complete annual demand and supply of cementand coal.
The As-Is scenario, focused on only seven interchanges: Hub, Nooriabad, Lil-lah, Kallar Kahar, Jang Bhatar, Khunjrab Pass and Kashghar. For the What-Ifscenario, another interchange Dhoki Punnun is added to answer: ‘What-If weadd this new interchange?’ This interchange was proposed because it has a loweraverage distance from cement cluster 1 than Jang Bhatar, as shown in table 7.
The new proposed interchange improved the outputs of the model. Figure 4and 5 show the results of the simulation. The What-If scenario was tested withonly one new interchange, however, more scenarios and more industries can beadded to bring more complexity into the model.
5 Results and discussion
The results of the As-Is scenario are shown in tables 8 and 9. Considering thenumber of trucks that entered and shipped, the transportation cost for the whole
Business Review: (2017) 12(2):65-83 77
M. Munir et al
Table 7: Distance of the proposed interchange
Plant Cluster Name of cement plant Proposed inter-change
Dist(km)
Avg
1
Cluster 1
Askari Cement Nizampur 86
27.8
2 Askari Cement LimitedWah
18.1
3 Bestway Cement LimitedHattar
Dhoki Pannun 30
4 Bestway Farooqia CementLimited Hattar
(33.69, 72.74) 18.5
5 Dewan Hattar CementLimited Hattar
22.2
6 Fecto Cement LimitedSangjani
16.1
7 Fauji Cement CompanyLimited Fateh Jang
3.4
Fig4: CPEC-ER (As-Is) Witness Simulation Model: all values are for a year
year, of coal trucks and cement bowsers is PKR 1053.49 million with travelleddistance of 58.53 million km (see figure 4). Furthermore, it can be seen thatthe longest average time (1.38 days) is taken by those cement bowsers that aresouth bound (i.e. coming from cluster-1) and the lowest (0.07 days or 1.7 hours)is taken by those coming from the port’s neighboring city of Hub.
Table 9 depicts that transportation due to cement export makes the trackbetween Nooriabad and Lillah interchanges to be the busiest track on the easternroute, as it was 95.42% busy. On the other hand, the track between Hub andKarachi was the least busy as Hub has lesser number of plants and it is closestto the port.
Same modeling procedure was repeated by adding an interchange DhokiPunnun in the What-If scenario. This change reduced the average distance, asthis interchange is closer to cluster 1 than the previous interchange. The results
78 Business Review: (2017) 12(2):65-83
Route optimization for the cement industry ...
Fig5: CPEC-ER (What-If or To-Be) Witness Simulation Model: all values for a year
of this scenario are presented in tables 10 and 11.For the proposed interchange in this What-If or To-Be scenario, the total
transportation cost comes down to PKR 1051.02 million as shown in figure 5.This minor change brought savings in cement industry’s transportation costs tothe tune of almost PKR 2.5 million.
On average, all the tracks in the As-Is analysis were busy 69.5% of the time(see table 7), whereas, in the What-If analysis they were busy 70.1% of the time(see table 9). This rise is because trucks now access the highway from a closerinterchange and thus stay longer on the highway as compared to the previousmodel. This further increases the utilization of the highway. In the long run,a more complex model can be developed for bringing significant satisficing sothat the inherent uncertainty in supply chain decisions can be minimized.
Stimulating discussions took place during the six interviews. The recurring find-ings were:(1) Non existent use of quantitative approaches in decision making in Pakistan;(2) Cement companies are not completely satisfied with the locations of theproposed interchanges;(3) Sufficient and accurate congestion data are not available;(4) Scarce quantitative research discussing the positive (constructive) or neg-ative (cannibalizing) effects, on the Gwadar Port, of other developments inPakistan;(5) Land acquisition and construction of interchanges is easier to do in oneprovince than others;(6) In developing countries, it is worthwhile to keep various non-critical functions(such as transportation) in-house as these usually decrease costs and increasecompetitive advantage;(7) Land costs decline where highways are built and rise where interchanges arebuilt;(8) There is no eastern route, rather there is an eastern alignment that usesPKM.
6 Conclusion and future research
The objective of this study was to present an application of the quantita-tive multi-method approach for optimizing China-Pakistan Economic Corridor’s(CPEC) eastern route (Khunjrab to Gwadar through Peshawar to Karachi Mo-torway) by proposing better choice and location of interchanges. It can further
80 Business Review: (2017) 12(2):65-83
Route optimization for the cement industry ...
validate the already suggested interchanges (in the CPEC plan). The cementindustry was selected for building the case study.
For this purpose, we developed a mixed-integer linear programming (MILP)model, followed by discrete-event simulation. Data was gathered from secondarysources along with six interviews. The mathematical model was tested in MSExcel, which suggested the optimal combination of clusters, interchanges andports. The As-Is model was then developed on Witness Simulation Softwareand once it was validated, a What-If or To-Be model was created. The What-Ifmodel showed improvements in the outputs (distance travelled and fuel costs)when one new interchange was proposed. However, further design of a compli-cated model with multiple inputs is necessary before the implementation of theWhat-If scenario.
Further areas of research include developing more What-If scenarios on Wit-ness, bringing the local consumption of cement and clinker into the scope of themodel as opposed to using only exported cement, incorporating more inputsand outputs of the cement industry, and, taking applicable taxes, tariffs andtolls into account. This study can be extended by collecting data for industriesother than cement to develop a more complex model. One can test models withother objective functions, such as minimizing travelling time, third party (3PL)or fourth party logistics’ (4PL) costs, accidents and congestion.
References
2016a. Building the Impossible. Shanghai Business Review. February - March2016 ed.2016b. Gwadar to get first SEZ under CPEC. Dawn, January 28, 2016.2016c. Pak’s strategic Gwadar port opens USD 46-billion China-Pakistan Eco-nomic Corridor. Z-News, November 13, 2016.2017. China to build highway network for improved links with Pakistan. TheExpress Tribune, February 7, 2017.2017. Budgeted PSDP Allocation Trend [Online]. Available: http://par.com.pk/news/budgeted-psdp-allocation-trend [Accessed January 2017].Abid, M. & Ashfaq, A. 2015. CPEC: Challenges and opportunities for Pakistan.Journal of Pakistan Vision, 16, 142-169.Ahmed, R. & Mustafa, U. 2016. Impact of CPEC Projects on Agriculture Sectorof Pakistan: Infrastructure and Agricultural Output Linkages. In: (PSDE), T.P. S. O. D. E. (ed.) 32nd Annual General Meeting and Conference. Islamabad,Pakistan.APCMA. 2017a. Historical Analysis of Cement Production Capacity & Despatches(Operational Units Data) [Online]. Available: http : //www.apcma.com/datahistory.html [Accessed January 2017].APCMA. 2017b. Monthly Analysis (Local and Export Despatches) [Online].Available: http : //www.apcma.com/datamonthly1617.html [Accessed January,2017].APCMA. 2017c. Statement of Installed Production Capacity [Online]. Avail-able: http : //www.apcma.com/dataproductioncapacity.html [Accessed Jan-
Business Review: (2017) 12(2):65-83 81
M. Munir et al
uary 2017].Bengali, K. 2015. China Pakistan Economic Corridor? The Route Controversy.Chief Minister’s Policy Reform Unit, Government of Balochistan.Bollapragada, R., Poduval, S., Bingi S, C. & Brahmbhatt, B. 2016. SolvingTraffic Problems in the State of Kerala, India: Forecasting, Regression and Sim-ulation Models. Vikalpa, 41, 325-343.Calabrese, J. 2014. Balancing on ’the Fulcrum of Asia’: China’s Pakistan Strat-egy. Indian Journal of Asian Affairs, 27/28, 1-20.Chhoangalia, T. I., Masood, M. & Hussain, L. 2016. Cement Industry. JCR-VISSector Update.Finance, M. O. 2016. Transportation and Communication. Pakistan EconomicSurvey 2015-16.Gonzalez Velarde, J. L., Camacho-Vallejo, J.-F. & Pinto Serrano, G. 2015. AScatter Search Algorithm for Solving a Bilevel Optimization Model for Deter-mining Highway Tolls. Computacin y Sistemas, 19, 05-16.Google. n.d. Google Maps [Online]. Available: https://www.google.com/maps[Accessed January 10, 2017].Javaid, U. 2016. Assessing CPEC: Potential Threats and Prospects. Journal ofthe Research Society of Pakistan, 53.Kleijnen, J. P. Validation of models: statistical techniques and data availability.Proceedings of the 31st conference on Winter simulation: Simulation—a bridgeto the future-Volume 1, 1999. ACM, 647-654.Kumar, S. & Phrommathed, P. 2006. Improving a manufacturing process bymapping and simulation of critical operations. Journal of Manufacturing Tech-nology Management, 17, 104-132.Lanner, T. G. 2016. Witness [Online]. Available: www.lanner.com.Latif, M. & Saunders, C. 2010. A Traditional Logistics Problem. InternationalJournal of Engineering, 2, 161-170.Li, Y.& Chow, A. H. 2015. Optimisation of motorway operations via ramp me-tering and variable speed limits. Transportation planning and technology, 38,94-110.Market Research Provider, E. I. 2017. Pakistan: Country ProfileMarkey, S. D. & West, J. 2016. Behind China’s Gambit in Pakistan. Council onForeign Relations.Mitra, S. 2016. Analysis of Truck Accidents Using Structural Equation Models.Transportation Journal, 55, 382-399.Mohmand, Y. T. & Wang, A. 2013. Weighted complex network analysis of Pak-istan highways. Discrete Dynamics in Nature and Society, 2013.Mudroch, A. 1999. Planning and management of lakes and reservoirs, an inte-grated approach to Eutrophication. Shiga: UNEP International EnvironmentalTechnology Centre.NHA. 2017. Map of National Highway Network [Online]. Available: http://nha.gov.pk/wp-content/themes/nha/images/map-full.jpg [Accessed January 2017].Prodhon, C. & Prins, C. 2014. A survey of recent research on location-routingproblems. European Journal of Operational Research, 238, 1-1Ramay, S. A. 2016. China Pakistan Economic Corridor: A Chinese Dream BeingMaterialized Through Pakistan.
82 Business Review: (2017) 12(2):65-83
Route optimization for the cement industry ...
Shafahi, Y. & Bagherian, M. 2013. A customized particle swarm method tosolve highway alignment optimization problem. Computer Aided Civil and In-frastructure Engineering, 28, 52-67.Sheu, J. B. & Kundu, T. 2017. Forecasting time-varying logistics distributionflows in the One Belt-One Road strategic context. Transportation Research PartE: Logistics and Transportation Review.Sial, S. 2014. The China-Pakistan Economic Corridor: an assessment of poten-tial threats and constraints. Conflict and Peace Studies, 6, 24.Watson, M., Lewis, S., Cacioppi, P. & Jayaraman, J. 2013. Supply chain net-work design: applying optimization and analytics to the global supply chain,Pearson Education.Zhang, R. & Shi, G. 2016. Social impacts assessment for China-Pakistan Eco-nomic Corridor investment activities. IAIA-16. Aichi-Nagoya, Japan.Zhiqin, S. & Yang, L. 2016. The Benefits and Risks of the China-Pakistan Eco-nomic Corridor [Online]. Carnegie-Tsinghua Centre for Global Policy. Available:http://carnegietsinghua.org/2016/12/21/benefits-and-risksofchinapakistaneconomiccorridorpub-66507 [Accessed January 2017].