Rating Propensity Indicator: Methodology for Estimating Company Credit Ratings by Doruk Ilgaz. Ph.D. * Strategist Fixed Income Research FactSet Research Systems Dated: September 25 th , 2015 * Comments should be directed to Doruk Ilgaz. ([email protected]), Fixed Income Research, FactSet Research Systems Inc., 311 South Wacher Dr, 63 rd Floor, Chicago, IL 60606.
Transcript
Rating Propensity Indicator:
Methodology for Estimating Company Credit Ratings
by
Doruk Ilgaz. Ph.D.*
Strategist
Fixed Income Research
FactSet Research Systems
Dated: September 25th , 2015
* Comments should be directed to Doruk Ilgaz. ([email protected]), Fixed Income Research, FactSet Research Systems Inc., 311 South Wacher Dr, 63rd Floor, Chicago, IL 60606.
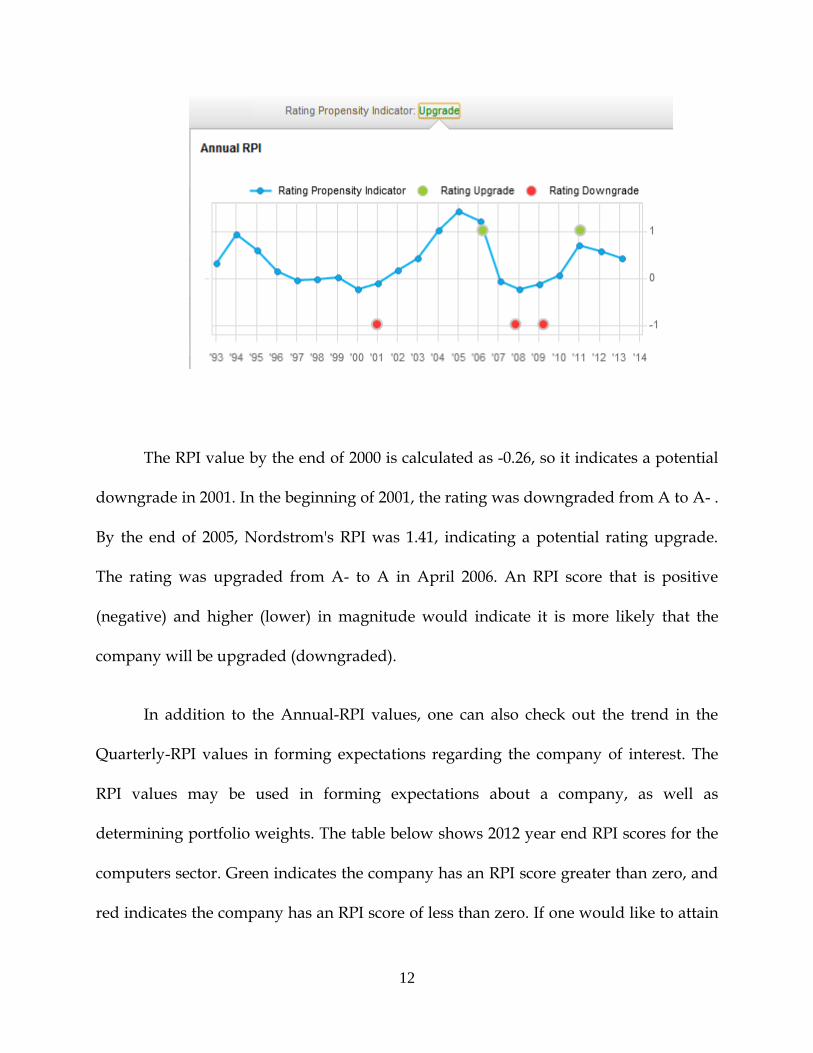
Rating changes have more implications than the mere distinction of investment or speculative grades in risk management. A portfolio manager should be able to make informed decisions and manage the risk exposure of his portfolio based on the anticipated changes. We developed Rating Propensity Indicator (RPI) to assist portfolio managers with this task. RPI, using fundamental company data, computes a probability score for US Industrial companies based on the likeliness of an upgrade/downgrade in case a rating change occurs in the following year. RPI sectorial rankings give supplemental information about the company’s standing among its peers.
3
I. Introduction
The 2008 financial crises have shown that there is a fairly continuous need for
credit institutions and other investors to carefully monitor the financial outlook and
credit-worthiness of industrial and financial enterprises. The importance of credit risk
assessment has relevance not only to asset prices in credit and debt markets, but also in
equity and in many types of derivative markets, particularly the credit default swap
market.
We developed Rating Propensity Indicator (RPI) in order to assess the changes in
credit risk of non-financial enterprises by developing up-to-date probability scoring for
the next period rating upgrade/downgrade of public companies. Using a sample period
of 1985-2014 US Industrial companies, involving quarterly and annual firm financial
statements, market prices and macroeconomic data, we have jointly estimated a
company manager’s choice of issuing debt/equity and rating agencies’ choice of credit
rating upgrade/downgrade. We have assigned companies to upgrade, downgrade, and
no rating change groups to compare and contrast the characteristics that yield to such
credit events. We have further dissected our sample to high-yield and investment grade
based on the company ratings after having observed that there are differences in
dynamics of the company leverage-rating relationship.
The model is modified then to work both with quarterly and annual data. The
quarterly RPI uses one year of history, whereas the annual RPI uses five year of history.
4
Both RPI scores are calculated on-the-fly, meaning a new RPI score for a company will
be available for the next period as soon as the company fiscal-quarter or fiscal-year end
data is available. We plot Annual-RPI scores to show the historical performance of the
company over a long-term. On the other hand for the Quarterly-RPI scores, we consider
the most recent twelve quarters and also regress over them to see whether there is a
consistent short-term trend in these numbers. When the Annual- and Quarterly-RPI
used together, they will give a good idea where the company is headed as far as rating
agents see it.
Section II explains the logic behind the model and our approach to the rating
estimations and introduces the model. Section III shows how the results can be used as
a risk management tool. Section IV looks at the performance statistics. Section V
concludes.
II. RPI Model
1. Theory
A company’s credit rating affects its cost of debt and subsequently its overall cost
of capital. A firm with a higher credit rating can issue lower-yield debt and vice versa.
Graham and Harvey (2001)1 find that maintaining financial flexibility and good credit
ratings are the two most important factors that firms consider when deciding to issue
1 Graham, John R. and Campbell R. Harvey (2001). “The Theory and Practice of Corporate Finance: Evidence from the Field.” Journal of Financial Economics 60: 187-243.
5
additional debt. They mention that 57.1% of CFOs consider credit ratings as a very
important indicator for them in how they choose the appropriate amount of debt for
their firms.
Consider a Reuters report about S&P’s (Standard & Poor’s Ratings Services)
decision of downgrading Barneys New York, a US based luxury retailer, from CCC to
CC in 2012. In the report, S&P mentions that “we assess the company’s financial risk
profile as ‘highly leveraged’ under our criteria because of its substantially leveraged
capital structure and very thin cash flow protection measures.” 2 Following this change
in credit rating, Barney’s management recruited a restructuring advisor to immediately
resolve its existing problem in capital structure. In a contrasting case, S&P has assigned
the Walt Disney Co.’s proposed issuance of 5- and 10-year debt an issue-level rating of
‘A’ in 2012 because of the company’s strong business risk profile and modest financial
risk which is supported by their conservative capital structure and good discretionary
cash flows. 3 According to Reuters, this credit rating is indeed good news for Walt
Disney to persistently raise sufficient debts with minimal costs. Both incidences provide
two critical messages for us. In the first case, a weak financial profile due to excessive
leverage results in a downgrade in credit rating by S&P, which in turn forces Barney to
restructure its existing capital structure. In the second case, healthy fundamentals
enable Walt Disney to achieve a high rating on issuance, which enables them to
2 See “Text-S&P cuts Barneys New York to CC” in Reuters dated February 9, 2012. http://www.reuters.com/article/2012/02/09/idUSWNA986020120209 3 See “Text-S&P rates Walt Disney debt A” in Reuters dated February 9, 2012. http://www.reuters.com/article/2012/02/09/idUSWNA983920120209
6
generate external funds more economically. Therefore, credit rating changes are not
fully exogenous. Furthermore, managers might act either immediately or slowly to
adjust their leverages following credit rating changes.
Conventional wisdom suggests that credit downgrades would cause the cost of
debt to rise as firms become riskier, and credit upgrades would imply an opposite
effect. If firms are conscious of the cost of debt and subsequent financial distress, they
should downwardly adjust leverage ratios following credit downgrades, and upwardly
adjust leverage ratios following upgrades. We could expect this behavior to be non-
linear and asymmetric: firms that have undergone credit downgrades could be more
likely to adjust their capital structures than firms that have undergone credit upgrades,
and firms that are close to speculative grade ratings as a result of credit downgrades
could be more wary of further credit downgrades, and are therefore more likely to take
preventive measures to avoid further downgrades that would effectively put them in
the speculative category.
In developing Rating Propensity Indicator, we model the leverage-rating relation
using a simultaneous equation system. This allows for the feedback between the
manager making the leverage decision and the rating agency making the credit rating
decision. We calibrate the model separately for speculative grade and investment grade
firms. This allows for the different dynamics of the leverage-rating relation in these
groups of firms.
2. Methodology
7
The literature models ratings based on some basic fundamental company data
such as leverage, profitability, liquidity, solvency, asset tangibility. New literature,
however, points out to the endogeneity of leverage in this type of modeling. The
endogeneity4 (in econometric terminology) occurs here as the other variables in the
model that are used to estimate ratings, also do affect leverage, and this suppresses the
relative impact of leverage on ratings (underestimation of leverage). There have been
studies that address the underleverage problem; firms seem systematically not to lever
up enough to take full advantage of the tax benefits of using debt. 5,6 However, when
you model appropriately to control for the endogeneity of leverage, this under-leverage
puzzle suddenly is not as much. Let’s take a look at the example below to illustrate this.
Example:
We will try to estimate a possible rating change for Goodyear Tire & Rubber Co.
in 2007 using a simplified model that is very similar to the ones used in the literature.
The table below shows the data from the FactSet Fundamentals database scaled by
coefficient estimates for the single and two-stage models. A two-stage model is one that
4 In a statistical model, an endogenous parameter or endogenous variable is one that is correlated with
the error term. Endogeneity can arise as a result of measurement error, auto-regression with auto-correlated errors, simultaneity (which is the case in our model) and omitted variables. For example, in a simple supply and demand model, when predicting the quantity demanded in equilibrium, the price is endogenous because producers change their price in response to demand and consumers change their demand in response to price. In this case, the price variable is said to have total endogeneity once the demand and supply curves are known. In contrast, a change in consumer tastes or preferences would be an exogenous change on the demand curve. 5 Molina, C. A. (2005). “Are Firms Underleveraged? An Examination of the Effect of Leverage on Default
Probabilities.” Journal of Finance 3: 1427-1459. 6 If you are interested about the underleverage puzzle you can check out the article “Underleverage: A Corporate Finance Puzzle and an Alternative Explanation” at the FactSet risk blog.
controls for endogeneity in the first stage, whereas, a single-stage model does not. The
second column from the right shows the cumulative value, and the right-most column
converts that value from probit model estimates to probability using z-table. 7 The
single-stage model estimates a 53% increase in the rating. The two-stage model
estimates a rating increase with a 66% probability. In 2007, Goodyear experienced a
rating increase to BB- from its prior level B+.
As seen in the first column of the table, the largest contribution comes from the
change in leverage in the two-stage model. If a firm’s leverage has more impact on a
firm’s rating change than previously estimated using single-stage models, this may
explain why firms shy away from increasing their leverage and prefer to stay “under-
leveraged”.
The above example shows that the endogeneity of leverage is a serious issue that
needs to be addressed in estimating ratings. In modeling the RPI, not only have we
7 Probit model is an econometric method that allows estimating an outcome with categorical values such as ratings. It allows for a different distribution than the classical ordinary least squares method. Since we are estimating ratings here, using a probit model is the appropriate way. The by Molina (2005) is an example where probit model is used in a two-stage setup to predict ratings.
9
addressed the above mentioned endogeneity, but have also considered the endogeneity
of rating in leverage estimation.
When we were building the RPI, we modeled rating and leverage changes jointly
(Simultaneous Equation System (SES)). This allows for feedback between the two
decision makers, the firm manager making the capital structure decision (Equation 1),
and the rating agency making the rating decision (Equation 2). The translation of this
econometric setup is that when a manager is making a decision regarding the
company’s capital structure (lever-up or lever-down), he is actually considering what
will happen to the company rating as a result; and vice versa when the rating agent is
assigning a rating to the company, he is considering the impact that the new rating will
have on the company’s capital structure. Both endogenous variables turned out to be
significant.
Let’s take a closer look at the RPI model set-up. The model to be estimated here
is a system of structural equations, where some equations contain endogenous variables
among the explanatory variables. The leverage equation (Equation 1) and the rating
equation (Equation 2) are the structural equations in the system. The dependent
variables are the left-hand-side variables, namely firm’s leverage change and firm’s
rating change, here. Both dependent variables are explicitly taken to be endogenous to
the system and are treated as correlated with the disturbances in the system’s equations.