Michael J. Verrilli and Lisa C. Martin Glenn Research Center, Cleveland, Ohio David N. Brewer U.S. Army Research Laboratory, Glenn Research Center, Cleveland, Ohio RQL Sector Rig Testing of SiC/SiC Combustor Liners NASA/TM—2002-211509 April 2002
Transcript
Michael J. Verrilli and Lisa C. MartinGlenn Research Center, Cleveland, Ohio
David N. BrewerU.S. Army Research Laboratory, Glenn Research Center, Cleveland, Ohio
RQL Sector Rig Testing of SiC/SiCCombustor Liners
NASA/TM—2002-211509
April 2002
The NASA STI Program Office . . . in Profile
Since its founding, NASA has been dedicated tothe advancement of aeronautics and spacescience. The NASA Scientific and TechnicalInformation (STI) Program Office plays a key partin helping NASA maintain this important role.
The NASA STI Program Office is operated byLangley Research Center, the Lead Center forNASA’s scientific and technical information. TheNASA STI Program Office provides access to theNASA STI Database, the largest collection ofaeronautical and space science STI in the world.The Program Office is also NASA’s institutionalmechanism for disseminating the results of itsresearch and development activities. These resultsare published by NASA in the NASA STI ReportSeries, which includes the following report types:
• TECHNICAL PUBLICATION. Reports ofcompleted research or a major significantphase of research that present the results ofNASA programs and include extensive dataor theoretical analysis. Includes compilationsof significant scientific and technical data andinformation deemed to be of continuingreference value. NASA’s counterpart of peer-reviewed formal professional papers buthas less stringent limitations on manuscriptlength and extent of graphic presentations.
• TECHNICAL MEMORANDUM. Scientificand technical findings that are preliminary orof specialized interest, e.g., quick releasereports, working papers, and bibliographiesthat contain minimal annotation. Does notcontain extensive analysis.
• CONTRACTOR REPORT. Scientific andtechnical findings by NASA-sponsoredcontractors and grantees.
• CONFERENCE PUBLICATION. Collectedpapers from scientific and technicalconferences, symposia, seminars, or othermeetings sponsored or cosponsored byNASA.
• SPECIAL PUBLICATION. Scientific,technical, or historical information fromNASA programs, projects, and missions,often concerned with subjects havingsubstantial public interest.
• TECHNICAL TRANSLATION. English-language translations of foreign scientificand technical material pertinent to NASA’smission.
Specialized services that complement the STIProgram Office’s diverse offerings includecreating custom thesauri, building customizeddata bases, organizing and publishing researchresults . . . even providing videos.
For more information about the NASA STIProgram Office, see the following:
• Access the NASA STI Program Home Pageat http://www.sti.nasa.gov
• Fax your question to the NASA AccessHelp Desk at 301–621–0134
• Telephone the NASA Access Help Desk at301–621–0390
• Write to: NASA Access Help Desk NASA Center for AeroSpace Information 7121 Standard Drive Hanover, MD 21076
Michael J. Verrilli and Lisa C. MartinGlenn Research Center, Cleveland, Ohio
David N. BrewerU.S. Army Research Laboratory, Glenn Research Center, Cleveland, Ohio
RQL Sector Rig Testing of SiC/SiCCombustor Liners
NASA/TM—2002-211509
April 2002
National Aeronautics andSpace Administration
Glenn Research Center
Available from
NASA Center for Aerospace Information7121 Standard DriveHanover, MD 21076
National Technical Information Service5285 Port Royal RoadSpringfield, VA 22100
Available electronically at http://gltrs.grc.nasa.gov/GLTRS
Trade names or manufacturers’ names are used in this report foridentification only. This usage does not constitute an officialendorsement, either expressed or implied, by the National
Aeronautics and Space Administration.
NASA/TM2002-211509 1
RQL SECTOR RIG TESTING OF SIC/SIC COMBUSTOR LINERS
Michael J. Verrilli and Lisa C. Martin National Aeronautics and Space Administration
Glenn Research Center Cleveland, Ohio 44135
David N. Brewer
U.S. Army Research Laboratory Glenn Research Center Cleveland, Ohio 44135
ABSTRACT Combustor liners, manufactured from silicon carbide fiber-reinforced silicon carbide, (SiC/SiC), were tested for 260 hrs using a simulated gas turbine engine cycle. This report documents the results of the last 56 hours of testing. Damage occurred in one of the six different components that make up the combustor liner set, the rich zone liner. Cracks in the rich zone liner initiated at the leading edge due to stresses resulting from the component attachment configuration. Thin film thermocouples and fiber optic pyrometers were used to measure the rich zone liner’s temperature and these results are reported. 1.0 INTRODUCTION A ceramic matrix composite, silicon carbide fiber-reinforced silicon carbide, (SiC/SiC) is being evaluated for use as a combustor liner material for aircraft gas turbine (refs. 1–2) and power generation turbine engines (refs. 3–8). The use of SiC/SiC composites as combustor liners can lead to more efficient engine operation and lower NOx emissions because of the higher use temperature of SiC/SiC compared to the state of the art superalloys currently in use. Data on the durability of SiC/SiC composites in the combustor environment is required to verify operational assumptions and validate design practices. To test SiC/SiC components in a combustion environment, the Rich-burn, Quick-quench, Lean-burn (RQL) sector rig was developed at NASA Glenn Research Center under the High Speed Research/Enabling Propulsion Materials (HSR/EPM) program. The purpose of the sector rig testing was to demonstrate the structural durability of the SiC/SiC liners in a combustion environment where stresses, temperatures, and pressures would as accurately as possible reflect the operating conditions found in a turbine engine. A HSR program goal of 200 hours of rig operation at aircraft combustor conditions was achieved (refs. 1–2). In the present study, 56 hours of additional testing of SiC/SiC combustor liners were conducted in the RQL sector rig. This effort focused on the evaluation of improvements to the sector rig in order to eliminate the damage in the rich zone liners observed during previous testing (ref. 1). It also served as a means to evaluate advanced techniques for measurement of the temperature of the SiC/SiC liners during combustion testing. The purpose of this report is
NASA/TM2002-211509 2
to document the results of this testing, with an emphasis on the performance of the rich zone combustor liners. 2.0 MATERIAL Sector components were manufactured by Honeywell Advanced Composites from a SiC/SiC composite developed under the EPM program. A slurry-cast, melt-infiltrated SiC matrix was reinforced with SylramicTM (Dow Corning, Midland, MI) SiC fibers. The fiber tows were woven into 5-harness satin weave cloth. Fiber tow spacings of 18 and 22 ends per inch were utilized to manufacture the parts, resulting in a nominal fiber volume fraction of 35 and 42%, respectively. Four batches of the EPM SiC/SiC material were used to manufacture over 120 parts. More details on the material can be found in reference 9. 3.0 RQL SECTOR RIG CONFIGURATION 3.1 Rig Description The RQL combustor rig contains two rich zone liner cans transitioning to a 60° sector lean burn zone. The rig was designed by Pratt & Whitney under the HSR program and was installed at NASA Glenn in 1998. Figure 1 is a schematic of the rig, along with images of the individual components. Six different SiC/SiC component geometries were designed and manufactured for the combustor liner. Table 1 contains a list of the number of parts required for a full liner set (ref. 1).
Figure 1 – Schematic of RQL sector rig and images of the SiC/SiC component geometries.
RQL Lean Zone Bulkhead Heatshield
RQL Lean Transition Zone Liners
LPP Lean Zone OD Liners
RQL Lean Zone Rig Sidewall
RQL Lean Zone ID Liners
RQL Rich Zone Liner
NASA/TM2002-211509 3
Table 1. – Summary of full SiC/SiC liner set for the sector rig.
Part Name Abbreviation Liner Set
Requirements Rich Zone Liner RZL 2 Lean Transition Liner LTL 12 Bulkhead Heatshield BHHS 1 center + 2 halves Lean Zone Inner Diameter Liner LZID 6 Lean Zone Outer Diameter Liner LZOD 3
Lean Zone Sidewall Sidewall 2
28
Air
Flow
RZLCans
LeanTransition
Zone
LeanZone
PiccoloProbe
PL
CR
Figure 2 – Top view of the RQL sector rig, showing the main components.
Figure 2 is a schematic of a top view of the RQL sector rig, showing the rig flow path and the main combustor sections. A fuel-rich mixture is ignited by the fuel/air nozzles and enters the rich zone liners. By-pass air is mixed with the burning fuel at the exit of the rich zone liner, resulting in a leaner fuel/air mixture at the entrance of the lean transition zone. Fuel-lean burning is supposed to occur in the lean zone. Gas analysis capability exists in the piccolo probe, which also simulates the presence of the first stage turbine vanes that are normally downstream of the combustor in an aircraft turbine engine.
NASA/TM2002-211509 4
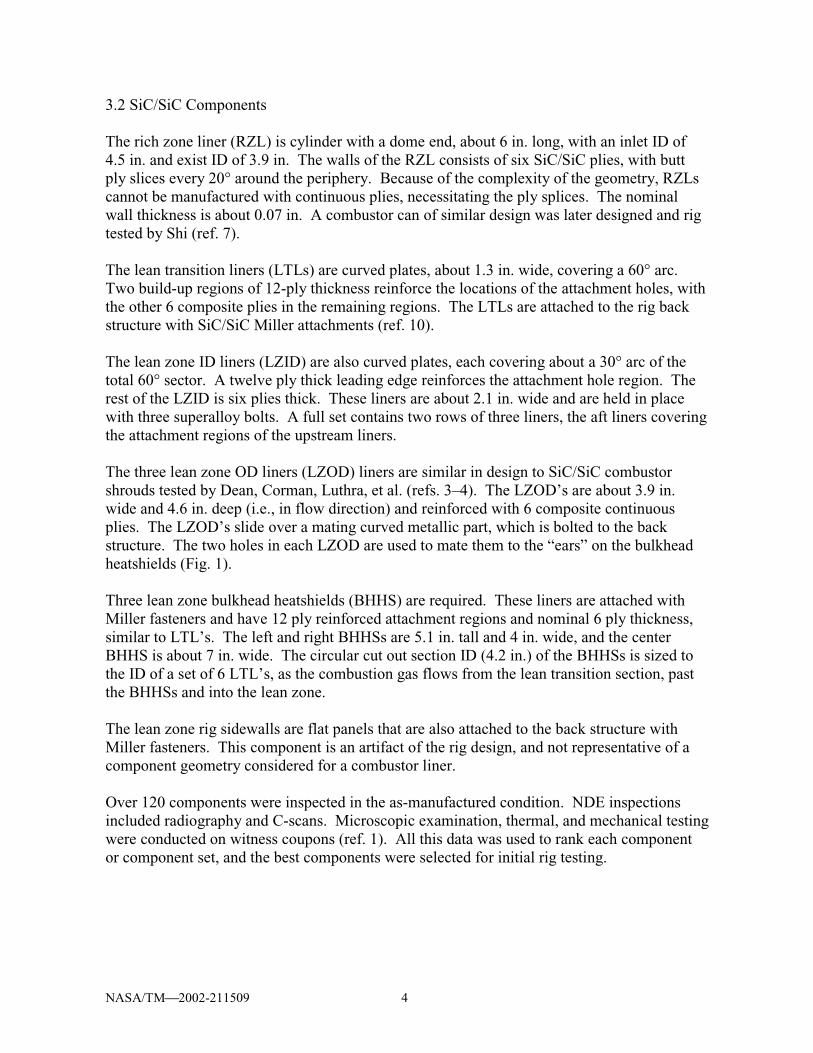
3.2 SiC/SiC Components The rich zone liner (RZL) is cylinder with a dome end, about 6 in. long, with an inlet ID of 4.5 in. and exist ID of 3.9 in. The walls of the RZL consists of six SiC/SiC plies, with butt ply slices every 20° around the periphery. Because of the complexity of the geometry, RZLs cannot be manufactured with continuous plies, necessitating the ply splices. The nominal wall thickness is about 0.07 in. A combustor can of similar design was later designed and rig tested by Shi (ref. 7). The lean transition liners (LTLs) are curved plates, about 1.3 in. wide, covering a 60° arc. Two build-up regions of 12-ply thickness reinforce the locations of the attachment holes, with the other 6 composite plies in the remaining regions. The LTLs are attached to the rig back structure with SiC/SiC Miller attachments (ref. 10). The lean zone ID liners (LZID) are also curved plates, each covering about a 30° arc of the total 60° sector. A twelve ply thick leading edge reinforces the attachment hole region. The rest of the LZID is six plies thick. These liners are about 2.1 in. wide and are held in place with three superalloy bolts. A full set contains two rows of three liners, the aft liners covering the attachment regions of the upstream liners. The three lean zone OD liners (LZOD) liners are similar in design to SiC/SiC combustor shrouds tested by Dean, Corman, Luthra, et al. (refs. 3–4). The LZOD’s are about 3.9 in. wide and 4.6 in. deep (i.e., in flow direction) and reinforced with 6 composite continuous plies. The LZOD’s slide over a mating curved metallic part, which is bolted to the back structure. The two holes in each LZOD are used to mate them to the “ears” on the bulkhead heatshields (Fig. 1). Three lean zone bulkhead heatshields (BHHS) are required. These liners are attached with Miller fasteners and have 12 ply reinforced attachment regions and nominal 6 ply thickness, similar to LTL’s. The left and right BHHSs are 5.1 in. tall and 4 in. wide, and the center BHHS is about 7 in. wide. The circular cut out section ID (4.2 in.) of the BHHSs is sized to the ID of a set of 6 LTL’s, as the combustion gas flows from the lean transition section, past the BHHSs and into the lean zone. The lean zone rig sidewalls are flat panels that are also attached to the back structure with Miller fasteners. This component is an artifact of the rig design, and not representative of a component geometry considered for a combustor liner. Over 120 components were inspected in the as-manufactured condition. NDE inspections included radiography and C-scans. Microscopic examination, thermal, and mechanical testing were conducted on witness coupons (ref. 1). All this data was used to rank each component or component set, and the best components were selected for initial rig testing.
NASA/TM2002-211509 5
4.0 INSTRUMENTATION 4.1 Fiber Optic Pyrometry As part of the sector rig design, Pratt & Whitney supplied a fiber optic pyrometry system to measure the SiC/SiC liner temperatures. Thirty-eight fiber optic sensors and signal conditioners were installed to obtain the temperature of each component type throughout the test cycle. The sensors detected the temperature on the cooled side of the liners. Testing prior to the current effort degraded these quartz fiber optics, resulting in only two operational channels. A new fiber optic was available and installed to measure the RZL liner temperature. The new fiber optic and an existing operation fiber optic were installed at a location 3.5 in. aft of the fuel/air nozzle for each of the two RZLs. 4.2 Thin Film Thermocouples Previous experience with the sector rig revealed that the component that is exposed to the highest temperature and has sustained the most damage is the RZL (refs. 1–2). This section is a description of the thin film thermocouples tested on rich zone liners, including installation and configuration. Two RZLs were each instrumented with two thin thermocouples located 180 degrees apart circumferentially near the trailing edge. The sensors were fabricated in a clean room to minimize possible contamination. A schematic diagram of the layered sensor is shown in Figure 3. The liners were heat-treated at 1200 °C for 50 hours to form a stable, adherent 2–3 µm thick layer of silicon dioxide on the surface. Because of its high resistivity and low reactivity, approximately 6 µm of aluminum oxide was deposited via electron-beam evaporation to form an electrically insulating layer. Type R (Pt/Pt-13Rh) thin film thermocouples were patterned on the alumina with stenciled metal masks. Approximately 5 µm thick films of platinum and platinum-13% rhodium were sputter deposited to form the thermocouple legs. The panels were heat treated at 1000 °C for 5 hours to anneal and stabilize the films. An additional layer of aluminum oxide was sputter-deposited over part of the thermocouples to provide protection from the test environment. However, parts of the thermocouple legs were left exposed to permit leadwire attachment to the films.
Figure 3 – Schematic of the thin film thermocouple layers.
SiC/SiC Rich Zone Liner SubstrateSiC/SiC Rich Zone Liner SubstrateSiC/SiC Rich Zone Liner Substrate
NASA/TM2002-211509 6
Wires were installed on the cylinders to complete the sensor system. Platinum-13% rhodium and platinum bare leadwires (125 µm diameter) were installed along the length of the cylinders with a bonding process that included applying a SiC-based cement and a plasma-sprayed rokide (alumina-based rod) bond coat and cover coat. This process is designed to protect the leadwires and improve durability. Smaller leadwires (75 µm diameter) were parallel gap welded to the thin films and attached to the bonded 125 µm diameter wires. Figure 4 shows the sensor system on a RZL surface. Sheathed extension cables (1.0 mm diameter) were attached to the 125 µm diameter bare wires and routed out of the test facility. 5.0 TEST FACILITY The Preheated Combustor and Materials Test Facility (PCMTF) in test cell CE-9 was used to conduct the RQL sector rig testing. The facility (Figure 5) has two flow paths. Side A was configured for the RQL sector rig testing.
Figure 4 – Photograph of a thin film thermocouple installed on a rich zone liner.
Figure 5 – CE-9 Preheated Combustor and Materials Test Facility.
Facility Capabilities:
Max. Flow Rate:15 lbs/sec.
Max. Inlet Air Temp.(T3):1100°F
Max. Pressure (P3):450 psig
NASA/TM2002-211509 7
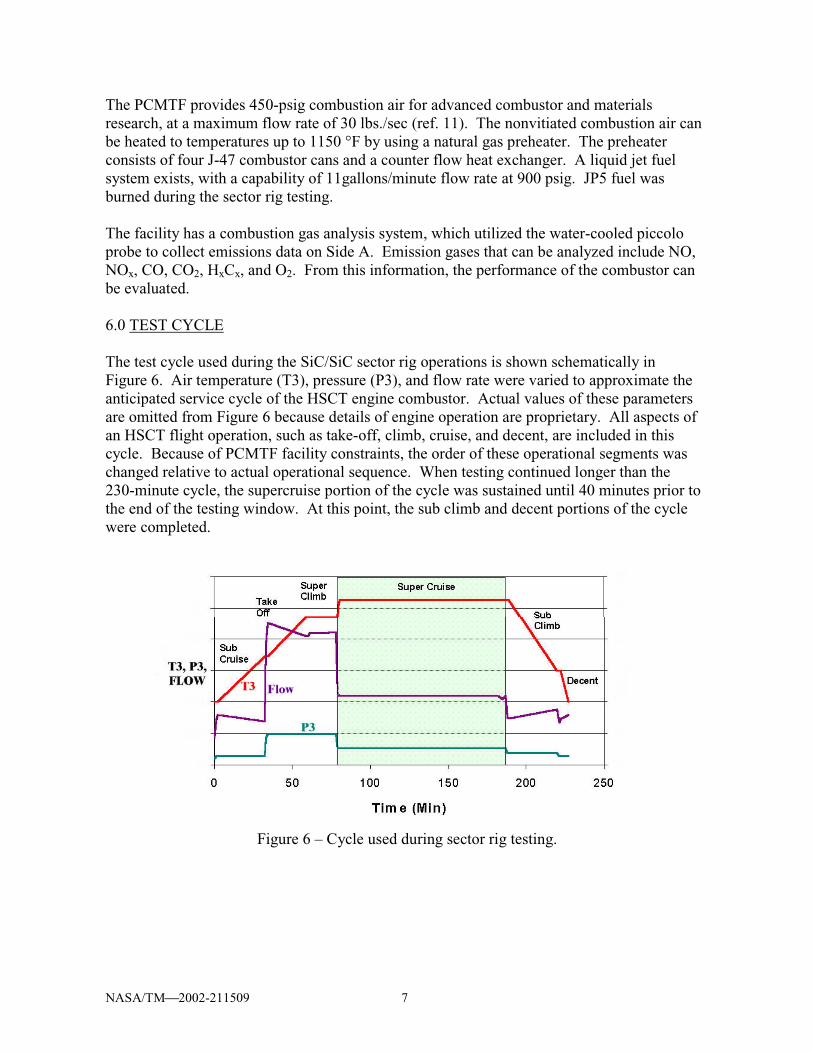
The PCMTF provides 450-psig combustion air for advanced combustor and materials research, at a maximum flow rate of 30 lbs./sec (ref. 11). The nonvitiated combustion air can be heated to temperatures up to 1150 °F by using a natural gas preheater. The preheater consists of four J-47 combustor cans and a counter flow heat exchanger. A liquid jet fuel system exists, with a capability of 11gallons/minute flow rate at 900 psig. JP5 fuel was burned during the sector rig testing. The facility has a combustion gas analysis system, which utilized the water-cooled piccolo probe to collect emissions data on Side A. Emission gases that can be analyzed include NO, NOx, CO, CO2, HxCx, and O2. From this information, the performance of the combustor can be evaluated. 6.0 TEST CYCLE The test cycle used during the SiC/SiC sector rig operations is shown schematically in Figure 6. Air temperature (T3), pressure (P3), and flow rate were varied to approximate the anticipated service cycle of the HSCT engine combustor. Actual values of these parameters are omitted from Figure 6 because details of engine operation are proprietary. All aspects of an HSCT flight operation, such as take-off, climb, cruise, and decent, are included in this cycle. Because of PCMTF facility constraints, the order of these operational segments was changed relative to actual operational sequence. When testing continued longer than the 230-minute cycle, the supercruise portion of the cycle was sustained until 40 minutes prior to the end of the testing window. At this point, the sub climb and decent portions of the cycle were completed.
Figure 6 – Cycle used during sector rig testing.
NASA/TM2002-211509 8
7.0 RESULTS 7.1 Liner Performance About 56 hours of testing was conducted during 6 days in September and October 2000. Thirty SiC/SiC components were tested, including 26 lean transition zone and lean zone liners that were exposed for the full 56 hours. Two RZLs were tested for 16 hours and were removed when significant damage was detected. The two replacement RZLs were tested for the remaining forty hours, until damage of one of these replacement RZLs resulted in completion of the testing. Details of this damage will be discussed below. Combined with the 205 hours of testing conducted in 1999, a total of 261 hours of SiC/SiC component testing was completed, as summarized in Table 2. Fifty-four SiC/SiC components were installed and exposed during the combined 261-hour period, including 9 lean zone and 3 lean transition zone liners that were tested for the entire duration. The failure and damage of the RZLs and LTL’s that occurred during the previous testing are discussed in ref. 1. The pre-planned post-test characterization of 11 liners that were removed after 115 hours of testing is given in ref. 2.
Table 2 – Summary of Liner Performance during the current study and previous efforts (refs. 1–2)
Total Test Duration (hrs) Notes on SiC/SiC Liners
14 Failure of two RZLs.
54 Loss of three lean transition liners due to fastener failure.
115 Planned removal of 11 lean transition and lean zone liners for post-test characterization and replacement of RZLs.
205
Removal of two lean transition liners due to a failed fastener and replacement of two RZLs with previously detected cracks. Initiation of the present study.
220 Removal of two RZLs due to detection of cracks.
261 Failure of one RZL and Completion of testing
7.2 Damage of the Rich Zone Liners Boroscope inspections were performed after every test day and were used to document the condition of all the SiC/SiC liners as well as rig components in the gas path. The only damage that was observed through this method occurred in the rich zone liners. Since two flow paths exist in the sector rig, a convention was adopted to identify the various SiC/SiC liners by labeling them either parking lot (PL) side (i.e., the side of the rig closest to the building parking lot) or control room (CR) side (Table 3).
NASA/TM2002-211509 9
Table 3 – Rich Zone Liners tested during the current study.
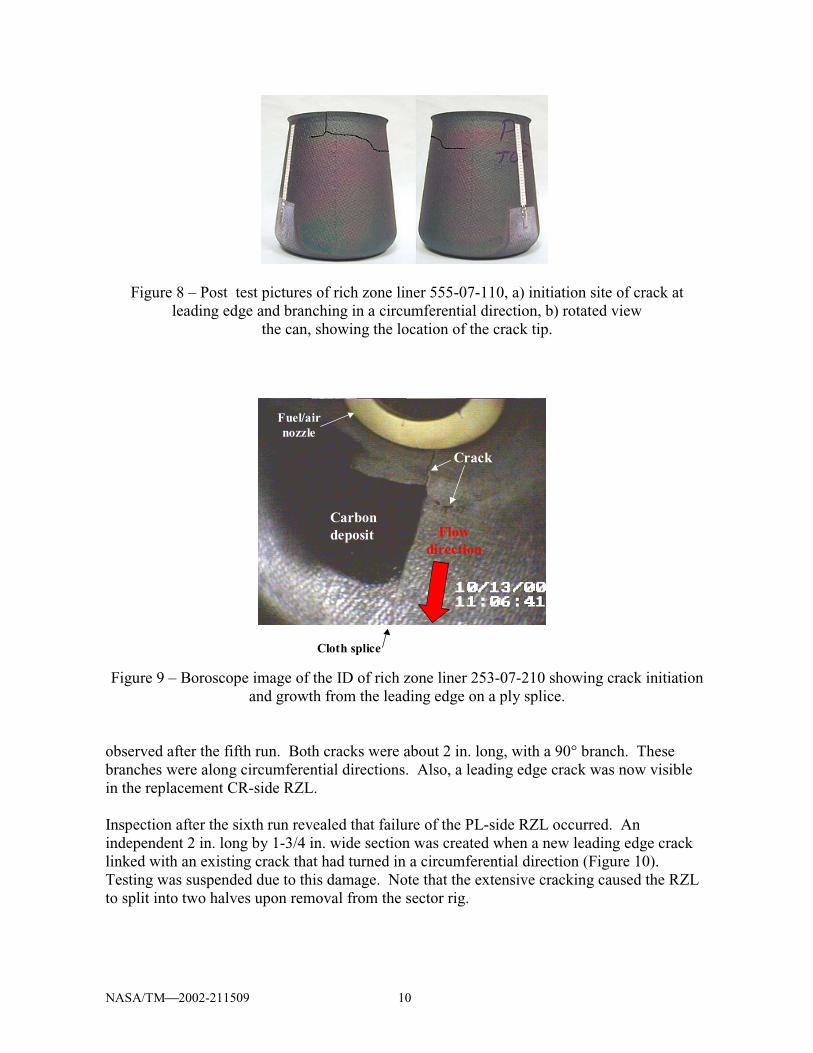
Cracking was found after the first test run of 7.5 hours in the CR side RZL (555-07-009). The crack initiated at the leading edge, grew about 2-3/4 in. along the flow direction, and bifurcated, turning 90° (i.e., in a circumferential direction). Another 90° crack branch existed about 1-3/4 in. from the leading edge (Figure 7). Propagation of these circumferential cracks was observed after the second test run of 8 hours. After the second test run, cracking that initiated at the leading edge was detected in the PL side RZL (555-07-010) as well. The crack was about 3/4 in. long, in a direction parallel to the flow direction, and it bifurcated. The circumferential portion of this crack spanned over 90° of the RZLs circumference, Figure 8. Relative displacement of the crack faces perpendicular to the flow direction was imaged with the boroscope. To avoid further damage and potential RZL failure during subsequent testing, both RZLs were removed and replaced with new ones. The replacement PL-side RZL (253-07-210) developed a leading edge crack after the third test run. Boroscope inspection after the fourth run imaged a second leading edge crack, 180° apart from the initial crack. The second crack initiated on a fiber cloth splice that was visible on the inner diameter of the RZL (Figure 9). Continued propagation of these two cracks was
Figure 7 – Post test picture of cracking in rich zone liner 555-07-009. Note the thin film thermocouple and wire leads.
NASA/TM2002-211509 10
Figure 8 – Post test pictures of rich zone liner 555-07-110, a) initiation site of crack at leading edge and branching in a circumferential direction, b) rotated view
the can, showing the location of the crack tip. Figure 9 – Boroscope image of the ID of rich zone liner 253-07-210 showing crack initiation
and growth from the leading edge on a ply splice. observed after the fifth run. Both cracks were about 2 in. long, with a 90° branch. These branches were along circumferential directions. Also, a leading edge crack was now visible in the replacement CR-side RZL. Inspection after the sixth run revealed that failure of the PL-side RZL occurred. An independent 2 in. long by 1-3/4 in. wide section was created when a new leading edge crack linked with an existing crack that had turned in a circumferential direction (Figure 10). Testing was suspended due to this damage. Note that the extensive cracking caused the RZL to split into two halves upon removal from the sector rig.
Fuel/airnozzle
Cloth splice
Fuel/airnozzle
Crack
Carbondeposit Flow
direction
NASA/TM2002-211509 11
Figure 10 – Post-test view of PL-side RZL (253-07-210) showing damage that occurred after 40.5 hours of testing.
Figure 11 – Post-test image of CR-side RZL (555-07-005). Note the oxidation and crack originating from the leading edge.
A post-test image of the replacement CR-side RZL is shown in Figure 11. Similar to the PL-side RZL, a 2 in. leading edge crack that turned 90° exists. Carbon deposits are present in every tested RZL (Figure 12). Boroscope inspections revealed that carbon deposits form during the initial test exposure and grow with continued testing. Once formed, these carbon deposits typically remained on the ID of a RZL unless they grow significantly in a direction normal to the flow. In these cases, the forces of the flowing gas stream fracture the carbon deposits. Evidence indicating the results of carbon deposit growth and fracture was the large quantities of carbon nuggets that accumulated in the cooling water used downstream of the combustor.
NASA/TM2002-211509 12
Figure 12 – Carbon deposits and cracking in CR-side RZL (555-07-005) after 40.5 hours of testing.
Figure 13 – Rich zone liner temperature measured during sector rig testing. 7.3 Rich Zone Liner Temperature 7.3.1 Fiber Optic Pyrometry Data – Figure 13 shows the temperature of a RZL versus time measured during two of the test runs. The temperature was measured 3.5 in. aft of the fuel/air nozzle and was obtained during the fourth and fifth test runs, when the second set of RZLs was installed. Note that the pyrometry system is not accurate below about 850 °F. The RZL temperature increases quickly during test initialization, and gradually increases to a maximum range during the supersonic cruise portion of the cycle. However, the temperature never reaches a steady-state value, but cycles up to a maximum. The large temperature spikes that exist occur when the supersonic cruise portion of the cycle is continued beyond its normal
Fig. 12 - Rich Zone Liner Temperature measured during sector rig testing.
0
200
400
600
800
1000
1200
1400
1600
0 100 200 300 400 500 600 700
Time Elasped, minutes
Tem
pera
ture
, °F
10-5-00 RZL temp
10-10-00 RZL temp
NASA/TM2002-211509 13
110-minute duration and are therefore an artifact of the test control. The origin of the smaller amplitude temperature cycling is unknown. Also note that during the testing on 10-5-00, a rig operational problem stopped testing during the period of about 280 to 400 minutes. The average peak temperature measured during the supersonic cruise portion of the cycle is shown in Figure 14. Data obtained during the current study is shown along with some temperature data obtained during the previous 205 hours of testing. The maximum rich zone liner temperatures measured during the current study are within the range obtained during previous sector testing. Figure 14 also shows the axial temperature gradient, which is the difference between the average peak liner temperature and the combustor inlet air temperature, T3. The leading edge of the RZLs is cooled by the inlet air and therefore is at the same temperature. The axial gradients vary from 175 to 515 °F. 7.3.2 Thin Film Thermocouples – The RZLs instrumented with thin film thermocouples were exposed to room temperature air for approximately 220 minutes and heated air for approximately 210 minutes flowing about 2 lbs/s prior to the combustor being lit. This exposure was due to facility problems that prevented the initiation of testing. Only a few temperature data points were recorded during this period, however, the thin film thermocouple data obtained during this time indicated that the material surface temperature was between the combustor inlet and combustor exit temperatures. Once the combustor was lit, the thin film thermocouple output was erratic as the temperatures were increasing. The output of two thin film thermocouples and the combustor inlet and exit temperature data are shown in Figure 15. The thermocouple data eroded with time after exposure to the elevated temperatures.
Figure 14 – Average peak temperature of rich zone liners measured during the supersonic cruise portion of the test cycle and calculated axial delta T as a function of test date.
0
300
600
900
1200
1500
1800
0 1 2 3 4 5
Test Date
Tem
per
atu
re, °
F
Average RZL peak temp
Average Axial delta T
4/13/99 5/5/99 10/5/00 10/10/00
NASA/TM2002-211509 14
Figure 15 – Thin film thermocouple data obtained during sector rig testing.
Figure 16 – Condition of a thin film thermocouple on a rich zone liner after combustion exposure.
Post-test analysis of the thermocouples revealed that the thin film thermocouples were intact and electrically continuous. There appeared to be very little physical damage to the films (Figure 16). However, the welds that held the platinum-13% rhodium wires to the films failed. The aluminum oxide insulation films were intact for all but one of the thermocouples. The fourth thermocouple had some flaking in the aluminum oxide film, resulting in lowered
0
200
400
600
800
1000
1200
1400
1600
0 100 200 300 400 500 600 700
Time elapsed (minutes)
Te
mp
era
ture
(C
)Combustor Exit
Combustor Inlet
TFTC 2
TFTC 1TFTC 3
NASA/TM2002-211509 15
electrical resistance in the film. Despite cracking in the rich zone liners, the leadwires that extended the length of the hardware were still intact and continuous. Because the wires that extended beyond the edge of the RZLs were damaged during removal from the test rig, these wires could not be evaluated. 8.0 DISCUSSION 8.1 Rich Zone Liner Damage The cracking of the RZLs that occurred is similar to that observed in others tested in 1999 (ref. 1). Three factors may have contributed to the damage observed in the RZLs tested during the present study, namely; material quality, thermal gradients, and mechanical loads due to attachment of the liners to the rig. As part of the characterization of the as-manufactured RZLs, the hoop tensile properties were measured. A hydrostatic ring test facility was used to test two witness coupons from each component at room temperature (ref. 11). The strength, modulus, and strain to failure for the four rich zone liners are compared to data obtained from plate specimens machined from the same vintage material in Figure 17. On average, the rich zone liner witness coupons had 45% lower strength, 70% lower failure strain, and 20% higher modulus than the plate specimens. Thus, the properties indicate that the rich zone liner composite was more brittle and weaker than material in plate form. Note that panel data was the basis for the component design. Quality of material may have contributed to the severity of damage observed. The as-manufactured components were ranked based on NDE results, mechanical and thermal properties from witness coupons, and microstructural quality. The highest rated rich zone liners were selected for initial rig testing. Three sets of RZLs (six total) were tested during the first 205 hours of sector rig operation in 1999. The first set failed catastrophically due to design issues with the attachment system. The other two sets of RZLs tested in 1999 did develop cracks, but had less damage (in terms of total crack length) and were tested longer (65 and 80 hrs) than those tested in this study. The four RZLs discussed in this paper were
Figure 17 – As- manufactured strength, modulus, and failure strain obtained through ring burst tests for the rich zone liners exposed in the sector rig.
RZL Ring Burst Strength, Modulus, and Failure Strain
0
5
10
15
20
25
30
35
40
45
555-
07-0
09
555-
07-0
10
555-
07-0
05
253-
07-2
10
pane
ls15
00°F
RZL ID
UT
S, k
si a
nd
Mo
du
lus
, MS
I
0
0.02
0.04
0.06
0.08
0.1
0.12
0.14
0.16
0.18
UTSModulusFailure Strain
NASA/TM2002-211509 16
ranked lower than the six tested in 1999. In particular, the last PL-side RZL (253-07-210) that failed (Figure 10) had the lowest rank of the ten. The most critical aspect of material performance under the combustion environment is managing the thermal stresses (refs. 8–9). Liner temperature measurements indicated that a thermal gradient exists along the flow direction during operation (Figure 14). The gradient is based on temperatures measured along one linear section of the RZLs. It is likely that temperatures varied around the circumference of the liners, as a variation in oxide color (and therefore oxide thickness) was generally observed in tested RZLs (Figure 11). The presence of carbon deposits on the ID (Figure 12) likely affected the liner temperatures. Also, the thermal stresses, that are most important to design of the liners, are due to through-thickness temperature gradients. Thus, it is possible that the data in Figure 14 represents a lower bound for temperature gradients that would be critical to liner durability. As part of this study, modifications of the fuel/air nozzles were made in an attempt to reduce the flow of by-pass air into the combustion stream and thus reduce the axial thermal gradient in the RZLs. The fuel/air nozzles contain seals that were designed to minimize the by-pass air flowing into the combustor. The presence of by-pass air in the combustion flow cools the upstream portion of the RZLs, but does not affect the temperature in the hottest portion of the liner, the aft end. This was verified with pyrometry data from tests conducted in 1999. The axial temperature gradients measured during tests conducted in 1999 bounds the gradients measured during the present study (Figure 14). Thus, the modifications of the fuel/air nozzles did not reduce the thermal gradients along the flow direction. Two rich zone liners failed during initial testing of the sector rig. A significant force interaction occurred between the rich zone liners and the spring holding them in place at the leading edge, resulting in the failure (ref. 1). After the spring was redesigned to be more compliant, catastrophic failure did not reoccur. In the present study, crack initiation at the leading edge was observed for all RZLs. It appears that the modified spring attachment method needs additional alteration to reduce the axial and hoop loading on the cans and thus eliminate cracking. 8.2 Thin Film thermocouples The post-test analysis of the sensors indicated that the thin films and leadwires survived the test conditions, however the welds between the wires and thin films did not. The wires did not maintain full and intimate contact with the films. This may have contributed to the erratic data that occurred during the temperature increase after the combustor was lit. In particular, the platinum-13% rhodium wires failed to remain in contact with the films. This may have been due to oxidation of the rhodium in both the wire and the exposed film. During sensor fabrication, the film was not completely covered by the protective aluminum oxide overcoat to allow attachment of the leadwires. The degradation in the output signals during high temperature exposure may have been caused by a change in the composition of the exposed films and fine wires. Analysis of the thermocouple data indicates that the connections between the wires and films failed prior to the initiation of the actual sector testing, during the initial period during which the hardware was exposed to high temperature, high flow air. The
NASA/TM2002-211509 17
thin film thermocouples were installed in a region of the rig that was exposed to the cooling air flow. It is also possible that the force of this air flow damaged the welds between the wires and the thin films. Assuming that all of the thermocouples changed composition at the same rate, the data indicates that there is a variation in temperature across the surface of the RZLs. The temperature prior to the signal degradation indicates that the temperature delta around the periphery was as high as 500 °C. While the thin films proved to be physically durable during this testing, the failure of the wires and the degradation in the signal output demonstrates that the thin film-to-leadwire connections need to be improved for durability and the thin films need to be more fully protected from the harsh test environment. 9.0 SUMMARY
1. Fifty-six hours of testing of SiC/SiC combustor liners was conducted using the RQL sector rig. Combined with the previous efforts, a total of 260 hours of testing was conducted on fifty-four components. Twelve of the fifty-four components were tested for the entire 260-hours. This unique capability for testing ceramic matrix composites in this aeronautic gas turbine engine combustion environment provided data unavailable from any other facility.
2. Damage, in the form of cracks, was observed in one of the component types, the rich zone liners. In all four rich zone liners tested, cracks initiated at the leading edge, grew along the flow direction, and bifurcated, turning 90° in a circumferential direction. The cracking is similar to that observed in rich zone liners tested in 1999. Three factors may have contributed to this damage, namely: material quality, thermal gradients, and mechanical loads due to attachment of the liners to the rig.
3. The capabilities of GRC-developed thin film thermocouples for measurement of CMC liner temperatures were evaluated. Thin film thermocouple data was obtained during the first 2 hours of sector rig operation, after which the output was erratic. The thin film sensors and leadwires survived the test conditions, however the welds between the wires and thin films did not.
10.0 REFERENCES
1. Brewer, D., Ojard, G., and Gibler, M., ”Ceramic Matrix Composite Combustor Liner
Rig Test,” in proceedings of Turbo Expo 2000: ASME Turbo Expo, Land, Sea & Air, May 8–11, 2000, Munich, Germany, paper TE00CER03-03, May, 2000.
2. Ojard, G., Stephan, R., Naik, R., Gibler, M., Cairo, R., Linsey, G., Hornick, J., and
Brewer, D., “NASA Rich Burn Quick Quench Lean Burn Sector Rig SiC/SiC CMC Testing,” in proceedings of 24th Annual Conference on Composites, Materials, and Structures, Cocoa Beach, FL., Jan., 2000.
NASA/TM2002-211509 18
3. Dean, A. J., Corman, G., Luthra, K., DiMascio, P., and Orenstein, R., “High Pressure Rig Testing of CFCC Combustor and Shroud Components,” in proceedings of 23rd Annual Conference on Composites, Materials, and Structures, Cocoa Beach, FL., Jan., 1999.
4. Corman, G., Luthra, K., Dean, A.J., Brabetz, S., Kebbede, A., DiMascio, P., and
Orenstein, R., “Processing and High Pressure Combustion Rig Testing of Melt Infiltrated SiC/Si Composites,” in proceedings of 24th Annual Conference on Composites, Materials, and Structures, Cocoa Beach, FL., Jan., 2000.
5. Corman, G., Dean, A., et al., “Rig and Gas Turbine Testing of MI-CMC Combustor
and Shroud Components,” in the proceedings of Turbo Expo 2001: ASME Turbo Expo, Land, Sea & Air, June 4–7, 2001, New Orleans, LA., ASME paper 2001–GT–0593.
6. Igashira, K.-I., Matsubara, G., Matsuda, Y., and Imamura, A., “Development of the
Advanced Combustor Liner Composed of CMC/GMC Hybrid Composite Material,” in the proceedings of Turbo Expo 2001: ASME Turbo Expo, Land, Sea & Air, June 4–7, 2001, New Orleans, LA., ASME paper 2001–GT–0511.
7. Shi, J., “Design, Analysis, Fabrication and Testing of a CMC Combustion Can,” in the
proceedings of Turbo Expo 2000: ASME Turbo Expo, Land, Sea & Air, May 8–11, 2000, Munich, Germany, ASME paper 2000–GT–71.
8. Miriyala, N., Fahme, A., and van Roode, M., “Ceramic Stationary Gas Turbine
Program – Combustor Liner Development Summary,” in the proceedings of Turbo Expo 2001: ASME Turbo Expo, Land, Sea & Air, June 4–7, 2001, New Orleans, LA., ASME paper 2001–GT–0512.
9. Brewer, D., “HSR/EPM Combustion Materials Development Program,” Materials
Science and Engineering, A261, pp. 284–291, 1999.
10. Miller, R.J., Moree, J.C., and Jarmon, D.C., “Design and Validation of High Temperature Composite Fasteners,” in the proceedings of the 39th AIAA/ASME/ASCE/AHS/ASC Structures, Structural Dynamics, and Materials Conference, held in Long Beach, CA., April 20–23, 1998, AIAA paper 98–1998.
11. Nemets, S.A., Ehlers, R.C., and Parrot, E., “NASA Lewis Research Center’s
Preheated Combustor and Materials Test Facility,” NASA TM–106676, 1995.
12. Barnett, T.R., Ojard, G.C., and Cairo, R.R., “Relationships of Test Methods and Standards Development to Emerging and Retrofit CFCC Markets,” in Mechanical, Thermal, and Environmental Testing and Performance of Ceramic Composites and Components, ASTM STP 1392, M.G. Jenkins, E. Lara-Curzio, and S.T. Gonczy, eds., pp. 3–12, 2000.
This publication is available from the NASA Center for AeroSpace Information, 301–621–0390.
REPORT DOCUMENTATION PAGE
2. REPORT DATE
19. SECURITY CLASSIFICATION OF ABSTRACT
18. SECURITY CLASSIFICATION OF THIS PAGE
Public reporting burden for this collection of information is estimated to average 1 hour per response, including the time for reviewing instructions, searching existing data sources,gathering and maintaining the data needed, and completing and reviewing the collection of information. Send comments regarding this burden estimate or any other aspect of thiscollection of information, including suggestions for reducing this burden, to Washington Headquarters Services, Directorate for Information Operations and Reports, 1215 JeffersonDavis Highway, Suite 1204, Arlington, VA 22202-4302, and to the Office of Management and Budget, Paperwork Reduction Project (0704-0188), Washington, DC 20503.
NSN 7540-01-280-5500 Standard Form 298 (Rev. 2-89)Prescribed by ANSI Std. Z39-18298-102
Form Approved
OMB No. 0704-0188
12b. DISTRIBUTION CODE
8. PERFORMING ORGANIZATION REPORT NUMBER
5. FUNDING NUMBERS
3. REPORT TYPE AND DATES COVERED
4. TITLE AND SUBTITLE
6. AUTHOR(S)
7. PERFORMING ORGANIZATION NAME(S) AND ADDRESS(ES)
11. SUPPLEMENTARY NOTES
12a. DISTRIBUTION/AVAILABILITY STATEMENT
13. ABSTRACT (Maximum 200 words)
14. SUBJECT TERMS
17. SECURITY CLASSIFICATION OF REPORT
16. PRICE CODE
15. NUMBER OF PAGES
20. LIMITATION OF ABSTRACT
Unclassified Unclassified
Technical Memorandum
Unclassified
National Aeronautics and Space AdministrationJohn H. Glenn Research Center at Lewis FieldCleveland, Ohio 44135–3191
1. AGENCY USE ONLY (Leave blank)
10. SPONSORING/MONITORING AGENCY REPORT NUMBER
9. SPONSORING/MONITORING AGENCY NAME(S) AND ADDRESS(ES)
National Aeronautics and Space AdministrationWashington, DC 20546–0001
Available electronically at http://gltrs.grc.nasa.gov/GLTRS
April 2002
NASA TM—2002-211509
E–13287
WU–714–04–30–00
24
RQL Sector Rig Testing of SiC/SiC Combustor Liners
Michael J. Verrilli, Lisa C. Martin, and David N. Brewer
Unclassified -UnlimitedSubject Categories: 24 and 35 Distribution: Nonstandard
Michael J. Verrilli and Lisa C. Martin, NASA Glenn Research Center; and David N. Brewer, U.S. Army ResearchLaboratory, NASA Glenn Research Center. Responsible person, Michael J. Verrilli, organization code 5160,216–433–3337.
Combustor liners, manufactured from silicon carbide fiber-reinforced silicon carbide (SiC/SiC) were tested for 260 hrusing a simulated gas turbine engine cycle. This report documents the results of the last 56 hr of testing. Damage occurredin one of the six different components that make up the combustor liner set, the rich zone liner. Cracks in the rich zoneliner initiated at the leading edge due to stresses resulting from the component attachment configuration. Thin filmthermocouples and fiber optic pyrometers were used to measure the rich zone liner’s temperature and these results arereported.