RREEF Research Chart 1: The Growth of the Global Real Estate Market, 2006-2011 RREEF Research 1 An early and abbreviated version of the paper was published in EG Capital, June 2007 Table of Contents 1. Introduction……………….... 1 2. The Global Market Today.....2 3. Estimating Future Size…......5 4. The Global Market Over the next 5 Years……………..14 5. Conclusions ………………17 1. Introduction It is extremely difficult to gain accurate figures on the size of the global real estate market due to the fragmented and confidential nature of the industry across many countries. Despite the difficulties, it is important to arrive at robust estimates to help: Understand the scale of investment opportunities across various global markets. Assess the liquidity and liquidity risks across markets. Develop appropriate investment strategies across global markets. Beyond understanding the existing scale of the market it is also important to assess how this will change over the short to medium term, as this can have a material impact on investment strategy. Of particular significance are the regions and countries that are likely to experience the most significant changes in value, in absolute terms and relative to their existing size. Investment strategy should also be influenced by the way in which the value of the market might change, whether through appreciation, through the addition of new space or through sale and lease-back activity. This paper presents research on the current value of the global real estate market, and a set of approaches to estimating how the market is likely to change over the coming five years 1 . July 2007 Authors: Peter Hobbs +44 (0)20 7547 4855 [email protected]Henry Chin +44 (0)20 7545 6611 [email protected]IMPORTANT: PLEASE SEE IMPORTANT DI SCLOSURES AND ANALYST CERTIFICATION IMMEDIATELY AT THE END OF THE TEXT OF THIS REPORT The Future Size of the Global Real Estate Market 0 1,000 2,000 3,000 4,000 5,000 6,000 United States Japan Germany UK France Canada Italy Australia Netherlands China India Brazil Russia US$ Billion 0% 50% 100% 150% 200% 250% 300% 350% 400% 2006 (LHS) 2011 (LHS) 5-Year Growth (RHS) % Change 2006 - 2011
Transcript
RREEF Research
Chart 1: The Growth of the Global Real Estate Market, 2006-2011
RREEF Research
1 An early and abbreviated version of the paper was published in EG Capital, June 2007
Table of Contents 1. Introduction………………....1 2. The Global Market Today.....2
3. Estimating Future Size…......5 4. The Global Market Over the next 5 Years……………..14 5. Conclusions ………………17
1. Introduction It is extremely difficult to gain accurate figures on the size of the global real estate market due to the fragmented and confidential nature of the industry across many countries. Despite the difficulties, it is important to arrive at robust estimates to help:
Understand the scale of investment opportunities across various global markets.
Assess the liquidity and liquidity risks across markets. Develop appropriate investment strategies across global markets.
Beyond understanding the existing scale of the market it is also important to assess how this will change over the short to medium term, as this can have a material impact on investment strategy. Of particular significance are the regions and countries that are likely to experience the most significant changes in value, in absolute terms and relative to their existing size. Investment strategy should also be influenced by the way in which the value of the market might change, whether through appreciation, through the addition of new space or through sale and lease-back activity. This paper presents research on the current value of the global real estate market, and a set of approaches to estimating how the market is likely to change over the coming five years1.
IMPORTANT: PLEASE SEE IMPORTANT DI SCLOSURES AND ANALYST CERTIFICATION IMMEDIATELY AT THE END OF THE TEXT OF THIS REPORT
The Future Size of the Global Real Estate Market
0
1,000
2,000
3,000
4,000
5,000
6,000
Uni
ted
Stat
es
Japa
n
Ger
man
y
UK
Fran
ce
Can
ada
Italy
Aust
ralia
Net
herla
nds
Chi
na
Indi
a
Braz
il
Rus
sia
US$
Bill
ion
0%
50%
100%
150%
200%
250%
300%
350%
400%2006 (LHS) 2011 (LHS) 5-Year Growth (RHS)
% C
hange 2006 - 2011
2
RREEF Research
2
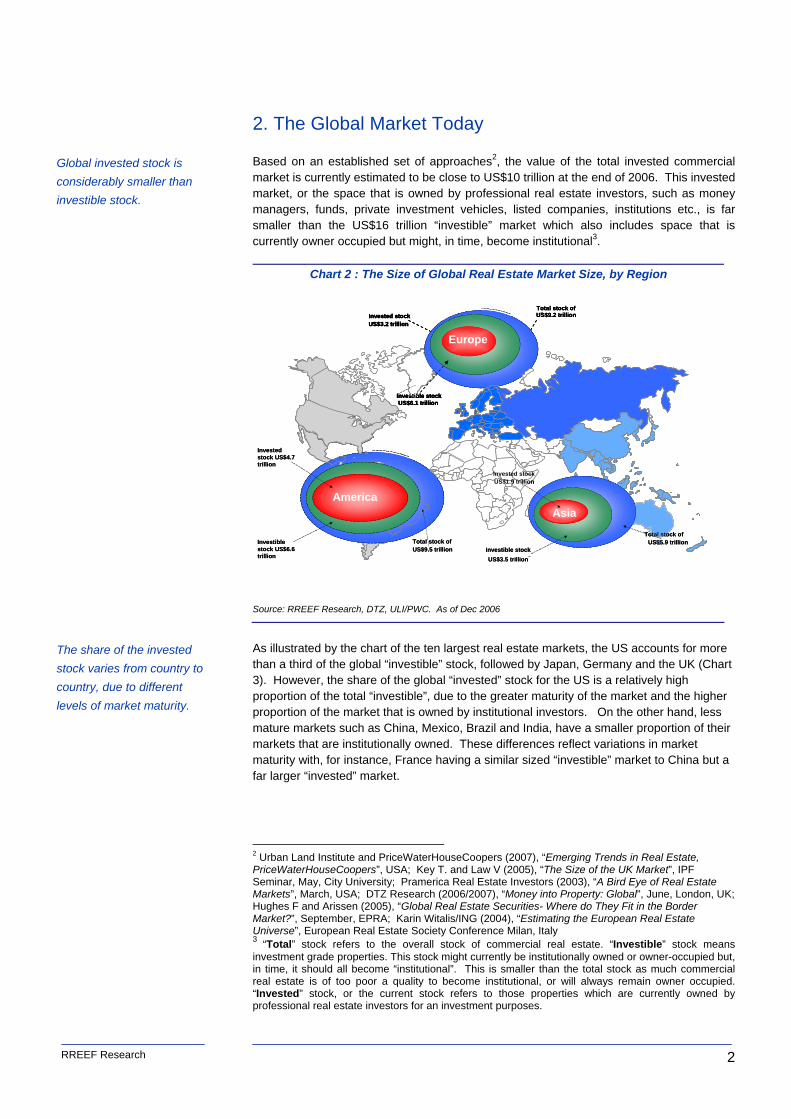
2. The Global Market Today Based on an established set of approaches2, the value of the total invested commercial market is currently estimated to be close to US$10 trillion at the end of 2006. This invested market, or the space that is owned by professional real estate investors, such as money managers, funds, private investment vehicles, listed companies, institutions etc., is far smaller than the US$16 trillion “investible” market which also includes space that is currently owner occupied but might, in time, become institutional3.
Chart 2 : The Size of Global Real Estate Market Size, by Region
Source: RREEF Research, DTZ, ULI/PWC. As of Dec 2006
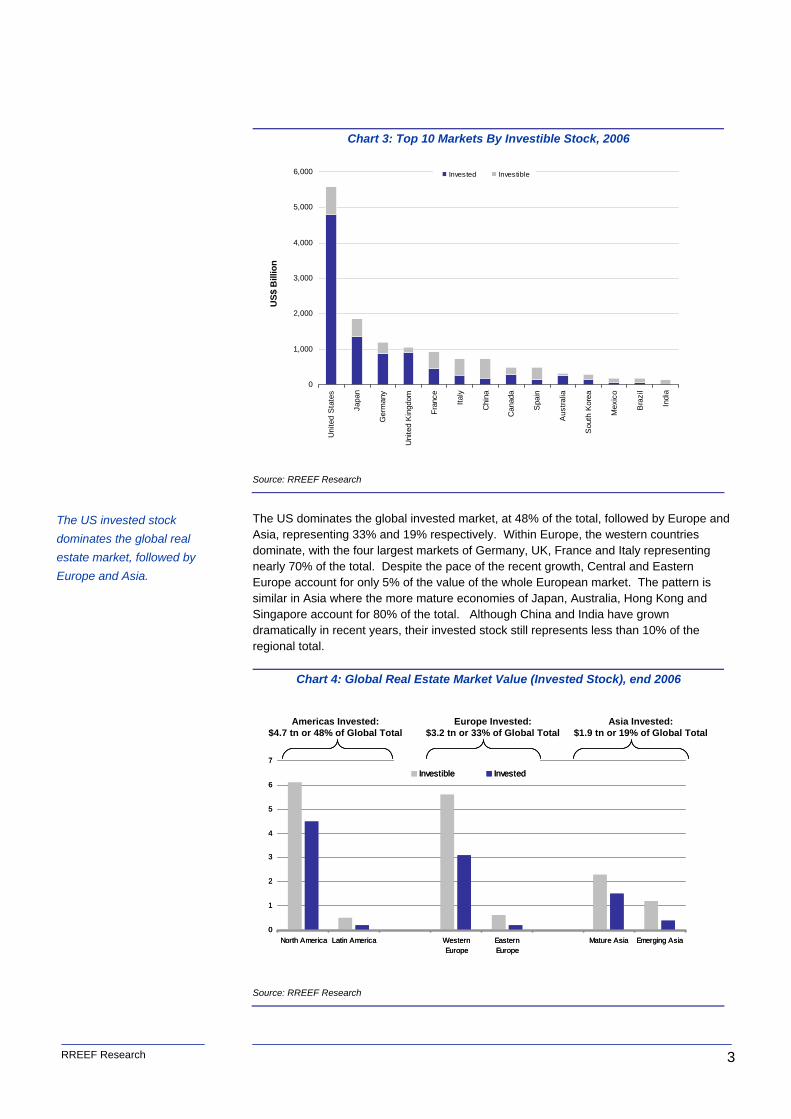
As illustrated by the chart of the ten largest real estate markets, the US accounts for more than a third of the global “investible” stock, followed by Japan, Germany and the UK (Chart 3). However, the share of the global “invested” stock for the US is a relatively high proportion of the total “investible”, due to the greater maturity of the market and the higher proportion of the market that is owned by institutional investors. On the other hand, less mature markets such as China, Mexico, Brazil and India, have a smaller proportion of their markets that are institutionally owned. These differences reflect variations in market maturity with, for instance, France having a similar sized “investible” market to China but a far larger “invested” market.
2 Urban Land Institute and PriceWaterHouseCoopers (2007), “Emerging Trends in Real Estate, PriceWaterHouseCoopers”, USA; Key T. and Law V (2005), “The Size of the UK Market”, IPF Seminar, May, City University; Pramerica Real Estate Investors (2003), “A Bird Eye of Real Estate Markets”, March, USA; DTZ Research (2006/2007), “Money into Property: Global”, June, London, UK; Hughes F and Arissen (2005), “Global Real Estate Securities- Where do They Fit in the Border Market?”, September, EPRA; Karin Witalis/ING (2004), “Estimating the European Real Estate Universe”, European Real Estate Society Conference Milan, Italy 3 “Total” stock refers to the overall stock of commercial real estate. “Investible” stock means investment grade properties. This stock might currently be institutionally owned or owner-occupied but, in time, it should all become “institutional”. This is smaller than the total stock as much commercial real estate is of too poor a quality to become institutional, or will always remain owner occupied. “Invested” stock, or the current stock refers to those properties which are currently owned by professional real estate investors for an investment purposes.
Global invested stock is considerably smaller than investible stock.
The share of the invested stock varies from country to country, due to different levels of market maturity.
The US dominates the global invested market, at 48% of the total, followed by Europe and Asia, representing 33% and 19% respectively. Within Europe, the western countries dominate, with the four largest markets of Germany, UK, France and Italy representing nearly 70% of the total. Despite the pace of the recent growth, Central and Eastern Europe account for only 5% of the value of the whole European market. The pattern is similar in Asia where the more mature economies of Japan, Australia, Hong Kong and Singapore account for 80% of the total. Although China and India have grown dramatically in recent years, their invested stock still represents less than 10% of the regional total.
Chart 4: Global Real Estate Market Value (Invested Stock), end 2006
Source: RREEF Research
The US invested stock dominates the global real estate market, followed by Europe and Asia.
0
1,000
2,000
3,000
4,000
5,000
6,000
Uni
ted
Sta
tes
Japa
n
Ger
man
y
Uni
ted
Kin
gdom
Fran
ce
Italy
Chi
na
Can
ada
Spa
in
Aus
tralia
Sou
th K
orea
Mex
ico
Bra
zil
Indi
a
Invested Investible
US$
Bill
ion
0
1
2
3
4
5
6
7
North America Latin America WesternEurope
EasternEurope
Mature Asia Emerging Asia
Investible Invested
Americas Invested:$4.7 tn or 48% of Global Total
Europe Invested:$3.2 tn or 33% of Global Total
Asia Invested:$1.9 tn or 19% of Global Total
0
1
2
3
4
5
6
7
North America Latin America WesternEurope
EasternEurope
Mature Asia Emerging Asia
Investible Invested
Americas Invested:$4.7 tn or 48% of Global Total
Europe Invested:$3.2 tn or 33% of Global Total
Asia Invested:$1.9 tn or 19% of Global Total
Americas Invested:$4.7 tn or 48% of Global Total
Europe Invested:$3.2 tn or 33% of Global Total
Asia Invested:$1.9 tn or 19% of Global Total
RREEF Research
4
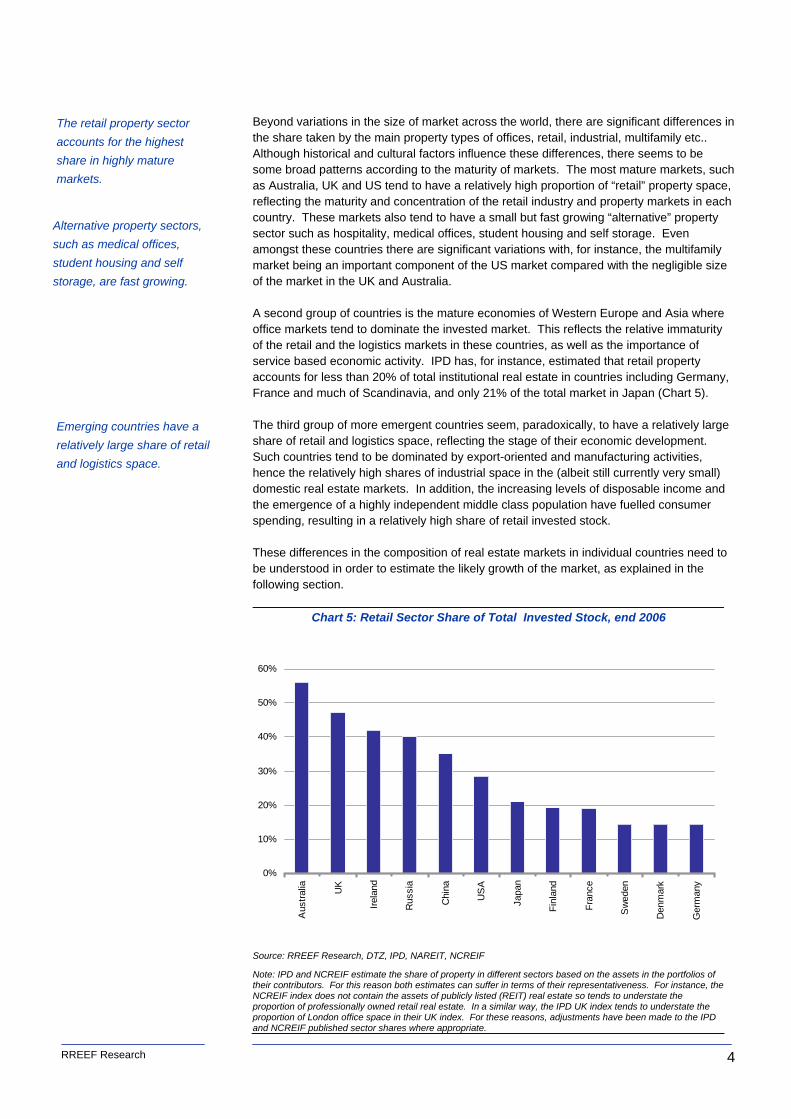
Beyond variations in the size of market across the world, there are significant differences in the share taken by the main property types of offices, retail, industrial, multifamily etc.. Although historical and cultural factors influence these differences, there seems to be some broad patterns according to the maturity of markets. The most mature markets, such as Australia, UK and US tend to have a relatively high proportion of “retail” property space, reflecting the maturity and concentration of the retail industry and property markets in each country. These markets also tend to have a small but fast growing “alternative” property sector such as hospitality, medical offices, student housing and self storage. Even amongst these countries there are significant variations with, for instance, the multifamily market being an important component of the US market compared with the negligible size of the market in the UK and Australia. A second group of countries is the mature economies of Western Europe and Asia where office markets tend to dominate the invested market. This reflects the relative immaturity of the retail and the logistics markets in these countries, as well as the importance of service based economic activity. IPD has, for instance, estimated that retail property accounts for less than 20% of total institutional real estate in countries including Germany, France and much of Scandinavia, and only 21% of the total market in Japan (Chart 5). The third group of more emergent countries seem, paradoxically, to have a relatively large share of retail and logistics space, reflecting the stage of their economic development. Such countries tend to be dominated by export-oriented and manufacturing activities, hence the relatively high shares of industrial space in the (albeit still currently very small) domestic real estate markets. In addition, the increasing levels of disposable income and the emergence of a highly independent middle class population have fuelled consumer spending, resulting in a relatively high share of retail invested stock. These differences in the composition of real estate markets in individual countries need to be understood in order to estimate the likely growth of the market, as explained in the following section.
Chart 5: Retail Sector Share of Total Invested Stock, end 2006
Source: RREEF Research, DTZ, IPD, NAREIT, NCREIF
Note: IPD and NCREIF estimate the share of property in different sectors based on the assets in the portfolios of their contributors. For this reason both estimates can suffer in terms of their representativeness. For instance, the NCREIF index does not contain the assets of publicly listed (REIT) real estate so tends to understate the proportion of professionally owned retail real estate. In a similar way, the IPD UK index tends to understate the proportion of London office space in their UK index. For these reasons, adjustments have been made to the IPD and NCREIF published sector shares where appropriate.
The retail property sector accounts for the highest share in highly mature markets.
Alternative property sectors, such as medical offices, student housing and self storage, are fast growing.
Emerging countries have a relatively large share of retail and logistics space.
0%
10%
20%
30%
40%
50%
60%
Aus
tralia UK
Irela
nd
Rus
sia
Chi
na
US
A
Japa
n
Finl
and
Fran
ce
Sw
eden
Den
mar
k
Ger
man
y
RREEF Research
5
3. Estimating the Future Size of the Global Real Estate Market A number of assumptions need to be made in order to estimate the future growth of the global real estate market around the three components of change: Appreciation, Net Additions, and Sale and Leaseback (Chart 6).
Chart 6: Components of the Current and Future “Invested” Real Estate Market
Source: RREEF Research
3.1 Appreciation Appreciation is, perhaps, the most fundamental component, and this is driven by the way changes in rents and yields impact the value of existing real estate from one year to the next, as well as the effect of depreciation or obsolescence. There are important differences in the way the major property types appreciate (or depreciate) with, for example, the office sector tending to be more volatile than the industrial sector in most markets. For this reason, specific estimates need to be made for the major property types in each market.
Appreciation is the most fundamental component impacting the future value of real estate.
Current Market Value
Future Market Value
Appreciation
Net Additions
Sale & Leaseback
Current Invested
Real Estate
Current Market Value
Future Market Value
Appreciation
Net Additions
Sale & Leaseback
Current Invested
Real Estate
RREEF Research
6
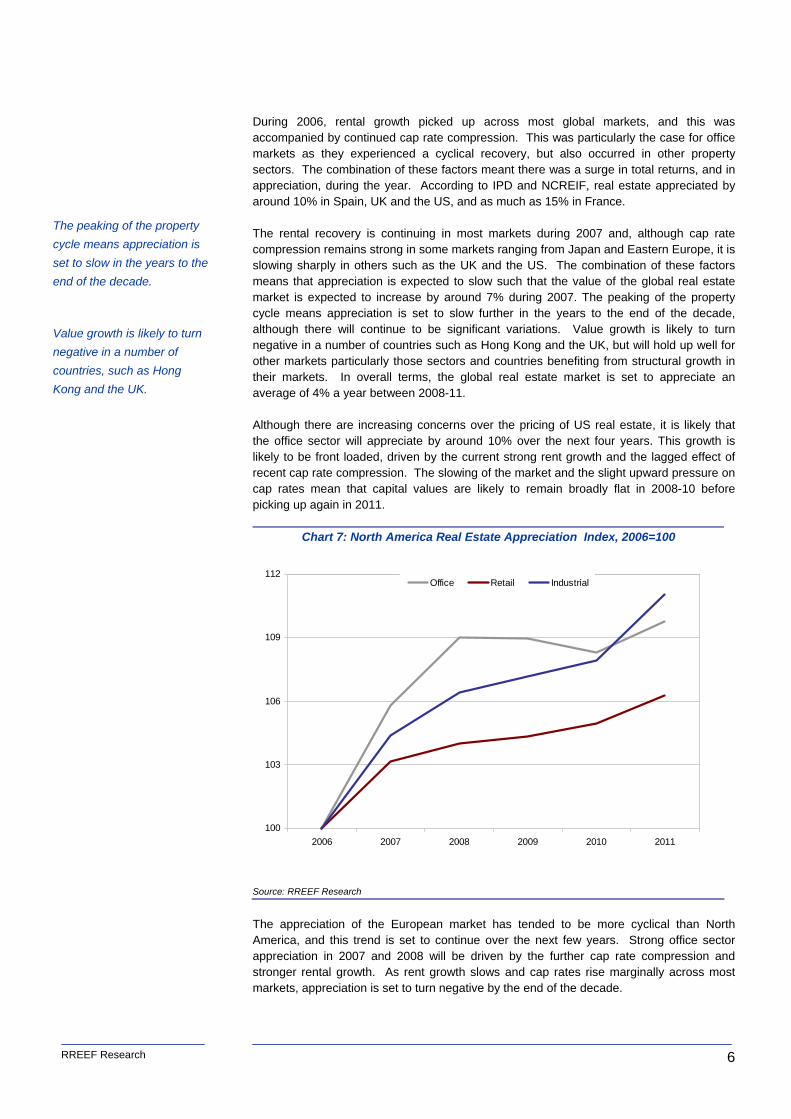
During 2006, rental growth picked up across most global markets, and this was accompanied by continued cap rate compression. This was particularly the case for office markets as they experienced a cyclical recovery, but also occurred in other property sectors. The combination of these factors meant there was a surge in total returns, and in appreciation, during the year. According to IPD and NCREIF, real estate appreciated by around 10% in Spain, UK and the US, and as much as 15% in France. The rental recovery is continuing in most markets during 2007 and, although cap rate compression remains strong in some markets ranging from Japan and Eastern Europe, it is slowing sharply in others such as the UK and the US. The combination of these factors means that appreciation is expected to slow such that the value of the global real estate market is expected to increase by around 7% during 2007. The peaking of the property cycle means appreciation is set to slow further in the years to the end of the decade, although there will continue to be significant variations. Value growth is likely to turn negative in a number of countries such as Hong Kong and the UK, but will hold up well for other markets particularly those sectors and countries benefiting from structural growth in their markets. In overall terms, the global real estate market is set to appreciate an average of 4% a year between 2008-11. Although there are increasing concerns over the pricing of US real estate, it is likely that the office sector will appreciate by around 10% over the next four years. This growth is likely to be front loaded, driven by the current strong rent growth and the lagged effect of recent cap rate compression. The slowing of the market and the slight upward pressure on cap rates mean that capital values are likely to remain broadly flat in 2008-10 before picking up again in 2011.
Chart 7: North America Real Estate Appreciation Index, 2006=100
Source: RREEF Research
The appreciation of the European market has tended to be more cyclical than North America, and this trend is set to continue over the next few years. Strong office sector appreciation in 2007 and 2008 will be driven by the further cap rate compression and stronger rental growth. As rent growth slows and cap rates rise marginally across most markets, appreciation is set to turn negative by the end of the decade.
The peaking of the property cycle means appreciation is set to slow in the years to the end of the decade.
Value growth is likely to turn negative in a number of countries, such as Hong Kong and the UK.
100
103
106
109
112
2006 2007 2008 2009 2010 2011
Office Retail Industrial
RREEF Research
7
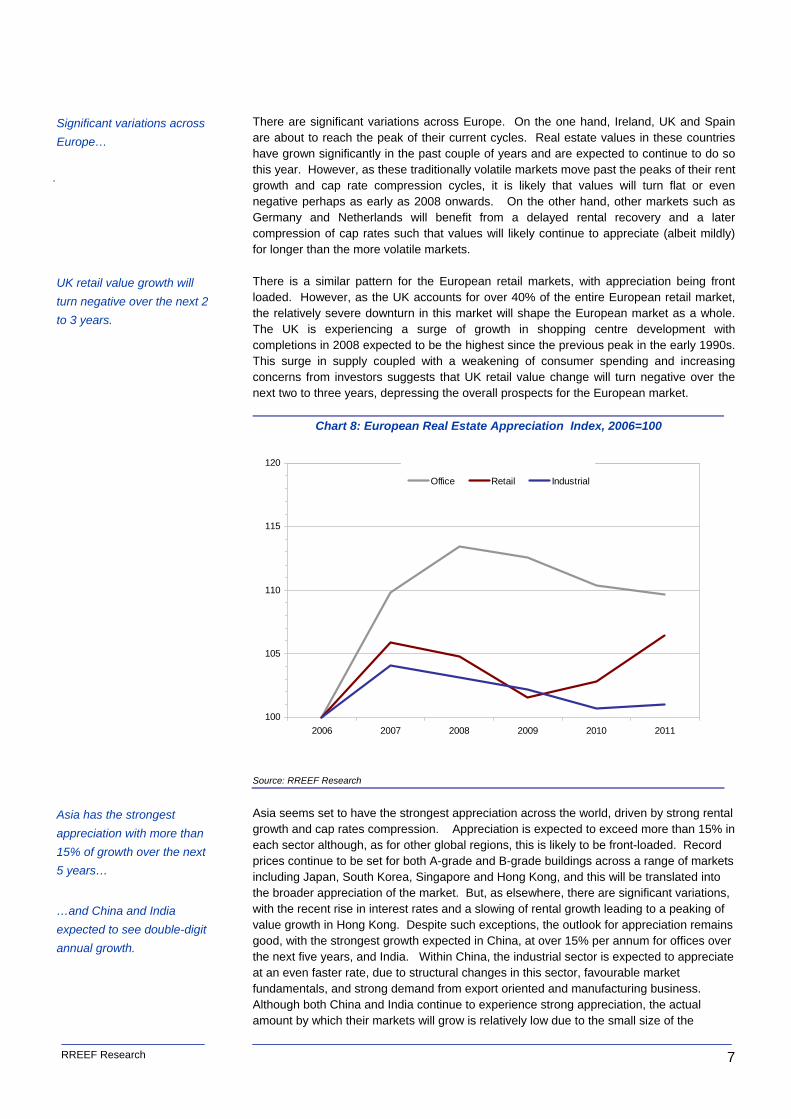
There are significant variations across Europe. On the one hand, Ireland, UK and Spain are about to reach the peak of their current cycles. Real estate values in these countries have grown significantly in the past couple of years and are expected to continue to do so this year. However, as these traditionally volatile markets move past the peaks of their rent growth and cap rate compression cycles, it is likely that values will turn flat or even negative perhaps as early as 2008 onwards. On the other hand, other markets such as Germany and Netherlands will benefit from a delayed rental recovery and a later compression of cap rates such that values will likely continue to appreciate (albeit mildly) for longer than the more volatile markets. There is a similar pattern for the European retail markets, with appreciation being front loaded. However, as the UK accounts for over 40% of the entire European retail market, the relatively severe downturn in this market will shape the European market as a whole. The UK is experiencing a surge of growth in shopping centre development with completions in 2008 expected to be the highest since the previous peak in the early 1990s. This surge in supply coupled with a weakening of consumer spending and increasing concerns from investors suggests that UK retail value change will turn negative over the next two to three years, depressing the overall prospects for the European market.
Chart 8: European Real Estate Appreciation Index, 2006=100
Source: RREEF Research
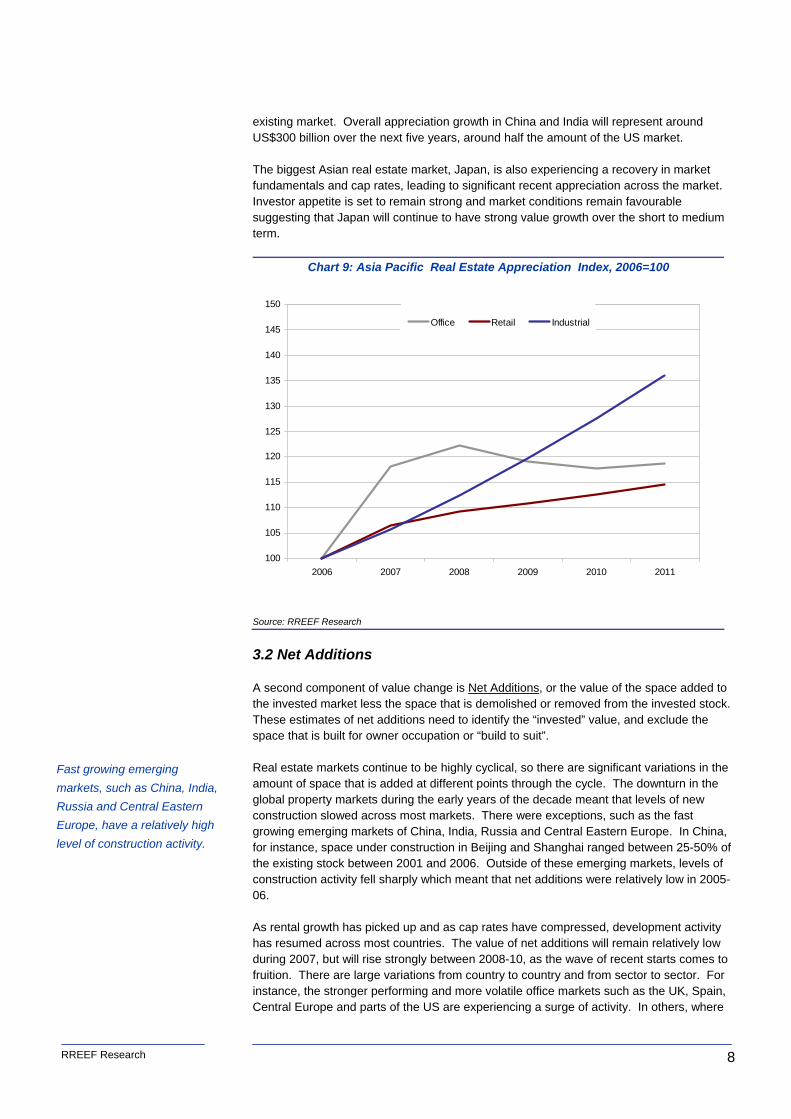
Asia seems set to have the strongest appreciation across the world, driven by strong rental growth and cap rates compression. Appreciation is expected to exceed more than 15% in each sector although, as for other global regions, this is likely to be front-loaded. Record prices continue to be set for both A-grade and B-grade buildings across a range of markets including Japan, South Korea, Singapore and Hong Kong, and this will be translated into the broader appreciation of the market. But, as elsewhere, there are significant variations, with the recent rise in interest rates and a slowing of rental growth leading to a peaking of value growth in Hong Kong. Despite such exceptions, the outlook for appreciation remains good, with the strongest growth expected in China, at over 15% per annum for offices over the next five years, and India. Within China, the industrial sector is expected to appreciate at an even faster rate, due to structural changes in this sector, favourable market fundamentals, and strong demand from export oriented and manufacturing business. Although both China and India continue to experience strong appreciation, the actual amount by which their markets will grow is relatively low due to the small size of the
Significant variations across Europe…
.
UK retail value growth will turn negative over the next 2 to 3 years.
Asia has the strongest appreciation with more than 15% of growth over the next 5 years…
…and China and India expected to see double-digit annual growth.
100
105
110
115
120
2006 2007 2008 2009 2010 2011
Office Retail Industrial
RREEF Research
8
existing market. Overall appreciation growth in China and India will represent around US$300 billion over the next five years, around half the amount of the US market. The biggest Asian real estate market, Japan, is also experiencing a recovery in market fundamentals and cap rates, leading to significant recent appreciation across the market. Investor appetite is set to remain strong and market conditions remain favourable suggesting that Japan will continue to have strong value growth over the short to medium term.
Chart 9: Asia Pacific Real Estate Appreciation Index, 2006=100
Source: RREEF Research
3.2 Net Additions A second component of value change is Net Additions, or the value of the space added to the invested market less the space that is demolished or removed from the invested stock. These estimates of net additions need to identify the “invested” value, and exclude the space that is built for owner occupation or “build to suit”. Real estate markets continue to be highly cyclical, so there are significant variations in the amount of space that is added at different points through the cycle. The downturn in the global property markets during the early years of the decade meant that levels of new construction slowed across most markets. There were exceptions, such as the fast growing emerging markets of China, India, Russia and Central Eastern Europe. In China, for instance, space under construction in Beijing and Shanghai ranged between 25-50% of the existing stock between 2001 and 2006. Outside of these emerging markets, levels of construction activity fell sharply which meant that net additions were relatively low in 2005-06. As rental growth has picked up and as cap rates have compressed, development activity has resumed across most countries. The value of net additions will remain relatively low during 2007, but will rise strongly between 2008-10, as the wave of recent starts comes to fruition. There are large variations from country to country and from sector to sector. For instance, the stronger performing and more volatile office markets such as the UK, Spain, Central Europe and parts of the US are experiencing a surge of activity. In others, where
Fast growing emerging markets, such as China, India, Russia and Central Eastern Europe, have a relatively high level of construction activity.
100
105
110
115
120
125
130
135
140
145
150
2006 2007 2008 2009 2010 2011
Office Retail Industrial
RREEF Research
9
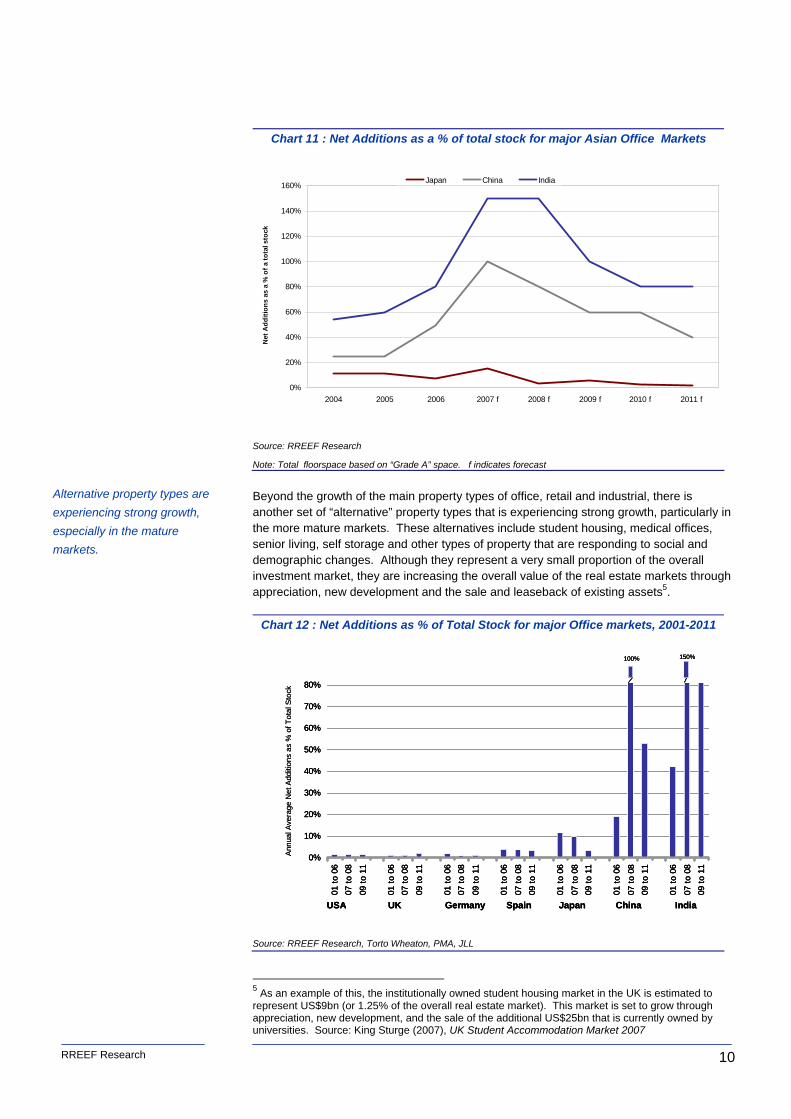
vacancy rates remain high and demand relatively muted, such as Germany, Netherlands and South Korea, net additions will remain relatively low. Although there are variations between the mature markets net additions tend to represent around 1-2% of existing stock, with slightly larger amounts in faster growing markets (such as in Spain) or at markets that are suffering cyclical downturns (such as the UK in the early years of this decade). As would be expected the level of development activity, and the value of net additions, is far more significant in most of the fast-growing emerging markets, as shown on Chart 10 and 11 . Given these high levels of development activity, a number of emerging countries including China and India are expected to receive a tripling of the existing inventory over the next five years, despite an expected slowing of the real estate cycle. The level of development activity in both countries is enormous with, for example, India likely to have more than 700 million square feet of office space completed, representing a value of around $35 billion4.
Chart 10 : Net Additions as a % of total stock for major Western Office Markets
Source: RREEF Research
Note: Total floorspace based on “Grade A” space. f indicates forecast
While a large proportion of new office development tends to be owned as investment assets, both retail and industrial tend to have a higher proportion of “build to suit” space, in response to the specific needs of retailers and logistic operators. There are exceptions, such as the major shopping centres or malls and the provision of space for third party logistics operators as these tend to be developed and owned by institutional investors.
4 RREEF Research (2006), Building up India, May 2006
Mature markets’ net addition tends to be around 1%-2% of the existing stock.
New office development tends to be owned for investment purposes.
-1%
0%
1%
2%
3%
4%
5%
2004 2005 2006 2007 f 2008 f 2009 f 2010 f 2011 f
USA UK Germany Spain
Net
Add
ition
s as
a %
of a
tota
l sto
ck
RREEF Research
10
Chart 11 : Net Additions as a % of total stock for major Asian Office Markets
Source: RREEF Research
Note: Total floorspace based on “Grade A” space. f indicates forecast
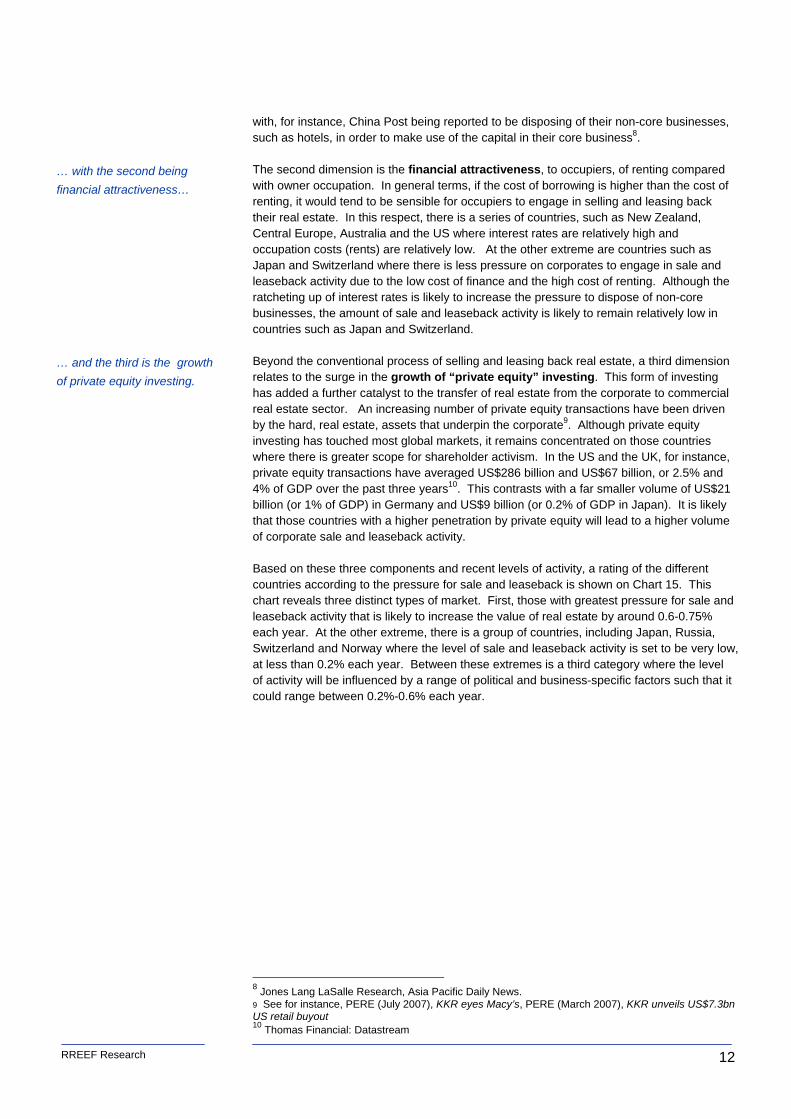
Beyond the growth of the main property types of office, retail and industrial, there is another set of “alternative” property types that is experiencing strong growth, particularly in the more mature markets. These alternatives include student housing, medical offices, senior living, self storage and other types of property that are responding to social and demographic changes. Although they represent a very small proportion of the overall investment market, they are increasing the overall value of the real estate markets through appreciation, new development and the sale and leaseback of existing assets5.
Chart 12 : Net Additions as % of Total Stock for major Office markets, 2001-2011
Source: RREEF Research, Torto Wheaton, PMA, JLL
5 As an example of this, the institutionally owned student housing market in the UK is estimated to represent US$9bn (or 1.25% of the overall real estate market). This market is set to grow through appreciation, new development, and the sale of the additional US$25bn that is currently owned by universities. Source: King Sturge (2007), UK Student Accommodation Market 2007
Alternative property types are experiencing strong growth, especially in the mature markets.
0%
20%
40%
60%
80%
100%
120%
140%
160%
2004 2005 2006 2007 f 2008 f 2009 f 2010 f 2011 f
Japan China India
Net
Add
ition
s as
a %
of a
tota
l sto
ck
0%
10%
20%
30%
40%
50%
60%
70%
80%
01 to
06
07 to
08
09 to
11
01 to
06
07 to
08
09 to
11
01 to
06
07 to
08
09 to
11
01 to
06
07 to
08
09 to
11
01 to
06
07 to
08
09 to
11
01 to
06
07 to
08
09 to
11
01 to
06
07 to
08
09 to
11
150%
USA UK Germany Spain Japan China India
100%
Annu
al A
vera
ge N
et A
dditi
ons
as %
of T
otal
Sto
ck
0%
10%
20%
30%
40%
50%
60%
70%
80%
01 to
06
07 to
08
09 to
11
01 to
06
07 to
08
09 to
11
01 to
06
07 to
08
09 to
11
01 to
06
07 to
08
09 to
11
01 to
06
07 to
08
09 to
11
01 to
06
07 to
08
09 to
11
01 to
06
07 to
08
09 to
11
150%
USA UK Germany Spain Japan China India
100%
0%
10%
20%
30%
40%
50%
60%
70%
80%
01 to
06
07 to
08
09 to
11
01 to
06
07 to
08
09 to
11
01 to
06
07 to
08
09 to
11
01 to
06
07 to
08
09 to
11
01 to
06
07 to
08
09 to
11
01 to
06
07 to
08
09 to
11
01 to
06
07 to
08
09 to
11
150%
USA UK Germany Spain Japan China India
100%
Annu
al A
vera
ge N
et A
dditi
ons
as %
of T
otal
Sto
ck
RREEF Research
11
3.3 Sale and Leaseback The third driver of the future value of real estate involves Sale and Leaseback activity, or the value of real estate that is transferred from owner occupation to the invested market. There are wide variations in the proportion of real estate that is owner occupied with the most mature markets such as the US or the UK having relatively low levels at around 30-40%. In contrast, more emergent economies with limited institutional investment markets tend to have a higher proportion of their real estate being owner occupied. For instance, owner occupation is estimated to be around 90% in China, India and Russia, and over 70% in countries such as South Korea, Taiwan, Czech Republic and Poland. Between these extremes are the large mature economies with relatively immature real estate markets such as Germany, Italy and Japan, where owner occupation is around 50-65%. Each of these three types of country is experiencing pressure for sale and leaseback as part of the broader outsourcing of non-core business activities. For instance, Real Capital Analytics estimate that even in perhaps the most mature market in the world, the United States, there were US$11billion of sale and leasebacks in 20066. In Europe, this activity remains particularly strong in the UK, France, Italy and Germany with US$30 billion, US$12 billion, US$15 billion, and US$10 billion worth of sale and leaseback activity respectively since 20007. Although these figures represent large sums of real estate, the actual share of the overall market is relatively low, at around 0.3%-0.75% of total market size for the most active markets such as US, UK and Spain. The relatively small share of sale and leaseback activity demonstrates that it will take many years, even generations, before the levels of owner occupation in many markets across the world fall to the levels in the US or UK.
Chart 13 : Sale and Leaseback Activity Relative to Market Size in Europe, 2004 - 2006
Source: DTZ Research, RREEF Research
In order to estimate the likely scale of sale and leaseback activity, three separate drivers are identified and measured for all the major markets around the world. First, the fiscal pressures on governments and corporates as an indicator of the need for such organisations to raise capital by divesting their real estate assets. Within Europe, a series of governments and corporates have been faced with significant fiscal pressures and these have been catalysts for them entering into significant sale and leaseback programmes. This pressure to redeploy the capital tied up in real estate is becoming more widespread
6 Real Capital Analytics (2007), Office Capital Trends Monthly, March 7 DTZ (2007), Money into Property Global
Countries are experiencing pressure for sale and leaseback as part of the broader outsourcing of non-core business activities.
Three main drivers of sale and leaseback activity, the first of which is “fiscal pressure”…
0.0
0.1
0.2
0.3
0.4
0.5
0.6
0.7
0.8
Sw eden Italy France Germany Netherlands UK Spain
%
0.0
0.1
0.2
0.3
0.4
0.5
0.6
0.7
0.8
Sw eden Italy France Germany Netherlands UK Spain
%
RREEF Research
12
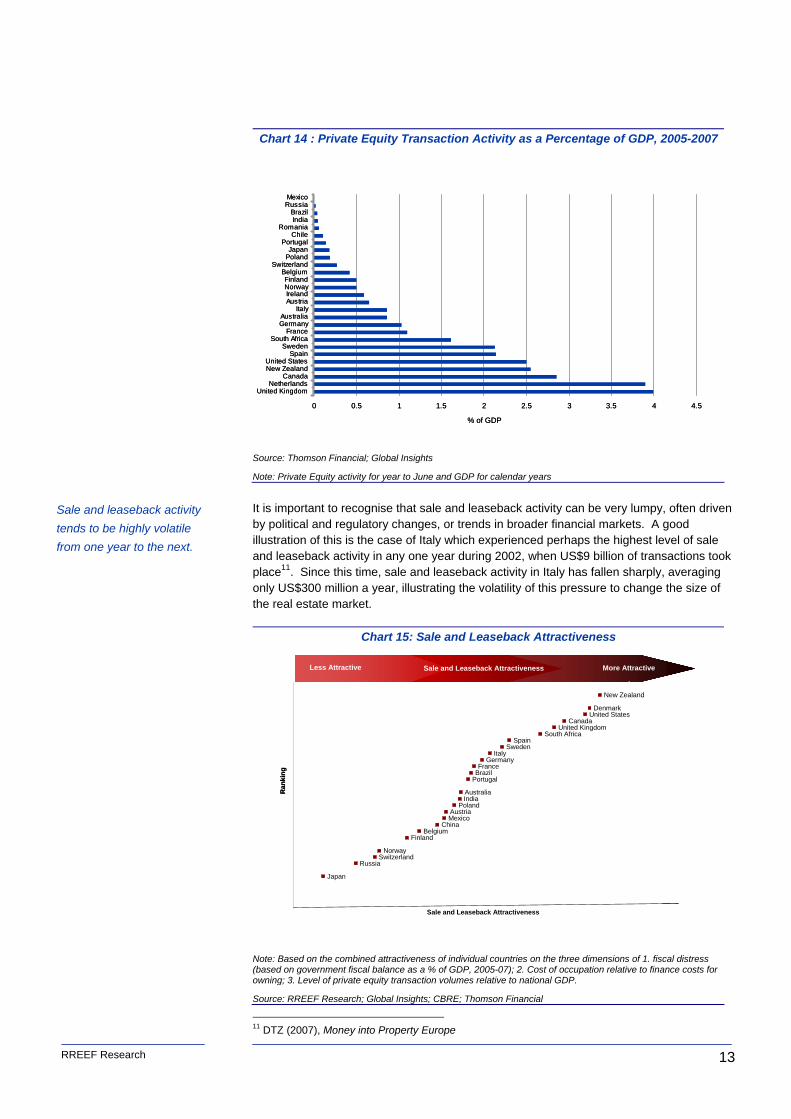
with, for instance, China Post being reported to be disposing of their non-core businesses, such as hotels, in order to make use of the capital in their core business8. The second dimension is the financial attractiveness, to occupiers, of renting compared with owner occupation. In general terms, if the cost of borrowing is higher than the cost of renting, it would tend to be sensible for occupiers to engage in selling and leasing back their real estate. In this respect, there is a series of countries, such as New Zealand, Central Europe, Australia and the US where interest rates are relatively high and occupation costs (rents) are relatively low. At the other extreme are countries such as Japan and Switzerland where there is less pressure on corporates to engage in sale and leaseback activity due to the low cost of finance and the high cost of renting. Although the ratcheting up of interest rates is likely to increase the pressure to dispose of non-core businesses, the amount of sale and leaseback activity is likely to remain relatively low in countries such as Japan and Switzerland. Beyond the conventional process of selling and leasing back real estate, a third dimension relates to the surge in the growth of “private equity” investing. This form of investing has added a further catalyst to the transfer of real estate from the corporate to commercial real estate sector. An increasing number of private equity transactions have been driven by the hard, real estate, assets that underpin the corporate9. Although private equity investing has touched most global markets, it remains concentrated on those countries where there is greater scope for shareholder activism. In the US and the UK, for instance, private equity transactions have averaged US$286 billion and US$67 billion, or 2.5% and 4% of GDP over the past three years10. This contrasts with a far smaller volume of US$21 billion (or 1% of GDP) in Germany and US$9 billion (or 0.2% of GDP in Japan). It is likely that those countries with a higher penetration by private equity will lead to a higher volume of corporate sale and leaseback activity. Based on these three components and recent levels of activity, a rating of the different countries according to the pressure for sale and leaseback is shown on Chart 15. This chart reveals three distinct types of market. First, those with greatest pressure for sale and leaseback activity that is likely to increase the value of real estate by around 0.6-0.75% each year. At the other extreme, there is a group of countries, including Japan, Russia, Switzerland and Norway where the level of sale and leaseback activity is set to be very low, at less than 0.2% each year. Between these extremes is a third category where the level of activity will be influenced by a range of political and business-specific factors such that it could range between 0.2%-0.6% each year.
8 Jones Lang LaSalle Research, Asia Pacific Daily News. 9 See for instance, PERE (July 2007), KKR eyes Macy’s, PERE (March 2007), KKR unveils US$7.3bn US retail buyout 10 Thomas Financial: Datastream
… with the second being financial attractiveness…
… and the third is the growth of private equity investing.
RREEF Research
13
Chart 14 : Private Equity Transaction Activity as a Percentage of GDP, 2005-2007
Source: Thomson Financial; Global Insights
Note: Private Equity activity for year to June and GDP for calendar years
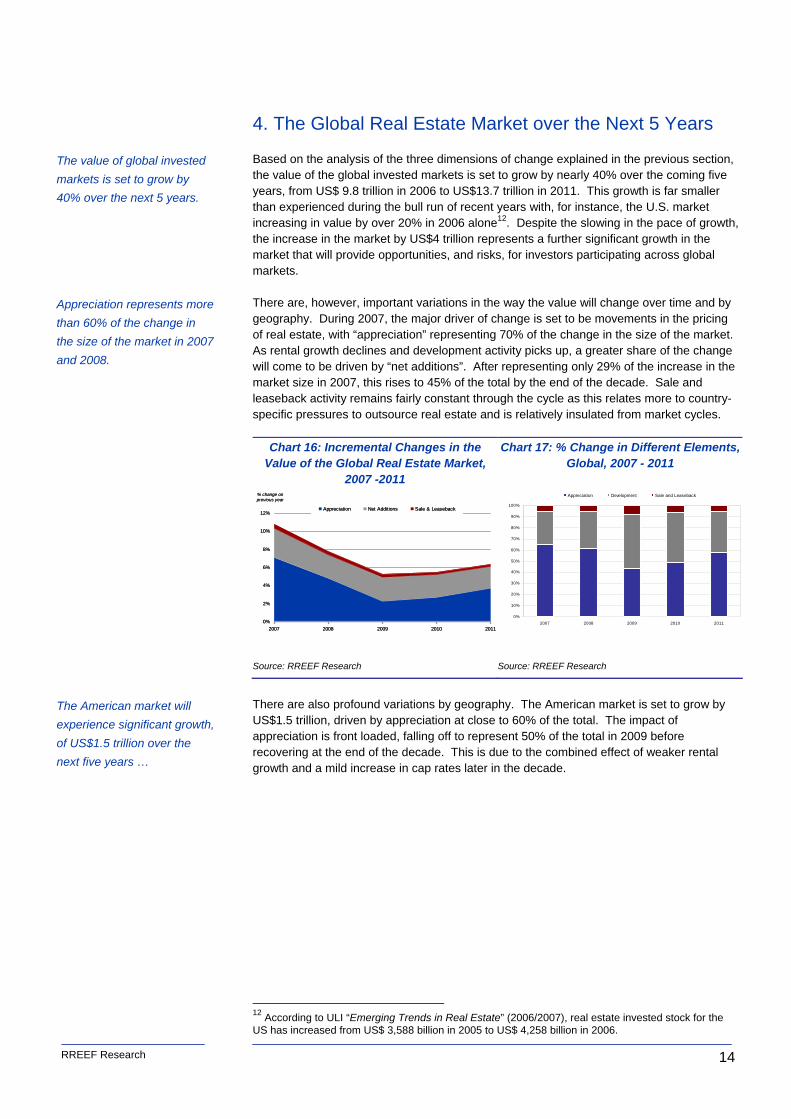
It is important to recognise that sale and leaseback activity can be very lumpy, often driven by political and regulatory changes, or trends in broader financial markets. A good illustration of this is the case of Italy which experienced perhaps the highest level of sale and leaseback activity in any one year during 2002, when US$9 billion of transactions took place11. Since this time, sale and leaseback activity in Italy has fallen sharply, averaging only US$300 million a year, illustrating the volatility of this pressure to change the size of the real estate market.
Chart 15: Sale and Leaseback Attractiveness
Note: Based on the combined attractiveness of individual countries on the three dimensions of 1. fiscal distress (based on government fiscal balance as a % of GDP, 2005-07); 2. Cost of occupation relative to finance costs for owning; 3. Level of private equity transaction volumes relative to national GDP.
Source: RREEF Research; Global Insights; CBRE; Thomson Financial
11 DTZ (2007), Money into Property Europe
Sale and leaseback activity tends to be highly volatile from one year to the next.
I
Sale and Leaseback Attractiveness More AttractiveLess Attractive
New Zealand
DenmarkUnited States
CanadaUnited Kingdom
South AfricaSpain
SwedenItaly
GermanyFrance
BrazilPortugal
AustraliaIndia
PolandAustriaMexico
ChinaBelgium
Finland
NorwaySwitzerland
Russia
Japan
Sale and Leaseback Attractiveness
Ran
king
I
Sale and Leaseback Attractiveness More AttractiveLess Attractive
I
Sale and Leaseback Attractiveness More AttractiveLess Attractive
New Zealand
DenmarkUnited States
CanadaUnited Kingdom
South AfricaSpain
SwedenItaly
GermanyFrance
BrazilPortugal
AustraliaIndia
PolandAustriaMexico
ChinaBelgium
Finland
NorwaySwitzerland
Russia
Japan
Sale and Leaseback Attractiveness
Ran
king
0 0.5 1 1.5 2 2.5 3 3.5 4 4.5
United KingdomNetherlands
CanadaNew ZealandUnited States
SpainSweden
South AfricaFrance
GermanyAustralia
ItalyAustriaIrelandNorwayFinland
BelgiumSwitzerland
PolandJapan
PortugalChile
RomaniaIndiaBrazil
RussiaMexico
% of GDP
0 0.5 1 1.5 2 2.5 3 3.5 4 4.5
United KingdomNetherlands
CanadaNew ZealandUnited States
SpainSweden
South AfricaFrance
GermanyAustralia
ItalyAustriaIrelandNorwayFinland
BelgiumSwitzerland
PolandJapan
PortugalChile
RomaniaIndiaBrazil
RussiaMexico
% of GDP
RREEF Research
14
4. The Global Real Estate Market over the Next 5 Years Based on the analysis of the three dimensions of change explained in the previous section, the value of the global invested markets is set to grow by nearly 40% over the coming five years, from US$ 9.8 trillion in 2006 to US$13.7 trillion in 2011. This growth is far smaller than experienced during the bull run of recent years with, for instance, the U.S. market increasing in value by over 20% in 2006 alone12. Despite the slowing in the pace of growth, the increase in the market by US$4 trillion represents a further significant growth in the market that will provide opportunities, and risks, for investors participating across global markets. There are, however, important variations in the way the value will change over time and by geography. During 2007, the major driver of change is set to be movements in the pricing of real estate, with “appreciation” representing 70% of the change in the size of the market. As rental growth declines and development activity picks up, a greater share of the change will come to be driven by “net additions”. After representing only 29% of the increase in the market size in 2007, this rises to 45% of the total by the end of the decade. Sale and leaseback activity remains fairly constant through the cycle as this relates more to country-specific pressures to outsource real estate and is relatively insulated from market cycles.
Chart 16: Incremental Changes in the Value of the Global Real Estate Market,
2007 -2011
Chart 17: % Change in Different Elements, Global, 2007 - 2011
Source: RREEF Research Source: RREEF Research
There are also profound variations by geography. The American market is set to grow by US$1.5 trillion, driven by appreciation at close to 60% of the total. The impact of appreciation is front loaded, falling off to represent 50% of the total in 2009 before recovering at the end of the decade. This is due to the combined effect of weaker rental growth and a mild increase in cap rates later in the decade.
12 According to ULI “Emerging Trends in Real Estate” (2006/2007), real estate invested stock for the US has increased from US$ 3,588 billion in 2005 to US$ 4,258 billion in 2006.
The value of global invested markets is set to grow by 40% over the next 5 years.
Appreciation represents more than 60% of the change in the size of the market in 2007 and 2008.
The American market will experience significant growth, of US$1.5 trillion over the next five years …
0%
10%
20%
30%
40%
50%
60%
70%
80%
90%
100%
2007 2008 2009 2010 2011
Appreciation Development Sale and Leaseback
0%
2%
4%
6%
8%
10%
12%
2007 2008 2009 2010 2011
Appreciation Net Additions Sale & Leaseback
% change on previous year
0%
2%
4%
6%
8%
10%
12%
2007 2008 2009 2010 2011
Appreciation Net Additions Sale & Leaseback
% change on previous year
RREEF Research
15
Chart 18: Incremental Changes in the
Value of the American Real Estate Market, 2007 -2011
Chart 19 : % Change in Different Elements, Americas, 2007 - 2011
Source: RREEF Research Source: RREEF Research
The market cycle is expected to be more significant in Europe, with appreciation contributing to a large share of the increase in value in 2007 and 2008 before the market starts to slow – the relative importance of appreciation falls sharply from over 70% in 2007 to under 30% in 2009 due to the easing of rent growth and the upward movement in cap rates. The surge in development activity is set to have a particularly significant impact in 2009 and 2010 when it could to represent around 50% of value change across the European market. The sale and leaseback activity is set to account for around 5-10% of the annual increase. In overall terms, the market is likely to grow by US$1,100 billion over the five years, based on appreciation of US$600bn, net additions of US$400bn and sale and leaseback of around US$100bn.
Chart 20: Incremental Changes in the Value of the European Real Estate Market,
2007 -2011
Chart 21 : % Change in Different Elements, Europe, 2007 - 2011
Source: RREEF Research Source: RREEF Research
In Asia Pacific, the market is expected to grow by US$1.3 trillion over the next 5 years, almost doubling the existing size of the market. Although this growth is driven by strong appreciation, new development also contributes another US$460 billion.
… with the European market increasing by $1.1 trillion …
… and Asia-Pacific by $1.3 trillion …
0%
10%
20%
30%
40%
50%
60%
70%
80%
90%
100%
2007 2008 2009 2010 2011
Appreciation Development Sale and Leaseback
0%
10%
20%
30%
40%
50%
60%
70%
80%
90%
100%
2007 2008 2009 2010 2011
Appreciation Development Sale and Leaseback
0%
1%
2%
3%
4%
5%
6%
7%
8%
9%
2007 2008 2009 2010 2011
Appreciation Net Additions Sale & Leaseback
% change on previous year
0%
1%
2%
3%
4%
5%
6%
7%
8%
9%
2007 2008 2009 2010 2011
Appreciation Net Additions Sale & Leaseback
% change on previous year
0%
2%
4%
6%
8%
10%
12%
2007 2008 2009 2010 2011
Appreciation Net Additions Sale & Leaseback
% change on previous year
0%
2%
4%
6%
8%
10%
12%
2007 2008 2009 2010 2011
Appreciation Net Additions Sale & Leaseback
% change on previous year
RREEF Research
16
Chart 22: Incremental Changes in the
Value of Asia Pacific Real Estate Market, 2007 -2011
Chart 23 : % Change in Different Elements, Asia Pacific, 2007 - 2011
Source: RREEF Research Source: RREEF Research
The scale of development activity and the maturing of real estate markets mean that emerging markets are set to grow most strongly over the coming five years. This is particularly the case in Asia where the fast pace of growth of China and India in particular mean that the market will grow by 160%. Latin America and Eastern Europe will also grow fast, by around 120% and 100% respectively. Compared with this, the growth rates for the mature markets are far lower, ranging from 20% in Western Europe and North America to 40% in mature Asia.
Chart 24: Changes in Value of Global Real Estate Market, by Region, 2006-2011
Source: RREEF Research
Despite the pace of this growth, the current small scale of the emerging markets and, just as significant, their limited institutionalisation means that the real estate markets will continue to be relatively small even in five years time. By 2011 these markets are expected to have grown by US$ 1.7 billion but they will still only represent 13% of the global total - up from the 7% today, but still relatively small. Although the global share for North America and Western Europe decrease in 2011, they still represent 70% of the global total.
Emerging markets are set to grow strongly, by over 100% over the next five years.
But their size will still remain relatively small.
0
1
2
3
4
5
6
North America Latin America Western Europe Eastern Europe Mature Asia Emerging Asia0%
5. Conclusions The early years of this decade were of profound importance for the global real estate industry. Most markets performed exceptionally well, and there were significant improvements in the transparency and liquidity of markets, as well as in corporate governance across the real estate industry. The size of the markets also grew rapidly, and investment activity became increasingly cross-border and “global”. With rental growth moving towards a cyclical peak and with less scope for further cap rate compression, the performance of the real estate markets is set to fall off over the coming five years. Certain markets are likely to experience significant cyclical downturns as investors realise that current levels of pricing are unsustainable given the surge of new supply and the prospect of weaker, or even negative, rental growth. Despite this reduced performance, this paper has demonstrated that the real estate market is set to continue to grow, and this will be accompanied by the ever increasing maturity and transparency of the market. As ever, these trends are not uniform with significant variations from country to country in terms of both the timing and nature of the growth. The fastest pace of growth is expected to be in the emerging countries of Asia, Eastern Europe and Latin America, but the more significant increases in overall value will continue to be in the established markets of North America, Western Europe and Japan. Much of this growth will be front-loaded due to the continued importance of appreciation in 2007 and 2008, and net additions will tend to become more significant towards the end of the decade. These variations in the dimensions of the growth of the market are of great importance to investors as they develop their strategies across the increasingly global real estate market. It is clear that the estimates provided in this paper need to be treated with caution as they are subject to a series of assumptions and projections about the drivers of value. There is also a series of external factors that could significantly impact the growth of the markets. On the one hand, there is the possibility that government initiatives could, for instance, increase the amount of sale and leaseback activity greater than outlined in the paper. On the other, there is a risk of a reversal in the recent high levels of financial market liquidity, leading to potentially significant loss of value for many real estate markets. Despite these caveats and these risks, this short paper provides important insights into the dimensions of change in the market that should be a critical consideration when formulating real estate investment strategies.
The performance of the real estate markets is set to fall off over the coming 5 years...
… but the global real estate market is set to continue to grow with variations in the timing and nature of growth around the world..
RREEF Research
18
ANALYST CERTIFICATION The views expressed in this report accurately reflect the personal views of the undersigned lead analyst. In addition, the undersigned lead analyst has not and will not receive any compensation for providing a specific recommendation or view in this report. (Signed) Peter Hobbs
1 Appold Street Broadgate London, EC2A 2UU United Kingdom Tel: +44 20 7545 8000 Eschborn
Mergenthalerallee 73-75 65760 Eschborn Germany Tel: +49 69 71704 906 San Francisco
101 California Street 26th Floor San Francisco, CA 94111 United States
Tel: +1 415 781 3300 Chicago
875 N. Michigan Avenue 41st Floor Chicago, IL 60611 United States Tel: +1 312 266 9300 New York
280 Park Avenue 40th Floor New York, NY10017-1270 United States Tel: +1 212 454 3900
RREEF Real Estate Research A member of the Deutsche Bank Group 1 Appold Street, Broadgate, London EC2A 2UU Tel: +44 20 7545 8000 Peter Hobbs Global Head of Research +44 20 7547 4855 Europe The Americas Brenna O’Roarty Alan Billingsley Director Director +44 20 7545 6099 +1 415 262 2017 Maren Väth Hope Nadji Vice President Director +49 69 717 04 204 +1 415 262 2022 Henry (Wei) Chin Brooks Wells Assistant Vice President Director +44 20 7545 6611 +1 212 454 6437 Lonneke Löwik Stephen Newbold Assistant Vice President Vice President +44 20 7545 6328 +1 415 262 2040 Ermina Topintzi Assistant Vice President +44 20 7545 6674
Susannah Hunter Assistant Vice President +44 20 7547 3305 Hong Kong
Tan Yen Keng Vice President +852 2203 8062
Publication Address: RREEF Limited 1 Appold Street Broadgate London EC2A 2UU Internet: www.rreef.com Additional information is available upon request