1 RRR Degradation and Gas Absorption in the Electron Beam Welding Area of High Purity Niobium W. Singer, X. Singer, J. Tiessen Deutsches Elektronen-Synchrotron DESY, Notkestrasse 85, 22607 Hamburg, Germany H.M. Wen Institute of Electrical Engineering, Chinese Academy of Sciences, Beijing 100080, China F. Schölz Heraeus, Heraeusstrasse 12-14, 63450 Hanau, Germany Abstract. Experiences concerning RRR degradation and gas absorption of high purity niobium welded at different electron beam (EB) facilities are summarized. The oxygen and nitrogen content is increased as a rule at the welding seam. The absorption of hydrogen takes place not directly at the welding seam but in the heat-affected area. The RRR degradation is moderate, if the total pressure is better than 5×10 -5 mbar and the preparation is done under clean condition. A series of welding was done in the new DESY EB facility, which was specifically designed to meet the requirements for the welding of niobium cavities for TESLA. High vacuum (between 2×10 -8 and 2×10 -6 mbar) allowed improving the niobium purity at the welding seam, in which the RRR were increased from 350 to ca. 370−380. The distribution of RRR, gases, grain size and thermal conductivity in the welding area are analyzed. The repair of a burned hole in the cavity is also discussed. I. INTRODUCTION The TESLA (TeV Energy Superconducting Linear Accelerator) design is based on superconducting technology[1]. Presently, the standard fabrication of niobium cavities for TESLA is to weld all of the parts together by electron beam in a vacuum chamber [2]. Performance degradation due to weld imperfections has been observed in some cavities for the TESLA test facility (TTF) [3]. The average gradient of TTF has been increased from ~18MV/m in the first series to above 25 MV/m in the third production series. The preparation improvement and optimization of EB welding parameters has made a big contribution to this progress [4]. It is well known that the purity of niobium can be indicated by the Residual Resistivity Ratio(RRR)[5,6]. The RRR can also give information about the thermal conductivity [7,8], which is one of the critical parameters for cavity performance too. TESLA Report 2003-07
Transcript
1
RRR Degradation and Gas Absorption in the Electron Beam Welding Area of High Purity
Abstract. Experiences concerning RRR degradation and gas absorption of high purity niobium welded at different electron beam (EB) facilities are summarized. The oxygen and nitrogen content is increased as a rule at the welding seam. The absorption of hydrogen takes place not directly at the welding seam but in the heat-affected area. The RRR degradation is moderate, if the total pressure is better than 5×10⁻⁵ mbar and the preparation is done under clean condition. A series of welding was done in the new DESY EB facility, which was specifically designed to meet the requirements for the welding of niobium cavities for TESLA. High vacuum (between 2×10⁻⁸ and 2×10⁻⁶ mbar) allowed improving the niobium purity at the welding seam, in which the RRR were increased from 350 to ca. 370−380. The distribution of RRR, gases, grain size and thermal conductivity in the welding area are analyzed. The repair of a burned hole in the cavity is also discussed.
I. INTRODUCTION
The TESLA (TeV Energy Superconducting Linear Accelerator) design is based on superconducting technology[1]. Presently, the standard fabrication of niobium cavities for TESLA is to weld all of the parts together by electron beam in a vacuum chamber [2]. Performance degradation due to weld imperfections has been observed in some cavities for the TESLA test facility (TTF) [3]. The average gradient of TTF has been increased from ~18MV/m in the first series to above 25 MV/m in the third production series. The preparation improvement and optimization of EB welding parameters has made a big contribution to this progress [4].
It is well known that the purity of niobium can be indicated by the Residual Resistivity Ratio(RRR)[5,6]. The RRR can also give information about the thermal conductivity [7,8], which is one of the critical parameters for cavity performance too.
TESLA Report 2003-07
2
Therefore, it is reasonable to qualify the EB welding by measuring the RRR [9]. The experience shows that the RRR degrades mostly in the welding region. One of the main points of investigation was whether it is possible to improve the purity of Nb in the welding region under definite conditions.
A series of EB welding samples of different facilities in several firms have been investigated. The new EB welding facility has been recently installed at DESY. High cleanliness and unique pressure gives new opportunities for Nb investigation.
II. RRR DEPENDENCE ON IMPURITIES
Niobium homogeneity and purity play an important role for the RF application in order to provide the thermal stability of the cavity[9]. The main interstitially dissolved impurities that reduce the RRR and the thermal conductivity are oxygen, nitrogen, hydrogen and carbon. The influence of hydrogen on the RRR is not so significant, but the content of hydrogen should be kept small (less than 3-5 µg/g) to prevent the hydride precipitation and degradation of the Q-value under certain cool-down conditions[10].
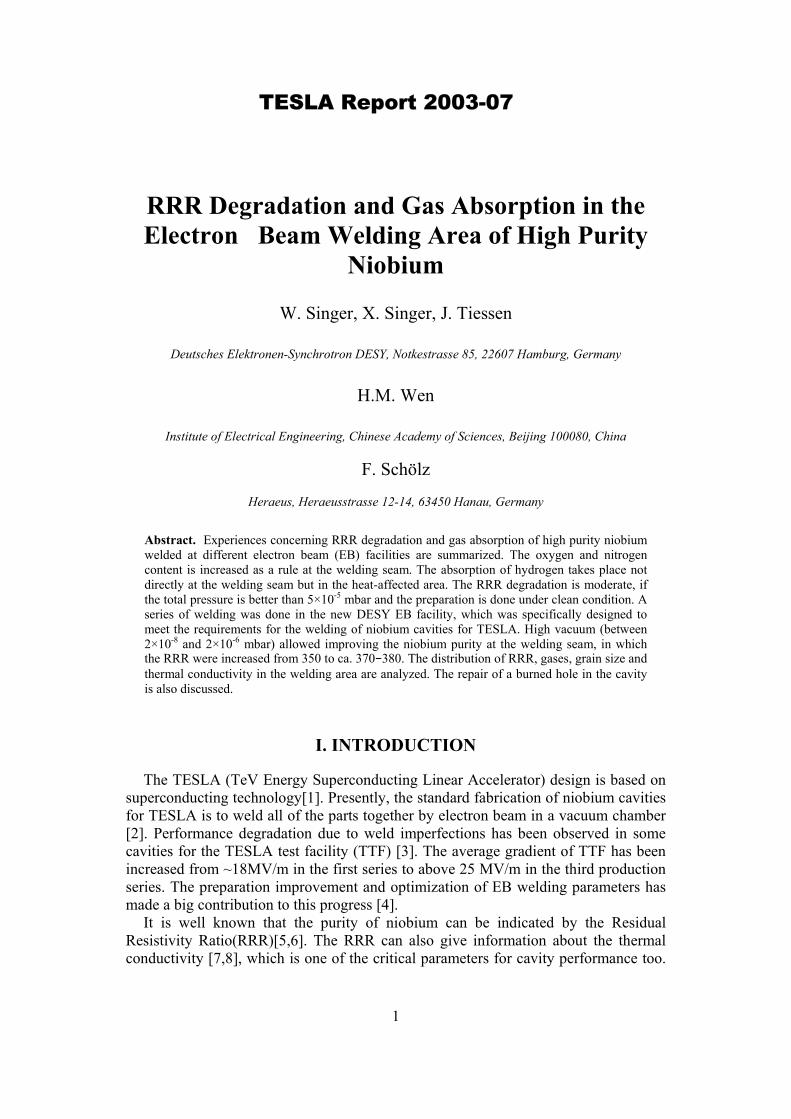
There are several empirical formulas, which describe the influence of different impurity elements on RRR. For example, RRR dependence on oxygen and nitrogen contents can be calculated as reported in [11, 12] and the results are shown in Figure 1 (it is assumed that carbon content = 2 wt. ppm). It can be easily seen that for RRR ≈ 300 the content of oxygen and nitrogen is close to 6 wt. ppm.
∑= ∂∂
+= 4
1
)10(
)300(
ii
i
i CC
K
KRRRρρ
ρ (1)
cmK •Ω×= −9107.8)10(ρ cmK •Ω×= −51046.1)300(ρ .
0
100
200
300
400
500
600
700
800
900
0 4 8 12 16 20 24 28
O, wt. ppm
RRR
0 wt. ppm N 2 46 8 1012 14
FIGURE 1. RRR dependence on oxygen and nitrogen contents
3
It depends on conditions like temperature and partial pressure influencing the gas
content in Nb during EB welding. The diffusion of gases and the kinetics of the process are of great importance too. The gas content in the steady state case can be calculated, for example, from Formulas (2), (3) [13][14]. The calculated result is shown in Figure 2. It can be seen that at a high temperature of 2400°C the oxygen content can become less than 1 wt. ppm at reasonable pressures. The situation is similar for nitrogen. If the temperature is less elevated (for example 1000°C), the content of gases remains rather high, being independent on the partial pressure. The EB welding is a fast process; the temperature goes up and down rapidly. The temperature is very high at the welding seam itself but the temperature in the heat affected area depends on the welding parameters, material thickness, thermal conductivity of material and so on. The process of absorption and desorption of gases during EB welding is very complex and in any case is not in equilibrium. It is in principle possible but difficult to make precise calculation of resulting RRR and RRR distribution. It is more reasonable to use the experimental results.
III. RRR MEASUREMENT ON HIGH PURITY NIOBIUM SAMPLES EB WELDED BY DIFFERENT FIRMS
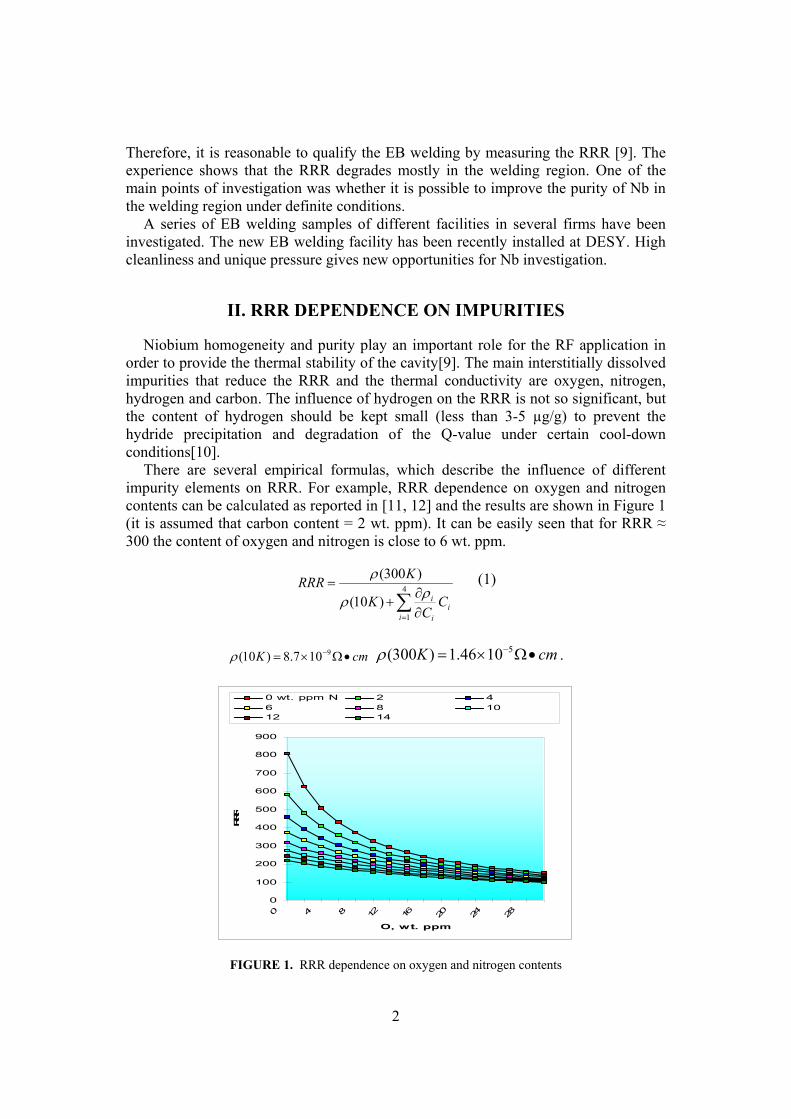
The RRR distribution and RRR dependence on pressure in the EB welded samples from different firms: Dornier, Zanon, ACCEL are shown in Figures 3 –5. The RRR degradation takes place in all cases, if the total pressure is in the range of 10-3 − 10-4 mbar. For pressure between 5×10⁻⁵ and 10-5 mbar the RRR degradation is significantly smaller. Such vacuum is achievable in the industrial equipments and is recommended for the fabrication of TTF cavities.
FIGURE 3. RRR in the welding seam and 20 mm away versus pressure in the chamber during EB welding (Fa. Dornier 1994).
FIGURE 4. RRR in the welding seam and 20 mm away versus pressure in the chamber during EB welding (Fa. Zanon 1995).
FIGURE 5. RRR in the welding seam versus distance from the welding seam (welded at pressure 2×10⁻⁵ mbar, ACCEL 1996)
5
IV. MEASUREMENT ON THE HIGH PURITY NIOBIUM SAMPLES WELDED AT DESY’S EB FACILITY
4.1 DESY Electron Beam Welding Machine
It was very desirable to check the RRR degradation of high purity Nb in the EB welding chamber with ultra high vacuum (total pressure < 10-5 mbar). This opportunity becomes realistic after the installation of a new EB welding equipment at DESY, which can be operated in the pressure range of 10-5-10-8 mbar (Figure 6). The main technical data of DESY equipment are listed in Table 1.
Table 1 Specifications of DESY EB Facility
Voltage 70 - 150 kV Beam power max. 15 kW Beam current 0 bis 100 mA Chamber size 3.3m × 1.4m × 1.6m (ca.
7.4 m³) Vacuum Ca. 5×10⁻⁶ - 2×10⁻⁸ mbar
Pumping time ca. 20 min, reach 3×10⁻⁶ mbar
2 Cryogenic Pumps ca. 2 × 10.000 l/s Displacement along
the X-Axes ca. 1.4 mm
FIGURE 6. DESY electron beam welding machine
4.2 Samples Preparation
The strips for welding were taken from Nb sheet with rather uniform RRR= 355 ± 5. The clamping system and one of the samples are shown in Figure 7. The thickness at weld area was 1.8 mm. The weld speed was ca. 8 mm/sec.
The weld procedure consists of: tacking, welding with 50% penetration (circle raster), welding with full penetration (circle raster). Five samples have been welded at DESY EB facility under the pressures of 1×10⁻⁵, 2.0×10⁻⁶, 2.3×10⁻⁷, 6.5 ×10⁻⁸, 2.3×10⁻⁸ mbar respectively. The principle of the sample extraction for RRR measurement can be seen in Figure 8.
6
FIGURE 7. Clamping system for EB welding and an
example of welded Niobium Strips
FIGURE 8. Scheme of the RRR samples cut off
4.3 RRR Measurement
If we take into consideration only the welding seam itself (Figure 9), we can see that the RRR degradation started from the pressure > ca. 5 × 10⁻⁶ mbar. At the pressure below 5×10⁻⁶ mbar, the RRR in the welding seam can be even improved from ca. 350 up to 370-380. The improvement of RRR is maximal for the pressure region 10-8 - 5×10⁻⁷ mbar. It is interesting that the RRR improvement almost does not depend on the pressure in this region. This means that the effort to reach the vacuum better than 5×10⁻⁷ mbar can be spared at least for above-mentioned welding parameters.
On the other hand it is easy to realize that the RRR degradation takes place in the heat-affected area, as shown in Figure 10. It can be seen that RRR degradation is maximal in the region ca.10−15 mm away from the welding seam (from 350 to 310−330).
The correlation between the RRR and the hydrogen distribution in the welded area, helps to understand the reason of the RRR degradation.
FIGURE 9. RRR in the welding seam versus Pressure
310
320
330
340
350
360
370
380
-25 -20 -15 -10 -5 0 5 10 15 20 25position (mm)
RR
R
2.3E-8 mbar
2.0E-6 mbar
2.3E-7 mbar
6.5E-8 mbar
Reference
FIGURE 10. RRR in the EB welding area versus distance from the welding seam at different pressures of DESY EB facility.
7
4.4 Hydrogen Distribution in the Welded Area
The hydrogen content was measured by heat extraction in the welding seam as well as in the heat- affected area. Good correlation between RRR and hydrogen content was observed, as shown in Figure 11. Reduction of RRR is followed by the enhancement of hydrogen content. Evidently the hydrogen absorption takes place not directly in the welding seam, but in the areas with rather moderate temperatures (heat-affected area). Pressure-concentration isotherms of hydrogen for Nb in steady state condition (Figure 12) show that at temperatures above 500K and under the common partial pressures of hydrogen, the content of hydrogen in Nb becomes less than 1 wt ppm. This is normally a value of the hydrogen concentration in properly annealed high purity Nb. At lower temperatures, the absorption of hydrogen will take place. Probably the heat-affected area fulfills the last conditions, which results in enhanced hydrogen content.
The enhanced hydrogen content at the welding area is in good agreement with results of reference[15], where the hydrogen disease of Nb cavities was explored. It was pointed out that the welded area is susceptible to hydrogen disease even if the chemical treatment of the cavity was done correctly.
Unfortunately it is very difficult to measure the temperature distribution in the welding area. Indirect information about the temperature at different locations can be extracted from grain size distribution (Figure 15) because the relationship between the grain size and the annealing temperature for high purity Nb is well-known[16]. For example, the grain size distribution allows to conclude that the temperature did not exceed 800°C in the material located farther than 10 mm away from the middle of welding seam.
FIGURE 11. RRR distribution in comparison with hydrogen content in welding area (Pressure 2.3x10⁻⁸ mbar).
FIGURE 12. Pressure-concentration isotherms for hydrogen in Nb in steady state condition.
8
The partial pressures during welding are shown in Figure 13 (CERCA EB chamber) and Figure 14 (DESY EB chamber). It can be pointed out that in the DESY EB chamber the partial pressure of water is much lower than that in CERCA EB chamber, and the pressure of the oxygen in the DESY EB chamber is very low. The main point is that, in all cases the start of welding was accompanied by the significant rising of the hydrogen partial pressure in the chamber. Some speculations can be done to understand the reason to the increase of the hydrogen partial pressure during starting of the welding. The partial pressure of the water reduces at the same time as it can be seen in Figure 14. Probably the electron beam provides the decomposition of water molecules, which produces a lot of hydrogen.
FIGURE 13. The partial pressure in the EB chamber (CERCA) during welding of Nb 300 sample
FIGURE 14. Partial pressure in the EB chamber (DESY: 6.5×10⁻⁸ mbar) during welding of Nb 300 sample.
9
4.5 Behavior of Thermal Conductivity
One basic limitation of the maximum field in a superconducting cavity is thermal
instability. The heat produced on the inner cavity surface has to be guided through the cavity wall to the superfluid helium bath. The thermal conductivity of niobium is a critical parameter of this process. At definite temperature it scales approximately with the RRR and grain size and can be estimated by the following formula [8]:
3
32
12295 1
)exp(1)(),,(
−−
••
+••
+
•+
••=
TGBTyDTa
TrLyRGrT
R
KR
ρλ (5)
where )(yRKK
en
es = ; TTy c /•=α ; Rr -RRR; G - grain size. G is 50-2000 µm as
shown in Figure 15.
Table 2 The parameters for thermal conductivity calculation
Parameter Best fit values
L 2.05 ×10⁻⁸ W/K2
A 7.52×10⁻⁷ m/WK α 1.53
B 4.34×10³ W/m2K4
FIGURE 15. Microstructure of the EB welding area. The grain size G=50-2000 µm
1/D 2.34×10² mK3/W
The best fit values for the parameters were found in Reference [8] and listed in
Table 2. An example of the thermal conductivity distribution calculated at the temperature
of 4.2K for one of the samples welded at the pressure of 2.3 × 10⁻⁷ mbar is shown in Figure 16. The thermal conductivity reaches the minimum value not directly at the welding seam, but in the heat-affected area ca. 15 mm away from it. It is well-known that power dissipation due to Joule heating is proportional to B2, where B is the surface magnetic field. Distribution of the magnetic field from equator to the iris on the surface of the TESLA cavity is shown in Figure 17. The magnetic field has the maximum value not only at the equator but also in the rather big region close to the equator including the heat affected area. Comparing the data of Figure 16 and 17, it is easy to conclude that the thermally affected area is more critical for cavity thermal breakdown than the EB welding seam itself.
10
FIGURE 16. Example of thermal conductivity behavior in EB welding area calculated at 4.2K for samples welded at pressure 2.3×10⁻⁷ mbar.
FIGURE 17. Distribution of the magnetic and electrical field from the equator to the iris on the surface of the TESLA cavity.
V. CAVITY WITH THE REPAIR OF A BURNED HOLE
During the fabrication of TTF cavities, some holes were burned through during EB
welding, as shown in Figure 18. The hole can be repaired and a rather smooth surface can be attained. But the question remains, from the material purity’s point of view, how critical such repair will be. For example, in the cavity C43, a hole was burned. After that, it was repaired by EB welding. In the RF test, the cavity reached the maximal accelerating gradient of 13MV/m. The bad cell was identified during mode measurement, as shown in Table 3. T-Mapping allowed finding the quench location. The repaired hole caused a quench.
2&8 27.97 Power 3&7 31.81 Power 4&6 30.21 Power 5 13.18 Breakdown Weld defect
Some samples with artificially-burned hole were prepared at CERCA. The nitrogen, oxygen and hydrogen distributions in the EB welding region with the burned hole were investigated, as shown in Figures 19-21. A lot of nitrogen and oxygen is absorbed in the area of the repaired hole, while the hydrogen absorption during welding takes place not directly in the region of the repaired hole, but in the heat-affected area. It is remarkable that the oxygen and nitrogen content exceeds the normal value by the factor of 5−10 and the hydrogen content almost by the factor of 100. Not only the burned hole itself, but also the areas close to it are contaminated by oxygen, nitrogen and hydrogen. In the samples 3 and 5, which were cut at the distance of about 10 mm away from the burned hole, the content of these gases are still enhanced.
The presented data allow to conclude that the repair of the burned hole is critical from the gas contamination point of view. The rather big area around the hole should be removed and replaced by a disk of high purity Nb before new EB welding can be done.
FIGURE 21 Hydrogen distribution in the EB welding with burned hole
SUMMARY
1. The niobium purity in the EB welding seam can be improved by keeping the
vacuum in the chamber better than 5x 10⁻⁶ mbar. 2. During EB welding, the RRR degradation takes place in the heat-affected area
even for the vacuum of 10-6-10-8 mbar. This area is more critical for cavity performance than the welding seam itself.
3. Repair of a burned hole is critical because of oxygen, nitrogen and hydrogen contamination around the hole.
ACKNOWLEDGMENTS
Many thanks to A. Schmidt, V. Sousa, D. Vermeulen, U. Wenzel for operating the DESY EB weld equipment, and to A. Brinkmann for measuring of partial pressure at CERCA EB chamber.
REFERENCES
1 Brinkmann, R., Flöttmann, K., Rossbach, J., Schmüser, P., Walker, N., Weise, H., TESLA Technical Design Report, DESY 2001-11, Hamburg, Germany.
2 Proch, D., Cost Reduction in Cavity Fabrication,, Proceedings of the 10th Workshop on RF Superconductivity, Tsukuba, Japan, September 6-11, 2001
3 Brinkmann A., Gössel A., Möller, W.-D., Pekeler, M., Proch, D., Proceedings of 8th Workshop on RF Superconductivity, October 6-10, 1997, Italy, pp.452-456
13
4 Floettmann K., The TESLA Linear Collider and X-Ray FEL, Proceedings of LINAC 2002, Gyeongju, Korea, Auguest 19-23, 2002, URL http://linac2002.postech.ac.kr/db/proceeding/TU101.PDF
5 Singer, W., Proch, D., Proceedings of the 7th workshop on RF superconductivity, October 1995, Gif sur Yvtte, France, pp.547-550
6 Wen, H.M., Singer, W., Proch, D., TESLA Report 98-02(1998), DESY, Hamburg, Germany, URL http://tesla.desy.de/ new_pages / TESLA/TTFnot98.html
7 Singer, W., Proch, D., Quality Control of Nb for TESLA Superconducting Cavities, Proceedings of the XV Conference on Charged Particles Accelerators, State Research Center of Russia, Institute for High Energy Physics, Protvino, Oct. 22-24, 1996, URL http://dbserv.ihep.su/~pubs/aconf96/ps/c96-124.pdf
8 Koechlin, F., Bonin, B., Parametrisation of the Niobium Thermal Conductivity in the Superconducting State, CEA, DSM/DAPNIA, C.E. Saclay, 91191 Gif sur Yvette, France
9 Padamsee, H., Knobloch, J., Hays, T., RF Superconductivity for Accelerators, John Willey & Sons, Inc., New York, 1998, p.115
10 Knobloch, J., Quality Degradation of Niobium RF Cavities due to Hydrogen Contamination-the Q Virus, presented at this workshop
11 Singer, W., Some Aspects of Diffusion in Niobium by High Temperature Gettering, TESLA Report, 1996, URL http://tesla.desy.de/new_pages/TESLA/ TTFnot96.html
12 Hörmann, M., The Production of High Thermal Conductivity Niobium on a Technical Scale for High Frequency Superconductors, Heraeus, Hanau (1988)
13 Hoery, G., Speck, H., Fromm, E., Jehn, H., Gases and Carbon in Metals, Max-Planck-Institut fuer Werkstoffwissenschaften, Stuttgart, Germany, ISSN0344-8401, 1981, Nr.5-8
14 Schulze, K., Bach, O., Lupton, D., Schreiber, F., Purification of Niobium, Niobium Proceedings of the International Symposium(Edited by Harry Stuart), San Francisco, California, November 8-11, 1981, pp. 163-224
15 Knobloch, J., Padamsee, H., Proceedings of the Eighth Workshop on RF Superconductivity, Abano Terme(Padova), Italy, October 6-10, 1997, pp.434-439
16 Brinkmann, A., Hui, D., Kaiser, H., Proch, D., Singer, W., Singer, X., Proceedings of 9th Workshop on RF Superconductivity 1999, Los Alamos, November 1-5, 1999, pp.103-108


![Nelli rrr [autosaved]](https://static.documents.pub/doc/80x56/5487750bb4af9fa00d8b545b/nelli-rrr-autosaved.jpg)


