52
Fatal Collisions 2008-2012 Vehicle Factors 4th April 2016
Fatal Collisions 2008-2012
Vehicle Factors
4th April 2016

Document: Record Control Rev C This document is uncontrolled if printed or viewed outside the Document Control Database Page 2 of
52 Issued on 11/07/2012 Originator: ARegan Issued by: Brian Farrell
2
Table of Contents
Executive Summary 3
Section 1 Introduction 10
Section 1.1 Background to Report 10
Section 1.2 Number of Fatal Collisions and People Killed Under Review 12
Section 1.3 Person Deemed Culpable for the Collision 13
Section 2 All Vehicles Involved: Type and Age 15
Section 2.1 Age of Motorised Vehicle Involved for Period 2008-2012 15
Section 2.2 Type of Vehicle Involved 17
Section 3 Conclusions of PSV Inspectors Report of Motorised Vehicle 22
Section 3.1 PSV Reports All Vehicles 23
Section 3.2 PSV Report of Vehicle Driven by Culpable Person 25
Section 4 Vehicle Factors Recorded in PSV Report 28
Section 4.1 Vehicle Factors Noted All Collisions 28
Section 4.2 Vehicle Factors Noted All Motorised Collisions 30
Section 5 Vehicle Factors as a Contributory Factor all Motorised Vehicle
Collisions
32
Section 5.1 Contributory Vehicle Factors 32
Section 5.2 Contributory Vehicle Factors by Type of Collision Involved 34
Section 6 Tyre Condition 35
Section 6.1 Tyre Condition on All Motorised Vehicles Assessed 35
Section 6.2 Tyre Condition as a Contributory Factor to Collision 36
Section 7 Other Contributory Vehicle Factors 43
Appendix 44

Document: Record Control Rev C This document is uncontrolled if printed or viewed outside the Document Control Database Page 3 of
52 Issued on 11/07/2012 Originator: ARegan Issued by: Brian Farrell
3
Executive Summary
Background to Report
Over the time period 2008 to 2012, 983 fatal collisions occurred on Irish roads
claiming the lives of 1,077 people. This report examines 867 of the fatal
collisions which occurred during this time period specifically focusing on the
vehicle and associated vehicle factors which may have contributed to the
collision.
The road collision database in Ireland is created using a form called a C(T)68
forwarded to the Road Safety Authority (RSA) from An Garda Síochána. The
information provided in this form is based on preliminary information collected
at the scene of a collision and does not constitute the findings of the final
investigation. The RSA issues reports regularly using the data contained in
this database as the best available representation of fatal and injury
collisions.
However, this vehicle factors report is based on an analysis of the completed
Garda investigation file where the full circumstances of the collisions are
available. Access was granted by An Garda Síochána to the completed
Investigation File produced for each collision. The file contains two main
reports:
1. An Garda Síochána Investigation Report
2. Forensic Collision Investigation Report (FCI)
The RSA collected the data in the Garda National Traffic Bureau. This report
provides an analysis of the data by collision, by vehicle and by contributory
factor. Therefore, the figures and totals will change depending on the
category.
Vehicle Factors Noted in All Collisions
Data for all vehicle factors (which may or may not have contributed in full or
part to the overall outcome of the collision) were extracted from the FCI
report. These factors include the condition of tyres, brakes, lights, steering

Document: Record Control Rev C This document is uncontrolled if printed or viewed outside the Document Control Database Page 4 of
52 Issued on 11/07/2012 Originator: ARegan Issued by: Brian Farrell
4
etc. These factors in some instances are highlighted as contributory factors to
the collision due to the effect they may have had on the control of the vehicle. 1
Of the 867 fatal collisions analysed, vehicle factors were noted in 121 (14%)
collisions which may or may not have contributed in full or part to the crash.
While a vehicle factor may have been present it may not have rendered the
vehicle defective or un-roadworthy. However, the factor may have been
significant enough to have contributed to the collision. Of all vehicle factors
noted in all 867 collision (Table 1), the largest single factor was tyres (8.7%).
Table 1. All Vehicle Factors, All Collisions
N %
Tyres 75 8.7
Brakes 18 2.1
Steering 4 0.5
Suspension 3 0.3
Lights 2 0.2
Windows - Vision Obscured 2 0.2
Mirrors 1 0.1
Stolen/U.T. Vehicle 1 0.1
Other 15 1.7
NR 33 3.8
None 713 82.2
TOTAL 867 100.0
* NR is not recorded as no PSV report in file or not conducted due to hit and run, vehicle
condition etc
1 In some circumstances a driver may not have lost control of the vehicle on a corner or in wet
conditions, for example, if the condition of the tyres or steering was good. However, if the tyres
are balding or defective this renders control of the vehicle much more difficult.
Document: Record Control Rev C This document is uncontrolled if printed or viewed outside the Document Control Database Page 5 of
52 Issued on 11/07/2012 Originator: ARegan Issued by: Brian Farrell
5
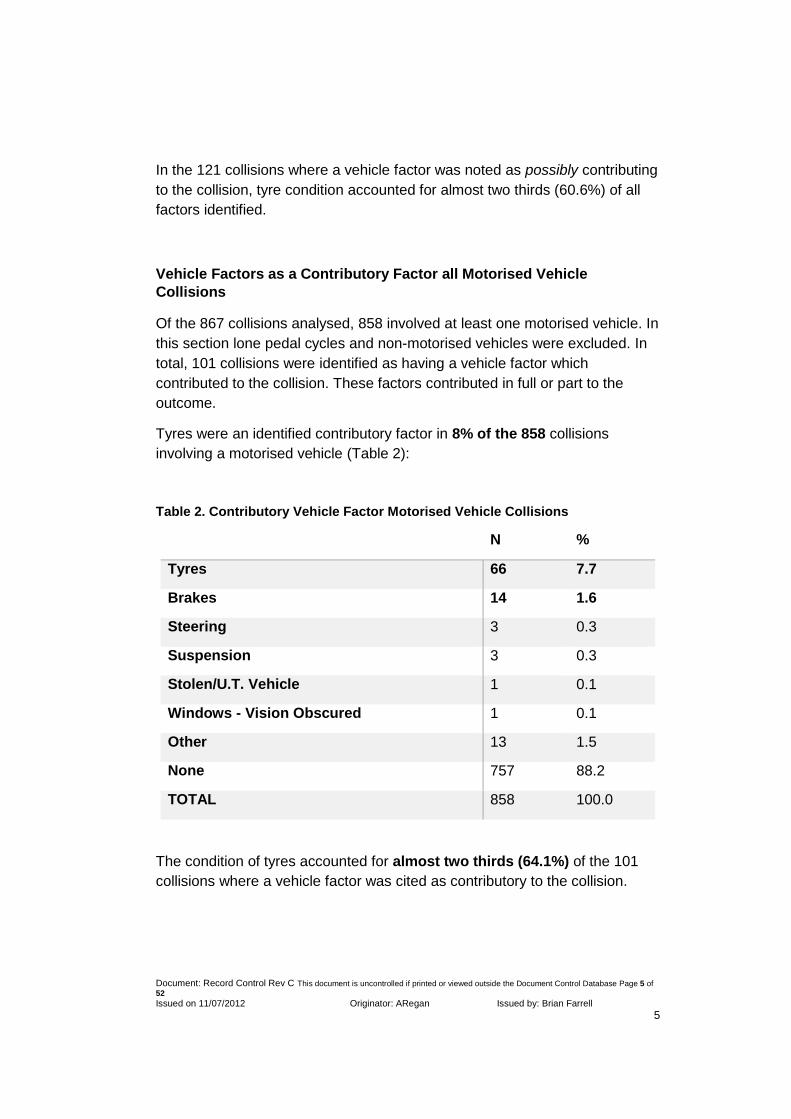
In the 121 collisions where a vehicle factor was noted as possibly contributing
to the collision, tyre condition accounted for almost two thirds (60.6%) of all
factors identified.
Vehicle Factors as a Contributory Factor all Motorised Vehicle
Collisions
Of the 867 collisions analysed, 858 involved at least one motorised vehicle. In
this section lone pedal cycles and non-motorised vehicles were excluded. In
total, 101 collisions were identified as having a vehicle factor which
contributed to the collision. These factors contributed in full or part to the
outcome.
Tyres were an identified contributory factor in 8% of the 858 collisions
involving a motorised vehicle (Table 2):
Table 2. Contributory Vehicle Factor Motorised Vehicle Collisions
N %
Tyres 66 7.7
Brakes 14 1.6
Steering 3 0.3
Suspension 3 0.3
Stolen/U.T. Vehicle 1 0.1
Windows - Vision Obscured 1 0.1
Other 13 1.5
None 757 88.2
TOTAL 858 100.0
The condition of tyres accounted for almost two thirds (64.1%) of the 101
collisions where a vehicle factor was cited as contributory to the collision.
Document: Record Control Rev C This document is uncontrolled if printed or viewed outside the Document Control Database Page 6 of
52 Issued on 11/07/2012 Originator: ARegan Issued by: Brian Farrell
6
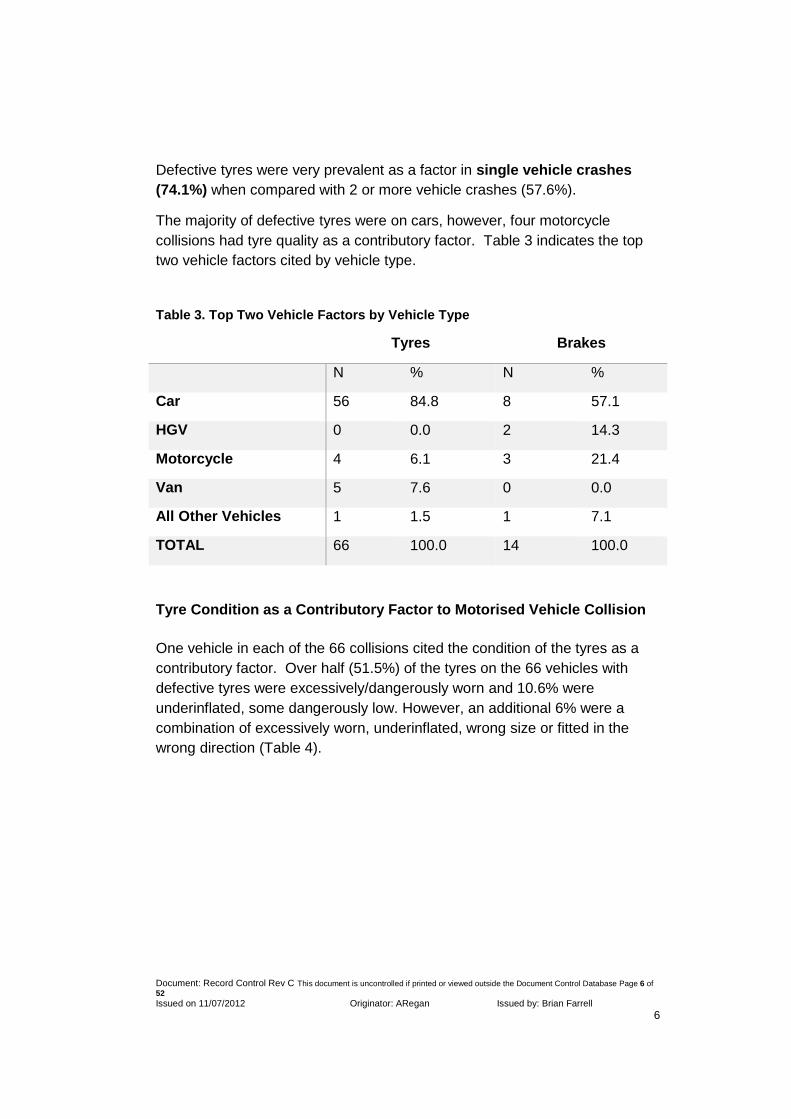
Defective tyres were very prevalent as a factor in single vehicle crashes
(74.1%) when compared with 2 or more vehicle crashes (57.6%).
The majority of defective tyres were on cars, however, four motorcycle
collisions had tyre quality as a contributory factor. Table 3 indicates the top
two vehicle factors cited by vehicle type.
Table 3. Top Two Vehicle Factors by Vehicle Type
Tyres Brakes
N % N %
Car 56 84.8 8 57.1
HGV 0 0.0 2 14.3
Motorcycle 4 6.1 3 21.4
Van 5 7.6 0 0.0
All Other Vehicles 1 1.5 1 7.1
TOTAL 66 100.0 14 100.0
Tyre Condition as a Contributory Factor to Motorised Vehicle Collision
One vehicle in each of the 66 collisions cited the condition of the tyres as a
contributory factor. Over half (51.5%) of the tyres on the 66 vehicles with
defective tyres were excessively/dangerously worn and 10.6% were
underinflated, some dangerously low. However, an additional 6% were a
combination of excessively worn, underinflated, wrong size or fitted in the
wrong direction (Table 4).
Document: Record Control Rev C This document is uncontrolled if printed or viewed outside the Document Control Database Page 7 of
52 Issued on 11/07/2012 Originator: ARegan Issued by: Brian Farrell
7
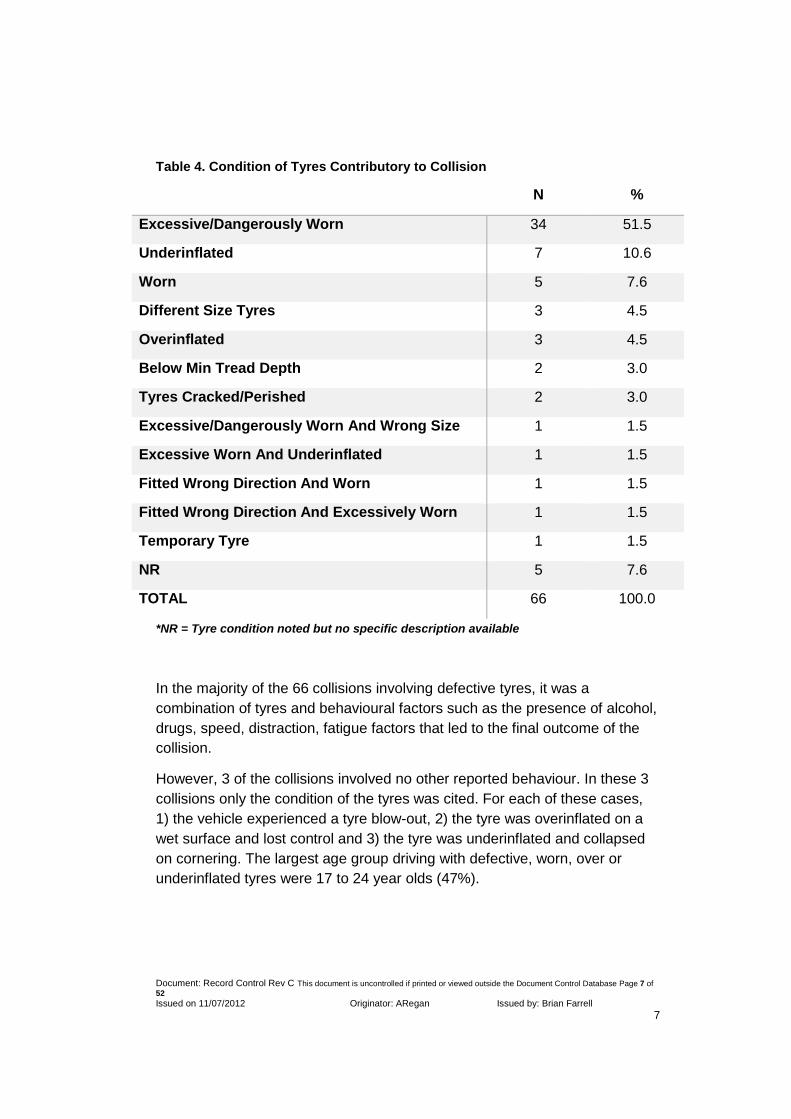
Table 4. Condition of Tyres Contributory to Collision
N %
Excessive/Dangerously Worn 34 51.5
Underinflated 7 10.6
Worn 5 7.6
Different Size Tyres 3 4.5
Overinflated 3 4.5
Below Min Tread Depth 2 3.0
Tyres Cracked/Perished 2 3.0
Excessive/Dangerously Worn And Wrong Size 1 1.5
Excessive Worn And Underinflated 1 1.5
Fitted Wrong Direction And Worn 1 1.5
Fitted Wrong Direction And Excessively Worn 1 1.5
Temporary Tyre 1 1.5
NR 5 7.6
TOTAL 66 100.0
*NR = Tyre condition noted but no specific description available
In the majority of the 66 collisions involving defective tyres, it was a
combination of tyres and behavioural factors such as the presence of alcohol,
drugs, speed, distraction, fatigue factors that led to the final outcome of the
collision.
However, 3 of the collisions involved no other reported behaviour. In these 3
collisions only the condition of the tyres was cited. For each of these cases,
1) the vehicle experienced a tyre blow-out, 2) the tyre was overinflated on a
wet surface and lost control and 3) the tyre was underinflated and collapsed
on cornering. The largest age group driving with defective, worn, over or
underinflated tyres were 17 to 24 year olds (47%).

Document: Record Control Rev C This document is uncontrolled if printed or viewed outside the Document Control Database Page 8 of
52 Issued on 11/07/2012 Originator: ARegan Issued by: Brian Farrell
8
The county where the largest proportion of culpable drivers which had
defective tyres on their vehicles was Donegal (18.2%). Followed by Cork,
Kerry and Wexford (9.1% each).
21 of the 66 vehicles lost control on a bend (15 on a right bend; 6 on a left
bend).The road surface was dry at the time of 41 (62%) of the 66 collisions
involving defective, worn, under/overinflated tyres. The majority (62.1%) of
the 66 collisions occurred on a regional road.
Issues with tyres, brakes, lights and steering were the main factors which
resulted in a rating of defective or dangerously defective vehicles.
Death and Injury Figures Caused in full or Part by Collision Involving
Vehicle with Defective Tyres, Brakes and Other Vehicle Factors
111 people lost their lives and 30 were seriously injured in collisions where
vehicle defects were a contributory factor. This may not have been the sole
cause of the collision, but this fact in combination with other pre-crash
behaviours such as alcohol, speed etc. resulted in these deaths.
Tyres:
Some 71 people were killed and 19 were seriously injured in a collision where
a vehicle had defective tyres as a contributory factor (Table 5).
Table 5. Injury Caused by Vehicle with Defective Tyres
Fatal Serious Minor
Driver* 39 12 18
Passenger 28 7 32
Pedestrian 3 - -
Cyclist 1 - -
TOTAL 71 19 50
*4 of the drivers were motorcyclists
Document: Record Control Rev C This document is uncontrolled if printed or viewed outside the Document Control Database Page 9 of
52 Issued on 11/07/2012 Originator: ARegan Issued by: Brian Farrell
9
Three of the 71 people died in a collision where the sole contributing factor
was the condition of tyres.
18 people were killed and 6 were seriously injured in a collision where a
vehicle had defective brakes. Again, this may not have been the sole
contributing factor to the collision but may have had an impact on the
outcome.
A further 22 people were killed and 5 seriously injured in a collision where a
vehicle had other defects such as cut suspension, lights not efficient, or
wipers not working. These may not have been the sole cause of the collision
but would have had an impact on the overall outcome by impairing the control
of the vehicle and vision of the driver.

Document: Record Control Rev C This document is uncontrolled if printed or viewed outside the Document Control Database Page 10 of
52 Issued on 11/07/2012 Originator: ARegan Issued by: Brian Farrell
10
Section 1.
Introduction
Section 1.1 Background to Report
Over the time period 2008 to 2012, 983 fatal collisions occurred on Irish roads
claiming the lives of 1, 077 people. The current report is an examination of
the circumstances and factors contributing to these collisions. By better
understanding how and why these collisions have occurred, the RSA can
focus their interventions on the main contributing factors to fatal collisions in
Ireland and reduce the number of people being killed on the roads.
A remit of the RSA is to report on road collisions occurring on Irish roads; as
part of this work data is collated and analysed using the road collision
database. This database is created using a form called a C(T)68 forwarded
to the RSA from An Garda Síochána. The information provided in this form is
based on preliminary information collected at the scene of a collision and thus
does not constitute the findings of the final investigation. The RSA issues
reports regularly using the data contained in this database as the best
available representation of fatal and injury collisions.
This vehicle factors report is based on an analysis of the completed
investigation file where the full circumstances of the collisions are available.
Access was granted by An Garda Síochána to the completed Investigation
File produced for each collision. The file contains two main reports:
1. An Garda Síochána Investigation Report
2. Forensic Collision Investigation Report (FCI)
The RSA collected data in the Garda National Traffic Bureau. Of the 983 fatal
collisions which occurred in the time period under investigation,
approximately 12% (116) were unavailable for analysis for reasons which
included a continuing or ongoing investigation and the file held by An Garda
Síochána Ombudsman Commission (GSOC). The final number of collisions
analysed was 867.
Document: Record Control Rev C This document is uncontrolled if printed or viewed outside the Document Control Database Page 11 of
52 Issued on 11/07/2012 Originator: ARegan Issued by: Brian Farrell
11
An Garda Síochána Investigation Report:
This report is completed by the main investigating officer who attended the
collision and provides a detailed breakdown of the collision scene, vehicles
involved, details of each driver, passengers, testing for alcohol, the number
and type of casualty and all relevant circumstances to the collision. Included
in this report are all witness statements provided to An Garda Síochána
around the factors observed prior to and post collision by those involved in
the collision and those who may have witnessed the collision. Autopsy
reports, results of alcohol tests, the Forensic Collision Investigation Report
and the decision by the Coroner are also included. This file allows the
investigating officer to determine the circumstances prior to the collision, the
party whose actions were primarily responsible for causing the collision and
the direction or request to the Director of Public Prosecutions for a
prosecution of those involved.
Forensic Collision Investigation Report (FCI):
All fatal collisions are investigated by the regional Forensic Collision
Investigation unit of An Garda Síochána. As part of this investigation a
complete service check is performed on all vehicles involved to determine
what or if any specific vehicle factors were present (e.g. faulty tyres, brakes,
lights) which may have contributed either in full or part to the crash (PSV
report). The PSV report is completed by Public Service Vehicle Inspector (a
member of An Garda Síochána). This information is used in conjunction with
a detailed forensic examination of the scene taking into account weather,
lighting and road conditions or layout and the assessment of speed where
possible. The result is an FCI Report containing information on each of the
vehicles involved and a detailed description of how the crash occurred. This
enables the decision to be made as to whether a specific party or vehicle is
either culpable or part culpable for the collision.

Document: Record Control Rev C This document is uncontrolled if printed or viewed outside the Document Control Database Page 12 of
52 Issued on 11/07/2012 Originator: ARegan Issued by: Brian Farrell
12
Section 1.2 Number of Fatal Collisions and People Killed Under Review
This report will examine 867 of the fatal collisions which occurred from 2008
to 2012 (Table 1.1). These include:
Table 1.1 No of Collision Files Examined
N
1 Vehicle 333
2 + Vehicle 319
Cyclist 37
Pedestrian 178
TOTAL 867
858 of the 867 collisions involved at least one driver. Of the other nine, seven
were cyclist only and two ‘pony and trap’ only collisions. Details of 1,177
drivers (1,081 four wheeled motor vehicle and 96 motorcycle drivers) were
available for analysis.
The number of people killed or injured for which details were available for
analysis are as follows in Table 1.2:

Document: Record Control Rev C This document is uncontrolled if printed or viewed outside the Document Control Database Page 13 of
52 Issued on 11/07/2012 Originator: ARegan Issued by: Brian Farrell
13
Table 1.2 Killed and Injured Figures in Collisions Analysed
Killed Serious Injury Minor Injury
Driver Motor Vehicle 450 69 154
Driver Motorcycle 84 2 6
Passenger 196 94 143
Pedestrian 180 - -
Cyclist 37 - -
TOTAL 947 165 303
Section 1.3 Person Deemed Culpable for the Collision
For each collision where possible or appropriate, the Investigation report
produced by An Garda Síochána determines the party whose actions were
primarily responsible for causing the collision. This results from a detailed
analysis of all factors such as witness statements on the behaviours and
actions of the driver, pedestrian or cyclist, and alcohol toxicology results. It
also includes conclusions drawn from the FCI report on precisely how the
collision occurred and which vehicle was being driven by the person deemed
to be responsible or part responsible for causing the collision. In some
instances no responsibility by the driver, cyclist or pedestrian is determined
due to the specific circumstances of the collision. This may be the case in hit
and run collisions or those with unforeseen circumstances, such as an animal
or unexpected object on the road. However, for the most part one party is
deemed by their actions to have caused the fatal collision.
It is important that the details of those parties whose actions or behaviour
caused the collision be highlighted as these are the behaviours that will need
to be addressed through road safety interventions to modify such behaviour.
Throughout the report there will be a section detailing the profile and actions

Document: Record Control Rev C This document is uncontrolled if printed or viewed outside the Document Control Database Page 14 of
52 Issued on 11/07/2012 Originator: ARegan Issued by: Brian Farrell
14
of those who were deemed to be responsible or part responsible for the
collision. For the remainder of the report they will be referred to as the
culpable party. Of the 1,177 drivers of motorised vehicles where details are
available, 705 were deemed to be culpable or part culpable for the collision.
Three drivers were deemed not culpable due to unforeseen circumstances
such as the presence of unexpected animals or objects on the road. A further
three collisions were hit and run so no culpability could be determined.
Please note:
This report provides an analysis of the data by collision, by vehicle and by
contributory factor. Therefore the figures and totals will change depending on
the category under discussion.

Document: Record Control Rev C This document is uncontrolled if printed or viewed outside the Document Control Database Page 15 of
52 Issued on 11/07/2012 Originator: ARegan Issued by: Brian Farrell
15
Section 2.
All Vehicles Involved: Type and Age
An overview of all of the vehicles involved in the collision allows a snapshot
into the age and condition of vehicles on the road. The type and registration
number of each vehicle involved in the collision are recorded by An Garda
Síochána. Where possible, using the registration number, an approximate
age can be extracted for the vehicle. However, as the exact date of
registration was not available, the age is an approximation. For example,
there could be a difference of almost a year between a car registered in
January and a car registered near the end of the same year.
Section 2.1 Age of Motorised Vehicles Involved for Period 2008-2012
All vehicles Involved:
The age of 1,103 of the 1,206 motorised vehicles involved in the 867
collisions was extracted from the registration details (pedal cyclists and pony
and traps excluded). There were 103 vehicles where an age could not be
extracted and is a combination of UK registered plates, not recorded, older
plates with no year (tractors and motorcycles), trains and 3 hit and runs
where no vehicle was identified. Of these, the average age was 8.1 years
(Table 2.1) ranging from less than a year to 30 years (a tractor).
Table 2.1 Age of All Vehicles Involved
N 1103
Mean 8.1
Median 8
Mode 10
Range 30
Minimum < 1
Maximum 30
Document: Record Control Rev C This document is uncontrolled if printed or viewed outside the Document Control Database Page 16 of
52 Issued on 11/07/2012 Originator: ARegan Issued by: Brian Farrell
16
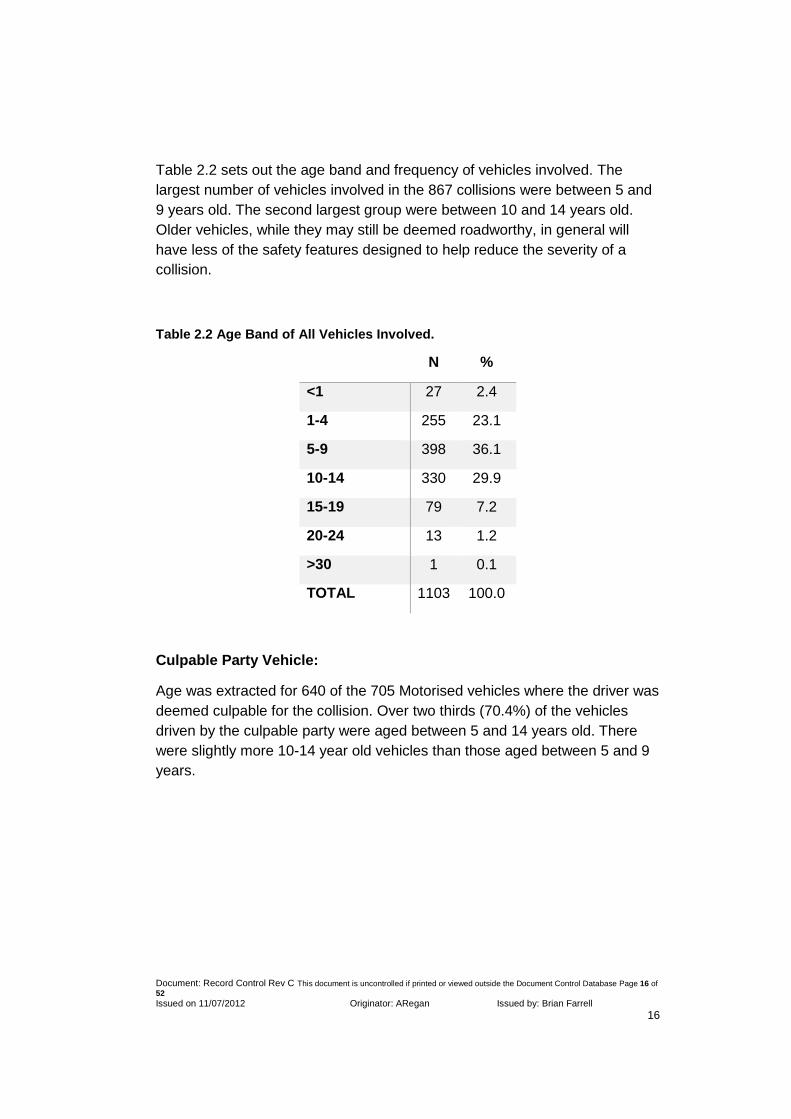
Table 2.2 sets out the age band and frequency of vehicles involved. The
largest number of vehicles involved in the 867 collisions were between 5 and
9 years old. The second largest group were between 10 and 14 years old.
Older vehicles, while they may still be deemed roadworthy, in general will
have less of the safety features designed to help reduce the severity of a
collision.
Table 2.2 Age Band of All Vehicles Involved.
N %
<1 27 2.4
1-4 255 23.1
5-9 398 36.1
10-14 330 29.9
15-19 79 7.2
20-24 13 1.2
>30 1 0.1
TOTAL 1103 100.0
Culpable Party Vehicle:
Age was extracted for 640 of the 705 Motorised vehicles where the driver was
deemed culpable for the collision. Over two thirds (70.4%) of the vehicles
driven by the culpable party were aged between 5 and 14 years old. There
were slightly more 10-14 year old vehicles than those aged between 5 and 9
years.
Document: Record Control Rev C This document is uncontrolled if printed or viewed outside the Document Control Database Page 17 of
52 Issued on 11/07/2012 Originator: ARegan Issued by: Brian Farrell
17
Table 2.3 Age of Vehicle Driven by Culpable Party
Age Band N %
<1 13 2.0
1-4 114 17.8
5-9 221 34.5
10-14 230 35.9
15-19 51 8.0
20-24 10 1.6
>30 1 0.2
TOTAL 640 100.0
Section 2.2 Type of Vehicle Involved
All Vehicles Involved:
Two thirds of the vehicles (66.7%) involved were private cars (Table 2.4). The
second largest category were HGVs (8.3%). Some 43 (3.5%) were public
service vehicles e.g. buses, mini buses and taxis. The ‘other’ category is
classified in Table 2.5.

Document: Record Control Rev C This document is uncontrolled if printed or viewed outside the Document Control Database Page 18 of
52 Issued on 11/07/2012 Originator: ARegan Issued by: Brian Farrell
18
Table 2.4 Type of All vehicles Involved
N %
Private Car 831 66.7
HGV 103 8.3
Motorcycle 96 7.7
Van 94 7.6
Pedal Cycle 37 3.0
PSV Bus 21 1.7
Taxi Car 16 1.3
PSV Mini Bus 6 0.5
Other 41 3.3
TOTAL 1245 100.0
Two of the vehicles had false number plates, one was rented, and of the five
buses one was a school bus.
Of the ‘other’ type of vehicle involved, the most frequent were tractors and
tractors towing trailers 16 (39%). These vehicles were also among the oldest
age category of vehicles.

Document: Record Control Rev C This document is uncontrolled if printed or viewed outside the Document Control Database Page 19 of
52 Issued on 11/07/2012 Originator: ARegan Issued by: Brian Farrell
19
Table 2.5 ‘Other’ Vehicle Involved
N
Tractor And Trailer 10
Tractor 6
Jeep Towing Trailer 4
Ambulance 3
Campervan 2
Pony And Trap 2
Train 2
Van And Trailer 2
Luas 1
Pick Up Truck 1
Taxi Minibus 1
Vintage Tractor 1
Combine Harvester 1
Patrol Car 1
Pick Up And Trailer 1
Pick Up With Horse Box 1
Teleporter 1
Van Towing Cherry Picker 1
TOTAL 41

Document: Record Control Rev C This document is uncontrolled if printed or viewed outside the Document Control Database Page 20 of
52 Issued on 11/07/2012 Originator: ARegan Issued by: Brian Farrell
20
Type of Vehicle by Culpable Party:
Table 2.6 sets out the type of vehicle being driven or cycled by the culpable
party. The sequence of the top three vehicles has changed and HGV‘s moved
from second to fourth place. This indicates that while HGVs are well
represented in the 867 fatal collisions, the drivers of HGVs are less likely to
have caused the collision by comparison to drivers of private motor cars,
motorcycles and vans.
Table 2.6 Vehicle Type by Culpable Party
N %
Private Car 527 72.1
Motorcycle 79 10.8
Van 51 7.0
HGV 27 3.7
Pedal Bicycle 24 3.3
PSV Bus 4 0.5
PSV Mini Bus 1 0.1
Other 18 2.5
TOTAL 731 100.0

Document: Record Control Rev C This document is uncontrolled if printed or viewed outside the Document Control Database Page 21 of
52 Issued on 11/07/2012 Originator: ARegan Issued by: Brian Farrell
21
The ‘other’ category:
N
Tractor 6
Pony and trap 2
Tractor and trailer 2
Ambulance 1
Campervan 1
Jeep towing trailer 1
Jeep with trailer 1
Pick-up truck 1
Taxi minibus 1
Van towing Cherry Picker 1
Vintage tractor 1
Total 18

Document: Record Control Rev C This document is uncontrolled if printed or viewed outside the Document Control Database Page 22 of
52 Issued on 11/07/2012 Originator: ARegan Issued by: Brian Farrell
22
Section 3.
Conclusions of PSV Inspectors Report of Motorised Vehicle
For the remainder of this report only motorised vehicles are discussed (pedal
cycles and pony and trap are excluded). Just two of the pedal cycles with a
PSV report had a vehicle factor noted. One with a defective tyre which was a
manufacturing fault and a second with no brakes or lights.
PSV reports were analysed for 1,124 of the 1,206 motorised vehicles
involved. No reports were available for 82 vehicles. Three were unidentified
vehicles involved in hit and run collisions; in two cases reports were not
possible due to the condition of the car (badly burned). PSV reports were
unavailable for a further 21 as they were the third vehicle present at the
scene and may not have been deemed a significant component of the crash.
Of the remaining 56, Table 3.1 sets out the type of vehicles for which reports
were not available.
Table 3.1 Type of Vehicle with No PSV Report
* Other include 2 tractors, 1 train, 1 pick-up with horse box.
N
Private Car 32
Motorcycle 7
Van 4
HGV 8
PSV Mini Bus 1
Other * 4
TOTAL 56
Document: Record Control Rev C This document is uncontrolled if printed or viewed outside the Document Control Database Page 23 of
52 Issued on 11/07/2012 Originator: ARegan Issued by: Brian Farrell
23
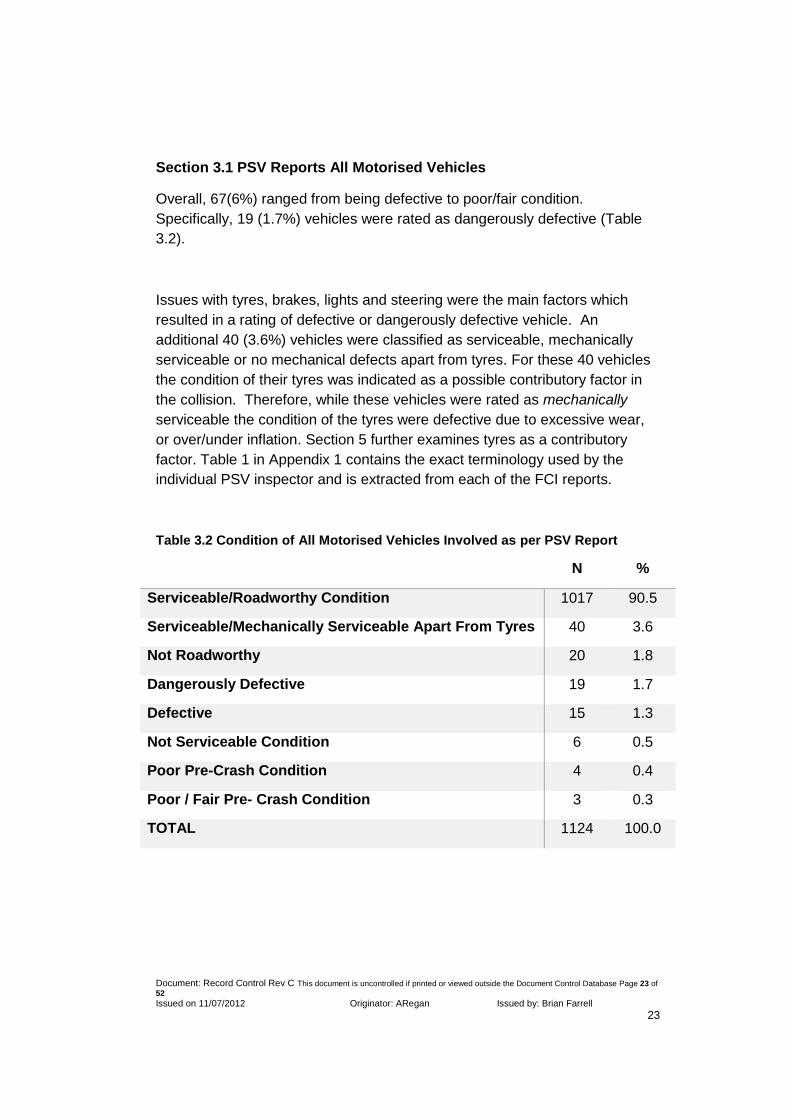
Section 3.1 PSV Reports All Motorised Vehicles
Overall, 67(6%) ranged from being defective to poor/fair condition.
Specifically, 19 (1.7%) vehicles were rated as dangerously defective (Table
3.2).
Issues with tyres, brakes, lights and steering were the main factors which
resulted in a rating of defective or dangerously defective vehicle. An
additional 40 (3.6%) vehicles were classified as serviceable, mechanically
serviceable or no mechanical defects apart from tyres. For these 40 vehicles
the condition of their tyres was indicated as a possible contributory factor in
the collision. Therefore, while these vehicles were rated as mechanically
serviceable the condition of the tyres were defective due to excessive wear,
or over/under inflation. Section 5 further examines tyres as a contributory
factor. Table 1 in Appendix 1 contains the exact terminology used by the
individual PSV inspector and is extracted from each of the FCI reports.
Table 3.2 Condition of All Motorised Vehicles Involved as per PSV Report
N %
Serviceable/Roadworthy Condition 1017 90.5
Serviceable/Mechanically Serviceable Apart From Tyres 40 3.6
Not Roadworthy 20 1.8
Dangerously Defective 19 1.7
Defective 15 1.3
Not Serviceable Condition 6 0.5
Poor Pre-Crash Condition 4 0.4
Poor / Fair Pre- Crash Condition 3 0.3
TOTAL 1124 100.0
Document: Record Control Rev C This document is uncontrolled if printed or viewed outside the Document Control Database Page 24 of
52 Issued on 11/07/2012 Originator: ARegan Issued by: Brian Farrell
24
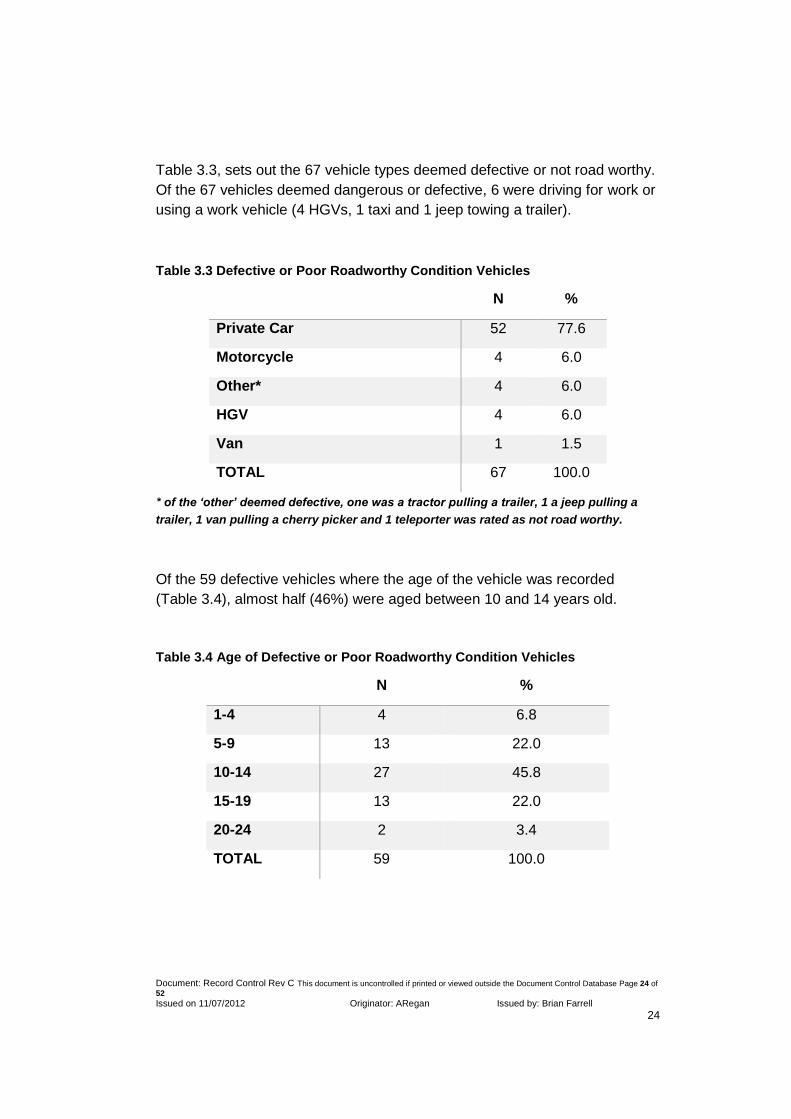
Table 3.3, sets out the 67 vehicle types deemed defective or not road worthy.
Of the 67 vehicles deemed dangerous or defective, 6 were driving for work or
using a work vehicle (4 HGVs, 1 taxi and 1 jeep towing a trailer).
Table 3.3 Defective or Poor Roadworthy Condition Vehicles
N %
Private Car 52 77.6
Motorcycle 4 6.0
Other* 4 6.0
HGV 4 6.0
Van 1 1.5
TOTAL 67 100.0
* of the ‘other’ deemed defective, one was a tractor pulling a trailer, 1 a jeep pulling a
trailer, 1 van pulling a cherry picker and 1 teleporter was rated as not road worthy.
Of the 59 defective vehicles where the age of the vehicle was recorded
(Table 3.4), almost half (46%) were aged between 10 and 14 years old.
Table 3.4 Age of Defective or Poor Roadworthy Condition Vehicles
N %
1-4 4 6.8
5-9 13 22.0
10-14 27 45.8
15-19 13 22.0
20-24 2 3.4
TOTAL 59 100.0

Document: Record Control Rev C This document is uncontrolled if printed or viewed outside the Document Control Database Page 25 of
52 Issued on 11/07/2012 Originator: ARegan Issued by: Brian Farrell
25
Table 3.5 sets out the age and gender where available of all drivers who were
driving vehicles deemed defective or not roadworthy. The majority were male
aged between 17 and 34 years of age (62.3%).
Table 3.5 Age and Gender of All Drivers in Defective Vehicles
10-16 17-24 25-34 35-39 50-64 TOTAL
N N N N N N
MALES 1 19 14 8 1 43
FEMALES 0 4 3 2 1 10
TOTAL 1 23 17 10 2 53
Section 3.2
PSV Report of Vehicle Driven by Culpable Party
PSV reports were analysed for 677 of the 705 motorised vehicles where the
driver was deemed culpable. Some 47 (7%) ranged from being defective to
poor/fair un-roadworthy condition (Table 3.6). Specifically, 15 (2.2%) were
dangerously defective.
A further 33 (4.9%) were classified as serviceable, mechanically serviceable
or no mechanical defects apart from tyres. These 33 vehicles had the
condition of their tyres indicated as a possible contributory factor in the
collision. Therefore, while these vehicles were rated as mechanically
serviceable the condition of the tyres were defective due to excessive wear,
or over/under inflation.
Interestingly, 47 (70.1%) of the 67 vehicles which were deemed to be
defective or not serviceable/roadworthy were driven by the person deemed to
be culpable for the collision. Table 1 in Appendix 1 sets out the exact
terminology used by the individual PSV inspectors.

Document: Record Control Rev C This document is uncontrolled if printed or viewed outside the Document Control Database Page 26 of
52 Issued on 11/07/2012 Originator: ARegan Issued by: Brian Farrell
26
Table 3.6 Condition of Vehicle Driven by Culpable Party
N %
Serviceable/Roadworthy Condition 597 88.2
Serviceable/Mechanically Serviceable Apart From Tyres 33 4.9
Dangerously Defective 15 2.2
Not Roadworthy 12 1.8
Defective 8 1.2
Not Serviceable Condition 5 0.7
Poor Pre-Crash Condition 4 0.6
Poor /Fair Pre-Crash Condition 3 0.4
TOTAL 677 100.0
Table 3.7 sets out the type of vehicle rated as defective or in poor road
worthy condition driven by the culpable party.
Table 3.7 Defective or Poor Roadworthy Condition Vehicles Driven By Culpable
Party
N %
Private Car 40 85.1
Motorcycle 3 6.4
Van 2 4.3
HGV 1 2.1
Other* 1 2.1
TOTAL 47 100.0
* The other vehicle was the jeep pulling a trailer.
Document: Record Control Rev C This document is uncontrolled if printed or viewed outside the Document Control Database Page 27 of
52 Issued on 11/07/2012 Originator: ARegan Issued by: Brian Farrell
27
The majority (85.1%) were in private cars. However, 1 HGV driver was driving
for work in a HGV rated as defective or not roadworthy and was deemed
culpable for the collision.
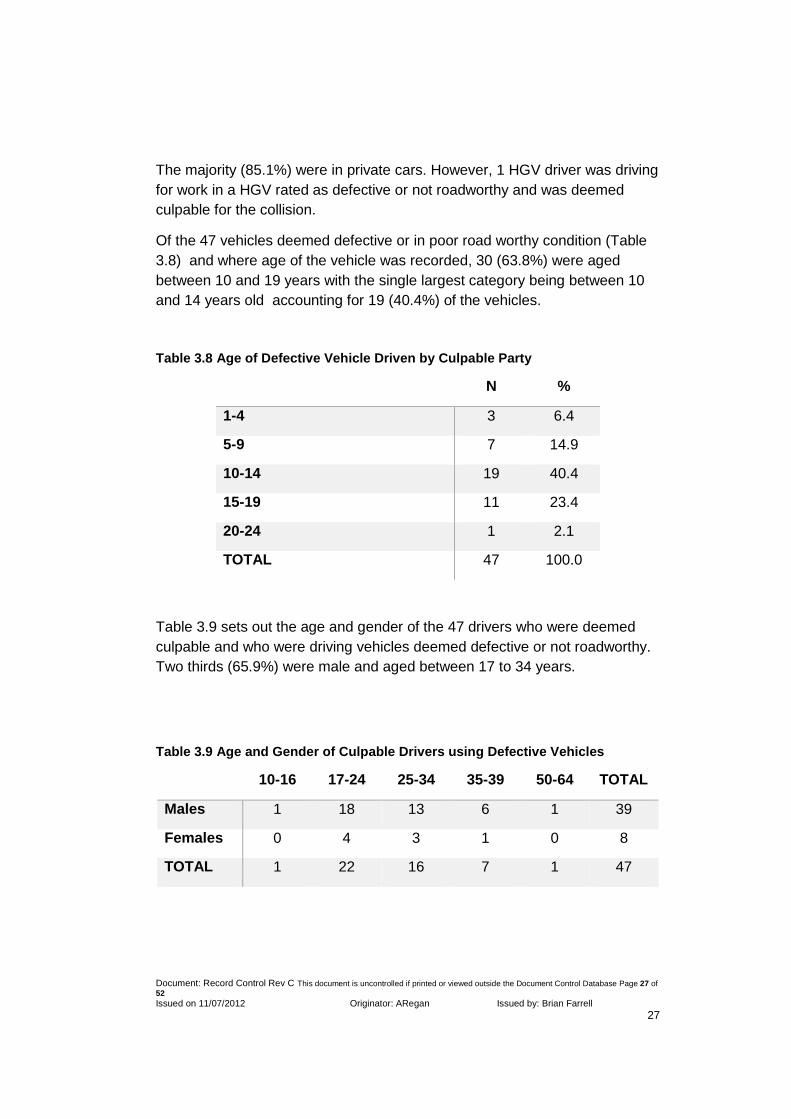
Of the 47 vehicles deemed defective or in poor road worthy condition (Table
3.8) and where age of the vehicle was recorded, 30 (63.8%) were aged
between 10 and 19 years with the single largest category being between 10
and 14 years old accounting for 19 (40.4%) of the vehicles.
Table 3.8 Age of Defective Vehicle Driven by Culpable Party
N %
1-4 3 6.4
5-9 7 14.9
10-14 19 40.4
15-19 11 23.4
20-24 1 2.1
TOTAL 47 100.0
Table 3.9 sets out the age and gender of the 47 drivers who were deemed
culpable and who were driving vehicles deemed defective or not roadworthy.
Two thirds (65.9%) were male and aged between 17 to 34 years.
Table 3.9 Age and Gender of Culpable Drivers using Defective Vehicles
10-16 17-24 25-34 35-39 50-64 TOTAL
Males 1 18 13 6 1 39
Females 0 4 3 1 0 8
TOTAL 1 22 16 7 1 47

Document: Record Control Rev C This document is uncontrolled if printed or viewed outside the Document Control Database Page 28 of
52 Issued on 11/07/2012 Originator: ARegan Issued by: Brian Farrell
28
Section 4.
Vehicle Factors Recorded in PSV Report
Data for all vehicle factors which may have contributed to the overall outcome
of the collision or in some instances caused the collision were extracted from
the PSV report. These factors include the condition of tyres, brakes, lights,
steering etc. and will be further set out in section 4.1. These factors in some
instances are highlighted as contributory factors due to the effect they may
have on the control of the vehicle. In some circumstances a driver may not
have lost control for example, on a corner or in wet conditions if the condition
of the tyres or steering was good. However, if the tyres are balding or
defective this renders control of the vehicle much more difficult.
This section examines the data by collision, by vehicle and by contributory
factor. Therefore figures and totals will differ depending on the category under
discussion.
Section 4.1 Vehicle Factors Noted in All Collisions
Of the 867 fatal collisions analysed, vehicle factors were noted in 121 (14%)
collisions which may or may not have contributed in full or part to the crash.
While a vehicle factor may have been present it may not have rendered the
vehicle defective or un-roadworthy. However, the factor may have been
significant enough to have contributed to the collision. Of all vehicle factors
noted in all 867 collisions, the largest single factor were tyres (8.7%), see
Table 4.1.
Document: Record Control Rev C This document is uncontrolled if printed or viewed outside the Document Control Database Page 29 of
52 Issued on 11/07/2012 Originator: ARegan Issued by: Brian Farrell
29
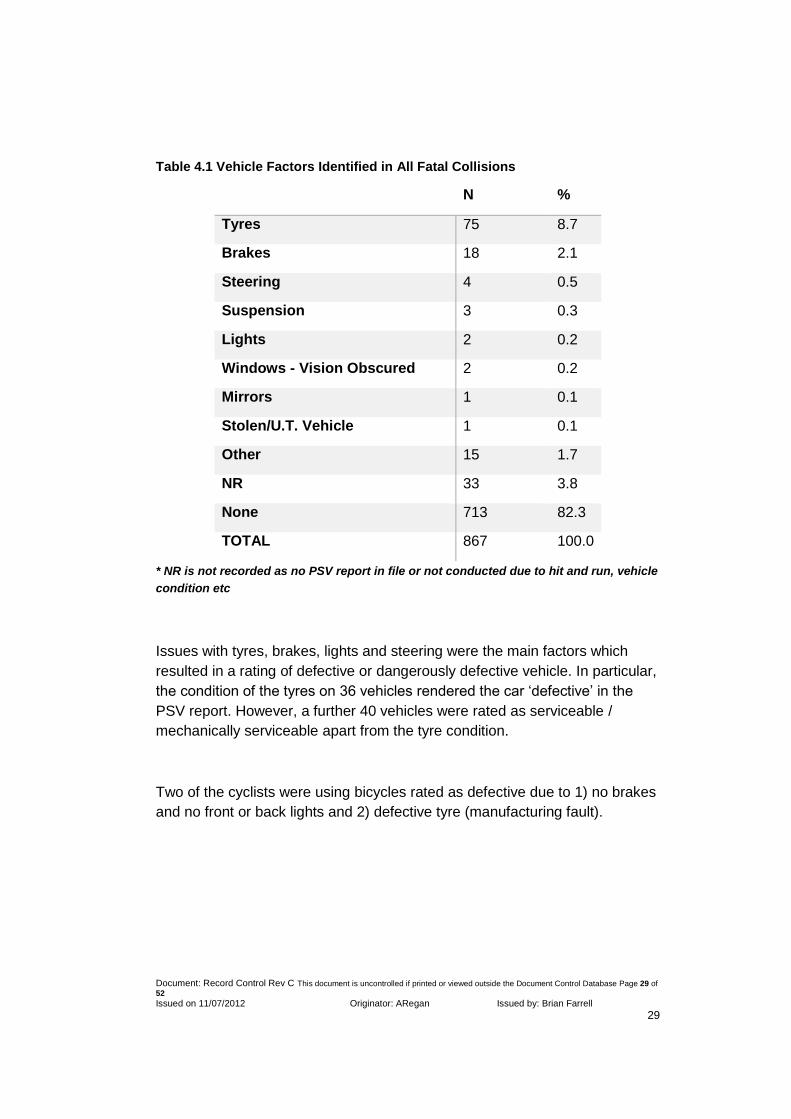
Table 4.1 Vehicle Factors Identified in All Fatal Collisions
N %
Tyres 75 8.7
Brakes 18 2.1
Steering 4 0.5
Suspension 3 0.3
Lights 2 0.2
Windows - Vision Obscured 2 0.2
Mirrors 1 0.1
Stolen/U.T. Vehicle 1 0.1
Other 15 1.7
NR 33 3.8
None 713 82.3
TOTAL 867 100.0
* NR is not recorded as no PSV report in file or not conducted due to hit and run, vehicle
condition etc
Issues with tyres, brakes, lights and steering were the main factors which
resulted in a rating of defective or dangerously defective vehicle. In particular,
the condition of the tyres on 36 vehicles rendered the car ‘defective’ in the
PSV report. However, a further 40 vehicles were rated as serviceable /
mechanically serviceable apart from the tyre condition.
Two of the cyclists were using bicycles rated as defective due to 1) no brakes
and no front or back lights and 2) defective tyre (manufacturing fault).

Document: Record Control Rev C This document is uncontrolled if printed or viewed outside the Document Control Database Page 30 of
52 Issued on 11/07/2012 Originator: ARegan Issued by: Brian Farrell
30
Section 4.2 Vehicle Factors All Motorised Collisions
This section examines only collisions involving at least one motorised vehicle
Therefore, the total number of collisions examined here changes from 867 to
858. As a result the 121 collisions with a vehicle factor reduces to a total of
119 collisions with 125 vehicle factors noted. In the 119 collisions where a
vehicle factor was noted as possibly contributing to the collision, one or more
factors, such as altered suspension and bald tyres or steering, were
highlighted in six collisions. Tyres accounted for almost two thirds (60.6%) of
all factors identified (Table 4.2%).
Table 4.2 Vehicle Factors Identified for all Vehicles
N %
Tyres 76* 60.6
Brakes 17 14.2
Other 15 11.8
Lights 6 4.7
Steering 4 3.1
Suspension 3 2.4
Windows - Vision Obscured 2 1.6
Mirrors 1 0.8
Stolen/U.T. Vehicle 1 0.8
TOTAL 125 100.0
* UT is unauthorised taking of vehicle.* one collision involved both vehicles with
defective tyres
Table 4.3 sets out the vehicle type by the top two vehicle factors noted. Tyres
and brakes were the most common factors set out in the PSV reports.
However, it is interesting to note that the main factor highlighted for HGVs
were brakes (3 of the 4 factors).

Document: Record Control Rev C This document is uncontrolled if printed or viewed outside the Document Control Database Page 31 of
52 Issued on 11/07/2012 Originator: ARegan Issued by: Brian Farrell
31
Table 4.3 Vehicle Type by Top Two Vehicle Factors Identified in All Motorised
Vehicles
TYRES BRAKES
N % N %
Private Car 62 81.6 9 52.9
HGV 1 1.3 3 17.6
Motorcycle 4 5.3 3 17.6
Van 6 7.9 0 0.0
All Other Vehicles 3 3.9 2 11.8
TOTAL 76 100.0 17 100.0
The county of collision where most vehicles had defective or poor quality
tyres was Donegal (18.2%). Figure 1 displays the location of the collision
where the vehicle had defective tyres.
Figure 1. Location of All vehicles with Defective Tyres

Document: Record Control Rev C This document is uncontrolled if printed or viewed outside the Document Control Database Page 32 of
52 Issued on 11/07/2012 Originator: ARegan Issued by: Brian Farrell
32
Section 5
Vehicle Factors as a Contributory Factor in all Motorised Vehicle
Collisions
Section 5.1 Contributory Vehicle Factors
Of the 867 collisions analysed, 858 involved at least one motorised vehicle. In
total 101 collisions were identified through the available PSV reports as
having at least one vehicle factor which contributed to the collision. These
factors contributed in full or part to the outcome. All 101 vehicles were driven
by the party deemed culpable for the crash. Tyres were a known contributory
factor in 8% of the 858 collisions involving a motorised vehicle (Table 5.1).
Table 5.1 Contributory Factors Identified in Vehicle Driven by Culpable Party
N %
Tyres 66 7.7
Brakes 14 1.6
Steering 3 0.3
Suspension 3 0.3
Stolen/U.T. Vehicle 1 0.1
Windows - Vision Obscured 1 0.1
Other 13 1.5
None 757 88.2
TOTAL 858 100.0
Table 5.2 sets out the 101 vehicle factors identified in the PSV report as
contributory factors to the collision. The condition of tyres accounted for
almost two thirds (65.3%) of the vehicle factors cited as contributory to the
collision.

Document: Record Control Rev C This document is uncontrolled if printed or viewed outside the Document Control Database Page 33 of
52 Issued on 11/07/2012 Originator: ARegan Issued by: Brian Farrell
33
Table 5.2 Contributory Vehicle Factors Identified in Vehicle Driven by Culpable
Party
N %
Tyres 66 65.3
Brakes 14 13.9
Steering 3 3.0
Suspension 3 3.0
Stolen/U.T. Vehicle 1 1.0
Windows - Vision Obscured 1 1.0
Other 13 12.9
TOTAL 101 100.0
The top two contributory factors in the vehicle driven by the culpable party are
set out in Table 5.3.The majority (84.4%) of defective tyres were found on
private cars.
Table 5.3 Top Two Contributory Vehicle Factors by Vehicle Driven by Culpable
Party
TYRES BRAKES
N % N %
Private Car 56 84.8 8 57.1
HGV 0 0.0 2 14.3
Motorcycle 4 6.1 3 21.4
Van 5 7.6 0 0.0
All Other Vehicles 1 1.5 1 7.1
TOTAL 66 100.0 14 100.0
Document: Record Control Rev C This document is uncontrolled if printed or viewed outside the Document Control Database Page 34 of
52 Issued on 11/07/2012 Originator: ARegan Issued by: Brian Farrell
34
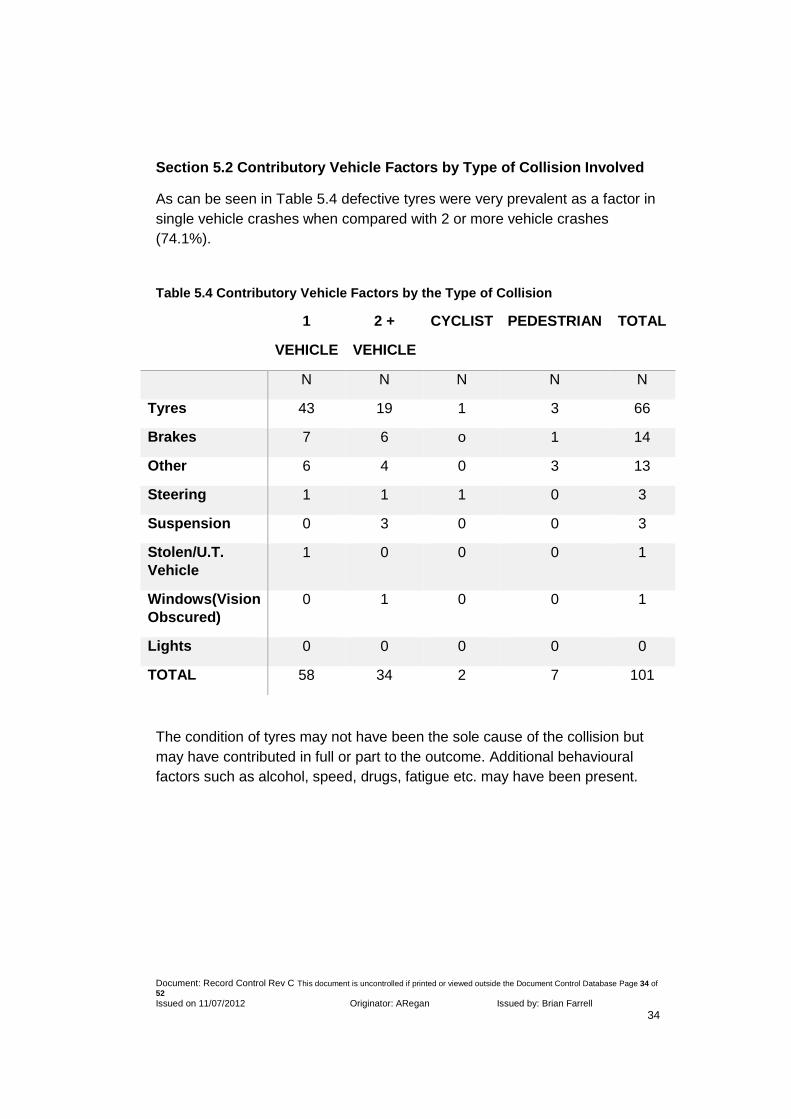
Section 5.2 Contributory Vehicle Factors by Type of Collision Involved
As can be seen in Table 5.4 defective tyres were very prevalent as a factor in
single vehicle crashes when compared with 2 or more vehicle crashes
(74.1%).
Table 5.4 Contributory Vehicle Factors by the Type of Collision
1
VEHICLE
2 +
VEHICLE
CYCLIST PEDESTRIAN TOTAL
N N N N N
Tyres 43 19 1 3 66
Brakes 7 6 o 1 14
Other 6 4 0 3 13
Steering 1 1 1 0 3
Suspension 0 3 0 0 3
Stolen/U.T.
Vehicle
1 0 0 0 1
Windows(Vision
Obscured)
0 1 0 0 1
Lights 0 0 0 0 0
TOTAL 58 34 2 7 101
The condition of tyres may not have been the sole cause of the collision but
may have contributed in full or part to the outcome. Additional behavioural
factors such as alcohol, speed, drugs, fatigue etc. may have been present.

Document: Record Control Rev C This document is uncontrolled if printed or viewed outside the Document Control Database Page 35 of
52 Issued on 11/07/2012 Originator: ARegan Issued by: Brian Farrell
35
Section 6
Tyre Condition
Section 6.1 Tyre Condition on All Motorised Vehicles Assessed
Overall, 76 motorised vehicles had the condition of their tyres noted in the
final report. However, only 66 vehicles were rated as having tyre condition as
a contributory factor to the collision. It was the opinion expressed by the PSV
investigator that while there was an issue with the condition of tyres on 10 of
the 76 vehicles, the condition may not have been sufficient to be deemed a
contributory factor to the collision. The tyres on these 10 vehicles were either
under inflated or below the recommended tread depth. While the driver of
these vehicles may not have had enough time to react to the collision, the
condition of the tyres could have impacted the stopping distance. However,
there was insufficient evidence to corroborate this.
Specifically, three of these collisions involved a pedestrian who was deemed
culpable for the collision by their actions. However, these three vehicles had
excessively worn tyres. One collision involved both drivers in vehicles with
defective tyres. In six collisions other factors were deemed to have been the
cause of the collision but the six vehicles who were hit had issues with their
tyre quality.
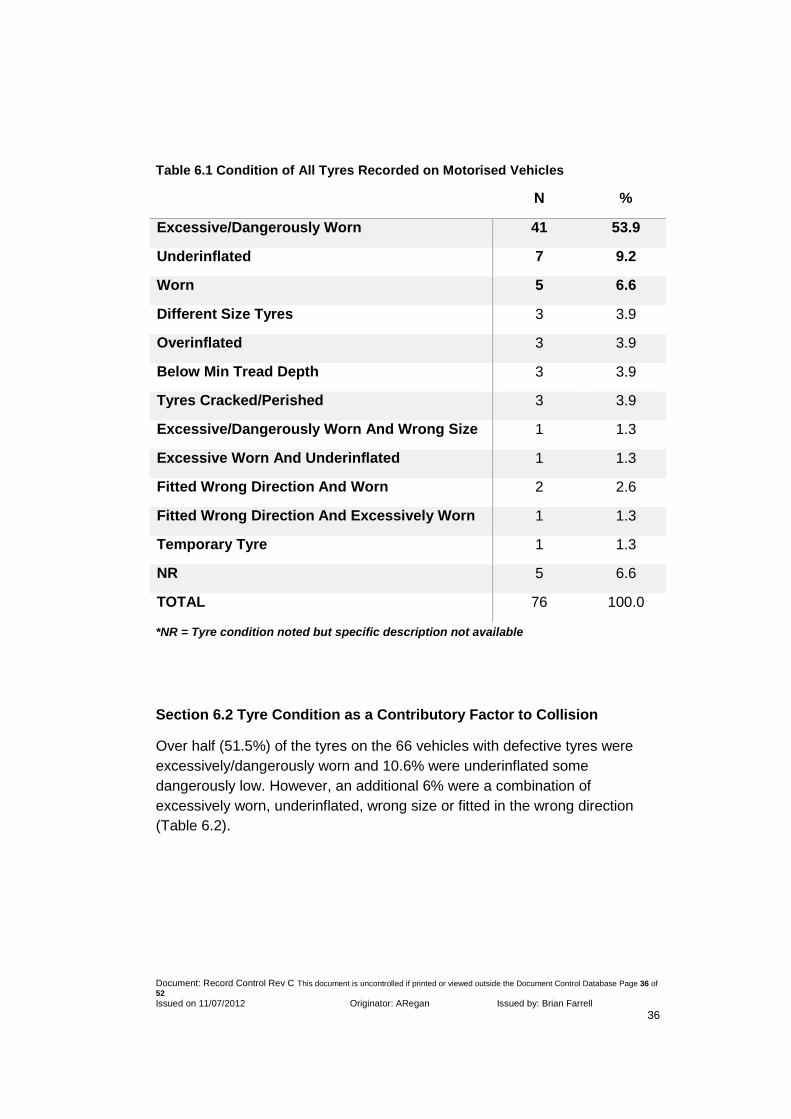
Table 6.1 sets out the condition of the tyres on the 76 vehicles identified.
Over half (53.9%) were rated as being excessively or dangerously worn.
In these instances wires would have been exposed and the rubber may have
been deformed. An additional 6.6% were classified as worn. A further 7
(9.2%) were due to underinflating of tyres, some dangerously low. One
of the 76 vehicles was travelling on a temporary tyre. Of the 76 vehicles
identified many had an issue with more than one of the tyres on the vehicle
(in some cases all four were defective).
Document: Record Control Rev C This document is uncontrolled if printed or viewed outside the Document Control Database Page 36 of
52 Issued on 11/07/2012 Originator: ARegan Issued by: Brian Farrell
36
Table 6.1 Condition of All Tyres Recorded on Motorised Vehicles
N %
Excessive/Dangerously Worn 41 53.9
Underinflated 7 9.2
Worn 5 6.6
Different Size Tyres 3 3.9
Overinflated 3 3.9
Below Min Tread Depth 3 3.9
Tyres Cracked/Perished 3 3.9
Excessive/Dangerously Worn And Wrong Size 1 1.3
Excessive Worn And Underinflated 1 1.3
Fitted Wrong Direction And Worn 2 2.6
Fitted Wrong Direction And Excessively Worn 1 1.3
Temporary Tyre 1 1.3
NR 5 6.6
TOTAL 76 100.0
*NR = Tyre condition noted but specific description not available
Section 6.2 Tyre Condition as a Contributory Factor to Collision
Over half (51.5%) of the tyres on the 66 vehicles with defective tyres were
excessively/dangerously worn and 10.6% were underinflated some
dangerously low. However, an additional 6% were a combination of
excessively worn, underinflated, wrong size or fitted in the wrong direction
(Table 6.2).

Document: Record Control Rev C This document is uncontrolled if printed or viewed outside the Document Control Database Page 37 of
52 Issued on 11/07/2012 Originator: ARegan Issued by: Brian Farrell
37
Table 6.2 Tyre Condition as Contributory Factor to Collision
N %
Excessive/Dangerously Worn 34 51.5
Underinflated 7 10.6
Worn 5 7.6
Different Size Tyres 3 4.5
Overinflated 3 4.5
Below Min Tread Depth 2 3.0
Tyres Cracked/Perished 2 3.0
Excessive/Dangerously Worn And Wrong Size 1 1.5
Excessive Worn And Underinflated 1 1.5
Fitted Wrong Direction And Worn 1 1.5
Fitted Wrong Direction And Excessively Worn 1 1.5
Temporary Tyre 1 1.5
NR 5 7.6
TOTAL 66 100.0
*NR = Tyre condition noted but no specific description available
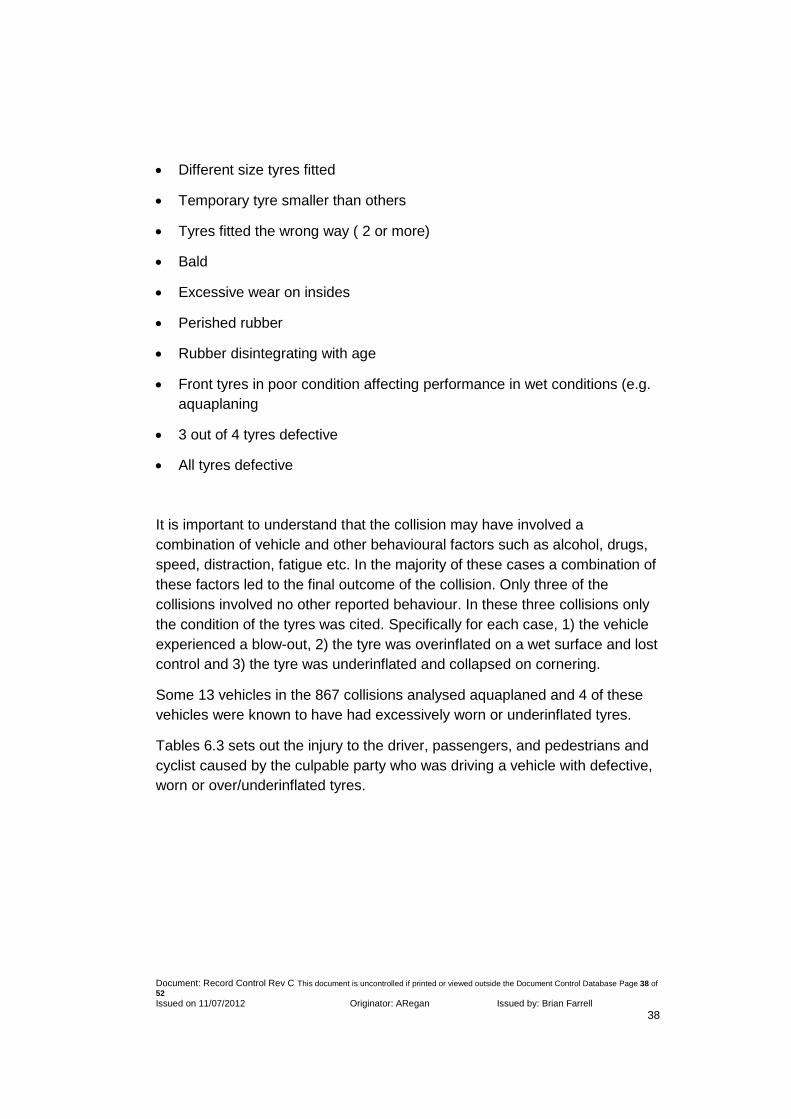
The following list provides an example of the issues around the tyres fitted on
all vehicles including those 66 vehicles driven by the culpable party. Table 3
in the appendix provides a description of the condition of all 76 vehicles tyres.
Underinflated or dangerously low pressure
Overinflated
Wires exposed and deformed shape
Excessive wear from hand-braking
Document: Record Control Rev C This document is uncontrolled if printed or viewed outside the Document Control Database Page 38 of
52 Issued on 11/07/2012 Originator: ARegan Issued by: Brian Farrell
38
Different size tyres fitted
Temporary tyre smaller than others
Tyres fitted the wrong way ( 2 or more)
Bald
Excessive wear on insides
Perished rubber
Rubber disintegrating with age
Front tyres in poor condition affecting performance in wet conditions (e.g.
aquaplaning
3 out of 4 tyres defective
All tyres defective
It is important to understand that the collision may have involved a
combination of vehicle and other behavioural factors such as alcohol, drugs,
speed, distraction, fatigue etc. In the majority of these cases a combination of
these factors led to the final outcome of the collision. Only three of the
collisions involved no other reported behaviour. In these three collisions only
the condition of the tyres was cited. Specifically for each case, 1) the vehicle
experienced a blow-out, 2) the tyre was overinflated on a wet surface and lost
control and 3) the tyre was underinflated and collapsed on cornering.
Some 13 vehicles in the 867 collisions analysed aquaplaned and 4 of these
vehicles were known to have had excessively worn or underinflated tyres.
Tables 6.3 sets out the injury to the driver, passengers, and pedestrians and
cyclist caused by the culpable party who was driving a vehicle with defective,
worn or over/underinflated tyres.

Document: Record Control Rev C This document is uncontrolled if printed or viewed outside the Document Control Database Page 39 of
52 Issued on 11/07/2012 Originator: ARegan Issued by: Brian Farrell
39
Table 6.3 Injury Figures by Collision Involving a Vehicle with Defective Tyres
Fatal Serious Minor
Driver 39 12 18
Passenger 28 7 32
Pedestrian 3 - -
Cyclist 1 - -
TOTAL 71 19 50
71 people lost their lives and 19 were seriously injured in a collision where a
vehicle had defective tyres. This may not have been the sole cause of the
collision, but this fact in combination with their other pre-crash behaviours
such as alcohol, speed etc. resulted in these deaths. Three of the 71 people
died in a collision where the sole contributory factor was the condition of
tyres.
Sixty one (92.4%) of the 66 culpable drivers, driving a vehicle with defective
tyres were travelling forward. A further 3 (4.5%) were attempting to overtake.
The other two vehicles were either exiting or entering or attempting to turn
right at inappropriate speed.
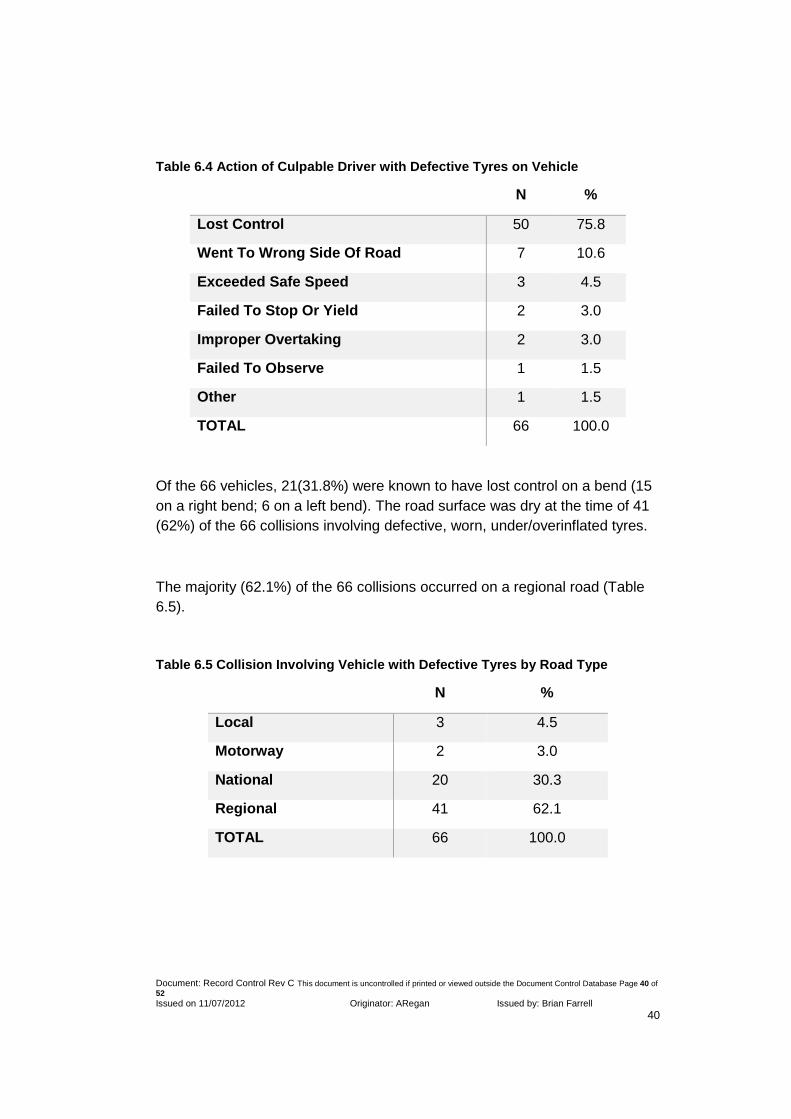
Table 6.4 sets out the driver action associated with the 66 vehicles with
defective, worn or under/over inflated tyres. Three quarters (75.8%) of those
drivers lost control of their car and an additional seven crossed to the wrong
side of the road.
Document: Record Control Rev C This document is uncontrolled if printed or viewed outside the Document Control Database Page 40 of
52 Issued on 11/07/2012 Originator: ARegan Issued by: Brian Farrell
40
Table 6.4 Action of Culpable Driver with Defective Tyres on Vehicle
N %
Lost Control 50 75.8
Went To Wrong Side Of Road 7 10.6
Exceeded Safe Speed 3 4.5
Failed To Stop Or Yield 2 3.0
Improper Overtaking 2 3.0
Failed To Observe 1 1.5
Other 1 1.5
TOTAL 66 100.0
Of the 66 vehicles, 21(31.8%) were known to have lost control on a bend (15
on a right bend; 6 on a left bend). The road surface was dry at the time of 41
(62%) of the 66 collisions involving defective, worn, under/overinflated tyres.
The majority (62.1%) of the 66 collisions occurred on a regional road (Table
6.5).
Table 6.5 Collision Involving Vehicle with Defective Tyres by Road Type
N %
Local 3 4.5
Motorway 2 3.0
National 20 30.3
Regional 41 62.1
TOTAL 66 100.0

Document: Record Control Rev C This document is uncontrolled if printed or viewed outside the Document Control Database Page 41 of
52 Issued on 11/07/2012 Originator: ARegan Issued by: Brian Farrell
41
Table 6.6 sets out the age group of drivers driving vehicles with defective,
worn, over or underinflated tyres, the largest of which was 17 to 24 year olds
(47%). Only 12 (18.1%) of the 66 culpable drivers and who had defective
tyres were female.
Table 6.6 Age Band of Culpable Driver with Defective Tyres on Vehicle
N %
10-16 1 1.5
17-24 31 47.0
25-34 24 36.4
35-49 8 12.1
50-64 2 3.0
65+ 0 0.0
TOTAL 66 100.0
Table 6.7 sets out the age of the vehicle driven by the culpable party with
defective tyres. The largest group was the 10-14 year old cars.
Table 6.7 Age band of Vehicle with Defective Tyres Driven by Culpable Party
N %
1-4 7 10.6
5-9 15 22.7
10-14 27 40.9
15-19 11 16.7
20-24 3 4.5
NR 3 4.5
TOTAL 66 100.0

Document: Record Control Rev C This document is uncontrolled if printed or viewed outside the Document Control Database Page 42 of
52 Issued on 11/07/2012 Originator: ARegan Issued by: Brian Farrell
42
The county where the largest proportion of culpable drivers had defective
tyres on their vehicle was Donegal (18.2%). Excessive wear, and in one
instance excessive wear as a direct result of ‘hand braking’, was the main
description of the tyre condition for those vehicles in Donegal. Figure 2
displays the 66 vehicles with defective tyres driven by the culpable party by
geographical location.
Figure 2. Geographical Location of Culpable Driver with Defective Tyres
Fitted
Document: Record Control Rev C This document is uncontrolled if printed or viewed outside the Document Control Database Page 43 of
52 Issued on 11/07/2012 Originator: ARegan Issued by: Brian Farrell
43
Section 7
Other Contributory Vehicle Factors
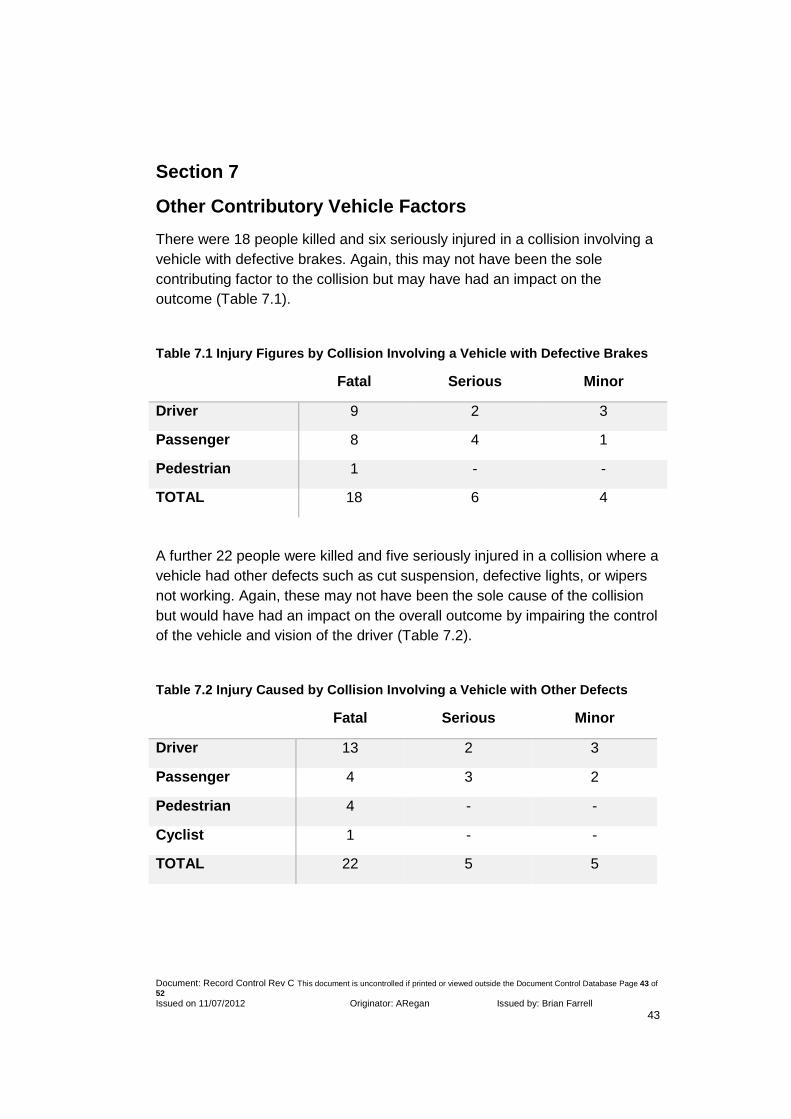
There were 18 people killed and six seriously injured in a collision involving a
vehicle with defective brakes. Again, this may not have been the sole
contributing factor to the collision but may have had an impact on the
outcome (Table 7.1).
Table 7.1 Injury Figures by Collision Involving a Vehicle with Defective Brakes
Fatal Serious Minor
Driver 9 2 3
Passenger 8 4 1
Pedestrian 1 - -
TOTAL 18 6 4
A further 22 people were killed and five seriously injured in a collision where a
vehicle had other defects such as cut suspension, defective lights, or wipers
not working. Again, these may not have been the sole cause of the collision
but would have had an impact on the overall outcome by impairing the control
of the vehicle and vision of the driver (Table 7.2).
Table 7.2 Injury Caused by Collision Involving a Vehicle with Other Defects
Fatal Serious Minor
Driver 13 2 3
Passenger 4 3 2
Pedestrian 4 - -
Cyclist 1 - -
TOTAL 22 5 5
Document: Record Control Rev C This document is uncontrolled if printed or viewed outside the Document Control Database Page 44 of
52 Issued on 11/07/2012 Originator: ARegan Issued by: Brian Farrell
44
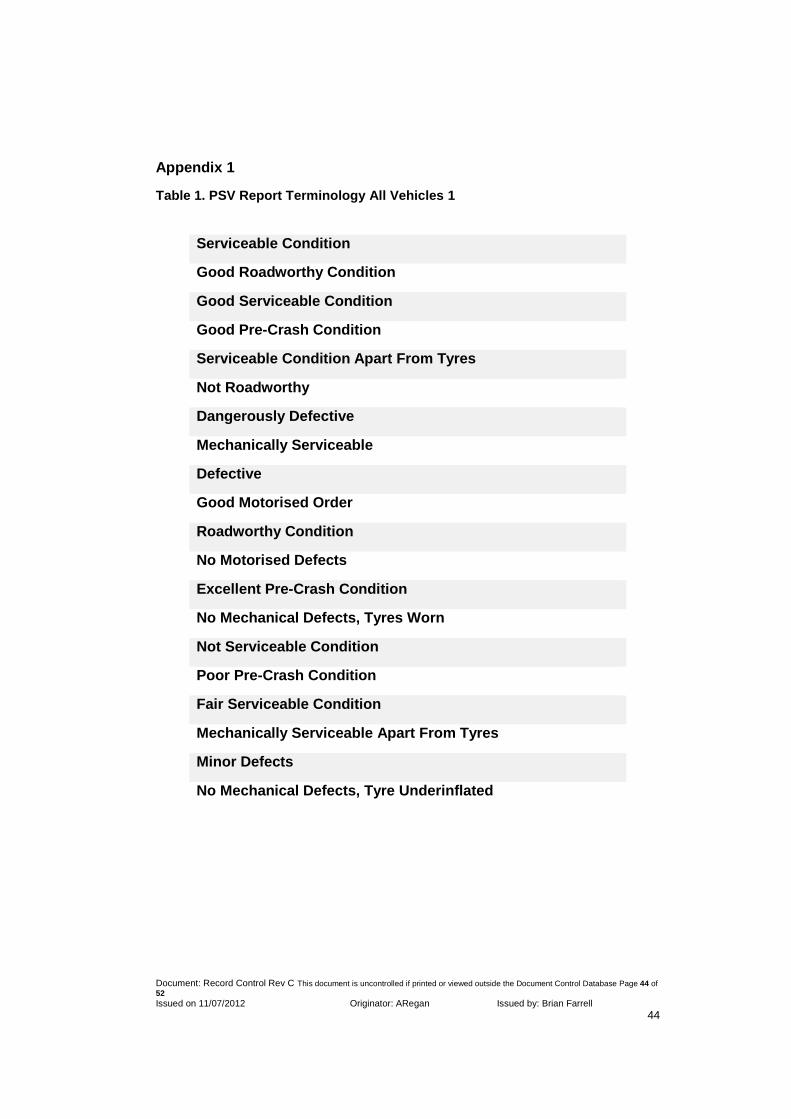
Appendix 1
Table 1. PSV Report Terminology All Vehicles 1
Serviceable Condition
Good Roadworthy Condition
Good Serviceable Condition
Good Pre-Crash Condition
Serviceable Condition Apart From Tyres
Not Roadworthy
Dangerously Defective
Mechanically Serviceable
Defective
Good Motorised Order
Roadworthy Condition
No Motorised Defects
Excellent Pre-Crash Condition
No Mechanical Defects, Tyres Worn
Not Serviceable Condition
Poor Pre-Crash Condition
Fair Serviceable Condition
Mechanically Serviceable Apart From Tyres
Minor Defects
No Mechanical Defects, Tyre Underinflated
Document: Record Control Rev C This document is uncontrolled if printed or viewed outside the Document Control Database Page 45 of
52 Issued on 11/07/2012 Originator: ARegan Issued by: Brian Farrell
45
Table 2. All Motorised Vehicles Tyre Details Extracted From PSV Report
N
All Four Tyres Excessively Worn 1
All Tyres In A Very Dangerous Condition 1
Car Would Have Failed The NCT Due To Poor Tyre Condition 1
Dangerously Underinflated 1
Dangerously Worn And Underinflated Tyres 1
Dangerously Worn Tyres 1
Defective Tread Depth 1
Excessive Wear To Tyres 1
Excessive Wear From Hand Braking 1
Excessive Wear On Inside With Wires Exposed, Rear Left Rubber
Perished
1
Excessively Worn And No Tread Left On Tyres 1
Excessively Worn Back Tyres With Wire Exposed And Defective
Accelerator/Throttle
1
Excessively Worn Front Left Tyre 1
Excessively Worn Front Tyre With Wire Showing 1
Excessively Worn Rear Tyre 1
Excessively Worn Two Front Tyres And Defective Brakes 1
Excessively Worn Tyres 1
Excessively Worn Tyres Front And Back 1
Front Left Tyre Excessive Wear 1
Front Left Tyre Excessively Worn 1
Left Back Tyre Excessively Worn With Wire Exposed And Deformed
Shape.
1
Left Front Tyre Excessively Worn And Two Rear Tyres Wrong Direction 1

Document: Record Control Rev C This document is uncontrolled if printed or viewed outside the Document Control Database Page 46 of
52 Issued on 11/07/2012 Originator: ARegan Issued by: Brian Farrell
46
Left Nearside Back Tyre Excessively Worn With Treads Exposed 1
Nearside Front Tyre Below Min Tread Depth 1
One Tyre Below Min Tread Depth 1
Offside Rear Tyre Under Inflated To Half Recommend 1
One Bald Tyre And Braking System Not Optimal 1
One Tyre Pressure Extremely Low 1
One Wrong Size Tyre, Brake Pads Not Fully Catching 1
Over Inflated And Not In Good Condition 1
Overinflated Tyres 1
Pressure Lower Than Recommended Front And Back 1
Rear Tyres Perished And Trailer Dangerously Defective 1
Right Rear Tyre Excessively Worn 1
Temporary Tyre Small Size 1
The Left Front Tyre Was Smaller Than Others 1
Three Of 4 Tyres On Vehicle Defective 1
Two Bald Tyres 1
Two Excessively Worn Tyres 1
Two Excessively Worn Tyres At Rear 1
Two Front Tyres Dangerously Defective, Three Different Sizes 1
Two Front Tyres Different Sizes One 13 The Other Size 1 1
Two Front Tyres Excessively Worn 1
Two Front Tyres In Poor Condition And This Would Affect Performance
In Wet Conditions
1
Two Front Tyres Worn 1
Two Front Tyres Worn To Wire Exposure 1
Two Rear Tyres Bald 1
Document: Record Control Rev C This document is uncontrolled if printed or viewed outside the Document Control Database Page 47 of
52 Issued on 11/07/2012 Originator: ARegan Issued by: Brian Farrell
47
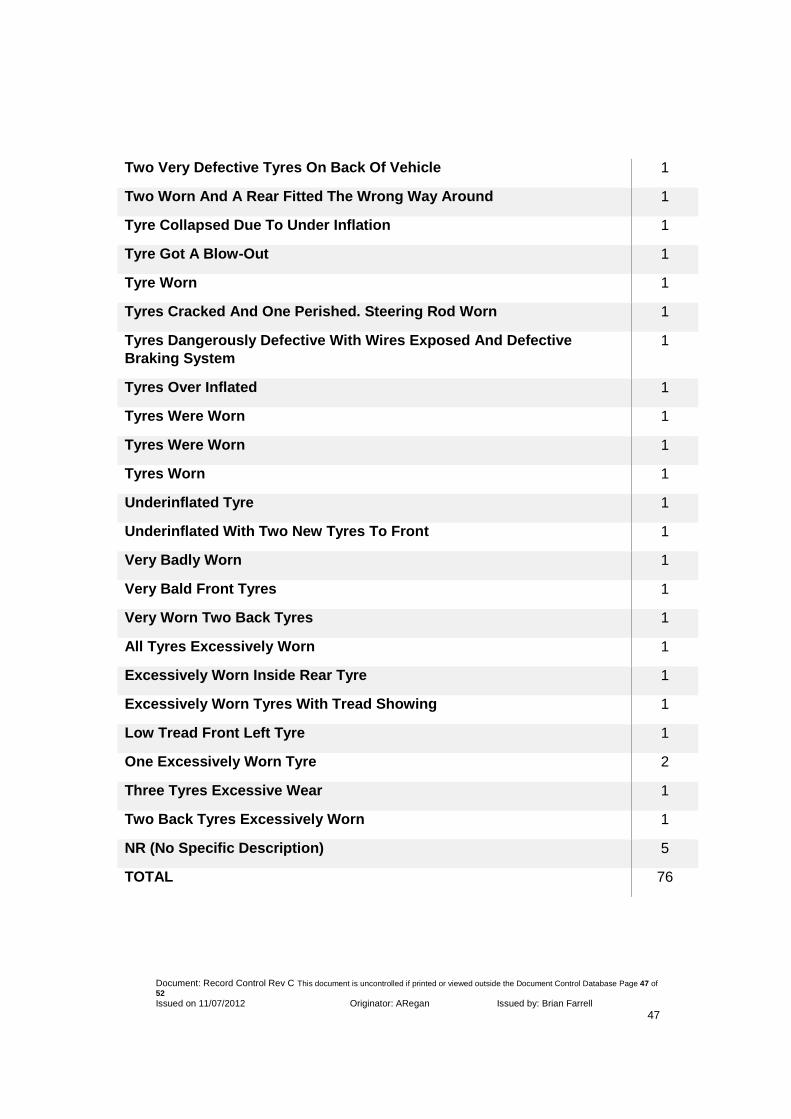
Two Very Defective Tyres On Back Of Vehicle 1
Two Worn And A Rear Fitted The Wrong Way Around 1
Tyre Collapsed Due To Under Inflation 1
Tyre Got A Blow-Out 1
Tyre Worn 1
Tyres Cracked And One Perished. Steering Rod Worn 1
Tyres Dangerously Defective With Wires Exposed And Defective
Braking System
1
Tyres Over Inflated 1
Tyres Were Worn 1
Tyres Were Worn 1
Tyres Worn 1
Underinflated Tyre 1
Underinflated With Two New Tyres To Front 1
Very Badly Worn 1
Very Bald Front Tyres 1
Very Worn Two Back Tyres 1
All Tyres Excessively Worn 1
Excessively Worn Inside Rear Tyre 1
Excessively Worn Tyres With Tread Showing 1
Low Tread Front Left Tyre 1
One Excessively Worn Tyre 2
Three Tyres Excessive Wear 1
Two Back Tyres Excessively Worn 1
NR (No Specific Description) 5
TOTAL 76
Document: Record Control Rev C This document is uncontrolled if printed or viewed outside the Document Control Database Page 48 of
52 Issued on 11/07/2012 Originator: ARegan Issued by: Brian Farrell
48
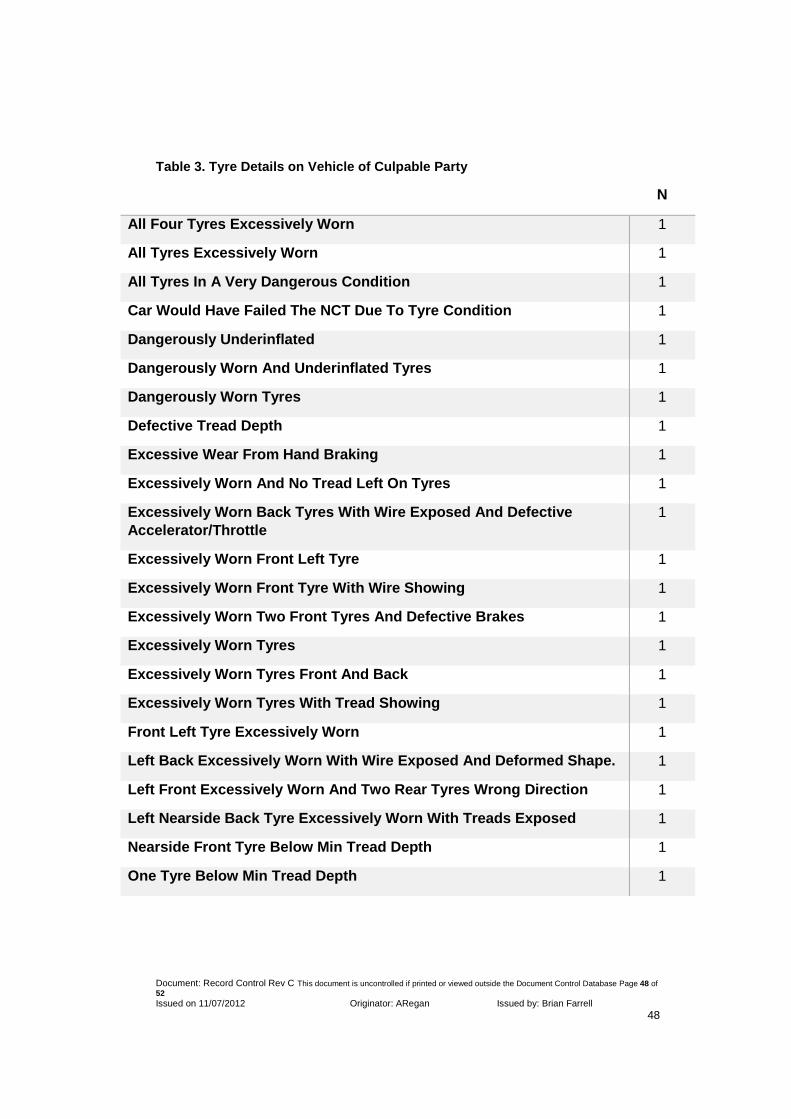
Table 3. Tyre Details on Vehicle of Culpable Party
N
All Four Tyres Excessively Worn 1
All Tyres Excessively Worn 1
All Tyres In A Very Dangerous Condition 1
Car Would Have Failed The NCT Due To Tyre Condition 1
Dangerously Underinflated 1
Dangerously Worn And Underinflated Tyres 1
Dangerously Worn Tyres 1
Defective Tread Depth 1
Excessive Wear From Hand Braking 1
Excessively Worn And No Tread Left On Tyres 1
Excessively Worn Back Tyres With Wire Exposed And Defective
Accelerator/Throttle
1
Excessively Worn Front Left Tyre 1
Excessively Worn Front Tyre With Wire Showing 1
Excessively Worn Two Front Tyres And Defective Brakes 1
Excessively Worn Tyres 1
Excessively Worn Tyres Front And Back 1
Excessively Worn Tyres With Tread Showing 1
Front Left Tyre Excessively Worn 1
Left Back Excessively Worn With Wire Exposed And Deformed Shape. 1
Left Front Excessively Worn And Two Rear Tyres Wrong Direction 1
Left Nearside Back Tyre Excessively Worn With Treads Exposed 1
Nearside Front Tyre Below Min Tread Depth 1
One Tyre Below Min Tread Depth 1

Document: Record Control Rev C This document is uncontrolled if printed or viewed outside the Document Control Database Page 49 of
52 Issued on 11/07/2012 Originator: ARegan Issued by: Brian Farrell
49
Offside Rear Tyre Under Inflated To Half Recommended 1
One Bald Tyre And Braking System Not Optimal 1
One Excessively Worn Tyre 1
One Tyre Pressure Extremely Low 1
One Wrong Size Tyre, Brake Pads Not Fully Catching 1
Over Inflated And Not In Good Condition 1
Overinflated Tyres 1
Pressure Lower Than Recommended Front And Back 1
Rear Tyres Perished And Trailer Dangerously Defective 1
Right Rear Excessively Worn 1
Temporary Tyre Small Size 1
Left Front Tyre Was Smaller Than Others And May Have Contributed
To Travelling Into The Gravel
1
Two Back Tyres Excessively Worn 1
Three Tyres Excessive Wear 1
Two Excessively Worn Tyres 1
Two Excessively Worn Tyres At Rear 1
Two Front Tyres Dangerously Defective, Three Different Sizes 1
Two Front Tyres Different Sizes One 13 The Other Size 1 1
Two Front Tyres Excessively Worn 1
Two Front Tyres In Poor Condition And This Would Affect
Performance In Wet Conditions
1
Two Front Tyres Worn To Wire Exposure 1
Two Rear Tyres Bald 1
Two Very Defective Tyres On Back Of Vehicle 1
Two Worn And A Rear Fitted The Wrong Way Around 1

Document: Record Control Rev C This document is uncontrolled if printed or viewed outside the Document Control Database Page 50 of
52 Issued on 11/07/2012 Originator: ARegan Issued by: Brian Farrell
50
Tyre Collapsed Due To Under Inflation 1
Tyre Got A Blow-Out 1
Tyre Worn 1
Tyres Cracked And One Perished. Steering Rod Worn 1
Tyres Dangerously Defective With Wires And Defective Braking
System
1
Tyres Over Inflated 1
Tyres Were Worn 1
Tyres Were Worn 1
Tyres Worn 1
Underinflated Tyre 1
Underinflated With Two New Tyres To Front 1
Very Badly Worn 1
Very Bald Front Tyres 1
Very Worn Two Back Tyres 1
NR ( No Specific Description) 5
TOTAL 66


Document: Record Control Rev C This document is uncontrolled if printed or viewed outside the Document Control Database Page 2 of 52 Issued on 11/07/2012 Originator: ARegan Issued by: Brian Farrell
2


![SEC/2015/3/0817/Agreement Template ITP External Delivery · SEC/2015/3/0817/Agreement Template ITP External Delivery (revised 30 March 2012) Dated [ ] Lancaster University ...](https://static.documents.pub/doc/80x56/5ad2d6997f8b9abd6c8d29df/sec201530817agreement-template-itp-external-delivery-template-itp-external-delivery.jpg)

