Unmixing the NMR spectra of similar species - vive la différence
Adam A. Colbournea, Sebastian Meierb, Gareth Morrisa and Mathias Nilsson*a,c
Received (in XXX, XXX) XthXXXXXXXXX 20XX, Accepted Xth XXXXXXXXX 20XXDOI: 10.1039/b000000x
Diffusion-ordered spectroscopy (DOSY) is one of the most powerful methods for intact mixture analysis by NMR. However, the separation of overlapped spectra by current DOSY methods typically requires a minimum of 30% difference in diffusion coefficient. Here we present a new algorithm (OUTSCORE) that improves the situation by almost an order of magnitude, allowing the unmixing of severely overlapped species of similar size, by combining least squares fitting with cross-talk minimisation.
Diffusion-ordered spectroscopy (DOSY) (1-3) is a widespread tool for mixture analysis, combining pulsed field gradient (PFG) NMR experiments with a variety of different post-processing techniques in order to extract the spectra of different mixture components. The experimental data needed are acquired in a series of PFG-NMR experiments run with different gradient strengths, causing signal attenuation that depends upon the diffusion coefficients D of the different species. The attenuation for a given signal is typically described by an exponential decay of the form of the Stejskal-Tanner (S-T) equation (4, 5). By fitting the signal decays in the PFG-NMR dataset to the S-T equation, values for D can be extracted for individual peaks, spectral regions, or the whole dataset. Depending on the post-processing method used, component spectra are usually obtained either from cross-sections or selective projections of a DOSY spectrum, or as a series of 1D spectra and associated diffusion decay shapes obtained by fitting the entire dataset.
The simplest, and often most useful, post-processing approach is high-resolution (HR) DOSY (6), in which the decays of individual spectral peaks are fitted to the S-T equation and the resultant diffusion coefficients and error estimates are used to construct a 2D DOSY spectrum. Unfortunately, where peaks from different components overlap HRDOSY fails, usually (7) returning a value of D intermediate between those of the species concerned (see e.g. Figure 1a) and obscuring chemical information about the analytes. With univariate methods (independent fitting of each spectral peak / frequency), an obvious next step is to model each peak decay using two - or more - exponentials (8), a continuous distribution (9-11), or iterative thresholding (12). However, even biexponential fitting is only feasible with very high quality experimental data and for species that are well-separated in diffusion coefficient.
I n s t e a d o f a t t e m p t i n g t o a c c o m m o d a t e t h e e f f e c t s o f s p e c t r a l
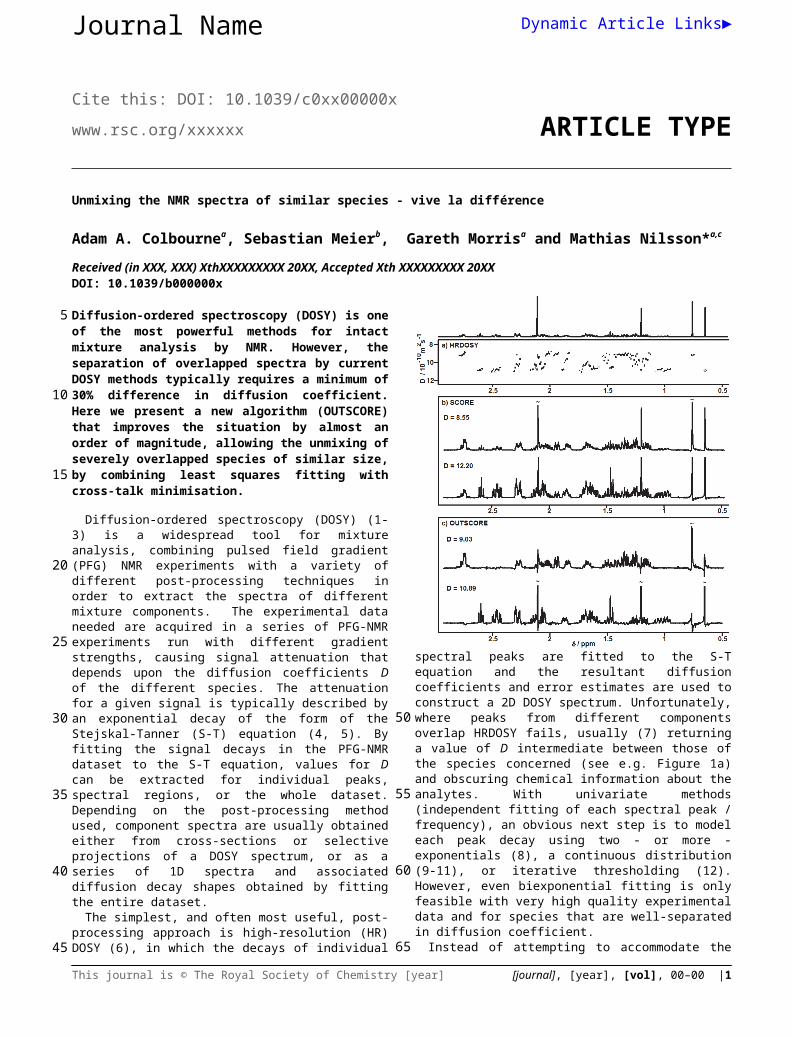
overlap, one may try to avoid them. Experimental techniquesFig. 1 a) Part of the HRDOSY spectrum of progesterone and estradiol, showing both overlapped peaks that have compromise D values, and well-resolved peaks (~e.g. around 0.6 ppm). b) SCORE fit of the same data, showing extensive cross-talk due to the similarity in D between the two components. c) OUTSCORE result, with the output spectra showing only minor cross-talk, due to experimental instability, between the estradiol (upper) and progesterone (lower) spectra. D values from OUTSCORE agree well with those found for the non-overlapped peaks in the HR-DOSY spectrum. Spectra of the pure components are given in the ESI.
such as pure shift NMR (13, 14), 3D DOSY (15, 16) and heteronuclear methods (17-19) can all greatly improve resolution. Unfortunately the costs in sensitivity and experiment time can be high, and even then freedom from signal overlap is not guaranteed.
One alternative to univariate processing is to fit the whole dataset simultaneously, in a multivariate decomposition:
X = S⊗C + E (1)where X is a two-dimensional data matrix describing the experimental signal strength as a function of chemical shift and
CREATED USING THE RSC ARTICLE TEMPLATE (VER. 3.0) - SEE WWW.RSC.ORG/ELECTRONICFILES FOR DETAILS
ARTICLE TYPE www.rsc.org/xxxxxx | XXXXXXXX
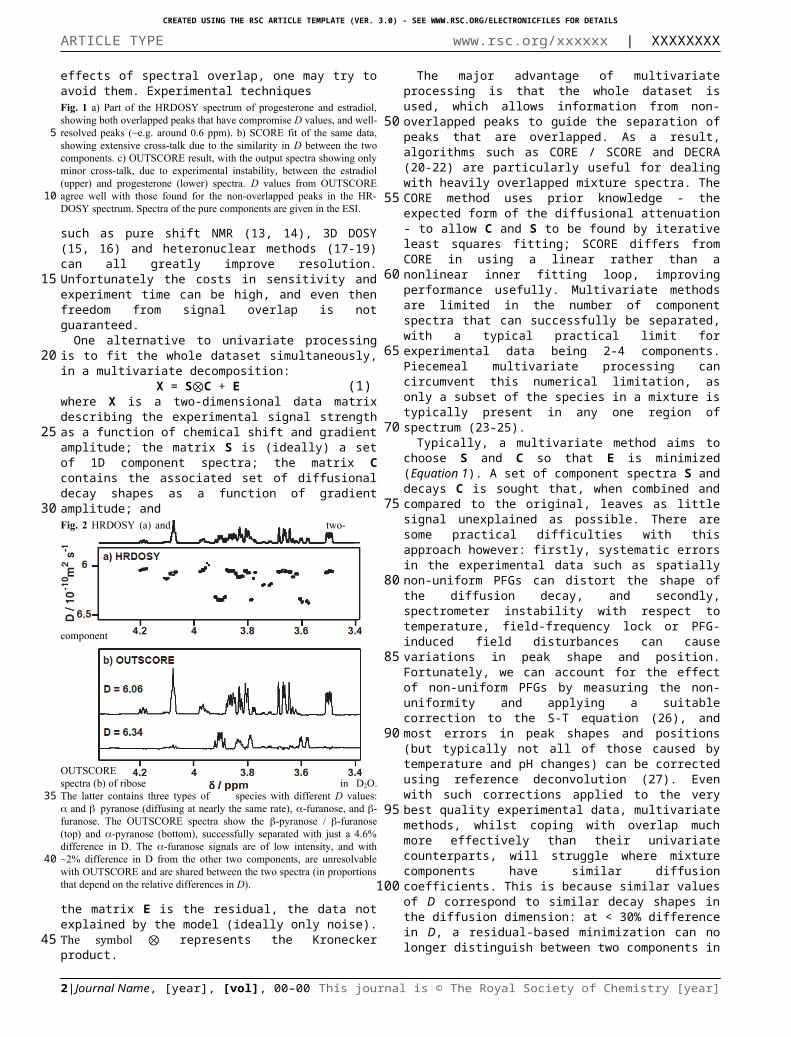
gradient amplitude; the matrix S is (ideally) a set of 1D component spectra; the matrix C contains the associated set of diffusional decay shapes as a function of gradient amplitude; andFig. 2 HRDOSY (a) and two-
component
OUTSCORE spectra (b) of ribose in D2O. The latter contains three types of species with different D values: and pyranose (diffusing at nearly the same rate), -furanose, and -furanose. The OUTSCORE spectra show the -pyranose / -furanose (top) and -pyranose (bottom), successfully separated with just a 4.6% difference in D. The -furanose signals are of low intensity, and with ~2% difference in D from the other two components, are unresolvable with OUTSCORE and are shared between the two spectra (in proportions that depend on the relative differences in D).
the matrix E is the residual, the data not explained by the model (ideally only noise). The symbol ⊗ represents the Kronecker product.
The major advantage of multivariate processing is that the whole dataset is used, which allows information from non-overlapped peaks to guide the separation of peaks that are overlapped. As a result, algorithms such as CORE / SCORE and DECRA (20-22) are particularly useful for dealing with heavily overlapped mixture spectra. The CORE method uses prior knowledge - the expected form of the diffusional attenuation - to allow C and S to be found by iterative least squares fitting; SCORE differs from CORE in using a linear rather than a nonlinear inner fitting loop, improving performance usefully. Multivariate methods are limited in the number of component spectra that can successfully be separated, with a typical practical limit for experimental data being 2-4 components. Piecemeal multivariate processing can circumvent this numerical limitation, as only a subset of the species in a mixture is typically present in any one region of spectrum (23-25).
Typically, a multivariate method aims to choose S and C so that E is minimized (Equation 1). A set of component spectra S and decays C is sought that, when combined and compared to the original, leaves as little signal unexplained as possible. There are some practical difficulties with this approach however: firstly, systematic errors in the experimental data such as spatially non-uniform PFGs can distort the shape of the diffusion decay, and secondly, spectrometer instability with respect to temperature, field-frequency lock or PFG-induced field disturbances can cause variations in peak shape and position. Fortunately, we can account for the effect of non-uniform PFGs by measuring the
non-uniformity and applying a suitable correction to the S-T equation (26), and most errors in peak shapes and positions (but typically not all of those caused by temperature and pH changes) can be corrected using reference deconvolution (27). Even with such corrections applied to the very best quality experimental data, multivariate methods, whilst coping with overlap much more effectively than their univariate counterparts, will struggle where mixture components have similar diffusion coefficients. This is because similar values of D correspond to similar decay shapes in the diffusion dimension: at < 30% difference in D, a residual-based minimization can no longer distinguish between two components in experimental data with practical signal-to-noise ratios (S/Ns). In such cases, algorithms typically produce a set of diffusion coefficients that do not accurately match those of the species in the sample, and a set of component spectra that show cross-talk (signals leaking across from one component spectrum to another), as seen in Figure 1b (SCORE).
One interesting strategy for dealing with this limit has recently been suggested, called GRECORD (28). An extension of RECORD, GRECORD attempts to explain the experimental data better by repeating CORE analyses using values of D limited to those from a consensus set chosen from initial RECORD processing. Crucially, the method requires that the diffusion coefficient of each species in a mixture be correctly identified in at least one of the regions processed.
Here we propose a different approach. The OUTSCORE method (Optimized Unmixing of True Spectra for COmponent REsolution) again exploits signals that are at least partly resolved, but in a rather different way. The new method replaces the least squares optimization criterion of the outer loop of SCORE by a requirement to minimize the degree of similarity between trial component spectra – i.e. to minimize spectral cross-talk. The fast and accurate inner loop of SCORE, which uses linear least squares optimization, is retained so that the solution converged on minimizes both the residual and the cross-talk between component spectra. Biasing the search in this way towards component spectra that differ, at least in detail, improves the ability to separate component spectra by almost an order of magnitude. Figures 1a-c compare the results of HRDOSY, SCORE and OUTSCORE analysis of a diffusion-weighted NMR dataset measured for a mixture of progesterone and estradiol. OUTSCORE shows much cleaner resolution of the spectra of the two components, despite their differing in diffusion coefficient by only 17%. The residual cross-talk between the components in Figures 1 and 2 is due to deviations from the bilinear model, e.g. changes in signal frequency, shape, phase etc. caused by spectrometer instability. Such experimental errors cannot in practice be eliminated by any linear model. Temperature-dependent peak shifts cause apparent dispersion-mode signals in the OUTSCORE spectra (e.g. for the strong methyl signals at ~0.6/0.75 ppm in Fig 1). Such error signals can be reduced by using short experiment times, to reduce temperature drift.
The criterion of cross-talk minimisation is related to, but distinct from, the model-free blind source separation technique (29-32), which has recently been applied to DOSY (32). Whilst this model-free method has great potential, a model-based approach such as OUTSCORE that incorporates prior knowledge (here in the form of the known S-T decay shape) should always
CREATED USING THE RSC COMMUNICATION TEMPLATE (VER. 3.1) - SEE WWW.RSC.ORG/ELECTRONICFILES FOR DETAILS
ARTICLE TYPE www.rsc.org/xxxxxx | XXXXXXXX
perform better if the model is correct.Whilst OUTSCORE can allow the resolution of spectral
components that show very similar diffusional decays, even this method will break down with increasing number of mixture components and/or similarity between diffusional decays. As a general rule, with high S/N data (~>10000:1) and mixture components of similar concentration, multi-exponential fitting and SCORE perform reliably when the difference in D between components is >30%. In contrast, with OUTSCORE two components differing in D by as little as 3-5% can be resolved, though it remains difficult to extract more than 4 components per fit, or more than 2-3 components where the difference in D is very small. OUTSCORE is much less demanding of S/N ratio than SCORE; for example the spectra of Figure 1 remain separable down to 100:1 (see ESI).
As shown in Figure 2, OUTSCORE can permit the spectral separation of isomers in homogenous solution, resolving isomers that interconvert slowly on the NMR timescale and are hard or impossible to separate physically. In this example the mixture components all have the same molecular mass and the differences in D arise purely from their different shapes in solution. In all cases where we have compared OUTSCORE and SCORE, the former has outperformed the latter in resolving power, speed, or both. OUTSCORE should be applicable to the vast majority of mixtures, but will inevitably fail in the limit case of perfectly overlapped spectra (e.g. of a polydisperse polymer); without spectral difference there is nothing to minimize and the analysis is in reality univariate.
Whilst allowing greatly improved resolution of mixture component spectra with respect to D, OUTSCORE is still limited in the number of components per analysis, as noted above. As a result, using the OUTSCORE cross-talk minimization criterion in the multiple, smaller, decompositions of a RECORD / LOCODOSY processing scheme could be very useful. Unfortunately, because the automated method used in LOCODOSY for rank determination relies on the SCORE algorithm failing characteristically, this particular approach cannot be used with OUTSCORE. A number of possible methods can be envisaged for fully automatic decomposition of data, including a RECORD-style incremental approach. For the most complex mixture analysis problems, manual segmentation of a spectrum using prior knowledge, gained from e.g. HRDOSY processing, will offer the most powerful approach.
ConclusionsMixture analysis is a complex and demanding task. DOSY is one non-destructive and relatively swift technique in the analyst's repertoire that has consistently gained in interest and application as it has developed. The method encompasses a variety of processing approaches, and is most powerful when the results of different methods are compared. In the all too common case where the NMR spectra of similar mixture components overlap, OUTSCORE can utilise the information available from non-overlapped signals to much better effect than earlier methods. All of the processing above used the DOSYToolbox (33), which is free to download.
Notes and referencesaSchool of Chemistry, University of Manchester, Oxford Road, Manchester, M13 9PL,UK. Tel: +44161 3064665; E-mail: [email protected] Laboratory, Gamle Carlsberg Vej 10, 1799 Copenhagen V, DenmarkcUniversity of Copenhagen, Dept. of Food Science, Rolighedsvej 30, DK-1958, Frederiksberg, Denmark. Tel: +45 35 33 35 10; E-mail: [email protected]† Electronic Supplementary Information (ESI) available: full NMR spectra for both samples & comparison to reference spectra for progesterone & estradiol, simple mixture and S/N performance comparison results. See DOI: 10.1039/b000000x/1 Johnson, C. S. Prog. Nucl. Magn. Reson. Spectrosc.1999, 34, 203
256.2 Morris, G. A. Diffusion-Ordered Spectroscopy. eMagRes 2009. DOI:
10.1002/9780470034590.emrstm0119.pub2.3 Stilbs, P. Anal. Chem., 1981, 53, 2135-2137.4 Sinneave, D. Concepts Magn. Reson. A.2012, 40A, 39-65.5 Stejskal, E. O.; Tanner, J. E.J. Chem. Phys.1965, 42, 288.6 Barjat, H.; Morris, G. A.; Smart, S.; Swanson, A. G.; Williams, S.
C. R. J. Magn. Reson., Ser. B.1995, 108, 170–172.7 Botana, A.; Aguilar, J. A.; Nilsson, M.; Morris, G.A. J. Magn.
Reson.2011, 208, 270-278. 8 Nilsson, M.; Connell, M. A.; Davis, A. L.; Morris, G. A. Anal.
Chem. 2006, 78, 3040-3045.9 Provencher, S. W.; Vogel, R. H. In Numerical Treatment of Inverse
Problems in Differential and Integral Equations; Deuflhard,P.; Hairer, E., Eds.; Birkhäuser: Boston, 1983; pp 304 319.
10 Provencher, S. W. Comput. Phys. Commun.1982, 27, 229–242.11 Delsuc, M. A.; Malliavin, T. E. Anal. Chem. 1998, 70, 2146–2148.12 Urbańczyk, M.; Bernin, D.; Koźmiński, W.; Kazimierczuk, K.Anal.
Chem., 2013, 85(3), 1828-1833.13 Nilsson, M.; Morris, G. A. Chem. Commun.2007, 933–935.14 Islam, S.; Aguilar, J. A.; Powner, M. W.; Nilsson, M.; Morris, G. A.;
Sutherland, J. D. Chem. Eur. J. 2013, 19, 4586-4595.15 Barjat, H.; Morris, G. A.; Swanson, A. G. J. Magn. Reson. 1998,
131, 131-138.16 Wu, D.; Chen, A.; Johnson, C. S., Jr. J. Magn. Reson., Ser. A, 1996,
121, 88.17 Nilsson, M.; Gil, A. M.; Delgadillo, I.; Morris, G. A. Chem.
Commun.2005, 1737-1739.18 Wu, D. H.; Chen, A. D.; Johnson, C. S. J. Magn. Reson., Ser. A,
1996, 123, 21519 Botana, A.; Howe, P.W.; Morris, G.A.; Nilsson, M. J. Magn.
Reson.2011, 211,25–29.20 Antalek, B. Concepts Magn. Reson. 2002, 14, 225–258.21 Stilbs, P.; Paulsen, K. Rev. Sci. Instrum.1996, 67, 4380–4386.22 Nilsson, M.; Morris, G. A. Anal. Chem.2008, 80, 3777–3782.23 Stilbs, P. J. Magn. Reson. 2010, 207, 332–336. 24 Colbourne, A.; Morris, G.A.; Nilsson, M.N. J. Am. Chem. Soc.
2011, 133, 7640-7643.25 Martini, B. R.; Mandelshtam, V. A.; Morris, G. A.; Colbourne, A. A.;
Nilsson, M. J. Magn. Reson., 2013, 234, 125-134. 26 Connell, M. A.; Bowyer, J. P.; Bone, P. A.; Davis, A. L.; Swanson,
A. G.; Nilsson, M.; Morris, G. A. J. Magn. Reson.2009,198, 121.
27 Morris, G. A. Reference Deconvolution. eMagRes 2009. DOI:10.1002/9780470034590.emrstm0449.
28 Stilbs, P. Eur. Biophys. J., 2013,42, 25-32.29 Nuzillard, D.; Bourg, S.; Nuzillard, J.-M. J. Magn. Reson., 1998, 133,