168
ANNUAL REPORT 2019

A N N U A L R E P O R T 2 0 1 9
SA
LM
AR
ÅR
SR
AP
PO
RT
20
19

SalMar Northern Norway
SalMar JapanSalMar South Korea
SalMar TaiwanYu Fish
Singapore
Arnarlax Ehf
SalMar Vietnam
SalMar Central Norway
Scottish Sea Farms LTD

ContentsThis is SalMar 4
Message from the CEO 8
The history of SalMar 12
A new era in aquaculture 14
The ABC of salmon farming 18
SalMar's operative segments 20
SalMar's cultural tenets 24
Passion for Salmon 26
Sustainability and corporate social responsibility 28
Corporate governance at SalMar ASA 58
Executive management 67
Shareholder information 69
Report of the Board of Directors 2019 72
Renumeration statement to senior executives 88
Consolidated financial statements SalMar ASA 2019 90
Notes to the financial statements 2019 96
Annual financial statements SalMar ASA 2019 144
Notes to the Financial Statements SalMar ASA 2019 150
Statement by the board of directors and CEO 161
Auditor's report 163

This is SalMar
4

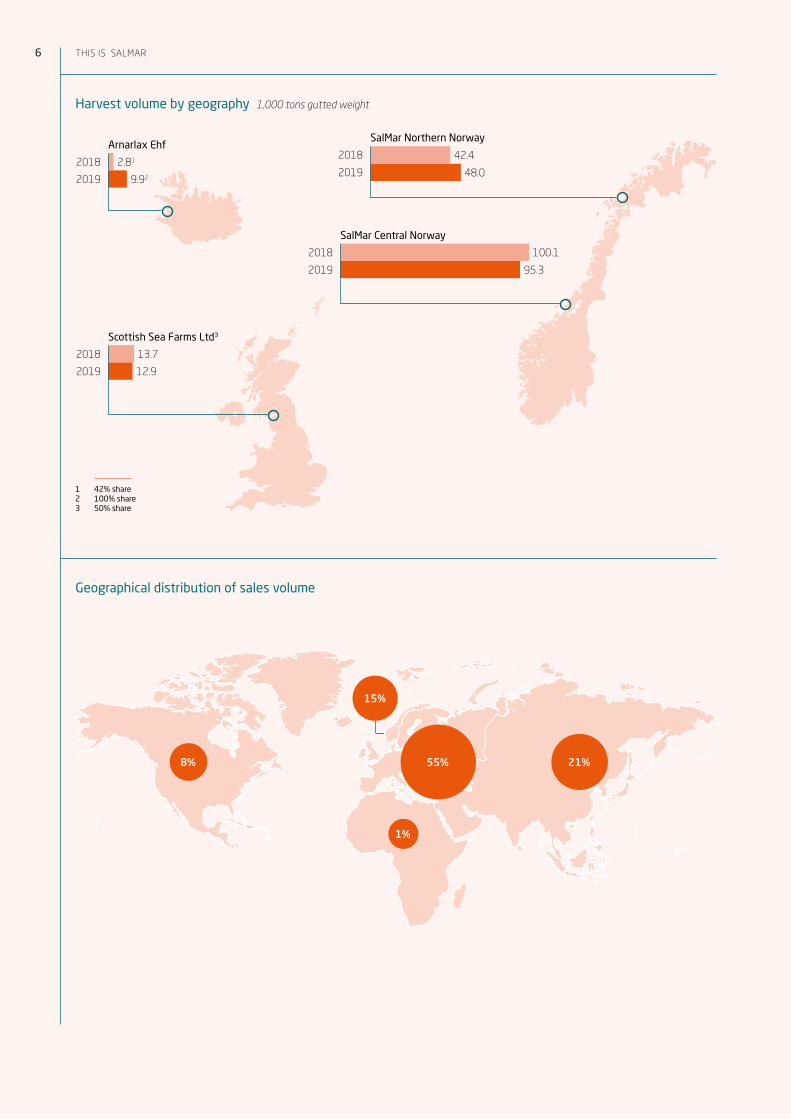
Harvest volume by geography 1,000 tons gutted weight
Geographical distribution of sales volume
2018 2.81
2019 9.92
Arnarlax EhfSalMar Northern Norway
2018 42.4
2019 48.0
SalMar Central Norway
2018 100.1
2019 95.3
2018 13.7
2019 12.9
Scottish Sea Farms Ltd3
1 42% share2 100% share3 50% share
15%
8%
1%
55% 21%
6 This is salMar

Financial key figures
NOK 1,000 2019 2018
Revenue 12,238 11,343
Operational EBIT 3,068 3,461
Earnings per share 22.06 31.70
Dividend share of EPS - 73%
Equity share 54% 60%
NIBD/EBITDA 0.77 0.39
Number of FTEs
74% Men 26% Women
2019 Women Men
ASA 34 15 18
Hatcheries 92 17 74
Fish Farming 605 54 551
Sales & Processing 862 331 531
Arnarlax 110 24 86
SalMar Group 1,703 442 1,261
Sickness absence and H1-value
1 Ex. Arnarlax.
Sickness absence 2019 2018
SalMar 5.3% 5.5%
Arnarlax 4.1%
Goal < 4.5% < 4.5%
H1-value 2019 2018
SalMar1 7.3 12.2
Annual emissions kg CO2e per tonne live fish
Water consumption
1,000 m3 2019 2018
SalMar 58,346 57,316
– Surface water 57,557 56,479
– Municipal water 790 837
– Ground water - -
Arnarlax 7,979
– Surface water 2,628
– Municipal water 95
– Ground water 5,256
98.8 99.5 98.5
0
20
40
60
80
100
120
2019 2018 2017
7

Message from the CEO
The Covid-19 coronavirus pandemic has shaken the whole world and shown us how vulnerable we are. In the face of an invisible and implacable enemy, who attacks out of the blue, we are all small and helpless. So we must be even more grateful for our ability to work together to combat the spread of infection. Naturally, we extend our heartfelt thanks to the many thousands working in our health service, who have kept going day and night to take care of the sick, and to the public authorities for the resolute measures they have implemented to curb transmission of the disease and avoid overloading the hospitals at a time when we need them most. I would also like to thank the authorities for quickly introducing extensive emergency relief measures to help soften the financial impact that both employees and companies have experienced as a consequence of the health restrictions imposed.
8

In the most serious crisis that Norway and the world at large has experienced in modern peacetime, we should also pay tribute to the community spirit that is an inherent part of Norwegian culture. All over Norway, companies, individuals and organisations have been working hard to ensure that our country works as well as it can in this time of crisis, and emerges from it with all the optimism and vitality that characterise its citizens.
Food won’t go out of fashionSalMar was in a more fortunate position than many of the companies that lost all their sales revenues practically over-night, and were forced to temporarily lay off staff with imme-diate effect. As our trade union representative at InnovaMar, Bente Marie Kvam, said so succinctly on television when she was asked how she saw the outlook for SalMar after the first week of restrictions imposed by the authorities: “Food, it kind of never goes out of fashion.” That is why SalMar, along with other food producers, is extremely pleased to have been able to offer jobs to a fair number of people who have been laid off from other companies.
But even SalMar has experienced how vulnerable we can be in a situation like this, where closed borders, closed cafes and restaurants, and liquidity problems affect the logistics and transport chains that we depend on to get our products to market. Halting production at the processing facility can also have major consequences. In these challenging times, our employees and partners have put in an impressive per-formance. They have made it possible for us to maintain our society-critical operations, which is to bring quality food to people in Norway and the rest of the world.
In this foreword, there is no need to repeat the facts and figures to be found elsewhere in the board of directors’ report. But some figures and remarks from me on our results and on our outlook are still appropriate.
Challenges and opportunitiesIf you look at 2019 as a whole, it is clear that it was a good, but challenging year for SalMar. We generated gross revenues of NOK 12.2 billion, made an Operational EBIT of NOK 3.1 bil-lion and harvested 153,000 tonnes of salmon, which shows very clearly that SalMar is moving forward and creating strong financial results. At the same time, biological challenges led to an increase in production costs, and therefore a lower net profit than in 2018. SalMar has always been among the most cost-effective fish farming companies, and we will continue to be so. Through our ambition to be the world’s best aquaculture company, we strive constantly to cut our production costs and boost our operational efficiency. At the same time, everything we do must be on the salmon’s terms and be sustainable biologically and environmentally. This
requires a detailed focus on organisation, culture, working methods, R&D and the development of operating concepts. It is challenging, but leading the field must be challenging – and it produces results.
Norway’s aquaculture industry has undergone a formida-ble evolution. In the early 1970s, 100 tonnes of salmon were produced along the Norwegian coast. In 2019, this had risen to 1.3 million tonnes. The increase is the result of a continuous effort on the part of the industry and its suppliers to improve, as well as new, more secure and more effective salmon production methods. Today, the aquacul-ture industry, along with other maritime sectors, constitutes the world’s strongest maritime cluster, as demonstrated in a research report by professors Ragnar Tveterås, Torger Reve and Bård Misund. It is one of the country’s most important export industries, which has created growth and employment opportunities, and thereby breathed new life into coastal communities that were suffering from economic and pop-ulation decline. According to the research report, with the right framework conditions, the aquaculture industry has “Norway’s best opportunities going forward to create jobs along the coast, with a strong capacity for value creation and the power to contribute to [local] prosperity.”
Thanks for this food-producing boom should, in large part, go to foresighted entrepreneurs on the Norwegian coast who, 50 years ago, cracked the code and seized the opportunities to produce salmon in their local ‘blue fields’. This took place at a time when dark clouds hung heavy over many coastal communities. Yet solutions-oriented people saw opportuni-ties, different companies worked together and with the public authorities to create jobs and bring communities back from the brink. This coastal culture and ability to act decisively has been a crucial factor in arriving where the aquaculture indus-try is today. It is vital that we take it with us going forward in this time of crisis. We must straighten our spines, identify opportunities and plan for the future. At SalMar, crisis or no crisis, we work methodically every day to produce one of the healthiest and most sustainable foods in the entire world.
Spearheading offshore fish farmingOffshore salmon farming is an important part of SalMar’s strategy for sustainable growth, and we are proud to be spearheading this effort. It has required huge investments in advanced new equipment technologies. And it would not have been possible if the government and a united Norwe-gian parliament had not introduced the development licence scheme. This shows the importance of collaboration between government and business to resolve the key environmen-tal and space-related challenges the aquaculture sector is facing. Offshore aquaculture equipment technology is the result of close cooperation between SalMar’s fish farming expertise and leading Norwegian research, development and
10 Message froM the Ceo
industrial environments. It combines Norwegian aquaculture and offshore oil & gas competence. We are now approaching the completion of the second production cycle at the offshore facility Ocean Farm 1. And the strong performance achieved so far, with respect to fish health and growth, gives us great confidence in our choice of direction.
We are now also in full swing with the development of the Smart Fish Farm, through our subsidiary MariCulture. With this project, we will go the whole way and establish fish farming in the open ocean. When this happens, we will have achieved our ambition to produce salmon on their own terms and in their own natural habitat, unconstrained by limita-tions imposed by the equipment we use. The establishment of the subsidiary SalMar Ocean AS, which will have overall responsibility for the Group’s offshore fish farming efforts, is clear proof that SalMar intends to retain and reinforce its leading position in this field. At the same time, SalMar will continue to be a leader in traditional inshore fish farming, will take its relative share of future volume growth, be a driving force for industrial development and, as always, strive for cost leadership.
Such efforts require significant investment. Not just in the projects alone, but also in the infrastructure needed along the entire value chain. This applies, for example, to invest-ments in new production volume awarded under the new ‘traffic light system’, in the expansion of hatchery capacity, new harvesting and processing facilities and an extensive programme of facilities maintenance and upgrades. These are major industrial projects along the Norwegian coast, which will ensure that SalMar remains and the forefront and is rigged for sustainable growth. These investments also give SalMar the opportunity to create industrial clusters, attract well-qualified staff and develop strong centres of excellence within different segments in different regions.
Fair competitionThe crisis that has hit Norway and the countries to which we export has laid a damper on the political debate, also with respect to the introduction of new taxes on Norwegian seafood. The crisis has shown the importance of cohesion and solutions that command broad support. It has also shown the importance of Norwegian food production and industrial infrastructures. Fortunately, in its responses to the report (NOU 18:2019) issued by the government-appointed com-mission tasked with assessing additional taxation on the aquaculture sector, a united Norwegian business sector has warned strongly against the proposed introduction of an ‘economic rent tax’, which does not exist in any other country.
All over the world, vast amounts are now being invested in fish farming facilities on shore and at sea in locations close to the major salmon markets. Technological developments are
eating into our environment-related competitive advantage. An extraordinary tax that pushes Norway out of step with the rest of the world will screw investment away from the Norwegian coast and towards other countries’ coastlines and land areas. Supplier companies and research institutions around the world also stand ready to seize the opportunities afforded by developments in an industry in which Norway has, until now, been the global leader. Let us hope that the Nor-wegian authorities, on a cross-party basis, discard the idea of an ‘economic rent tax’ as soon as possible, so the aquaculture sector can enjoy the same stability and foreseeability with respect to taxation as the rest of Norwegian industry.
Faith in the futureSalMar still wants to be an important contributor to soci-ety, a major taxpayer, an industrial locomotive that creates more and more jobs and rising prosperity that benefit the community as a whole. Our 1,700 employees are our most important resource, not our factories or physical installations. It is our employees who deserve to be called “the best in the world”. They deserve credit for the way they have helped to make SalMar in 2019 the most profitable Norwegian salmon producer, yet again. We are therefore investing heavily in the SalMar School, to provide professional development for our employees and to provide an arena where they can come together to develop our culture, attitudes and best practices.
In the deeply serious situation we as a nation are experi-encing, we must not forget the opportunities that lie ahead. There is light at the end of the tunnel. At SalMar, we intend to come through this stronger and with a greater capacity for growth than ever before. When the Covid-19 pandemic broke out, SalMar had plans to invest millions of kroner in factories and production equipment up and down the Norwe-gian coast. Most of this is currently under construction. The crisis has not made one iota of difference to our ambitious investment plans. On the contrary, it has strengthened our conviction that these projects must be realised. The best days for Norway’s aquaculture industry – and for Norway as a whole – still lie ahead.
I am confident that SalMar, with its employees, its culture and its expertise, has what it takes to remain at the forefront in the future as well. What we do today, we will do better than yesterday. And we will strive to satisfy all the links in the value chain, right out to the end user in the market. Our task is to produce and distribute health-bringing salmon to every corner of the world. This is our passion – a Passion for Salmon. I would like to thank all of SalMar’s employees for their hard work and dedication through the year now past.
Gustav
11
The history of SalMar
SalMar was founded in February 1991 following the acquisition of a licence for the production of farmed salmon and a white fish harvesting/processing plant from a company that had gone into liquidation.
These events took place during one of the most turbulent periods in the history of the Norwegian aquaculture industry, which sub-sequently also led to the collapse of the fish farmers’ own sales organisation (Fiskeoppdretternes Salgslag AL) in November that same year. It was precisely this company’s failure, and the so-called salmon mountain, that helped lay the foundations for the secondary processing operations which are a cornerstone of the SalMar story. Up until then the vast majority of Norwegian salmon had been exported as fresh or frozen round gutted fish. This was the start of a major restructuring of the Norwegian aquaculture sector, which gradually led to a substantial increase in its level of industrialisation.
12

1991 SalMar is founded in Frøya in Sør-Trøndelag following the acqui-sition of one licence for the production of farmed salmon and a harvesting/processing plant from a company that had gone into liquidation. The company’s primary business was the processing of frozen salmon. This was the start of a major restructuring of the Norwegian aquaculture sector, which gradually led to a substantial increase in its level of industrialisation.
1992 Acquisition of two licences for the production of farmed salmon in Central Norway.
1995 Acquisition of Follasmolt AS in Verran, Nord-Trøndelag. Start of smolt production. Lease of Kjørsvik Settefisk’s hatchery in Aure, Møre & Romsdal.
1997 Extension of the plant at Nordskaget in Frøya to increase process-ing capacity. • Kverva Holding AS becomes sole owner of SalMar.
2000 Total volume harvested: 11,000 tonnes gutted weight. Establishment of operations outside of Central Norway through the acquisition of 49% of the shares in Senja Sjøfarm AS in Troms. At that time Senja Sjøfarm had nine production licences and its own hatchery.
2001 Total volume harvested: 15,000 tonnes gutted weight. Establishment of operations outside Norway through Norskott Havbruk AS, a 50/50 joint venture with Lerøy Seafood Group. Norskott Havbruk AS is sole owner of Scottish Sea Farms Ltd, the UK’s second -largest salmon producer.
2005 Total volume harvested: 35,000 tonnes gutted weight. Divestment of operations SalMar does not consider to be core businesses, including t he production of herring, herring oil and fish meal. • Greater focus on core business activities, farming, harvesting and processing of salmon.
2006 Total volume harvested: 44,000 tonnes gutted weight. Kverva Holding AS sells 42.5% of the company’s shares to a limited number of Norwegian and international investors. • Acquisition of three new licenses in Nordmøre. • Acquisition of the remaining 51% of the shares in Senja Sjøfarm AS, making SalMar sole owner of the company.
2007 Total volume harvested: 64,000 tonnes gutted weight. SalMar shares floated on the Oslo Stock Exchange on 8 May 2007. Acquisition of Halsa Fiskeoppdrett AS (two licences) and Henden Fiskeoppdrett AS (two licences) in Møre & Romsdal. Acquisition of Arctic Salmon AS (four licences) in Nordreisa, Troms.
2008 Total volume harvested: 65,000 tonnes gutted weight. Acquisition of one licence in Central Norway (Møre & Romsdal) and one in Northern Norway (Troms). • Senja Sjøfarm AS is renamed SalMar Nord AS. The Company now includes all SalMar’s operations in Troms. • Acquisition of 34% of the shares in Volstad Seafood AS.
2009 Total volume harvested: 77,000 tonnes gutted weight. Acquisition of the remaining 66% of the shares in Volstad Seafood AS, making SalMar sole owner of the company.
2010 Total volume harvested: 79,000 tonnes gutted weight. Acquisition of 75.54% of Rauma Gruppen AS. Broodfish, two hatcheries and eight fish farming licenses in Central Norway (Møre & Romsdal). • Acquisition of 23.29% of the shares in the listed Faeroe Islands company Bakkafrost P/f. • Acquisition of Settefisk AS.
2011 Total volume harvested: 104,000 tonnes gutted weight. Completion of the world’s most innovative and efficient salmon harvesting and processing plant – InnovaMar. • Acquisition of Bringsvor Laks AS with two licences in Central Norway (Møre & Romsdal). • Acquisition of Krifo Havbruk AS with one licence in Central Norway (Trøndelag). • Leif Inge Nordhammer steps down as CEO and is replaced by Yngve Myhre on 6 June. • Acquisition of Villa Miljølaks AS with four licenses in Central Norway (Møre & Romsdal). • Acquisition of a further 1.5% of the shares in Bakkafrost P/f, bringing SalMar’s total shareholding to 24.8%.
2012 Total volume harvested: 116,100 tonnes gutted weight.Acquisition of 10 licenses in Northern Norway (Finnmark) from Villa Artic AS. • Acquisition of additional shares in Bakkafrost P/f, bringing SalMar’s total shareholding to 25.21%.
2013 Total volume harvested: 128,000 tonnes -gutted weight. Acquisition of minority shares in SalMar Rauma AS. • Acquisition of 50.4% of the shares in Villa Organic AS. • Divestment in Bakkafrost P/f. New share holding approximately 14.9%. • Divestment of remaining 14.9% of shares in Bakkafrost P/f. • Following the transaction SalMar has no shares in Bakkafrost P/f.
2014 Total volume harvested: 154,800 tonnes gutted weight. Yngve Myhre steps down as CEO and is replaced by Leif Inge Nordhammer on 20 January. Nordhammer previously served as SalMar’s CEO for a period of 15 years until he stepped down in 2011. • Acquisition of 8 green licenses.
2015 Total volume harvested: 150,000 tonnes gutted weight. Principle approval of the ocean farming pilot. • Completion of acquisition that ensures an indirect stake of 22.91% of the shares in the Icelandic farming company Arnarlax Ehf.
2016 Total volume harvested: 129,600 tonnes gutted weight. On 28 February 2016, SalMar was awarded the first eight aquaculture development licences for Ocean Farming AS. • SalMar increased its indirect shareholding in the Icelandic aquaculture company Arnarlax Ehf to 34 per cent through a series of acquisitions. • On 11 May 2016, the board announced that Trond Williksen would be taking over as CEO from Leif Inge Nordhammer. Mr. Nordhammer had himself requested leave to step down, having held the position for more than 17 years, spread over two periods. • Mr. Williksen took up the position on 14 November 2016.
2017 Total volume harvested: 151,000 tonnes gutted weight. On 5 September 2017, Ocean Farm 1 arrived at its destination in Frohavet, off the Trøndelag coast • The new smolt production facility in Senja was completed – capacity 20 million smolt.
2018 Total volume harvested 159,000 tonnes gutted weight including share from Scotland and Iceland. • Harvesting from Ocean Farm 1 – the worlds first offshore fish farm – started in September 2018. • Olav-Andreas Ervik took over as new CEO in April 2018 after Trond Williksen’s voluntary resignation.
2019 Harvest volume 166,200 tonnes gutted weight including contri-bution from Scotland. Increased ownership of Arnarlax, Iceland largest salmon farmer, to 59%. Gustav Witzøe new CEO from October 2019 following Olav-Andreas Ervik appointment as new CEO in the newly founded company SalMar Ocean which strength-ens the focus on offshore fish farming. • Started construcion of InnovaNor, the new harvesting and processing plant on Senja in Northern Norway.
13

A new era in aquaculture
The establishment of salmon farming in the open ocean is an important part of SalMar’s strategy for sustainable growth. Salmon farming is a climate-friendly and effective method of food production. In the open ocean, it could allow for both increased output and value creation, as well as encourage innovation and the development of new technology.
14

SalMar leads the way for salmon farming in the open oceanIn 2016 the first eight aquaculture development licences to was granted to Ocean Farming AS and early in 2019, Mari-Culture AS was granted eight licences for the development of an open-ocean aquaculture facility. Both companies are part of the SalMar Group. The purpose of these licences is to promote increased investment in sustainability, desired changes in production methods, innovation and increased overall value creation in the industry. The threshold for being granted a development licence is high. The fact that SalMar has received such licences is an important testament to the Group’s research and development efforts. The develop-ment licences have been granted for a period of seven years. However, they may be converted into ordinary production licences if the Norwegian Directorate of Fisheries’ target criteria are met.
Strengthened its efforts through the establishment of SalMar OceanTo strengthen and concentrate its efforts in the area of off-shore aquaculture, SalMar has created the subsidiary SalMar Ocean AS, under the leadership of the Group’s former CEO Olav-Andreas Ervik. Henceforward, SalMar Ocean will take responsibility for the Group’s offshore fish farming activi-ties. The Group’s ambition is to retain its leadership in this field, with respect to both technological advancements and biological production. In this way it aims to contribute to the environmentally sustainable development of the Nor-wegian aquaculture sector. There will be close cooperation and interaction between the Group’s offshore and tradi-tional coastal fish farming operations, to ensure that mutual transfer of knowledge and experience benefits both parts of the business.
Early in 2020, Torger Rød joined the board of directors of Sal-Mar Ocean. Rød has a background from Equinor and therefore brings with him considerable experience of complex projects from the oil & gas and renewables sectors, which will be useful for SalMar Ocean in the coming years.
Ocean Farm 1’s good biological performance strengthens confidence in offshore fish farming Ocean Farm 1, which is situated in an area of sea called Frohavet, off the coast of Frøya, has been a pilot project focusing particularly on biological conditions and fish welfare. It is a large and challenging project, which has involved the testing and development of new and innovative equipment technology that will be of benefit to the whole industry. After 15 months at sea, the first production cycle was concluded early in 2019. The fish achieved good growth and a uniform high quality. Few salmon lice were observed and it was not necessary to apply any delousing treatments. At the same
time, costs were in line with the Group’s best-performing traditional sea farms.
A second generation of fish was transferred to Ocean Farm 1 in August 2019, after a number of measures were imple-mented on the basis of lessons learned during the previous production cycle. So far, biological performance is very good and shows further improvements compared with the first generation. The fish are achieving good growth, there is a consistently low sea lice levels and low mortality. This second generation is expected to be harvested in the autumn of 2020. The promising biological results from the first and second production cycles reinforce our confidence that farm-ing salmon further out in the ocean is the right direction.
Next step – production in the open oceanThe award of eight development licences for the Smart Fish Farm project marks a substantial step towards the establish-ment of aquaculture in the open ocean. The objective is to locate the fish farm in open water, 20–30 nautical miles off the coast. Nothing similar has ever been attempted before. An important aspect will be to test the way technology and biology interact in such exposed surroundings.
In its licence-award letter, the Norwegian Directorate of Fish-eries describes in detail how the concept differs materially from SalMar’s existing offshore installation, Ocean Farm 1. It will withstand considerably more exposed conditions and have twice the capacity. However, the biggest difference is that it will have a sealed central column for the treatment of fish, the control and management of the unit, as well as an advanced system for the transportation of fish linked to the eight surrounding production chambers.
This new equipment technology could help to realise the Norwegian government and parliament’s ambition to make Norway the world’s leading seafood nation. The unit will com-bine important environmental aspects of open-net fish farms with closed-containment technology. The Smart Fish Farm will be largely immune from environmental impact caused by other fish farms because it can be situated in any exposed area along the whole Norwegian coast where the outer ocean currents flow. At the same time, its design allows fish to receive necessary treatments in a closed environment, from which there are no emissions.
Contributing to sustainable growth and equipped for R&DSalMar considers that a precondition for sustainable growth in the aquaculture sector is the ability to operate in new locations, where sea temperatures and ocean currents pro-vide optimal biological conditions for the farming of fish. The purpose of these projects is to develop the technology that
15

will make this possible. They will also be of great significance for the Norwegian aquaculture industry’s long-term compet-itiveness and will strengthen Norway’s position as a global leader in offshore fish farming.
Both these projects are equipped to undertake a variety of R&D tasks relating to biological conditions and fish welfare. As such, they will help promote further development in the aquaculture sector and the applied R&D relating to it. It is important that the operational experience provided by the pilot facilities leads to the industrial-scale construction of this type of ocean-going fish farms.
16 A new erA in AquAculture
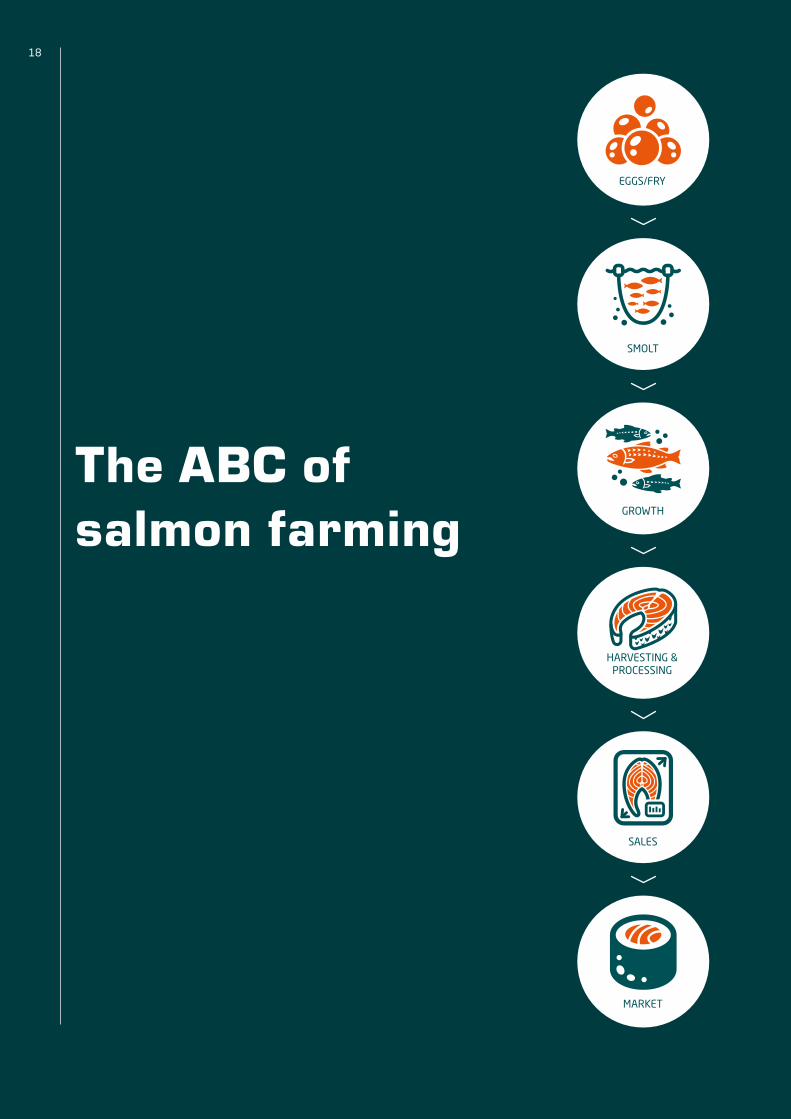
The ABC of salmon farming
EGGS/FRY
SMOLT
GROWTH
HARVESTING & PROCESSING
SALES
MARKET
18

BroodstockThe broodstock are the parent fish which provide the eggs and sperm (milt) required to produce new generations. The fertilised eggs take 60 days to hatch when placed in an incubator kept at eight degrees Celsius.
Eyed salmon eggsAfter 25–30 days in the incubator the eggs have developed to the stage where the eyes of the salmon are clearly visible as two black dots inside the egg.
FryThe egg hatches when the eggshell cracks open, liberating the baby fish (fry) inside. When it hatches the fry is attached to a yolk sac, which provides it with the sustenance it needs during its first few weeks of life. From now on the fish’s growth and development will all depend on temperature.
Initial feedingWhen most of the yolk sac has been absorbed, the fry can be moved from the incubator into a fish tank. They are now ready for initial feeding. The water temperature is kept at 10-14 -degrees Celsius, and the fry are exposed to dim lighting 24 hours a day. The initial feeding period lasts for six weeks. As they grow the fry are sorted and moved to larger tanks. Well ahead of their “smoltification” all the fish are vaccinated before being shipped by wellboat to the fish farm’s marine net-pense.
SmoltificationThe process whereby the juvenile fish transition from a life in freshwater to a sea-going existence is called smoltification. During this process the fish develop a silver sheen to their bellies, while their backs turn a blue-green colour. Their gills also change when the juvenile fish turns into a smolt.
On-growingThe farming of fish for human consumption takes place in net-pens, large enclosed nets suspended in the sea by flotation devices. In addition to a solid anchorage, net-pens require regular cleaning and adequate measures to prevent the farmed fish from escaping. Growth in the net-pens is affected by feeding, light and water quality. Here too the fish are sorted as they develop and grow.
Harvesting & processingA year after transfer to the marine net-pens, the first fish are ready for harvesting. The fish are transported live by wellboat to the processing plant. There the fish are kept in holding pens, before being carefully transferred to the plant itself. The fish are killed and bled out using high tech equipment, and always in accordance with applicable public regulations. After harvesting the salmon is subject to various degrees of processing.
SalesThe fish is sold either as whole gutted salmon (fresh or frozen), fillets, in individual portions or a wide range of other products,
19

SalMar's operative segments
20
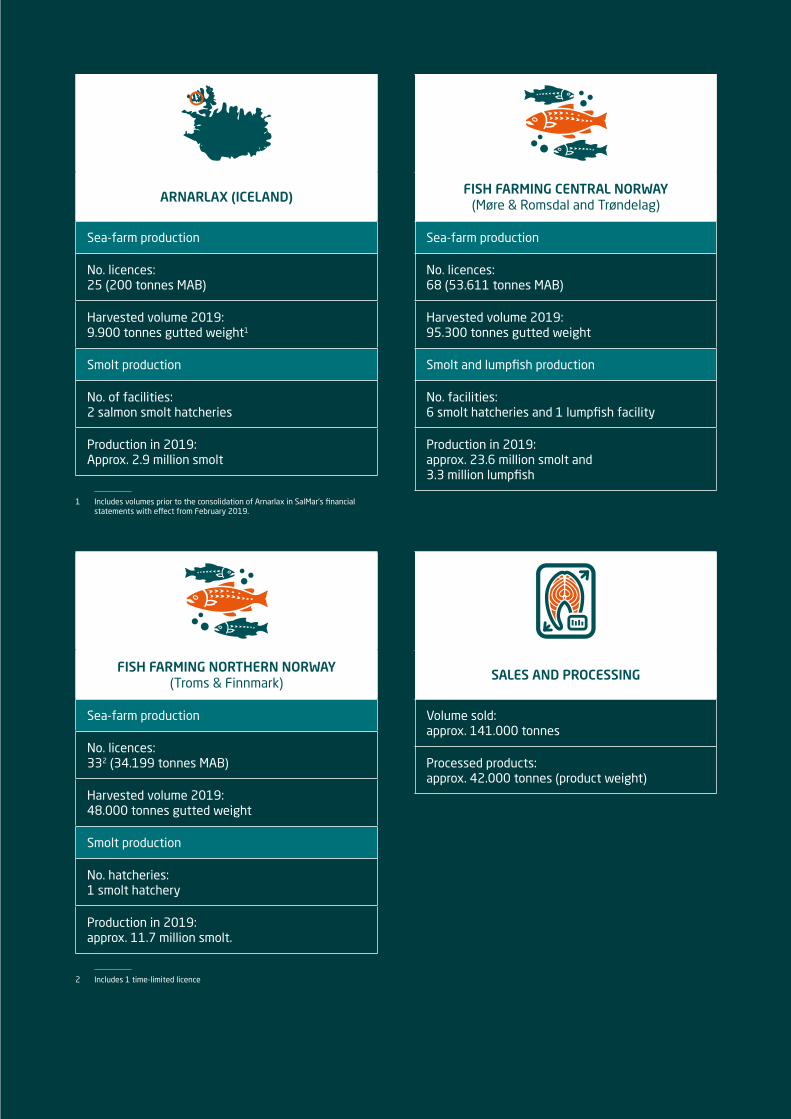
ARNARLAX (ICELAND)
Sea-farm production
No. licences:25 (200 tonnes MAB)
Harvested volume 2019:9.900 tonnes gutted weight1
Smolt production
No. of facilities:2 salmon smolt hatcheries
Production in 2019: Approx. 2.9 million smolt
1 Includes volumes prior to the consolidation of Arnarlax in SalMar’s financial statements with effect from February 2019.
FISH FARMING CENTRAL NORWAY (Møre & Romsdal and Trøndelag)
Sea-farm production
No. licences:68 (53.611 tonnes MAB)
Harvested volume 2019:95.300 tonnes gutted weight
Smolt and lumpfish production
No. facilities:6 smolt hatcheries and 1 lumpfish facility
Production in 2019:approx. 23.6 million smolt and 3.3 million lumpfish
FISH FARMING NORTHERN NORWAY (Troms & Finnmark)
Sea-farm production
No. licences:332 (34.199 tonnes MAB)
Harvested volume 2019:48.000 tonnes gutted weight
Smolt production
No. hatcheries:1 smolt hatchery
Production in 2019:approx. 11.7 million smolt.
2 Includes 1 time-limited licence
SALES AND PROCESSING
Volume sold:approx. 141.000 tonnes
Processed products:approx. 42.000 tonnes (product weight)
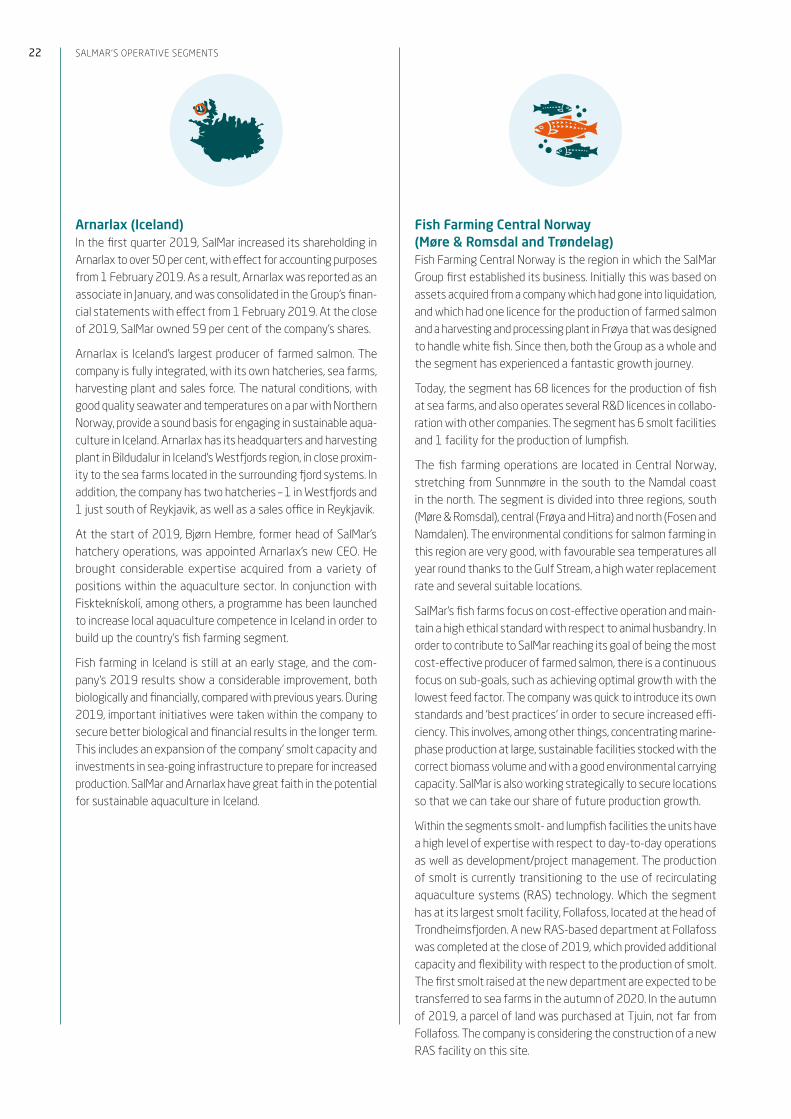
Arnarlax (Iceland)In the first quarter 2019, SalMar increased its shareholding in Arnarlax to over 50 per cent, with effect for accounting purposes from 1 February 2019. As a result, Arnarlax was reported as an associate in January, and was consolidated in the Group’s finan-cial statements with effect from 1 February 2019. At the close of 2019, SalMar owned 59 per cent of the company’s shares.
Arnarlax is Iceland’s largest producer of farmed salmon. The company is fully integrated, with its own hatcheries, sea farms, harvesting plant and sales force. The natural conditions, with good quality seawater and temperatures on a par with Northern Norway, provide a sound basis for engaging in sustainable aqua-culture in Iceland. Arnarlax has its headquarters and harvesting plant in Bildudalur in Iceland’s Westfjords region, in close proxim-ity to the sea farms located in the surrounding fjord systems. In addition, the company has two hatcheries – 1 in Westfjords and 1 just south of Reykjavik, as well as a sales office in Reykjavik.
At the start of 2019, Bjørn Hembre, former head of SalMar’s hatchery operations, was appointed Arnarlax’s new CEO. He brought considerable expertise acquired from a variety of positions within the aquaculture sector. In conjunction with Fiskteknískolí, among others, a programme has been launched to increase local aquaculture competence in Iceland in order to build up the country’s fish farming segment.
Fish farming in Iceland is still at an early stage, and the com-pany’s 2019 results show a considerable improvement, both biologically and financially, compared with previous years. During 2019, important initiatives were taken within the company to secure better biological and financial results in the longer term. This includes an expansion of the company’ smolt capacity and investments in sea-going infrastructure to prepare for increased production. SalMar and Arnarlax have great faith in the potential for sustainable aquaculture in Iceland.
Fish Farming Central Norway (Møre & Romsdal and Trøndelag)Fish Farming Central Norway is the region in which the SalMar Group first established its business. Initially this was based on assets acquired from a company which had gone into liquidation, and which had one licence for the production of farmed salmon and a harvesting and processing plant in Frøya that was designed to handle white fish. Since then, both the Group as a whole and the segment has experienced a fantastic growth journey.
Today, the segment has 68 licences for the production of fish at sea farms, and also operates several R&D licences in collabo-ration with other companies. The segment has 6 smolt facilities and 1 facility for the production of lumpfish.
The fish farming operations are located in Central Norway, stretching from Sunnmøre in the south to the Namdal coast in the north. The segment is divided into three regions, south (Møre & Romsdal), central (Frøya and Hitra) and north (Fosen and Namdalen). The environmental conditions for salmon farming in this region are very good, with favourable sea temperatures all year round thanks to the Gulf Stream, a high water replacement rate and several suitable locations.
SalMar’s fish farms focus on cost-effective operation and main-tain a high ethical standard with respect to animal husbandry. In order to contribute to SalMar reaching its goal of being the most cost-effective producer of farmed salmon, there is a continuous focus on sub-goals, such as achieving optimal growth with the lowest feed factor. The company was quick to introduce its own standards and ‘best practices’ in order to secure increased effi-ciency. This involves, among other things, concentrating marine-phase production at large, sustainable facilities stocked with the correct biomass volume and with a good environmental carrying capacity. SalMar is also working strategically to secure locations so that we can take our share of future production growth.
Within the segments smolt- and lumpfish facilities the units have a high level of expertise with respect to day-to-day operations as well as development/project management. The production of smolt is currently transitioning to the use of recirculating aquaculture systems (RAS) technology. Which the segment has at its largest smolt facility, Follafoss, located at the head of Trondheimsfjorden. A new RAS-based department at Follafoss was completed at the close of 2019, which provided additional capacity and flexibility with respect to the production of smolt. The first smolt raised at the new department are expected to be transferred to sea farms in the autumn of 2020. In the autumn of 2019, a parcel of land was purchased at Tjuin, not far from Follafoss. The company is considering the construction of a new RAS facility on this site.
SalMar'S operative SegMentS22

Fish Farming Northern Norway (Troms & Finnmark)Fish Farming Northern Norway currently has 33 licences for the production of farmed salmon, of which 1 is a demonstra-tion licence. In addition, SalMar Nord co-operates several R&D licences. The segment has 1 smolt facility in Senja.
SalMar has the largest aquaculture operation in Troms & Finn-mark County, with activities stretching from Harstad in southern Troms to Sør-Varanger in Finnmark. The business is divided into two regions: Region South and Region North, which are each led by a regional manager. The segment’s head office and administration are located at Finnsnes in Senja.
Over many years, the segment has focused systematically on enhancing the expertise of its workforce and employs several apprentices. This is an important aspect of SalMar’s recruitment and competence-building strategy.
Remote feeding has been an important focus area for the seg-ment since 2012. This means joint surveillance and control of all SalMar’s sea sites from South Troms to East Finnmark. The sea farms are monitored even when there is no one physically on site. Data collection is more structured in the remote feeding centre, which provides a better foundation for decision making forward in time.
The segment has 1 smolt facility in Senja, which is based on recirculating aquaculture systems (RAS) technology. Robust, high-quality smolt is a decisive factor for the success of the whole value chain. In the autumn of 2019, it was decided to expand the facility. Construction work is expected to commence in the summer of 2020, with completion planned for 2021 and the first smolt transfer in 2022. The expansion will result not only in the capacity to produce a larger number of smolt, but also the flexibility to produce larger sized smolt.
It is possible to produce more salmon in Norway, and Northern Norway has a considerable potential for further growth. This region has excellent environmental conditions for sustainable production, which we nurture through expertise and systematic improvement efforts. The expansion of SalMar’s smolt produc-tion, as well as the decision to build a local harvesting plant, underpin the importance to the Group of both Fish Farming Northern Norway and the region as a whole.
Sales and ProcessingSales and processing handle the Group’s sales activities and land-based industrial activities in Norway. The segment sold approx. 141.000 tonnes of salmon and other fish-based prod-ucts in 2019. Sales activities concentrate on the markets of Europe, Asia and America. In all, the segment distributes salmon to around 50 different countries. Because SalMar attaches par-ticular importance to market proximity, the segment has sales offices in Japan, South-Korea, Vietnam, Taiwan and Singapore.
InnovaMar is SalMar’s main industrial processing facility. It is located at Nordskaget in Frøya, in close proximity to Fish Farm-ing Central Norway’s sea farms. InnovaMar is a modern building covering 17.500 m2. It has an advanced equipment park for harvesting, fileting and portioning. It has the capacity to harvest 75.000 tonnes of salmon annually using a single shift. A signifi-cant portion of the volume harvested goes on to secondary pro-cessing before being sent to customers and consumers around the world. Innovative use of production technology increases the quality of the final product, reduces costs and improves the employees’ working environment. Through SalMar’s co-own-ership of Vikenco AS, SalMar facilitates the harvesting of fish from the southern part of Central Norway and Møre & Romsdal County. In all, Vikenco and InnovaMar produced just over 42.000 tonnes of processed products, measured by product weight.
In 2019, construction of a new harvesting and processing facility got underway in Northern Norway. The facility is called Inno-vaNor. This is an important move to strengthen the region as an important industrial engine in the Group’s development and will contribute to local value creation and new employment opportunities. At the same time, InnovaNor will provide the same flexibility and immediate capacity, as the Group has at its InnovaMar facility in Central Norway, to harvest fish on the terms of biology and contributing to optimising logistics. Construction work is proceeding on schedule, and the facility is expected to go into operation in the summer of 2021.
23

SalMar's cultural tenets
SalMar’s corporate culture is constantly evolving, and builds on the success factors that have been cultivated within the company since its inception in 1991. Although the company’s culture is affected by both external and internal framework conditions, it remains firmly anchored in a few overarching principles, in particular a strong focus on good husbandry, operational efficiency and safe food production.
24
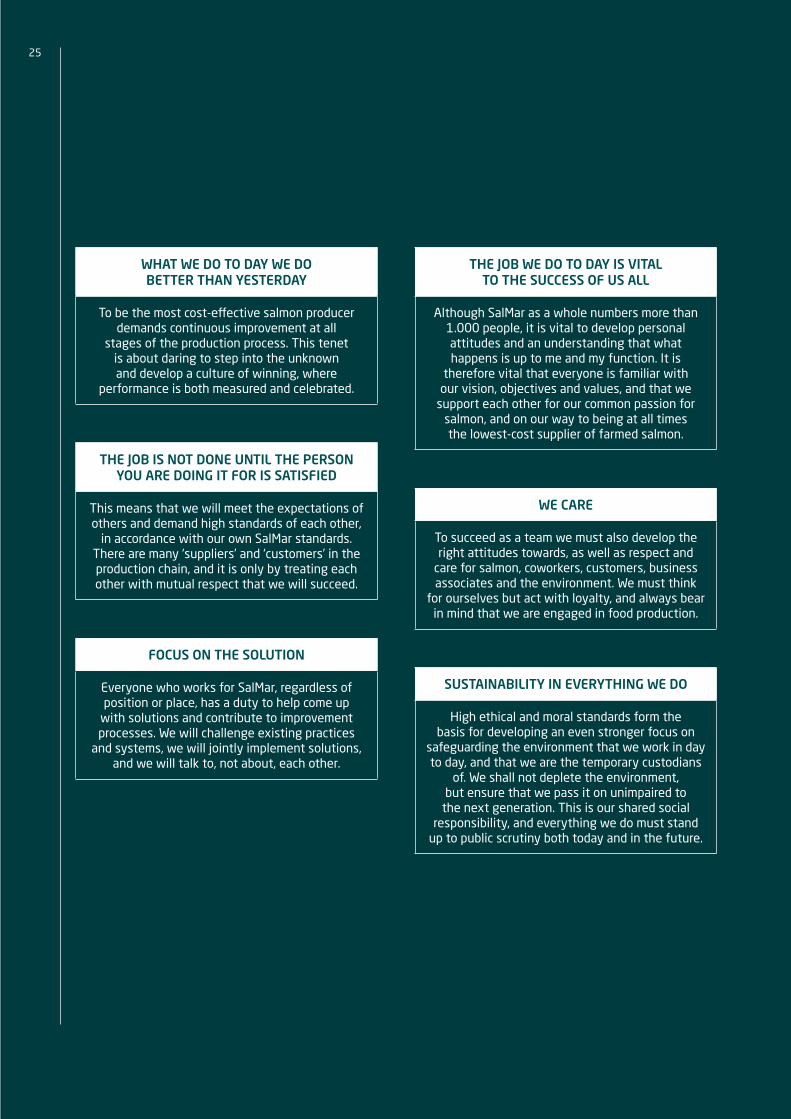
WHAT WE DO TO DAY WE DO BETTER THAN YESTERDAY
To be the most cost-effective salmon producer demands continuous improvement at all
stages of the production process. This tenet is about daring to step into the unknown and develop a culture of winning, where
performance is both measured and celebrated.
THE JOB IS NOT DONE UNTIL THE PERSON YOU ARE DOING IT FOR IS SATISFIED
This means that we will meet the expectations of others and demand high standards of each other,
in accordance with our own SalMar standards. There are many ‘suppliers’ and ‘customers’ in the production chain, and it is only by treating each other with mutual respect that we will succeed.
FOCUS ON THE SOLUTION
Everyone who works for SalMar, regardless of position or place, has a duty to help come up
with solutions and contribute to improvement processes. We will challenge existing practices
and systems, we will jointly implement solutions, and we will talk to, not about, each other.
THE JOB WE DO TO DAY IS VITAL TO THE SUCCESS OF US ALL
Although SalMar as a whole numbers more than 1.000 people, it is vital to develop personal attitudes and an understanding that what happens is up to me and my function. It is
therefore vital that everyone is familiar with our vision, objectives and values, and that we
support each other for our common passion for salmon, and on our way to being at all times the lowest-cost supplier of farmed salmon.
WE CARE
To succeed as a team we must also develop the right attitudes towards, as well as respect and
care for salmon, coworkers, customers, business associates and the environment. We must think
for ourselves but act with loyalty, and always bear in mind that we are engaged in food production.
SUSTAINABILITY IN EVERYTHING WE DO
High ethical and moral standards form the basis for developing an even stronger focus on
safeguarding the environment that we work in day to day, and that we are the temporary custodians
of. We shall not deplete the environment, but ensure that we pass it on unimpaired to
the next generation. This is our shared social responsibility, and everything we do must stand
up to public scrutiny both today and in the future.
25

Passion for Salmon
Today, SalMar is one of the world’s foremost producers of farmed salmon. Throughout its history company growth has gone hand in hand with outstanding performance.
26

The aquaculture industry is developing rapidly, and the poten-tial for further growth is enormous. However, at SalMar we are in no doubt that any growth must be sustainable: envi-
ronmentally, socially and financially.
In 2014, to reinforce our focus on the ele-ments that have made SalMar the company
it is today, we adopted a new vision that will henceforth guide our steps:
Although SalMar continues to
pursue its stated aim of cost leadership, it is moving from a focus on
outcomes to a focus on performance. We aim for excellence at all levels and in all aspects of our operation.
The new vision will underpin all activities and all actions within SalMar. All decisions relating to production will be made on the basis of our passion for salmon. The fish will be farmed in conditions most conducive to their wellbeing. We believe that the best biological results will pave the way for the best financial results, and thus safeguard our posi-tion as the most cost-effective producer of farmed salmon in the world.
This new vision and ambition depend on the existence of a winning culture throughout the organisation. The source of SalMar’s corporate culture and the company’s cultural tenets is our shared passion for salmon. These tenets underpin our vision and describe the attitudes and conduct expected of all employees.
«Passion for Salmon»
27

Sustainability and corporate social responsibility
SalMar will safeguard its long-term profitability and growth through sustainable fish farming and industrial operations, and by acting as a responsible corporate citizen. For SalMar, sustainability is about maintaining high ethical and business standards, and contributing to a greater awareness of the environment in which we operate day to day. We protect the environment and ensure that it is managed in a way that benefits future generations.
28
Sustainability in everything we do 30
UN’s 17 Sustainable Development Goals 30Leadership of the sustainability effort 30Environment and climate policy 32Focus areas and targets 32
We care! 34
The workforce 34Society 36Business ethics, regulatory compliance and the reporting of wrongdoing 37
The job we do today is vital to the success of us all 38
Preventing the escape of fish 38Fish welfare 39Green licences 41Interaction with wildlife 41Sustainable feed 41Emissions 42
The job is not done until the person you are doing it for is satisfied 45
Value chain 45Certification 45Products 46
What we do today we do better than yesterday 48
New transport solutions 48Safe trailer transport 48Research and Development 49Increased focus on genetics 49R&D – escape of fish 50Plastic pollution 50Onshore power and the electrification of the aquaculture industry 51
Focus on the solution 52
Increased sustainability through increased secondary processing 52Reduction of food waste 53Sustainable smolt production 53
GRI Index 55

Sustainability in everything we doSustainability in everything we do is one of SalMar’s most important tenets, and is directly linked to our fundamental principles of leaving a minimal footprint on the areas in which we operate, at the same time as we maximise the value created by our products.
SalMar has a presence in local communities up and down the Norwegian coast and in Iceland, and the development of these villages and municipalities is very important to us. For our employees, it is important that the local communities to which they belong have the necessary infrastructure and offer oppor-tunities for leisure activities. For SalMar, it is crucial that the Group has access to sites offering good conditions for the fish we farm. SalMar engages actively in numerous local projects and considers it important to be present in local arenas to share views and information, and participate in planning processes. The farming of salmon is one of the most sustainable and environment-friendly ways of producing food, but must still be considered a young industry. It is important to ensure that local decision-makers and the general population are informed about our operations and development plans. Through active participation in business organisations and the public debate, SalMar contributes to important processes relating to the sustainable development of the aquaculture sector.
The Group recognises the diversity of its corporate social responsibility, as an employer, producer, supplier of healthy food, user of the natural environment and administrator of financial and intellectual capital. Social responsibility is important for us, and we want everything we do to stand the light of day. At the same time, we aim to minimise the impact our operations have on the natural environment.
In 2019, SalMar continued its sustainability reporting. This is the sixth report in succession, but the first to be included in the annual report. The sustainability report has been prepared on the basis of the principles set out in the Global Reporting Initiative (GRI). At the end of this report, you will find an overview of the GRI Index and our reporting relative to it.
This report encompasses SalMar’s businesses where the Group’s shareholding exceeded 50 per cent and where it had operating responsibility in 2019. As a result of the consolida-
tion of Arnarlax in February 2019, our operations in Iceland, through Arnarlax, have been included in our sustainability report for the first time.
Our tenets run through this entire report, and each section starts with a brief text linking the contents to our tenets.
UN’s 17 Sustainable Development GoalsSalMar supports the UN’s Sustainable Development Goals (SDGs) and is working systematically on relevant initiatives. SalMar’s approach is that efforts to promote sustainability are an integral part of everything we do and part of our continuous improvement. SalMar is implementing initiatives and activities relating to most of the 17 SDGs, though some of the goals are highlighted more clearly and will be focus areas in which the Group can make the largest contribution.
Leadership of the sustainability effortThe Group’s CEO is ultimately responsible for SalMar’s envi-ronmental footprint and for its efforts to increase its sus-tainability. SalMar has dedicated quality departments, which monitor and assess the work being done within this area. However, the activity is coordinated by management teams within the segments Fish Farming, and Processing and Sales. Systematic risk assessments are carried out at the overar-ching level and in all departments to ensure that SalMar as a group is able to implement necessary precautionary meas-ures. This also includes climate-related risk. The same applies to the Group’s subsidiaries where SalMar’s presence on the board of directors ensures that this is taken into account.
Management of each department is responsible for ensuring that monitoring activities are performed and reported, and the quality managers at the various companies follow up and support departmental and operative leaders in this area. Quality managers and other quality assurance staff take an active part in regular management meetings at all levels in the company. Quality, safety, fish welfare and the environ-ment/climate are regular issues discussed at these meetings.
30 SuStainability and corporate Social reSponSibility

2 Zero hunder and 3 Good health and well-being
SalMar shall contribute with sustainable food. Salmon is a healthy source of protein, an important source of omega-3 and a good source of vitamins and minerals. By exploiting the potential of the sea, we also contribute to security of food supply.
13 Climate action
Food production accounts for a large part of the world’s greenhouse gas emissions. Salmon has a low carbon and water footprint compared with other sources of protein. We will contribute to further reductions in our supply chain’s carbon footprint. SalMar will take its share of the responsibility by ensuring that climate considerations become an integral part of our strategy and planning processes.
14 Life below water
We will utilize the sea areas we operate in a sustainable manner. We will contribute to the reduction of marine garbage and discharges, both by reducing and handling our own waste properly, but also through our engagement in all the local coastal communities of which we are a part of.
12 Responsible consumption and production
Sustainable and efficient exploitation of our natural resources is a precondition for our operations. We will contribute to responsible production by reducing our consumption of resources and minimising food waste.

Environment and climate policySalMar’s facilities are situated in rural areas along the coast of Norway and Iceland, with clean water and good natural con-ditions for the salmon. Large and small coastal communities are important bases for SalMar’s workforce and operations. The Group is conscious of the benefits it derives from the communities and environment along the coast. This rec-ognition underpins SalMar’s systematic efforts to fulfil its responsibilities as an employer, producer, supplier of healthy food, user of the natural environment and administrator of financial and intellectual capital.
SalMar takes a holistic view of its fish farming operations, and the organisation strives to be energy efficient and implement climate-friendly solutions. Assessment of climate risk is an integral part of the company’s risk management process.
CDP reportingSalMar is working systematically to minimise its carbon footprint. Each year, it produces an environmental balance sheet, showing the changes in its operations’ impact on the environment. Carbon Disclosure Platform (CDP) has become one of the leading international systems for climate and environmental reporting, encompassing strategy, climate and
energy performance, initiatives and improvements. SalMar reported to CDP in 2018 and does so again for 2019.
Focus areas and targetsFor SalMar, it is important to focus on the operational areas with the greatest potential for environmental or human impact. The potential for increased sustainability is greatest within the following parts of the value chain:
• Safety in the workplace• Preventing the escape of fish / limiting the number
of escaped fish• Good fish welfare• Sustainable feed• Minimal emissions and good environmental
conditions beneath and around the facilities• Food safety• Increased level of processing
The table below shows all the aspects we have identified as having the highest level of materiality and have reported on in the period 2017-2019.
Material aspect Indicators
• Safe food• Good fish welfare• Sustainable feed
• Compliance with product, health and safety regulations• Survival• Use of medication (antibiotics)• Lice counts• Raw materials (FFDR, proportion of
marine raw materials, etc)
• Impact on the external environment • No. of escaped fish• Site-specific environment (MOM-B status)• Raw material ingredients• Interaction with wildlife• Lice counts
• Workplace safety• Interaction with the local community• Human rights
• Fatalities, personal injuries, sickness absence• Compliance with social welfare regulations• Engagment in the local community• Financial value generated
• Increased level of processing• Certification schemes• Regulatory compliance
• Volume of goods processed• Overview of certifications• Incidence of corrupt practices• Compliance with environmental regulations
• Climate-related emissions • Greenhouse gas emissions• Energy consumption• Energy conservation measures
32 SuStainability and corporate Social reSponSibility

SuStainability in everything we do
Code of ConductTo contribute to the development of a healthy corporate culture and maintain the company’s integrity, the board has drawn up a code of conduct. All employees have been made aware of SalMar’s ethical guidelines, which are the subject of discussion at annual seminars at the SalMar School. The code of conduct details SalMar’s attitude to business ethics and corruption, the working environment and community relations. Routines for the notification of wrongdoing are highlighted during internal training sessions. A high ethical standard in all aspects of the business is non-negotiable, and forms the very foundation for SalMar’s entire HSE strategy. SalMar’s tenets describe the behaviours and actions required of all employees. At any given time, the SalMar culture is embodied and shaped by its employees. Their good attitudes and actions have always made a significant contribution to SalMar’s success. The company’s code of conduct and tenets can be found on SalMar’s website: www.salmar.no.
The SalMar StandardStable environmental conditions are crucial to the health and welfare of the salmon being farmed. To protect the environment and facilitate long-term operations, extensive monitoring and R&D activities are undertaken. Every part of the operation is risk assessed in terms of sustainability, and appropriate measures are set out in procedures and instructions. To monitor compliance with the guidelines that have been drawn up for sound operations, measurements are taken and internal audits performed. SalMar has developed its own standard for best practice. The SalMar Standard sets the bar high, and the number of sites which meet it is published in monthly KPIs.
Dialogue with stakeholdersSalMar has a number of different stakeholders, and is keen to maintain a good dialogue with all of them, for example, through face-to-face meetings, the media, interim and annual reports, stock market notices, GRI reports, adverts, R&D projects and our website www.salmar.no. Dialogue with stakeholders takes place both locally and at the corporate level. Understanding that we can only succeed if we work together and treat each other with candour and respect is an explicit part of SalMar’s principles for all dialogue.
The stakeholders to be included in SalMar’s future sustain-ability reporting efforts are determined by the extent of their influence over the organisation. We aim to engage our stakeholders in an effective manner, while ensuring that they experience their contact with SalMar as providing added value. Important steps in the process include winning acceptance for the issues selected, illuminating different perspectives with regard to impact, identifying challenges, accumulating external impressions and sharing knowledge.
The identification of stakeholders with whom SalMar will engage in dialogue results from several processes:
• Public authorities which administer the public interest in the area and grant licences to operate.
• Selection and approval of suppliers and engagement with local stakeholders and in R&D activities is determined by management teams in the various parts of the company.
• Identification of the NGOs with which SalMar will have direct contact is determined by Group Management.
The table below shows the various stakeholder groups that are included in SalMar’s analyses.
SalMar’s stakeholders
Internal influence Business associates Customer groups External influence
Employees Suppliers of goods Customers in Norway and Iceland
Central government / regulatory authorities
Shareholders/investors Suppliers of services Customers abroad Certification bodies
Group management R&D partners Customers organic products Industry associations
Customers with own standards Groups of local residents
NGOs
Research establishments
Local communities
33

We care!Caring about our co-workers, business partners and local communities is one of SalMar’s core values. SalMar employees shall show they care, and their actions shall be rooted in a sense of responsibility, consideration and a desire to do their best. That we care has a positive impact on our biological and financial key figures, our HSE performance and our relations with the rest of society.
In this chapter we present the sustainability targets that cover the workforce and society. In addition, we present results associated with business ethics.
The workforceGood employees, irrespective of gender, age or background, are crucial if we are to succeed in reaching our strategic goals. At the same time, it is important that we provide an attrac-tive and safe working environment that makes it possible to attract and retain the most talented people.
In 2019, SalMar employed a total of 1,703 full-time equiv-alents. This is 223 full-time equivalents more than in 2018. The increase is largely attributable to the consolidation of Arnarlax in Iceland. The workforce was made up of 442 women and 1,261 men. The percentage of women is con-siderably higher at the Group’s harvesting and processing facilities than at its hatcheries and fish farms. SalMar’s work-force is made up of people from around 25 different countries.
To ensure good communication, all employees must have adequate English language skills.
The Group has made its policy plain with respect to the pro-motion of diversity and equality. SalMar accepts no discrim-ination, abuse or harassment of our workers or partners, and we treat everyone with courtesy and respect no matter what their ethnicity, gender, national or social background, age, functional capacity, sexual orientation, religious faith, political convictions or other status. Respect for the individual is the cornerstone of the company’s policy. Everyone shall be treated with dignity and respect, and shall not be unfairly prevented from carrying out their duties and responsibilities. This attitude springs from acknowledgement that diversity contributes to a better working environment, greater adapt-ability and better results in the long term.
Women Full time equivalents
2019 2019 2018 2017
SalMar 26% 1,593 1,479 1,427
– ASA 45% 34 31 33
– Hatcheries 19% 92 82 81
– Fish farming 9% 605 565 542
– Sales & Processing 38% 862 800 771
Arnarlax 22% 110
Group 26% 1,703 1,479 1,427
34 SuStainability and corporate Social reSponSibility

We care!
Safety at workWorking at SalMar shall be safe. The company works sys-tematically with risk management and training to protect its workforce.
Although the majority of KPIs made good progress in 2019, the company nevertheless experienced some serious inci-
1 These figures do not include Arnarlax, whose KPIs are still under development.
dents involving staff. A total of 19 lost time injuries (LTIs) were recorded in 2019. This is a noticeable decrease on the year before, when 27 LTIs were recorded. The same positive trend can be seen in the H-figures (H1 = LTIs per million hours worked).
Safety1 Target 2019 2018 2017
No. of fatalities 0 0 0 0
Lost Time Injuries (LTI) 0 19 27 24
H1-value (no. of LTIs per million hours worked < 6 7.3 11.9 11.0
Continued focus on our internal industrial safety capability is important to further reduce the number of personal injuries in 2020. All parts of the Group have an industrial safety rep-resentative, and two industrial safety inspections are carried out in each department every year. A total of 112 safety inspections were carried out throughout the Group in 2019. These have uncovered important areas for improvement to further reinforce workplace safety.
All serious accidents are investigated to prevent similar incidents occurring in the future. In collaboration with DNV GL, our central technical staff department have developed company-specific tools to enable it to investigate such inci-dents. Nevertheless, prevention remains the most important factor. At SalMar, we place great emphasis on ensuring that hazardous operations are well planned. Operational plans are drawn up before any work commences, and associated safe work analyses (SWA) are performed for those taking part. The mapping of our overall risk picture is the most effec-tive measure we can implement to reduce the probability of personal injuries occurring. Day to day, internal procedures, instructions and checklists are all drawn up on the basis the risk analyses performed.
HSE performance is followed up systematically through tar-gets and action plans. On the basis of overarching targets, each individual division and department has defined its own local subtargets. Management has an obligation to monitor performance and evaluate progress, as well as the need for new measures and focus areas. Safety is followed up through
systematic weekly and monthly reviews by SalMar’s manage-ment teams. Lessons learned and improvements are shared across all departments by means of quality-assured reports. All employees are covered by a company health service in the vicinity of their workplace. The Group ensures that everyone receives the training necessary to perform their tasks.
The Working Environment Committee also plays a key role in our HSE activities. The committee comprises selected representatives of management and nominated employees. The committee reports to the Group’s governing bodies and the employees’ trades union organisations.
Sickness absenceSickness absence continued to be a area of focus in 2019. Nevertheless, the goal of achieving a sickness absence rate of less than 4.5 per cent was not realised in Norway, although it has fallen. The overall sickness absence rate in Norway came to 5.3 per cent in 2019, compared with 5.5 per cent in 2018. Short-term sickness absence fell slightly from 2.1 per cent in 2018 to 2.0 per cent in 2019. In Iceland, the sickness absence rate stood at 4.1 per cent at the close of 2019.
The Group has many employees working in harvesting and processing operations, and it is this segment that pulls up the sickness absence figures. At the same time, it was pleasing that this is the group that has achieved the largest reduction in the sickness absence figures, along with employees at our hatcheries.
Sickness absence Target 2019 2018 2017
SalMar < 4.5% 5.3% 5.5% 4.7%
Arnarlax < 4.5% 4.1%
35

Employee empowermentIf SalMar is going to develop and constantly forge ahead, it is vital that all employees contribute their views and sug-gestions for new ways of doing things. To facilitate this, the various departments hold regular planning and review meetings. Large parts of the Group make use of a scheduled meeting scheme, which focuses on individual action plans and close follow-up of the individual employee.
New recruits to SalMar receive HSE training through induction courses, operational seminars, the SalMar School and the Arnarlax Academy. Annual refresher courses are also held on important HSE topics. All employees shall have received training in how to report wrongdoing or causes for concern within the company, and shall know that they are safe from reprisal if they do so. The procedure for reporting concerns is described in the management system, which is available to all employees.
The SalMar School and Arnarlax Academy are our arenas for developing individual competence and our corporate culture. In addition to operational issues, these arenas also address matters relating to corporate culture and leadership, and involves both managers and employees in the process of creating the world’s best aquaculture company. Underpinning all our activities in this area, are our shared management principles and tenets – which enable us to develop even more SalMarians.
The level of risk associated with the work being performed every single day at SalMar means that training and having the right competence is vital. Training is provided internally and in the form of external courses. Day-to-day follow-up and on-the-job learning are, nevertheless, the most important sources for individual growth.
SocietySalMar endorses wholeheartedly the principles set out in the Universal Declaration of Human Rights. Those aspects which relate to our operations, eg protection against discrimination and the right to form a trade union, are included in the Group’s code of conduct and several other governing documents.
SalMar has a presence in local communities up and down the Norwegian coast, and is attentive to developments in villages and local districts. At the close of 2019, we had operations along the entire coast of Central Norway, Northern Norway and the Westfjords region of Iceland. It is important for our employees that the local communities in which they live have the necessary infrastructures and opportunities for leisure activities. For SalMar, it is crucial that the Group is able to operate at locations offering good growing conditions for our fish stocks. It is also important for SalMar to participate
in local arenas for the exchange of views and information, and to take part in planning processes.
Salmon farming is still considered a ‘young’ industry, and it is important to ensure that local decision-makers and other local residents are informed about our operations and plans for development. Through active participation in business associations and the public debate, SalMar contributes to important sustainable development processes in Norway and Iceland.
SalMar is conscious of its role in contributing to the training of skilled workers and employs numerous apprentices. We collaborate with the “blue” vocational and academic courses at both upper secondary schools and university colleges, including those provided under the auspices of the organi-sations Ungt Entreprenørskap and Blått Kompetansesenter, the Norwegian University of Science and Technology (NTNU) among others in Norway, and the Fisktenískolí in Iceland.
SalMar Salmon CentreIn the autumn of 2017, a new aquaculture experience cen-tre, the SalMar Salmon Centre, opened in Finnsnes/Lysnes. SalMar wishes to increase the public’s knowledge about the aquaculture industry and the centre’s target groups include local people, tourists, schoolchildren and members of the business community. Through exciting experiences on shore and at sea, the public will gain greater insight into a modern and sustainable industry. A visit to the SalMar Salmon Cen-tre includes an interactive exhibition about fish farming in Norway, and visitors can see the high-tech solutions used to remotely feed the salmon. In addition, the centre features an ultra-modern kitchen where visitors can learn how easy it is to prepare delicious salmon dishes. Visitors also have the opportunity take a trip out to an actual sea farm, to see with their own eyes how the salmon live.
Sponsorships and donationsTo give something tangible back to the local communities in which the Group operates, SalMar supports a number of local clubs and voluntary associations through the SalMar Fund. On the whole, the fund gives priority to sporting and cultural initiatives, particularly those targeting children and young people.
In 2013, SalMar became a sponsor of the football club Rosen-borg Ballklubb (RBK). This partnership continued in 2019 and will remain in effect in 2020. In addition to profiling SalMar, the partnership includes a separate programme for children and teenagers, and the development of grassroots foot-ball clubs in Trøndelag. RBK has highlighted the partnership through the SalMar Sports Ground and the SalMar Academy. The objective is to help transfer competence from Rosenborg to grassroots clubs in Trøndelag County in the form of good training sessions to promote player and trainer development.
36 SuStainability and corporate Social reSponSibility

We care!
In collaboration with the NTNU, SalMar ASA has endowed a professorship within the field of aquaculture cybernetics. The professorship is intended to promote cross-functional research linking the areas technical cybernetics, biology and aquaculture. It will act as a knowledge base for and link between the aquaculture industry and the academic world. In addition to SalMar, Kongsberg Maritime is an important partner in this effort. The professorship will also contribute to the recruitment of more students to the field of aquacul-ture, thus securing the industry’s access to highly qualified technological expertise. This professorship will strengthen the NTNU’s position as one of the world’s leading universities for aquaculture and aquaculture technology.
1 In accordance with the Global Salmon Initiative’s methodology
Business ethics, regulatory compliance and the reporting of wrongdoingTo date, SalMar has not received any reports of corruption or other violations of its code of conduct. In 2019, six whistle-blowing reports were recorded. These have all been closed in accordance with the Group’s internal guidelines.
Regulatory complianceThe aquaculture industry is strictly regulated and compa-nies must comply with applicable laws and regulations. Here we report1 the number of regulatory violations that have resulted in fines. This includes all violations relating to prod-ucts and food safety, environmental and social regulations that resulted in monetary fines.
Target 2019 2018 2017
SalMar
No. of violations 0 0 0 0
Fines (NOK) 0 0 0 0
Type of regulatory violation - - - -
Arnarlax
No. of violations 0 0
Fines (NOK) 0 0
Type of regulatory violation - -
37

The job we do today is vital to the success of us all
What counts is what the individual employee does today – every day. At SalMar we are very conscious that every action and every day is important, and that success depends on the individual and collective efforts of the entire workforce.
In this chapter we will present the day-to-day efforts being made to achieve the Group’s sustainability targets for fish welfare and the external environment, and report on our current status.
1 Final figures are not available with respect to three incidents. The number of fish involved has not been included in the stated figure.2 Of which 20 lumpfish.3 The incident occurred at the hatchery in Bæjarvik, where fry weighing on average 2g got loose.
Preventing the escape of fishSalMar has a clear goal of zero escaped fish and takes every incident extremely seriously. Six escape incidents were reported at SalMar’s facilities in Norway in 2019, and one at the hatchery in Iceland. A total of 21 fish escaped from facilities in Norway and 185,885 fry with an average weight of 2g escaped from the hatchery in Iceland.
The authorities were informed of the incidents at an early stage and non-conformance analyses have been performed. Relevant remedial measures have been implemented. SalMar continues to strive every day to prevent fish from escaping. This means focusing on day-to-day routines for monitoring and checking the technical equipment, as well as procedures for operations involving the handling of fish. In addition, we continue to collaborate with suppliers and research envi-ronments on the development of more secure equipment.
Target 2019 2018 2017
SalMar
No. of incidents 0 6 7 7
No. of escaped fish 0 211 15,820 1,9512
Arnarlax
No. of incidents 0 1
No. of escaped fish 0 185,8853
38 SuStainability and corporate Social reSponSibility
The job we do Today is viTal To The success of us all
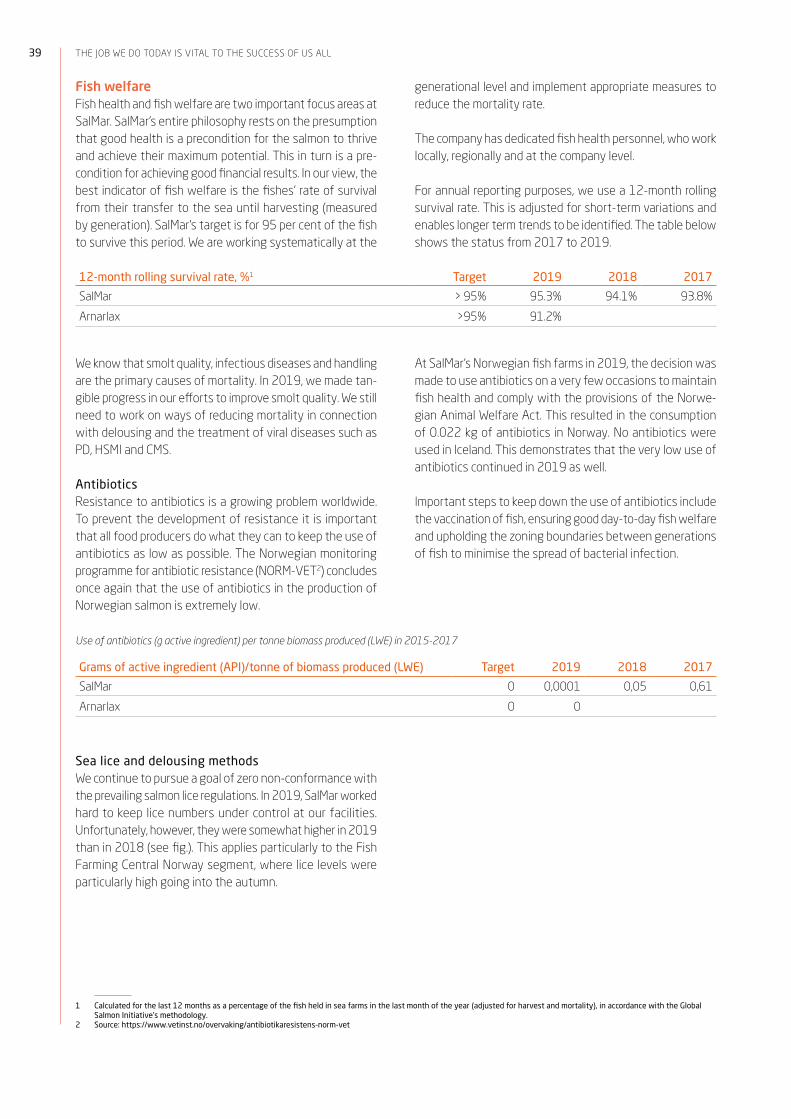
Fish welfareFish health and fish welfare are two important focus areas at SalMar. SalMar’s entire philosophy rests on the presumption that good health is a precondition for the salmon to thrive and achieve their maximum potential. This in turn is a pre-condition for achieving good financial results. In our view, the best indicator of fish welfare is the fishes’ rate of survival from their transfer to the sea until harvesting (measured by generation). SalMar’s target is for 95 per cent of the fish to survive this period. We are working systematically at the
1 Calculated for the last 12 months as a percentage of the fish held in sea farms in the last month of the year (adjusted for harvest and mortality), in accordance with the Global Salmon Initiative’s methodology.
2 Source: https://www.vetinst.no/overvaking/antibiotikaresistens-norm-vet
generational level and implement appropriate measures to reduce the mortality rate.
The company has dedicated fish health personnel, who work locally, regionally and at the company level.
For annual reporting purposes, we use a 12-month rolling survival rate. This is adjusted for short-term variations and enables longer term trends to be identified. The table below shows the status from 2017 to 2019.
12-month rolling survival rate, %1 Target 2019 2018 2017
SalMar > 95% 95.3% 94.1% 93.8%
Arnarlax >95% 91.2%
We know that smolt quality, infectious diseases and handling are the primary causes of mortality. In 2019, we made tan-gible progress in our efforts to improve smolt quality. We still need to work on ways of reducing mortality in connection with delousing and the treatment of viral diseases such as PD, HSMI and CMS.
AntibioticsResistance to antibiotics is a growing problem worldwide. To prevent the development of resistance it is important that all food producers do what they can to keep the use of antibiotics as low as possible. The Norwegian monitoring programme for antibiotic resistance (NORM-VET2) concludes once again that the use of antibiotics in the production of Norwegian salmon is extremely low.
At SalMar’s Norwegian fish farms in 2019, the decision was made to use antibiotics on a very few occasions to maintain fish health and comply with the provisions of the Norwe-gian Animal Welfare Act. This resulted in the consumption of 0.022 kg of antibiotics in Norway. No antibiotics were used in Iceland. This demonstrates that the very low use of antibiotics continued in 2019 as well.
Important steps to keep down the use of antibiotics include the vaccination of fish, ensuring good day-to-day fish welfare and upholding the zoning boundaries between generations of fish to minimise the spread of bacterial infection.
Use of antibiotics (g active ingredient) per tonne biomass produced (LWE) in 2015-2017
Grams of active ingredient (API)/tonne of biomass produced (LWE) Target 2019 2018 2017
SalMar 0 0,0001 0,05 0,61
Arnarlax 0 0
Sea lice and delousing methodsWe continue to pursue a goal of zero non-conformance with the prevailing salmon lice regulations. In 2019, SalMar worked hard to keep lice numbers under control at our facilities. Unfortunately, however, they were somewhat higher in 2019 than in 2018 (see fig.). This applies particularly to the Fish Farming Central Norway segment, where lice levels were particularly high going into the autumn.
39

0.00
0.05
0.10
0.15
0.20
0.25
0.30
0.35
Janu
ary
Febr
uary
Mar
ch
Apr
il
May
June July
Aug
ust
Sept
embe
r
Oct
ober
Nov
embe
r
Dec
embe
r
2015 2016 2017 2018 2019
Fig: Average no. of adult female lice per month at SalMar, excluding Arnarlax.
1 No of site weeks with the number of adult female lice over the threshold, excluding broodfish.
Our production licences in Norway stipulate a maximum permitted number of lice. As a rule, the number is capped at 0.5 adult female lice per fish. However, for certain types of licence and in certain areas, the lice threshold is 0.2. All fish farmers report lice numbers to the authorities weekly using the government’s online portal Altinn. The updated status is freely available at barentswatch.no.
In 2019, 3.3 per cent of SalMar’s reported lice observations exceeded the maximum threshold. Most of this year’s non-con-formances were due to an exceptionally strong lice pressure during the autumn in certain parts of Central Norway. Despite failing to keep within the maximum threshold on several occa-sions, our performance was much better than prior to 2017. There are no corresponding lice limits in Iceland, so these operations have been excluded from the presentation below.
No. of observations above the lice threshold %1 Target 2019 2018 2017 2016 2015
SalMar 0% 3.3% 0.3% 2.2% 5.5% 6.5%
The main strategy for reducing the number of treatments is through preventive measures, such as lice skirts, reduced cycle time and fallowing and risk-based use of cleaner fish produced in-house. In addition, SalMar has established sufficient internal capacity for non-medicinal delousing. The number of sea-cage treatments increased in 2019 as a result of an increase in lice numbers, although we are pleased to note that the mortality associated with delousing treatments was materially lower. We are working systematically to reduce the mortality rate. This includes tightening up our risk assessments before and during treatment, and performing evaluations after treatment has been completed. Fish welfare is our main focus, and new tools are being developed to improve these work processes.
Efforts to improve our technical equipment to make it gentler and to develop effective tools (indicators) that can help us better predict the status of the fish’s welfare, were ongoing in 2019, and will continue in 2020.
Medication
Active operationsNon-medical treatment
and harvesting out
Cleaner fishIn constant operation
Preventative measuresLice skirts, cycle time, fallowing, operating
routines and collaboration, genetics
Medicationzero emissions
Fig: Visualisation of the strategy to combat sea lice
40 SuStainability and corporate Social reSponSibility

The job we do Today is viTal To The success of us all
Green licencesFollowing the Norwegian authorities’ 2013/2014 round of licence allocations and at the close of 2019, SalMar had a total of 16 ‘green’ licences. Eight of these are purchased ‘Green-B’ licences and eight are ‘Green Converted’ licences. The terms of the green licences set stricter limitations on the number of salmon lice and the number of medicinal delousing treatments, as well as a stronger focus on escape prevention. In connection with its green licences, SalMar has focused particularly on the use of cleaner fish, in the form of farmed lumpfish, to control sea lice levels, and the use of a more secure net-pen construction. We have also emphasised participation in a salmon surveillance project in Trøndelag’s salmon rivers, in order to assist in the development of meth-ods and expertise related to the tracking and mapping of escaped farmed salmon in rivers. So far, experience from the operation of these sites has been good. Our focus in 2019
1 Calculated in accordance with the Global Salmon Initiative’s methodology2 The Marine Ingredients Organisation http://www.iffo.net/3 Marine Stewardship Council http://www.msc.org/
has been to optimise the way the cleaner and the use of lice skirts works with the fish net pen design. A separate annual report is published detailing SalMar’s experience and evaluating the operation of its green licences. This report is available from our website www.salmar.no.
Interaction with wildlifeSalMar places considerable emphasis on minimising its impact on wildlife, and we work actively to prevent this. However, our presence does sometimes affect other animals. In 2019, we experienced more incidents resulting in the unintended bird deaths than in 2018. In 2020, we will work to reduce the scale of wildlife mortality.
Total no. of interactions divided by the total no. of sites from January to December 1
Birds Marine mammals
Unintentional deaths Individuals euthanised Unintentional deaths Individuals euthanised
2019Arnarlax 0.67 0 0 0
SalMar 0.65 0 0 0
2018 SalMar 0.45 0.05 0 0
2017 SalMar 0.43 0 0 0
2016 SalMar 0.34 0 0 0
Sustainable feedThe feed is formulated to meet the salmon’s nutritional requirements, and raw materials are combined to achieve an optimal solution for fish health, effective growth, sus-tainability and price. No genetically modified raw materials are used in the feed.
SalMar has elected to pursue a strategic partnership with our feed suppliers to jointly work for sustainable ingredients in the feed we use. In addition, we are discussing alternative ingredients, such as insect flour and algae.
Use of marine raw materials in the feedThe Norwegian and Icelandic aquaculture industries use fish meals and fish oils only from lawful and regulated fisheries. Today, the proportion of marine products in the feed stands at approx. 20-30 per cent. SalMar requires all its feed suppli-ers to buy marine raw materials that comply with the Inter-national Fish Meal and Fish Oil Responsible Supply Standard (IFFO RS) 2, are MSC-certified3 or equivalent. This is to ensure the sustainability of the fisheries from which the ingredients derive. For 2019, 99 per cent of the marine raw materials
used by our main feed suppliers were certified in accordance with the IFFO RS standard.
Low dependence on wild fish stocksAs a measure of feed sustainability, we use the Fish Forage Dependency Ratio (FFDR). This quantifies our dependence on wild fish stocks as raw materials in our feed. This is done by assessing the volume of live fish from small pelagic fisheries that is required to make the amount of fish meal or fish oil needed to produce one unit of farmed salmon. The lower the FFDR we can achieve, the more salmon we can produce on the basis of a globally limited supply of marine raw materials. In addition, we continuously monitor and measure the feed factor (the amount of feed required to produce 1 kg of fish).
According to the ASC standard, feed is deemed to be sus-tainable if its FFDR (fish meal) is <1.2 and its FFDR (fish oil) is <2.52. In 2019, SalMar’s Norwegian operations achieved an FFDR (fish meal) of 0.41 and an FFDR (fish oil) of 2.24, both these values are below the ceiling specified in the ASC standard. Similar KPIs are currently being developed for Arnarlax in Iceland.
41

Fish Forage Dependency Ratio1 2019 2018 2017
FFDR (fishmeal) kg per kg salmon produced 0.41 0.51 0.59
FFDR (fish oil) kg per kg salmon produced 2.24 1.66 1.60
1 Average per kg of salmon fed with feed measured in accordance with the ASC standard.2 The MOM-B study complies with Norwegian Standard NS9410. We use active sites in 2017, where samples at peak production were taken. The condition is graded on a scale of 1
to 4.3 The figures do not include Arnarlax, since KPIs are still under development.
In 2019, the largest sources, by volume, of marine raw mate-rials in the feed were herring and white-fish offcuts, blue whiting, bony fish and anchovies. Overall, by-products (off-cuts and trimmings) accounted for 16.8 per cent and 34.8 per cent, respectively, of the raw materials used by our two largest feed suppliers. This proportion is lower than in pre-vious years. The feed companies’ own sustainability reports document this in further detail.
Use of soya in the feedVegetable raw materials have become an important ingredient in fish feed. Vegetable-based proteins currently make up 35-45 per cent of the feed. At SalMar, we require our feed suppliers to purchase soya from sustainable sources that are certified in accordance with ProTerra, RTRS or equivalent envi-ronmental standard. This means that the soya is not farmed in areas threatened with deforestation, and has not been genet-ically modified. To promote the sustainable farming of soya, SalMar’s main feed suppliers in 2018, Skretting and EWOS, used only ProTerra-certified soya – the strictest certification scheme. In addition, they participate in several sustainability partnerships, including the Round Table on Responsible Soy, the ProTerra Network, the Roundtable on Sustainable Palm Oil, the Aquaculture Stewardship Council, IFFO’s Responsible Supply Standard and the Global Salmon Initiative.
Effective feed utilisationThe nutritional value, consistency and taste of the feed are important. Equally important, however, is correct dosing to ensure that the feed is utilised as effectively as possible and keeps the fish healthy. SalMar has focused heavily on compe-tence development and specialisation for those responsible for feeding the fish. Effective feed utilisation (feed factor) is one of the key performance indicators that we follow up all the time. In 2019, we held a series of seminars and training courses specifically for the staff who feed the fish. Further skills development and dissemination of best practices within the company is the objective.
Feeding is tailored to the fish’s appetite in each individual net pen. It is monitored using underwater CCTV cameras, up-to-date technology that shows where in the water column the fish are located, and weight checks. In this way, optimal feeding is achieved. The benefits of correct feeding include optimal growth, a low feed factor, reduced emissions, fish that thrive and have a greater resistance to disease, low mortality, smaller
variations in fish size, less harvesting waste and higher quality fish flesh. The equipment and the feed must be appropriate, but the competence that has been built up in SalMar with regard to feed and feeding is a significant factor for the achievement of good results. In 2019, we continued to focus on the devel-oping of feeding centres that remotely control the feeding of our fish stocks. By bringing skilled staff together in one place, we are further developing the “control room” and facilitating the implementation of new routines and continuous learning.
Systematic monitoring of the feed’s qualitySalMar uses an all-round feed that optimises production and promotes good fish health. In other words, a high-value salmon feed that ensures good growth, a low feed factor and meets the fishes’ nutritional needs. In 2019, almost 200,000 tonnes of dry feed pellets were used in SalMar’s salmon farming operations in Norway, and 17,000 tonnes in Iceland. In addition, a modest volume of feed was used for the company’s own production of lumpfish.
In addition to monitoring the raw materials used, SalMar also checks the nutritional value of the feedstuffs used in the hatcheries and sea farms. This is verified through their fat, pro-tein, phosphorous and fibre content. SalMar performs routine controls on the feeds’ physical quality on receipt to identify non-conformances (dust & crumbs, floatability and oil ooze).
EmissionsSite environmentThe seabed beneath all sites is inspected regularly to see whether/to what extent the surroundings have been affected by our operations. We are working continuously to find the optimal locations for our farms, so that we can realise our objective of having all our operational sites with a condition designated as “very good or “good” (MOM-B score of < 22). In 2019, 95 per cent of our operational sites in Norway achieved this score. All sites had a satisfactory MOM-B score prior to the transfer of new fish stocks.
Percentage with a MOM-B score of ≤ 23 Target 2019 2018 2017
SalMar 100% 95% 85% 82%
42 SuStainability and corporate Social reSponSibility
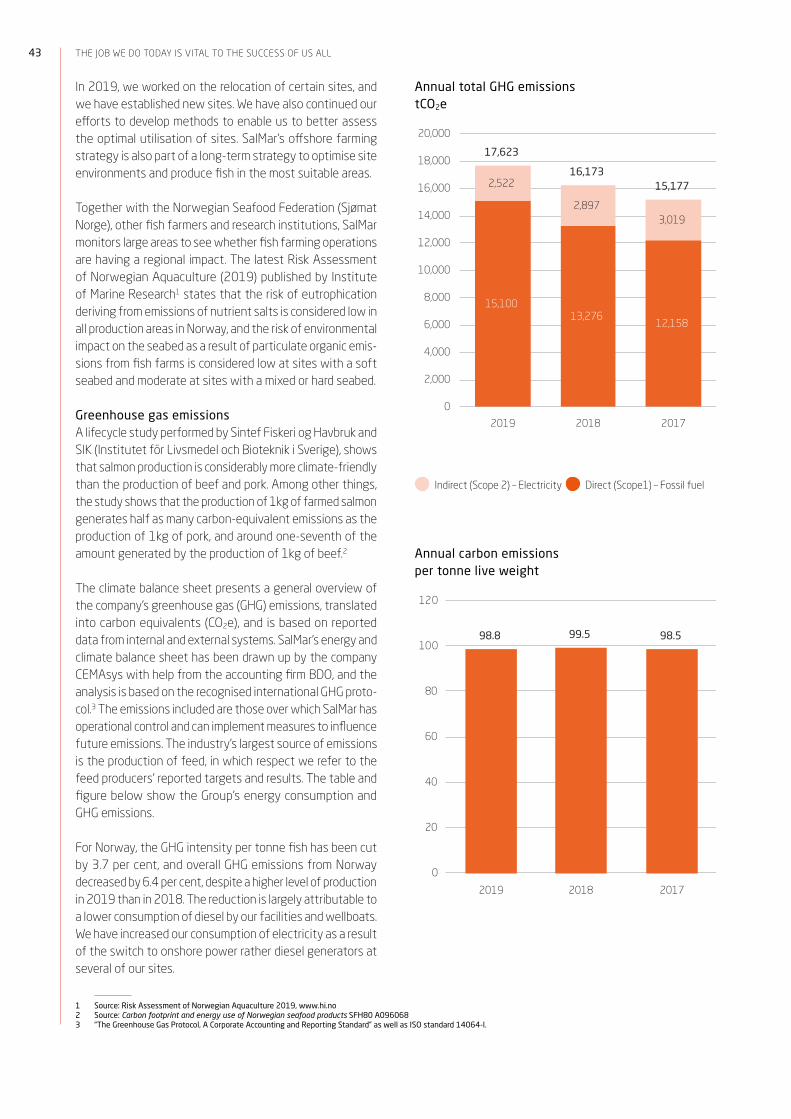
The job we do Today is viTal To The success of us all
In 2019, we worked on the relocation of certain sites, and we have established new sites. We have also continued our efforts to develop methods to enable us to better assess the optimal utilisation of sites. SalMar’s offshore farming strategy is also part of a long-term strategy to optimise site environments and produce fish in the most suitable areas.
Together with the Norwegian Seafood Federation (Sjømat Norge), other fish farmers and research institutions, SalMar monitors large areas to see whether fish farming operations are having a regional impact. The latest Risk Assessment of Norwegian Aquaculture (2019) published by Institute of Marine Research1 states that the risk of eutrophication deriving from emissions of nutrient salts is considered low in all production areas in Norway, and the risk of environmental impact on the seabed as a result of particulate organic emis-sions from fish farms is considered low at sites with a soft seabed and moderate at sites with a mixed or hard seabed.
Greenhouse gas emissionsA lifecycle study performed by Sintef Fiskeri og Havbruk and SIK (Institutet för Livsmedel och Bioteknik i Sverige), shows that salmon production is considerably more climate-friendly than the production of beef and pork. Among other things, the study shows that the production of 1kg of farmed salmon generates half as many carbon-equivalent emissions as the production of 1kg of pork, and around one-seventh of the amount generated by the production of 1kg of beef.2
The climate balance sheet presents a general overview of the company’s greenhouse gas (GHG) emissions, translated into carbon equivalents (CO2e), and is based on reported data from internal and external systems. SalMar’s energy and climate balance sheet has been drawn up by the company CEMAsys with help from the accounting firm BDO, and the analysis is based on the recognised international GHG proto-col.3 The emissions included are those over which SalMar has operational control and can implement measures to influence future emissions. The industry’s largest source of emissions is the production of feed, in which respect we refer to the feed producers’ reported targets and results. The table and figure below show the Group’s energy consumption and GHG emissions.
For Norway, the GHG intensity per tonne fish has been cut by 3.7 per cent, and overall GHG emissions from Norway decreased by 6.4 per cent, despite a higher level of production in 2019 than in 2018. The reduction is largely attributable to a lower consumption of diesel by our facilities and wellboats. We have increased our consumption of electricity as a result of the switch to onshore power rather diesel generators at several of our sites.
1 Source: Risk Assessment of Norwegian Aquaculture 2019, www.hi.no2 Source: Carbon footprint and energy use of Norwegian seafood products SFH80 A0960683 “The Greenhouse Gas Protocol, A Corporate Accounting and Reporting Standard” as well as ISO standard 14064-I.
Annual total GHG emissions tCO2e
15,100 13,276
12,158
2,522
2,897 3,019
0
2,000
4,000
6,000
8,000
10,000
12,000
14,000
16,000
18,000
20,000
2019 2018 2017
17,623
16,173 15,177
Indirect (Scope 2) – Electricity Direct (Scope1) – Fossil fuel
Annual carbon emissions per tonne live weight
98.8 99.5 98.5
0
20
40
60
80
100
120
2019 2018 2017
43

SalMar used 4,954,381 litres of fossil fuel (188TJ) and 64,675 MWh of electricity (233 TJ) in 2019. In Norway, SalMar has an agreement with its main electricity supplier which guarantees that the power provided derives from 100 per cent renewable sources. In addition, waste heat and local power sources are used at several of our facilities. This means that 98 per cent of the electricity consumed in Norway in 2019 is covered by green certificates or comes from waste heat.
For the first time, figures from Iceland are included in the climate balance sheet. Due to a higher proportion of fossil
fuel used in the supply chain and a slightly lower capacity utilisation at the facilities in Iceland, both energy intensity and GHG intensity are higher than in Norway. However, Ice-land has certain natural conditions that result in all electrical power coming from geothermal sources. This means that 100 per cent of the 3,850 MWh (14 TJ) of electricity consumed in Iceland derives from renewable sources.
The inclusion of operations in Iceland naturally results in an increase in the Group’s absolute emission level. Despite this, however, both energy intensity and GHG intensity are lower than they were in 2018.
Energy and GHG emissions 2019 2018 2017 2016 2015 2014
Energy consumption Group Arnarlax SalMar SalMar SalMar SalMar SalMar SalMar
Direct (Scope 1) – Fossil fuel TJ 225 37 188 198 182 195 173 161
Indirect (Scope 2) – Electricity TJ 491 14 478 477 454 154 159 164
Total energy consumption TJ 717 51 666 674 636 349 333 325
Greenhouse gas (GHG) emissions
Direct (Scope1) – Fossil fuel tCO2e 15,100 2,482 12,619 13,276 12,158 13,621 12,350 11,471
Indirect (Scope 2) – Electricity tCO2e 2,522 0 2,522 2,897 3,019 2,399 2,835 4,137
Total carbon emissions (Scope 1 & 2) tCO2e 17,623 2,482 15,141 16,173 15,177 16,020 15,184 15,608
Upstream activities (Scope 3) tCO2e 11,950 32 11,919 17,143 21,173 12,310 11,149 9,821
Intensity
Energy intensity GJ/tonne live weight 4.0 4.3 4.0 4.2 4.1 2.7 2.1 2.0
GHG intensity kgCO2e /tonnes live weight 98.8 212.2 90.9 99.5 98.5 121.5 97.6 97.1
Water consumptionAquaculture generally has a low freshwater requirement compared with other types of food production. The fish live a large part of their lives in the sea and do not depend on supplies of fresh water. SalMar’s freshwater consumption derives largely from its onshore hatcheries and its harvesting and processing plants.
The transition to recirculated aquaculture systems (RAS) technology is part of a general strategy to reduce the volume of fresh water consumed at our hatcheries.
Water consumption (1 000 m3) 2019 2018
SalMar 58,346 57,316
– Surface water 57,557 56,479
– Municipal water 790 837
– Groundwater - -
Arnarlax 7,979
– Surface water 2,628
– Municipal water 95
– Groundwater 5,256
Waste and recyclingAll SalMar departments have a waste-management plan, which stipulates the receiving facilities approved for var-ious types of waste. Packaging and used fish farming equipment, such as collars, nets and mooring devices are delivered to undertakings that reuse the materials. See the following chapter for further details of the measures we are implementing.
44 SuStainability and corporate Social reSponSibility

The job is noT done unTil The person you are doing iT for is saTisfied
The job is not done until the person you are doing it for is satisfied
Salmon production is a collaborative process, in which the individual elements are mutually dependent and understanding the customer – whether internal or external – is vital.
In this chapter we will focus on SalMar’s suppliers, products and markets. Food safety and more processing are focus areas for sustainable development at SalMar. Both issues will be discussed in detail in this chapter.
Value chainThe farming of fish is the part of the value chain in which SalMar has the greatest impact on the environment. Our efforts with respect to the environment and sustainability will therefore be focused primarily on our biological produc-tion. SalMar produces its own roe and smolt, but was still obliged to buy in some of its fish stocks in 2019. In addition to a strong internal focus on sustainable production, we therefore make demands on our suppliers.
The most important input factor, in addition to roe and smolt, is the feed that the fish eat. Since the largest feed suppliers in 2019, Skretting and Ewos, both publish their own sustain-ability reports, please refer to these for further information.
Other important suppliers of significance to SalMar’s environ-mental footprint include producers of equipment, electrical power, chemicals and packaging, as well as maintenance, wellboat and fish-health service providers. Several of the suppliers in the above-mentioned categories participate in sustainability improvement projects along with SalMar.
CertificationProximity to markets and customers is important for SalMar. Our customers are global, and include exporters and importers of various sizes, as well as major processing companies and supermarket chains. Through the sale of our products, the Group has contacts in numerous countries worldwide.
SalMar is certified in accordance with the following cus-tomer and third-party standards: Global G.A.P., Debio, ASC, Kosher, BRC, IFS, HACCP and MSC (for the sales segment). This involves regular dialogue with both the certifying bodies and customers. The requirements for and follow-up of these certifications comes in addition to follow-up by the regulatory and government authorities.
The table below presents the certifications held by SalMar and Arnarlax.
Global GAP Debio ASC Kosher BRC IFS HACCP MSC
Whole value chain Processing Sales
45

Environment-friendly food production – Aquaculture Stewardship Council (ASC) StandardThe Aquaculture Stewardship Council (ASC) is an independ-ent, international non-profit organisation, which established the world’s most stringent sustainability standard in June 2012. The mission of the ASC Standard is to bring aquacul-ture one step closer to the sustainable, environmentally and socially responsible production of salmon. This is achieved through effective market mechanisms that create value along the entire value chain. By choosing ASC-certified salmon,
1 https://sjomatdata.nifes.no/#search/ and www.matvaretabellen.no http://www.matportalen.no/matvaregrupper/tema/fisk_og_skalldyr/trygg_oppdrettsfisk-3
consumers can be assured that they are buying salmon from a responsible farmer.
SalMar aims to always be in a position to deliver fish from ASC-certified farms. At the close of 2019, the Group had 26 ASC-certified sea farms in Norway. This corresponds to 39 per cent of our active sites. All sites in Iceland are ASC certified. A further eight additional sites in Norway are awaiting receipt of their certificates, which are expected to arrive in 2020.
Percentage of active ASC-standard sites Target 2019 2018 2017
SalMar Rising 39% 31% 28%
Arnarlax 100% 100%
With more than 400 auditing criteria within seven main cat-egories, the ASC Standard is difficult to reach and to retain. It demands substantial resources with respect to documen-tation and reporting, before, during and after certification. Furthermore, SalMar has been certified in accordance with the ASC’s Chain of Custody scheme. Openness regarding our performance is a key aspect of the standard. Further details can be found on our website www.salmar.no, and the ASC’s website www.asc-aqua.org.
ProductsLocal processing enables SalMar to offer a wide range of first-class, fresh, frozen and organic salmon products.
Salmon and healthSalmon contains a number of nutrients which make it an important component of a balanced diet. Salmon is a healthy and tasty food. Salmon is safe to eat, and is one of our most analysed foodstuffs.
The World Health Organisation (WHO) has published a thor-ough report on both the risks and benefits of eating salmon. The report concludes that eating oily fish, like salmon, reduces the risk of cardiovascular disease. It is the products’ fat com-position, with a high content of the omega-3 fatty acids EPA and DHA, but also vitamin D, Selenium and easily digestible proteins, which contribute to this health benefit. The report warns of higher mortality rates if too little seafood is eaten. The biggest challenge with respect to seafood consump-tion remains the fact that people in general eat too little of the important nutrients provided by fish. One salmon meal a week (150g) has proved sufficient to cover the body’s recommended intake of the healthy fatty acids EPA/DHA.
The Norwegian Scientific Committee for Food Safety (VKM) makes recommendations to the Norwegian Food Safety Authority. The VKM has concluded that it is well documented that oily fish protects against cardiovascular disease, and has a positive impact on the neural development of babies, both before and after birth. The positive effects of eating seafood far outweigh any potentially negative impact.
The Norwegian Directorate of Health issues dietary guide-lines to the Norwegian population. Other countries have similar bodies that advise their citizens. The Norwegian Direc-torate of Health recommends a varied diet, and oily fish, such as salmon, is an important part of a varied and balanced diet.
Food safetySalMar’s production is subject to Norwegian regulations for food production, and our facilities are regularly inspected by the Norwegian Food Safety Authority (NFSA). In addition, the Group has its own sampling programme, under which feed and finished products are analysed and tested for a number of factors. The NFSA’s monitoring, performed by the National Institute of Nutrition and Seafood Research (NIFES), shows very little foreign matter in farmed fish, and no samples were found to exceed threshold values in the most recently published reports. Further details regarding the nutritional content and status with respect to contaminants, etc, in Norwegian seafood, please visit the Seafood Data section on NIFES’s website or search the Food Composition Table available from www.matportalen.no.1 Both of these are offi-cial databases.
SalMar produces healthy and tasty foods that are easy to prepare. SalMar’s products are based on first-class raw mate-rials, and the quality is maintained right through the value chain until the salmon reaches the consumer.
46 SuStainability and corporate Social reSponSibility
The job is noT done unTil The person you are doing iT for is saTisfied
Thorough training at all levels with regard to procedures is important to maintain the high quality of SalMar’s products. Production is organised such that the demands of different standards and customers are met. We perform regular inter-nal audits, and welcome the public authorities, certification agencies and customers to carry out external audits and inspections. Food safety and the regulations relating thereto are taken extremely seriously.
In 2019, there were no violations of the regulations governing food safety.
SalMar has defined routines for the follow-up of customer complaints, and the Group has informed its customers of how they should proceed if a product they have bought does not meet their expectations. All products can be traced back through the whole value chain, and a well-trained team is on hand to deal with any complaints from consumers. The complaints handling process is documented in a dedicated module in our quality system, and provides managers with an overview of the current status.
Pre-rigor filletSalMar supplies both fresh and frozen pre-rigor fillets. Sal-Mar’s focus on pre-rigor filleting is an important strategy with respect to energy consumption, transport-related emissions, 100 per cent exploitation of the raw material and the creation of local jobs.
Pre-rigor filleting means that the fish is harvested and fil-leted the same day, before the fish goes into rigor mortis. This processing enables delivery to the market 2–6 days earlier than has been the norm. This way of handling fish has a number of advantages:
• Fresher fish to the customer• Firmer muscle texture, better colour, less gaping
and lower drip loss• Longer shelf-life in the market• No need to store and mature the fish before
filleting and boning
Organic salmonSalMar is the world’s largest producer of organically farmed salmon. Organic salmon is supplied year round, and production is vertically integrated from the broodfish and roe down to the finished processed products. To be defined as organic, it must have been produced in compliance with the EU’s directives and be approved by DEBIO. Local processing means that we can deliver a wide variety of first-class fresh and frozen organic salmon products. SalMar supplies both pre- and post-rigor organic salmon. A high content of marine oils means that this salmon is an exceptionally good source of EPA and DHA.
Sashimi qualitySince 2011, SalMar has produced finely sliced, sashimi-quality fish. Every single salmon is handpicked, and only the best boneless pieces of salmon are used. After slicing, the fil-lets are packed within 1–4 hours to ensure maximum fresh-ness and taste.
The objective is to offer a salmon product that maintains the same quality and taste as it had on the day it was caught right up until its use-by date. To maintain this level of qual-ity, a unique packing, transport and refrigeration process is used. Our sashimi-quality products are transported in recy-cled cardboard boxes that are chilled using dry ice, which ensures optimal temperature control. The dry ice evaporates slowly, and the cold is transferred directly to the product. This ensures that the product is kept below zero degrees until it arrives at the supermarket. To prevent frost damage, the fish is protected by a layer of cardboard, which ensures that the salmon does not come into contact with the dry ice. As the dry ice evaporates, the salmon maintains a constant temperature that keeps its freshness.
47

What we do today we do better than yesterday
Our processes must be continually developed and improved if the company is to reach its objectives.
Further development and growth is closely linked to collaboration with SalMar’s stakeholders. In this chapter we focus on our R&D projects and on third-party collaborations to increase sustainability, and we provide some examples of the work being done.
New transport solutionsSalMar is the first aquaculture company to have trialled the transportation of salmon to the European continent by sea. Together with the shipping company Egil Ulvan Rederi AS, a test was carried out to ship salmon from the island district of Hitra in Central Norway to Hirtshals on the Continent for onward distribution to the market. 45-foot containers were loaded up at InnovaMar and received by end-users in the Netherlands and Germany. The project produced valuable answers. The actual voyage by sea worked well, so from a quality and logistics point of view the project was a success. We learned tangible lessons about practical matters relating to freight carriers, time and costs. The challenges lie in the higher costs and the overall logistics system. Optimising return freight and the flow of goods, the distance travelled by sea, etc, are some of the key issues that must be resolved to reduce costs.
SalMar is working on several new transport projects that combine various methods of transport. New partnerships are being developed, and in the next few years the company expects to realise projects involving a combination of sea, rail and road transport. All of this is part of our sustainabil-ity strategy.
Safe trailer transportAt certain times every winter in Norway and Iceland, the weather makes the roads impassable and we experience hazardous situations due to heavy goods vehicles with-out the proper tyres/chains. SalMar cares deeply that the
products we make and deliver from our facilities should be safe for the consumer. This applies not only to food safety but also to transport. We have therefore introduced control measures and routines.
As a buyer of transport services, SalMar demands that its suppliers meet certain standards. To haul salmon from our production facilities and harvesting plants, or from the facili-ties we work with, the transport services provider must sign a declaration stating that they know and comply with the Norwegian Public Roads Administration’s technical require-ments for vehicles in Norway. They also undertake to famil-iarise themselves with the prevailing driving conditions on the roads they will be using.
Together with the Norwegian Public Roads Administration, transport buyers and other partners, SalMar is a participant in the “Safe Trailer” project. This project is intended to help equip heavy vehicles to cope better with winter driving conditions in Norway, and will lead to increased safety for everyone who uses our road network. Specifically, the project involves Norwegian Public Roads Administration staff teaching our employees how to check that an HGV’s tyres and chains are in order, as well as providing useful information material to the company’s employees and drivers.
In addition, our staff make an assessment of whether an HGV seems to be in a technically acceptable condition and whether the driver is “competent” to drive it. In the event of any non-conformance, necessary measures are implemented. All this to ensure safer transport.
48 SuStainability and corporate Social reSponSibility

What We do today We do better than yesterday
Research and DevelopmentNorway’s aquaculture industry has experienced fantastic growth and development. SalMar is an important contributor to the development of the industry, and gives high priority to the advancement of knowledge within its areas of operation.
The company does this through close cooperation with the public authorities, educational and research establishments, and industry bodies. The extent of SalMar’s involvement in R&D is substantial. In 2019, SalMar has continued to focus on fish welfare and lice control. Major R&D projects have been undertaken at our processing plant, while considerable emphasis has been placed on the optimisation of feeding and the control of feeding at our sea farms. As always, we remain committed to helping the industry gain as much sector-spe-cific knowledge as possible and ensuring that it benefits the sector as a whole.
SalMar’s contacts with the NTNU have been growing in scope in recent years, which the company considers to be only nat-ural. The NTNU’s Taskforce Salmon Lice research programme was set up in 2016, partly at the initiative of SalMar. The taskforce is a collaborative effort between the NTNU and many aquaculture industry organisations. The objective is to take a broad look at the problems caused by salmon lice. The programme is well underway, and SalMar is participating actively in several of its subprojects. The NTNU has created five doctoral research positions, with postgraduate and undergraduate students attached to each one.
Endowment of aquaculture professorshipsSalMar is also in close contact with the University of Tromsø (UIT), and has signed a cooperation agreement involving the sharing of experience and the initiation of joint projects. One example is the work being done to establish an endowment professorship in the field of recirculating aquaculture sys-tems (RAS) at the UIT. This is a cooperative venture involving several industry players. We are extremely keen to support the education of tomorrow’s researchers, and ensure that students gain a good insight into the aquaculture sector, so they can contribute to its further development.
In collaboration with the NTNU, SalMar ASA has endowed a professorship within the field of aquaculture cybernetics. The professorship is intended to promote cross-functional research linking the areas technical cybernetics, biology and aquaculture. It will act as a knowledge base for and link between the aquaculture industry and the academic world. In addition to SalMar, Kongsberg Maritime is an important partner in this effort. The professorship will also contribute to the recruitment of more students to the field of aquacul-ture, thus securing the industry’s access to highly qualified technological expertise. This professorship will strengthen the NTNU’s position as one of the world’s leading universities for aquaculture and aquaculture technology.
Active use of R&D licencesSalMar has been actively engaged in partnerships with R&D establishments for many years. This also includes collab-oration on the operation of R&D licences. The scale and professionalism relating to important development tasks has increased, and continues to increase. SalMar sees itself as a professional, but demanding partner, whose aim is to ensure that the results of any trials are as relevant as possible, and that plans and protocols take account of the practical realities of fish farming. SalMar has dedicated personnel who organise and assist research establishments in their efforts, at the same time as operational staff gain more and more experi-ence in how best to safeguard research results under busy day-to-day operating conditions. Proximity to the research, with opportunities to influence both its planning and areas of focus are important sources of motivation for SalMar. The development of vaccines, optimisation of medication, feeding and nutrition, and technological issues relating to large-scale operations are examples of important areas for further research.
Innovation relating to feed and feedingThroughout 2019, efforts have been made to optimise feed-ing at our fish farms. We have continued to focus intently on optimising feeding during the fish’s first 12 weeks at sea, and on providing the greatest possible feed availability during this period. This is important to achieve a healthy and robust fish. In 2019, we continued our investment in feeding centres. At the close of the year, therefore, we had four feeding centres remotely feeding several farms from their control rooms. We have feeding centres at Finnsnes, Fosen and Smøla in Norway and one in Iceland.
The remote feeding scheme has increased our focus on feeding and is considered a good environmental measure in terms of providing strong growth, a fast turnover and effec-tive MAB and site utilisation. It also provides opportunities for increased focus on the competence of those employees who perform one of the most important core tasks at SalMar. Facilitating their access to real-time data and customising optimal reporting and support tools are areas the company is continuing to work on. In partnership with Telenor, we will boost our data transfer capacity through the installation of 5G at several of our sites in 2020.
Increased focus on geneticsGenetics and the development of a more robust salmon is one important preventive measure to reduce biological risk. Sal-Mar’s focus on breeding and genetics includes a collaboration with Benchmark Holding PLC’s entity SalmoBreed through our co-ownership of SalMar Genetics. SalMar is pleased to see that this model has provided a solid foundation for the further development of the Rauma Broodstock in the years ahead. In this effort, we will be focusing intensely on the develop-
49
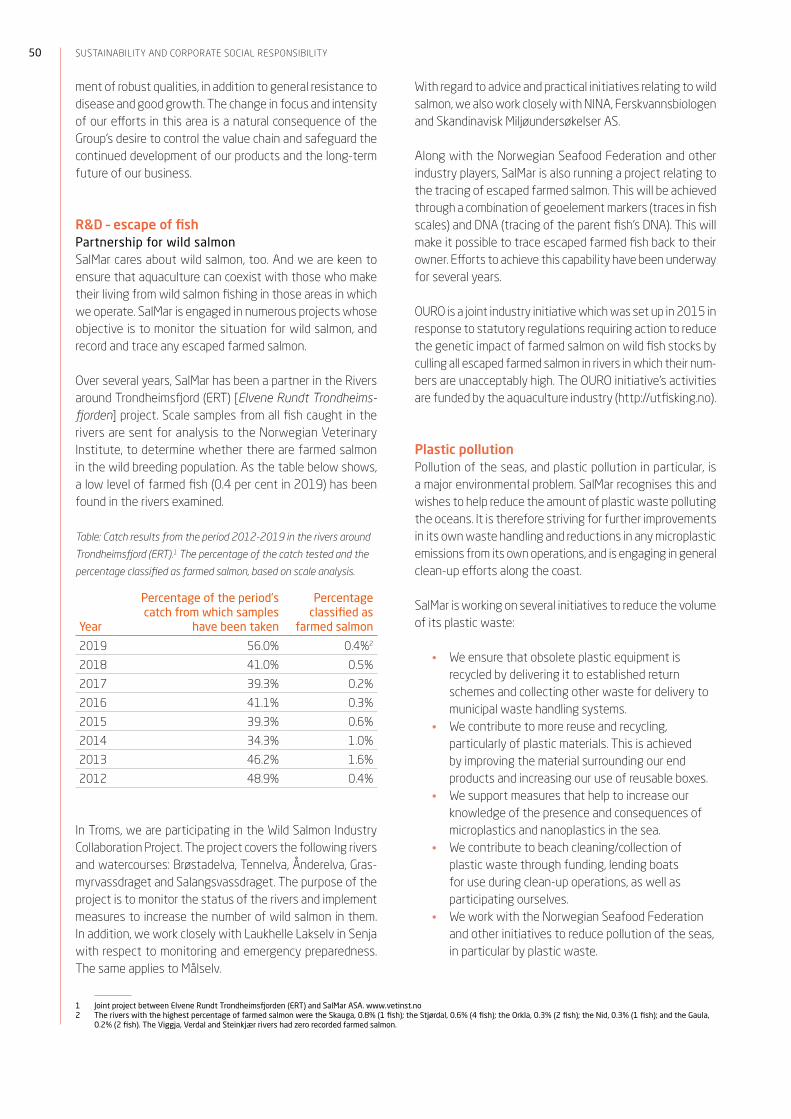
ment of robust qualities, in addition to general resistance to disease and good growth. The change in focus and intensity of our efforts in this area is a natural consequence of the Group’s desire to control the value chain and safeguard the continued development of our products and the long-term future of our business.
R&D – escape of fishPartnership for wild salmonSalMar cares about wild salmon, too. And we are keen to ensure that aquaculture can coexist with those who make their living from wild salmon fishing in those areas in which we operate. SalMar is engaged in numerous projects whose objective is to monitor the situation for wild salmon, and record and trace any escaped farmed salmon.
Over several years, SalMar has been a partner in the Rivers around Trondheimsfjord (ERT) [Elvene Rundt Trondheims-fjorden] project. Scale samples from all fish caught in the rivers are sent for analysis to the Norwegian Veterinary Institute, to determine whether there are farmed salmon in the wild breeding population. As the table below shows, a low level of farmed fish (0.4 per cent in 2019) has been found in the rivers examined.
Table: Catch results from the period 2012-2019 in the rivers around
Trondheimsfjord (ERT).1 The percentage of the catch tested and the
percentage classified as farmed salmon, based on scale analysis.
Year
Percentage of the period’s catch from which samples
have been taken
Percentage classified as
farmed salmon
2019 56.0% 0.4%2
2018 41.0% 0.5%
2017 39.3% 0.2%
2016 41.1% 0.3%
2015 39.3% 0.6%
2014 34.3% 1.0%
2013 46.2% 1.6%
2012 48.9% 0.4%
In Troms, we are participating in the Wild Salmon Industry Collaboration Project. The project covers the following rivers and watercourses: Brøstadelva, Tennelva, Ånderelva, Gras-myrvassdraget and Salangsvassdraget. The purpose of the project is to monitor the status of the rivers and implement measures to increase the number of wild salmon in them. In addition, we work closely with Laukhelle Lakselv in Senja with respect to monitoring and emergency preparedness. The same applies to Målselv.
1 Joint project between Elvene Rundt Trondheimsfjorden (ERT) and SalMar ASA. www.vetinst.no2 The rivers with the highest percentage of farmed salmon were the Skauga, 0.8% (1 fish); the Stjørdal, 0.6% (4 fish); the Orkla, 0.3% (2 fish); the Nid, 0.3% (1 fish); and the Gaula,
0.2% (2 fish). The Viggja, Verdal and Steinkjær rivers had zero recorded farmed salmon.
With regard to advice and practical initiatives relating to wild salmon, we also work closely with NINA, Ferskvannsbiologen and Skandinavisk Miljøundersøkelser AS.
Along with the Norwegian Seafood Federation and other industry players, SalMar is also running a project relating to the tracing of escaped farmed salmon. This will be achieved through a combination of geoelement markers (traces in fish scales) and DNA (tracing of the parent fish’s DNA). This will make it possible to trace escaped farmed fish back to their owner. Efforts to achieve this capability have been underway for several years.
OURO is a joint industry initiative which was set up in 2015 in response to statutory regulations requiring action to reduce the genetic impact of farmed salmon on wild fish stocks by culling all escaped farmed salmon in rivers in which their num-bers are unacceptably high. The OURO initiative’s activities are funded by the aquaculture industry (http://utfisking.no).
Plastic pollutionPollution of the seas, and plastic pollution in particular, is a major environmental problem. SalMar recognises this and wishes to help reduce the amount of plastic waste polluting the oceans. It is therefore striving for further improvements in its own waste handling and reductions in any microplastic emissions from its own operations, and is engaging in general clean-up efforts along the coast.
SalMar is working on several initiatives to reduce the volume of its plastic waste:
• We ensure that obsolete plastic equipment is recycled by delivering it to established return schemes and collecting other waste for delivery to municipal waste handling systems.
• We contribute to more reuse and recycling, particularly of plastic materials. This is achieved by improving the material surrounding our end products and increasing our use of reusable boxes.
• We support measures that help to increase our knowledge of the presence and consequences of microplastics and nanoplastics in the sea.
• We contribute to beach cleaning/collection of plastic waste through funding, lending boats for use during clean-up operations, as well as participating ourselves.
• We work with the Norwegian Seafood Federation and other initiatives to reduce pollution of the seas, in particular by plastic waste.
50 SuStainability and corporate Social reSponSibility

What We do today We do better than yesterday
In addition, SalMar is carefully monitoring the situation with respect to our own products. We support ongoing research into the impact of nanoplastics on food safety and are par-ticipating in the development of new knowledge in this field.
Onshore power and the electrification of the aquaculture industrySalMar is striving to make the aquaculture industry more environment friendly, and has set itself to become more energy efficient. Use of onshore power at sea farms and electrically powered boats are two examples of the projects we are working on.
In recent years, SalMar has been working on a project to run electrical cables from onshore out to our sea farms. We now have 28 sites in Norway that are supplied with electrical power from onshore. This represented 42 per cent of active sites in 2019. This results in a substantial reduction in diesel consumption. In addition to a decrease in emissions, this is an important initiative with respect to occupational health and safety, not least as regards employees’ exposure to noise from the diesel generators.
In 2016, SalMar put the world’s first completely electric aquaculture workboat into operation. The Elfrida operates at one of our sites in Møre & Romsdal County in Norway. In 2020, SalMar also signed an agreement to lease the world’s first hybrid battery wellboat, the RoVision, which will go into operation in the spring of 2020.
51

Focus on the solutionAny employee faced with a challenge or difficulty has a responsibility to help come up with a solution. Every challenge represents an opportunity for progress. In this chapter we highlight some examples of internal development projects.
Increased sustainability through increased secondary processingSalMar aims to produce a high proportion of processed prod-ucts by increasing its output of filleted rather than whole fish. Since SalMar was founded in 1991, harvesting and processing have played a key role in the Group’s strategy, and the figures show that company has steadily increased its output of processed products. This has reduced transport and energy consumption, increased the potential for secondary processing and provided more employment opportunities in Norway – all of which contribute to greater sustainability.
InnovaMar, one of the world’s most innovative and cost-ef-fective facilities for the landing, harvesting and processing of salmon, went into operation in 2011. Located in Frøya, Central Norway, the plant covers 17,500 m2 and also houses SalMar’s head offices. Through its co-ownership of Vikenco AS, which operates its own harvesting facilities, SalMar is also able to harvest and process fish from the southern parts of Central Norway and Møre & Romsdal.
In 2019, fileting capacity at InnovaMar was expanded. Together, InnovaMar and Vikenco produced around 42,000 tonnes of processed products, measured in product weight.
2019 2018 2017 2016
Volume of processed products (1,000 tonnes product weight) 42.0 42.4 44.9 36.9
In 2019, construction of a new harvesting and processing plant got underway in Northern Norway. Called InnovaNor, it is located in Senja. This facility will handle the volume produced by Fish Farming Northern Norway, and represents a considerable step towards boosting the company’s status as an important industrial driver in this region. InnovaNor is scheduled to go into production in the first half of 2021. When it does, the plant will contribute to increased local value creation and employment opportunities in the region. At the same time, InnovaNor will provide the same flexibility and immediate capacity to harvest fish in a biologically sound way as the Group has at its InnovaMar facility in Central Norway. It will also help to optimise logistics.
In 2019, work also got underway to expand Vikenco’s har-vesting and processing plant in Møre & Romsdal. This will provide increased capacity with respect to both harvesting and processing. Construction work is expected to be com-pleted in the autumn of 2020.
Online production of pre-rigor filetsInnovaMar comprises two departments (harvesting and processing), and a great deal of effort has been made to challenge traditional solutions. Innovative production tech-nologies increase the quality of the final product, reduce costs and improve working conditions for the staff. The plant can produce around 75,000 tonnes of salmon per shift, per year.
Finished products are prepared online as pre-rigor items, which affords great savings in the form of a reduced need for handling and input factors. Online production avoids the need to keep whole fish in containers filled with ice/slush in cold storage for 2-6 days. It also reduces the amount of labour and trucks needed for their internal handling and transport. The product is kept in production zones only for as long as it takes to process the finished item from whole fish. This avoids any increase in the temperature of the raw material, which is already chilled from the harvesting plant, and saves further use of ice to reduce the temperature of the finished item to the desired 2oC level. In addition to envi-ronmental benefits, online production of pre-rigor fillets is
52 SuStainability and corporate Social reSponSibility

Focus on the solution
also advantageous with regard to increased freshness and maximum exploitation of the raw material. SalMar aims to turn as much as possible of the salmon into pre-rigor fillets.
Full exploitation of the raw materials and reduced emissionsExporting pre-rigor fillets instead of whole fish reduces the weight by around 40 per cent, and consequently the need for transport. Increased processing therefore results in fewer heavy goods vehicles on the road and fewer emissions. Since fillets are cut before distribution to the market, we live up to the principle of supplying the right quality to the right cus-tomers. Any fillets downgraded due to quality issues will be transformed internally into appropriate “secondary products”.
By-products (head, spine, offcuts) are exploited to the full. All offcuts from the production of fillets at SalMar’s Inno-vaMar and Vikenco facilities are sent for further processing at Nutrimar, resulting in 100 per cent of the raw materials being utilised. From InnovaMar, the raw materials go directly to Nutrimar via a system of conveyer belts/pipes, which ensures a high degree of freshness and usable volume when process-ing this raw material. It also means that there is practically no need for input factors relating to its transport and handling. For more information about Nutrimar and its products, see www.nutrimar.no.
Reduction of food wasteSalMar leads the way by focusing intently on reducing food waste through the development of better packing and pack-aging solutions. We participate in national and international projects to develop and implement new solutions for effec-tive, quality-preserving production, packaging and distri-bution. This is all part of our efforts to boost sustainability by reducing environmental impacts caused by food waste, materials consumption and transport through the value chain.
Product development and new packaging solutionsWe are focusing on the further development of packag-ing solutions, including a switch to new more environ-ment-friendly materials, the reuse of materials and the addition of other desirable properties. This includes a diver-sification from the traditional use of expanded polystyrene.
SalMar is working hard to increase the percentage of its prod-ucts that are transported in reusable boxes. A large proportion of SalMar’s pre-rigor finished products are already packed in such boxes. This affords savings in the form of a reduced need for ice and avoids having to discard the equivalent of around 170,000 ordinary polystyrene boxes. Boxes do not have lids and are part of a circular system that sees them returned from the customer, washed/disinfected and brought back to the plant ready for reuse.
With respect to a large part of our fillet production, we have stopped using ordinary ice and have switched to dry ice made from gas deriving from fertiliser production. Dispensing with water ice reduces the consignments’ weight and volume, and thereby the emissions generated in connection with their transport.
We have started using plastic packaging for some of our finished products. By using a thinner plastic film, we have reduced our consumption of plastic by over 30 tonnes. We continue to work on the development of new and better packaging materials and technologies. We are focusing par-ticularly on reusable boxes, ice-free shipments and packaging technology that provides complete bacteriological security.
Focus on shelf-life and qualityThe development of new and improved solutions that can extend the products’ shelf life is extremely important. In 2019, we continued to increase our use of the Keep-It® shelf-life indicator on our products. This is an indicator that shows the temperature and the product’s remaining shelf-life. This is a device that really focuses the attention of all links in the value chain (from the factory to the customer), thereby helping to increase the shelf-life of the product and reduce food waste.
We are currently working on new projects that aim to visualise the quality of the product in the package, using new techno-logical solutions. The objective is to be able to document addi-tional quality attributes through simple technological solutions.
Sustainable smolt productionIn 2019, SalMar had seven salmon hatcheries in Norway and two in Iceland. The Group’s largest hatcheries are:
Follafoss: This facility was established in 1985. Over the years, it has been substantially expanded and modernised. In 2017, the facility opened three new recirculating aqua-culture systems (RAS) departments, and in the latter part of 2019 a further RAS department was completed. This provides greater capacity and flexibility in the production of smolt. Today, Follafoss is an ultra-modern production facility, where the exploitation of alternative energy resources plays a crucial role.
Senja: This facility was completed and officially opened in the spring of 2017. It plays a key role in SalMar’s efforts to become self-sufficient in smolt in Northern Norway. In 2019, it was decided to expand the facility. Construction work is expected to commence in the summer of 2020 and be com-pleted in 2020. Delivery of the first smolt to be raised there is planned for 2022. The expansion will not only provide the capacity to produce a larger number of smolt, but also the flexibility to produce a larger size of smolt.
53

The production of smolt is switching increasingly to the use of RAS technology, and in the autumn of 2019 SalMar purchased a parcel of land in Tjuin, near Follafoss, where it is considering the establishment of a new RAS facility.
Substantial investments are being made to make smolt pro-duction as sustainable as possible. Some of the areas which SalMar is working on in the hatchery area are presented below.
Focus on survivalRobust and viable smolt are one of the most important pre-requisites for high performance in the marine phase and a high-quality end product. SalMar aims to achieve a survival rate of more than 95 per cent, from the time the smolt are transferred to the sea farms until they are harvested. Smolt from its hatcheries are transferred to SalMar’s own sea farms, where its biological performance and, not least, survival rate, constitutes an important KPI.
To achieve a high survival rate, SalMar’s hatcheries work systematically to improve smolt quality. Particular attention is paid to stable, high-quality water, good environmental conditions in the fish tanks, optimal oxygen conditions, good sorting routines, temperature control and general fish health. As part of this effort, a dedicated production biologist is responsible for fish welfare and collaboration with internal and external partners.
Recirculating aquaculture technology (RAS)All our most modern hatcheries are equipped to use recircu-lating aquaculture technology (RAS), with approx. 97 per cent purification and reuse of the production water. This means that a RAS facility with the capacity to produce 15 million smote uses as little water as a standard water throughput facility hatchery producing around 1 million smolt. Water consumption has therefore been reduced more than 10-fold. In 2019, around 82 per cent of the biomass transferred to SalMar’s sea farms was produced in RAS facilities. Since all new capacity is built using this technology, water consump-tion per unit produced will decrease further as time goes by.
Because RAS technology enables a large production volume with little water consumption, it also affords unique opportu-nities for controlling and managing water quality. This applies particularly to the optimisation of the water temperature without using large amounts of energy for heating. RAS facilities are an important factor in reducing the company’s water and energy consumption.
Exploitation of local energy and water resourcesAs part of our energy efficiency efforts, the Group uses local water-borne energy resources where possible. We have such solutions at several of our hatcheries.
Follafoss, our largest hatchery, uses heat exchangers to exploit the energy from the waste water produced by the cellulose plant located next door. Energy corresponding to around 20 million kWh is extracted in this way, which reduces SalMar’s energy consumption by the same amount. The hatchery’s production water is obtained from the Folla-foss Power Plant. A turbine has been installed in the supply pipe to the hatchery. As a result, up to 1.5 MW of electrical power is derived from the water supply before the water is used for fish production.
Our Kjørsvikbugen hatchery in Aure makes use of the water used to cool a methanol plant at Tjeldbergodden. Some 20 m3 of waste water heated to 18oC is used to heat SalMar’s facil-ity. This provides around 48 million kWH of energy per year.
Iceland has certain natural advantages deriving from geo-thermal sources. This is exploited by the hatcheries, which use geothermal heat exchangers to warm their intake water, thereby cutting their energy requirement.
Utilisation of sludge as a resourceSalMar’s hatcheries are required to treat their waste water before its discharge and have established a variety of pro-cesses to utilise the resultant sludge as a resource.
At the Senja hatchery, an ultramodern drying facility has been installed. As a result, all the sludge produced by the facility is dried to a 95 per cent solid, which is then delivered to a third party for use in the production of soil improvement agents that can be found on sale in the retail sector.
At the Follafoss hatchery, the sludge is separated from the water using sedimentation. The bulk of the sludge is used for biogas production. Some is still also delivered to a third party, which sanitises it by adding it to livestock manure. The resulting product is spread on fields as a soil improvement agent/fertiliser.
At Rauma Eik in Møre & Romsdal County, the sludge is deliv-ered to a waste treatment company, which uses it in the production of compost.
54 SuStainability and corporate Social reSponSibility

GRI Index
GRI IndexEach year, SalMar reports on its activities in the field of cor-porate social responsibility and sustainability on the basis of the guidelines issued by the international organisation, the Global Reporting Initiative (GRI). Reporting takes place via this report, SalMar’s annual report and other information published on our website.
The sustainability reporting for 2019 includes data for a number of ‘Standard Disclosures’ from GRI’s guidelines. All core elements are included, as well as a number of other indicators. An overview of which indicators the report covers is presented in the table below. The report is not exter-nally evaluated.
The report’s contents in relation to the GRI Index
General Disclosures (GRI 102)Deviates from
GRI requirements
Organizational profile
102-1 Name of the organization Salmar ASA
102-2 Activities, brands, products and services Farming of Atlantic salmon, conventional and organic, as well as rainbow trout.
102-3 Location of headquarters Industriveien 51, 7266 Kverva, Norway
102-4 Location of operationsEight countries, the most important of which for sustainability reporting purposes are Norway and Iceland
102-5 Ownership and legal form Salmar ASA is a public limited company that is listed on the Oslo Stock Exchange.
102-6 Markets served Page 6 and note 23 to group statements
102-7 Scale of the organization Page 6 and 7
102-8 Information on employees and other workers Page 7 and page 34 Partly
102-9 Supply chain Page 45
102-10 Significant changes to the organization and its supply chain Page 75 and note 8 to group statements
102-11 Precautionary Principle or approach Page 30–33
102-12 External initiatives Page 10–11 and 45–47
102-13 Membership of associations
Norwegian Seafood Federation, Confederation of Norwegian Enterprise (NHO), OrAqua – Organic Aquaculture, Federation of European Aquaculture Producers (FEAP)
Strategy
102-14 Statements from senior-decision maker Page 10–11
102-15 Key impacts, risks and opportunities Page 74–87
Ethics and integrity
102-16 Values, principles, standards and norms of behaviour Page 24–25 and www.salmar.no
102-17 Mechanism for advice and concerns about ethics Page 34–37
Governance
102-18 Governance structure Page 30
102-19 Delegating authority Page 30
102-20 Executive-level responsibility for economic, environmental and social topics Page 30
55

Stakeholder engagement
102-40 List of stakeholder groups Page 33
102-41 Collective bargaining agreements 85.5% of the workforce
102-42 Identifying and selecting stakeholders Page 33
102-43 Approach to stakeholder engagement Page 33
102-44 Key topics and concerns raised Page 32–33 Partly
Reporing practice
102-45: Entities included in the consolidated financial statements Page 80–81 and note 3 to group statements
102-46 Defining report content and topic boundaries Page 30–32
102-47 List of material topics Page 32
102-48 Restatements of information N/A
102-49 Changes in reporting Arnarlax has been included
102-50 Reporting period 2019
102-51 Date of mot recent report 26 April 2019
102-52 Reporting cycle Annual
102-53 Contact point for questions regarding the report Head of Investor Relations Håkon Husby
102-54 Claims of reporting in accordance with the GRI standards Page 55
102-55 GRI content index Page 55–56
102-56 External assurance Page 55
Management approach (GRI 103)
103-1 Explanation of the material topics and its boundary Page 30–33 Partly
103-2 The management approach and its components Page 30–33 Partly
103-3 Evaluation of the management approach Page 30–33 Partly
Environmental standards (GRI 300)
301 Materials Page 45
302-1 Energy consumption within the organization Page 42–44 Partly
302-3 Energy intensity Page 42–44
302-4 Reduction of energy consumption Page 42–44 and page 52–54 Partly
303-3 Water withdrawal Page 44 Partly
305-1 Direct (Scope 1) GHG emissions Page 42–44
305-2 Energy indirect (Scope 2) GHG emissions Page 42–44
305-3 Other indirect (Scope 3) GHG emissions Page 42–44
305-4 GHG emissions intensity Page 42–44
305-5 Reduction of GHG emissions Page 42–44 Partly
306-3 Significant spills Page 38
Social standards (GRI 400)
403-1 Occupational health and safety management system Page 34–36 Partly
403-2 Hazard identification, risk assessment, and incident investigation Page 34–36 Partly
404-2 Programs for upgrading employee skills and transition assistance programs Page 34–36 Partly
404-3 Percentage of employees receving regular performance and career development reviews Page 34–36 Partly
Society
205-3 Confirmed incidents of corruptions and actions taken Page 37 Partly
Customer health and safety (GRI 416)
416-2 Incidents of non-compliance concerning the health and safety impacts of products and services Page 45–47
56 SuStainability and corporate Social reSponSibility


Corporate governance at SalMar ASA
SalMar ASA aims to maintain a high standard of corporate governance. Good corporate governance strengthens public confidence in the company and contributes to long-term value creation by regulating the reciprocal roles and responsibilities of shareholders, the board of directors and the company’s management, over and above that which is stipulated in legislation and other regulations.
58

Corporate governance at SalMar shall be based on the fol-lowing main principles:
• All shareholders shall be treated equally.• SalMar shall maintain open, relevant and reliable
communications with its stakeholders, including shareholders, public authorities and the general public, on matters relating to its business.
• SalMar’s board of directors shall be autonomous and independent of company management.
• The majority of board members shall be independent of the company’s majority shareholder.
• SalMar shall have a clear allocation of roles and responsibilities between shareholders, the board and management.
1. Corporate governanceCompliance and regulationsSalMar’s board of directors has overall responsibility for ensur-ing that the company has adequate corporate governance. The company’s board and management perform a thorough annual assessment of its principles for corporate governance.
SalMar is a Norwegian public limited company listed on the Oslo Stock Exchange. The company is subject to section 3-3b of the Norwegian Accounting Act, pursuant to which the company must annually disclose its principles and practices with respect to corporate governance. In addition, the company is subject to the Oslo Stock Exchange’s requirements for an annual state-ment of its principles and practices with respect to corporate governance. This disclosure shall cover each chapter in the pre-vailing Norwegian Code of Practice for Corporate Governance (the “code of practice”) issued by the Norwegian Corporate Governance Board (NUES). The Oslo Stock Exchange’s Contin-uing Obligations provide an overview of the information that must be included in the disclosure. The Norwegian Accounting Act is available from www.lovdata.no, while the Continuing Obligations are available from www.oslobors.no.
SalMar complies with the current code of practice, published 17 October 2018. The code of practice may be found at www.nues.no.
Application of the code of practice is based on the ‘comply or explain’ principle, which means that the company must provide an explanation if it elects an approach different to that recommended in the code of practice.
SalMar issues a comprehensive statement of its principles for corporate governance in its annual report, and this infor-mation is available from www.salmar.no. This statement describes how SalMar has conducted itself with respect to the code of practice in 2019.
Deviations from the code of practice: None
2. Business and purposeSalMar is one of the world’s largest producers of farmed salmon. As at 31 December 2019, the company owned 100 licences for marine production of Atlantic salmon in Norway, in addition to 16 development licences and a licence relating to a demonstration centre (Finnsnes). Furthermore, SalMar owns 50 per cent of Norskott Havbruk AS, which in turn owns 100 per cent of Scottish Sea Farms Ltd, the UK’s second larg-est producer of salmon, with a capacity of 30,000 tonnes of harvested fish. At the close of 2019, SalMar owned 59.36 per cent of the Icelandic aquaculture company Arnarlax, which harvested around 10,000 tonnes of salmon in 2019. SalMar has substantial secondary processing and sales activities in Frøya and Aukra, as well as five sales offices in Asia.
SalMar ASA’s objectives are defined in Article 2 of its articles of association:
The objective of the company is fish farming, the processing and trading of all types of fish and shellfish, and other financial activities related thereto. The company may, in accordance with directives from the relevant authorities, undertake general investment activities, including participation in other companies with similar or related objectives.
SalMar’s board of directors has drawn up clear objectives and strategies for the Group to secure optimal value creation for its shareholders and other stakeholders. Each business area has developed its own goals in line with these, and strategic priorities have been defined. Within the framework of the above article, SalMar is currently engaged in broodfish and smolt production, marine-phase farming, harvesting, pro-cessing and sale of farmed salmon. The board also defines risk profiles for the Group and ensures that these support value creation for its shareholders.
The company’s objectives and main strategies are further discussed in the annual report and can be found on the company’s website www.salmar.no.
Corporate values, code of conduct and social responsibilitySalMar’s corporate culture is based on the success factors that have underpinned its development since its establish-ment in 1991. Although this culture is affected by both inter-nal and external framework conditions, it is firmly embedded in certain overarching principles, such as equality, quality, care for the environment, focus on work tasks and continuous improvement.
Underpinning all of SalMar’s actions and business operations is its vision: “Passion for Salmon”. This means that all choices
59

relating to the company’s production shall be made on the basis of a passion for salmon. Salmon shall be produced on its own terms. SalMar considers that the best biological results will provide the basis for the best financial results, and will safeguard our position as the world’s most cost-effect salmon producer.
SalMar has a set of tenets that describe desired behav-iours and a shared understanding of how employees should behave. Through the SalMar School and day-to-day exposure to SalMar’s corporate and performance culture, all employees are given encouragement and opportunities for development. For more information on the SalMar culture, please see the annual report and the company’s website www.salmar.no.
SalMar has drawn up a code of conduct and social responsibil-ity, whose purpose is to safeguard and develop the company’s values, create a healthy corporate culture and uphold the company’s integrity. The code of conduct is also meant to be a tool for self-assessment and for the further development of the company’s identity. All employees of the company are bound to comply with the ethical guidelines laid down in the code of conduct. The reporting of any wrongdoing or other causes for concern is covered by specific procedures, which also allow employees to report anonymously through an external channel. The code of conduct is available from the company’s website www.salmar.no.
SalMar has a presence in many local communities. The Group is therefore extremely aware of the diverse nature of its social responsibilities: as an employer, an industrial proces-sor, a producer of healthy food, as a custodian of financial and intellectual capital, and – not least- as a user of the natural environment. Increased biological control is one of the company’s most important focus areas, and is a material prerequisite for long-term success. The company is, among other things, working actively to safeguard fish welfare and prevent salmon from escaping.
One of the company’s most important tenets is ‘We care’. This permeates the SalMar culture, and ensures a high degree of awareness among employees, both internally and externally, in the areas in which the company operates.
Deviations from the code of practice: None
3. Equity and dividendEquityAs at 31 December 2019, the company’s equity totalled NOK 9,740.1 million, which corresponds to an equity ratio of 54.2 per cent. The board considers SalMar’s capital structure to be adequate in relation to the company’s objectives, strategy and risk profile.
Dividend policySalMar intends to provide shareholders with a competi-tive return on invested capital, taking into consideration the company’s risk profile. Returns will be achieved through a combination of positive share price development and the payment of a dividend. The company plans to pay out surplus liquidity (funds not necessary for the company’s day-to-day operations) in the form of a dividend or by means of a capital reduction with distribution to the shareholders. The com-pany will at all times consider whether the available liquidity should be used for new investments or the repayment of debt instead of being paid out as dividend. Provided the Annual General Meeting (AGM) approves, the aim is to make annual payments of dividend. The company will also consider the buyback of treasury shares within the authorisation limits granted to the board by the AGM.
Based on the critical situation society finds itself in as a result of the ongoing Covid-19 coronavirus outbreak, SalMar ASA’s board of directors had decided that no dividend will be paid out for 2019. This decision was made after a thorough assessment by the company’s board and management, in light of the uncertainty attaching to the spread of the virus and the consequences it could have for the entire value chain and on a number of local communities along the Norwegian coast. In the prevailing circumstances, the board believes that not paying a dividend is the right way to safeguard the interests of both shareholders and society at large.
SalMar has a strong balance sheet and a low debt ratio. The board’s decision not to pay a dividend at this time is therefore solely the result of the national and global state of emergency that has arisen. It implies no change from the company’s general dividend policy, which rests on the foreseeable payout of surplus liquidity.
Board authorisationsAuthorisations granted to the board are normally time limited, and are valid only up until the next AGM.
The AGM of 5 June 2019 granted the board three authorisa-tions, one to increase the company’s share capital, one to buy back its own (treasury) shares, and one to issue convertible loans. These were extensions of authorisations granted by the AGM in 2018. In line with the Norwegian code of practice, each of the authorisations was considered separately.
The first authorisation allowed the board to increase the company’s share capital by up to NOK 2,832,000, through the issue of up to 11,328,000 shares to finance investments and the acquisition of businesses through cash issues and contributions in kind.
The second authorisation allowed the board acquire treas-ury shares up to a maximum of 10 per cent of applicable
Corporate governanCe at SalMar aSa60

share capital: in other words, up to 10,766,997 treasury shares, with a total face value of NOK 2,691,749.25. The authorisation may be used to purchase company shares in connection with the share-based incentive scheme for senior management and as a means of returning value to existing shareholders.
The third authorisation allows the board to issue converti-ble loans for up to NOK 2,000,000,000 for the purpose of enabling the company, at short notice, to use such financial instruments as part of its overall financing requirement. In connection with the conversion of loans raised pursuant to this authorisation, the company’s share capital may be increased by up to NOK 2,832,000, though with account taken of any capital increases undertaken pursuant to the authorisation to increase the company’s share capital, such that the total capital increase for both authorisations com-bined may not exceed 10 per cent of the share capital.
It follows from the purpose of the authorisations that the board may need to waive existing shareholders’ preference rights, which is permitted under the terms of the authorisa-tions concerned.
All board authorisations are valid up until the next AGM, which will be held on 3 June 2020.
Deviations from the code of practice: None
4. Non-discrimination of shareholders and transactions with closely related partiesAs at 31 December 2019, SalMar ASA owned 377,141 treasury shares, which accounts for 0.33 per cent of the company’s registered share capital. Transactions involving treasury shares are undertaken on the stock exchange or otherwise at the listed price.
In the event of not immaterial transactions with related parties, the company shall make use of valuations provided by an independent third party.
In the event of capital increases based on an authorisation issued by a general meeting of shareholders, where the existing shareholders’ rights are waived, the reason for this will be provided in a public announcement in connection with the capital increase.
SalMar’s code of conduct and regulations regarding insider trading set out what is required of employees with respect to loyalty, conflicts of interest, confidentiality and guidelines for trading in the company’s shares. The code of conduct states that all employees must notify the board if they, directly or indirectly, have a material interest in any agreement entered
into by the company. Board members also have a duty to comply with the company’s code of conduct.
SalMar’s CEO Gustav Witzøe is the company’s founder. He indirectly owns 93.02 per cent of Kverva AS, which, through Kverva Industrier AS, owns 52.46 per cent of the shares in SalMar ASA. Witzøe is a member of the board of Kverva AS. The instructions regulating the Audit and Risk Committee contain a point relating to monitoring of the company’s rou-tines and follow-up of transactions between related parties.
Transactions with related parties are discussed in Note 29 to the 2019 financial statements.
Deviations from the code of practice: None
5. Free transferabilitySalMar has only one class of shares and all shares have equal rights. Each share has a face value of NOK 0.25 and car-ries one vote.
The company’s shares are freely transferable on the Oslo Stock Exchange, and its articles of association do not contain any restrictions on the right to own, trade or vote for shares in the company, as long as the regulations governing insider trading are complied with.
Deviations from the code of practice: None
6. General meeting of shareholdersThe company’s highest decision-making body is the General Meeting of Shareholders.
General meetings of shareholders are open for participation by all shareholders. Pursuant to Article 7 of the company’s articles of association, the Annual General Meeting must be held by the end of June each year in Oslo, Trondheim or Kverva in the municipality of Frøya.
The 2020 AGM will be held on 3 June at the company’s head office in Frøya.
An invitation to attend the AGM or an EGM will be issued no later than 21 days prior to the date of the meeting.
In accordance with the company’s articles of association, documents relating to matters to be addressed at a general meeting of shareholders may be made available on SalMar ASA’s website. The same applies to documents which by law must be included in or attached to the invitation to attend the general meeting. If the documents are made available in this way, the statutory requirement with respect to distri-bution to shareholders is not applicable. A shareholder may
61

nevertheless ask to be sent documents relating to matters to be discussed at a general meeting by post. Case docu-ments must contain all the documentation necessary to enable shareholders to take a standpoint on all matters to be addressed. Pursuant to section 5-11 of the Public Limited Companies Act, shareholders are also entitled to table their own items for consideration by the general meeting.
The deadline for notification of shareholders’ intention to attend a general meeting is stipulated by the board of direc-tors in the invitation thereto, no less than five days prior to the date of the meeting. Shareholders may send notification of their attendance, using the form provided, by post or email to the company’s account manager Nordea Bank Norge AS, or via the company’s website www.salmar.no.
Shareholders are entitled to make proposals and cast their votes either in person or through a proxy, including a proxy appointed by the company. The proxy form also enables shareholders to grant a proxy vote for each individual agenda item.
The board determines the agenda for the meeting, and the main issues to be dealt with by the AGM are regulated by Article 9 of the company’s articles of association and section 5-6 of the Public Limited Companies Act.
The board of directors, Nomination Committee and the com-pany’s auditor will be represented general meetings, which will normally be chaired by the Board Chair. The present Board Chair, Atle Eide, is a member of the board of Kverva AS, Sal-Mar’s majority shareholder. Nevertheless, SalMar considers the Board Chair to be best suited to chair the general meeting. In the event of any disagreement on individual agenda items where the Board Chair belongs to one of the factions, or for some other reason is not deemed to be impartial, a different person will be selected to chair the meeting in order to ensure independence with respect to the matters concerned.
The company will publish the minutes of general meetings of shareholders in accordance with stock exchange regulations.
Deviations from the code of practice: None
7. Nomination committeeArticle 8 of the company’s articles of association stipulates that the Nomination Committee shall comprise a total of three people, who shall be shareholders or shareholders’ representatives. The Nomination Committee’s composition shall be such that the interests of shareholders as a commu-nity shall be upheld, and the majority of committee members shall be independent of management and the board. The members of the Nomination Committee, including its chair, are elected by the AGM for a term of two years. Members may
be re-elected. To ensure continuity, members’ terms of office shall not coincide. The remuneration payable to members of the Nomination Committee is determined by the AGM. A set of regulations governing the work of the Nomination Committee was adopted at the board meeting of 21 March 2007 and updated at the AGM in 2014.
As at 31 December 2019, the Nomination Committee com-prised the following:
• Bjørn Wiggen, Chair (up for election in 2020)• Endre Kolbjørnsen (up for election in 2020)• Anne Kathrine Slungård (up for election in 2021)
The Nomination Committee shall make a recommendation to the AGM with respect to candidates for election to the board of directors and Nomination Committee, as well as pro-pose the remuneration payable to the members of the board and the Nomination Committee. In its work, the Nomination Committee shall take into consideration relevant statutory requirements with respect to the composition of the com-pany’s governing bodies, as well as principles for corporate governance laid down in the Norwegian Code of Practice for Corporate Governance drawn up by NUES. Proposals for members of the board and Nomination Committee should safeguard the shareholder community’s interests and the company’s need for competence, capacity and diversity. To achieve this the Nomination Committee may contact share-holders and company directors.
The Nomination Committee draws up criteria for the selection of candidates for the board and Nomination Committee, in which both sexes should be represented. The Nomination Committee should, over time, balance the requirements for continuity and renewal in the individual governing body. Relevant candidates must be asked whether they are willing to undertake the office of director or deputy director.
The committee should base its recommendations with respect to the remuneration payable on (a) information about the size of the remuneration paid to elected officers in other comparable companies, and (b) on the scope of work and the amount of effort the elected officers are expected to devote to the task on behalf of the company.
The Nomination Committee’s recommendation to the AGM must be published in good time, so that it can be communi-cated to the shareholders before the meeting takes place. The recommendation shall accompany the invitation to attend the AGM, no later than 21 days before the meeting takes place. The committee’s recommendation shall contain information about the candidates’ independence and compe-tence, including age, education and work experience. If rele-vant, notice shall also be given about how long the candidate has been an elected officer of the company, any assignments
Corporate governanCe at SalMar aSa62

for the company, as well as material assignments for other group companies that may be of significance.
Proposals to the Nomination CommitteeAll shareholders are entitled to propose candidates for the board or other elected offices to the Nomination Commit-tee. Such proposals must be submitted to the Nomination Committee no less than six weeks prior to the company’s AGM. All proposals shall be sent by email to the Nomination Committee’s chair. Contact details are available from the company’s website www.salmar.no.
Deviations from the code of practice: None
8. Board of directors, composition and independencePursuant to Article 5 of SalMar’s articles of association, the board of directors shall comprise five to nine members, to be elected by the AGM. The Board Chair is elected by the AGM, while the Vice-Chair is elected by the board itself. The com-pany’s current board is made up of six members, including two employee representatives. Two of the company’s directors are women, including one female employee representative. Women therefore comprise 33 per cent of the board’s mem-bership. The Public Limited Companies Act states that there should be at least three women on the board of directors when the board has between six and eight members. The reason why female representation on the board is below the mandated threshold is that Trine Danielsen was obliged to resign her seat on 7 February 2020 when she was appointed State Secretary with effect from 10 February 2020. The level of female representation will once again meet the require-ments of the Public Limited Companies Act with effect from the AGM to be held on 3 June 2020.
The regulations governing the work of the Nomination Com-mittee state that emphasis shall be placed on ensuring that members of the board have the necessary competence to carry out an independent assessment of the matters pre-sented to it by management and of the company’s business activities. Emphasis shall also be placed on ensuring that there is a reasonable gender balance and that directors are independent with respect to the company. The Nomination Committee’s recommendation shall meet the requirements relating to board composition stipulated by applicable leg-islation and the regulations of the Oslo Stock Exchange. Board members are elected for a term of two years and may be re-elected. An overview of the individual directors’ competence and background is available from the company’s website www.salmar.no.
None of the board members held shares in SalMar as at 31 December 2019.
Independence of the boardSalMar’s board of directors is composed such that it is able to act independently of any special interests. Board Chair Atle Eide is also a member of the board of Kverva AS, the company’s majority shareholder, while Helge Moen is a part-ner at Kverva AS. These two are therefore not deemed to be independent. The remaining directors are deemed to be independent of senior executives, material business asso-ciates and the company’s largest shareholders. In matters of material importance in which the Board Chair is, or has been, actively engaged, another director is appointed to chair the board’s deliberations. No such matters have been addressed during 2019.
Deviations from the code of practice: The percentage of female representation on the board of directors from 10 February 2020 until the AGM on 3 June 2020.
9. The board of directorsThe board has overall responsibility for the management of the Group and the supervision of its day-to-day management and business activities. The work of the board is governed by a set of regulations which describe the board’s responsibili-ties, tasks and administrative procedures. Furthermore, the board determines the Group’s overall objectives and strategy, including the overall composition of the Group’s portfolio and the business strategies of the individual business unit. The board has also prepared a set of instructions for the executive management team that clarifies its duties, lines of authority and responsibilities.
The regulations governing the board’s working practices provide guidelines for how individual directors and the CEO should conduct themselves with respect to matters in which they may have a personal interest. Among them is the stipula-tion that each director must make a conscious assessment of his/her own impartiality, and inform the board of any possible conflict of interest.
The board shall approve the Group’s plans and budgets, and shall. Proposals relating to targets, strategies and budgets are drawn up and presented by management. Strategy is normally discussed during the autumn, ahead of the Group’s budget process. Within the area of strategy, the board shall play an active role in setting management’s course, par-ticularly with regard to organisational restructuring and/or operational changes.
The board meets as often as necessary to perform its duties. In 2019, the board held 10 meetings, of which 5 were by telephone. The overall attendance rate at board meetings was 97 per cent.
63

The board makes an annual assessment of its own work and competence. An evaluation of this kind was last conducted in February 2019.
Audit and Risk CommitteePursuant to the Public Limited Companies Act, SalMar has a board-appointed an Audit and Risk Committee (previously called the Audit Committee). The committee’s main tasks are to prepare the board’s follow-up of the financial reporting process, monitor the Group’s internal control and risk man-agement systems; monitor its routines and follow-up of transactions with related parties; and maintain an ongoing dialogue with the auditor. The committee held five meetings in 2019, with an overall attendance rate of 100 per cent.
As at 31 December 2019, the Audit and Risk Committee comprised the following:
• Kjell Storeide, chair• Helge Moen
Deviations from the code of practice: None
10. Risk management and internal controlThe board is responsible for ensuring that the company’s risk management and internal control systems are adequate in relation to the regulations governing the business. The company’s systems and procedures for risk management and internal control are intended to ensure efficient operations, timely and correct financial reporting, as well as compliance with the legislation and regulations to which the company is subject. The board performs an annual review of the com-pany’s risk management/corporate governance.
The most important risk factors for the company are bio-logical risk associated with the biological situation in its hatcheries and sea farms, as well as the risk of fish escaping therefrom, and financial risk (fluctuations in salmon prices, foreign exchange, credit and interest rate risk). These risks are monitored and addressed by managers at all levels in the organisation. For further information, please see the 2019 annual report and Note 2 to the 2019 financial statements.
It is the CEO’s responsibility to ensure that the company oper-ates in accordance with all relevant statutes and guidelines associated with operation of the Group’s divisions.
Internal control of financial reporting is achieved through day-to-day follow-up by management and process owners, and supervision by the Audit and Risk Committee. Non-con-formances and improvement opportunities are followed up and corrective measures implemented. Financial risk is man-aged by a central unit at head office, and, where appropri-
ate, consideration is given to the use of financial hedging instruments.
Follow-up and control of compliance with the company’s values, code of conduct takes place in the line as part of day-to-day operations.
The largest risk facing SalMar relates to the biological development of its smolt and marine-phase fish stocks. The company has internal controls which encompass systematic planning, organisation, performance and evaluation of the Group’s activities in accordance with both public regulations and its own ambitions for continuous improvement. The Group has, for example, drawn up shared objectives for its internal control activities relating to the working environ-ment and personal safety, escape prevention, fish welfare, pollution, food safety and water resources. Please see the annual report for further details.
Deviations from the code of practice: None
11. Directors’ feesThe Nomination Committee’s proposal for the remuneration payable to the board of directors is approved or rejected by the company’s AGM. Directors’ fees shall reflect the board’s responsibilities, competence, time spent and the complexity of the business.
Directors’ fees are not performance-related and contain no share option element. Additional information relating to directors’ fees can be found in the notes to the financial statements included in the 2019 annual report.
Deviations from the code of practice: None
12. Remuneration to senior executivesPursuant to Section 6-16a of the Public Limited Compa-nies Act, the board of directors has prepared a statement relating to the determination of salaries and other benefits payable to senior executives. This statement will, in line with the said statutory provision, be laid before the company’s AGM each year.
The company’s senior executive remuneration policy is based primarily on the principle that executive pay should be com-petitive and motivating, in order to attract and retain key personnel with the necessary competence.
The statement refers to the fact that the board of directors shall determine the salary and other benefits payable to the CEO. The salary and benefits payable to other senior executives are determined by the CEO in accordance with the guidelines laid down in the statement. The existing
Corporate governanCe at SalMar aSa64

compensation scheme is divided into three and comprises a fixed salary, a performance-related bonus and a share-based incentive scheme in line with the board’s authorisation.
At the 2019 AGM, the statement on executive remuneration was set forth as a separate case document, which is avail-able from the company’s website www.salmar.no. The AGM voted to approve the establishment of a new share-based incentive scheme for senior executives. In addition, the AGM held an advisory vote on the board’s proposed guidelines for the determination of salary and other benefits to senior executives for the 2019 financial year. The AGM approved separately the item relating to the remuneration of senior executives linked to shares or developments in the price of shares in SalMar or other group companies.
The board’s statement, as well as further details relating to the salary and benefits payable to the CEO and other senior executives, is included in the 2019 annual report.
Deviations from the code of practice: None
13. Information and communicationInvestor relationsCommunication with shareholders, investors and analysts is a high priority for SalMar. The objective is to ensure that the financial markets and shareholders receive correct and timely information, thus providing the soundest possible foundation for a valuation of the company. All market players shall have access to the same information, and all information is published in both Norwegian and English. All notices sent to the stock exchange are made available on the company’s website and at www.newsweb.no.
SalMar seeks to comply with the Oslo Stock Exchange’s inves-tor relations recommendations, which includes a recommen-dation to publish information to investors on companies’ websites, last updated on 1 July 2019. The company has, in line with the Norwegian Code of Practice for Corporate Governance, also adopted an ‘IR Policy’, which is available from the company’s website. The CEO, CFO and Investor Relations Manager are responsible for communications with shareholders in the period between general meetings.
Financial informationThe company holds open investor presentations in associa-tion with the publication of its year-end and interim results. These presentations are open to all, and provide an overview of the Group’s operational and financial performance in the previous quarter, as well as an overview of the general market outlook and company’s own future prospects. These pres-entations are also made available on the company’s website.
The company will continue to publish interim reports in line with the Oslo Stock Exchange’s recommendation. Such interim results will be published no more than 60 days after the close of each quarter.
Quiet periodSalMar will minimise its contacts with analysts, investors and journalists in the final three weeks before publication of its results. During this period, the company will hold no meetings with investors or analysts, and will give no comments to the media or other parties about the Group’s results and future outlook. This is to ensure that all interested parties in the market are treated equally.
Financial calendarEach year SalMar publishes a financial calendar indicating the dates of publication of the Group’s interim reports and annual report, as well as the date of its AGM. The calendar is available from the Group’s website www. salmar.no. It is also distributed as a stock market notice and updated on the Oslo Stock Exchange’s website www.newsweb.no. The calendar is published before 31 December each year.
ArnarlaxIn 2019, the subsidiary Arnarlax was listed on NOTC. Guide-lines have been drawn up with respect to the information disclosed there to ensure that all SalMar shareholders receive the same information (materiality) as shareholders in Arnarlax.
Deviations from the code of practice: None
14. AcquisitionThe board of directors has drawn up guidelines with respect to takeover bids, in line with the Norwegian Code of Practice for Corporate Governance. The guidelines were adopted by the board at a meeting on 29 March 2011, and the board undertakes to act in a professional manner and in accordance with applicable legislation and regulations.
The guidelines shall ensure that the interests of shareholders are safeguarded, and that all shareholders are treated equally. Furthermore, the guidelines shall help ensure that company operations are not unnecessarily disturbed. The board will strive to provide shareholders will sufficient information to enable them to make up their minds with respect to the specific bid.
If a takeover bid has been made, the board will make a state-ment and at the same time assess whether to obtain a valu-ation from an independent expert. The board will obtain an independent valuation if a major shareholder, board member, member of the management team, related party or any col-laborator of such a related party, or anyone who has recently
65

held one or more of the above-mentioned positions, is either the bidder or has a particular interest in the takeover bid.
The board will not seek to prevent any takeover bid, unless the board is of the opinion that such action is justified out of consideration for the company and the company’s share-holders. The board will not exercise any authorisations or adopt other measures for the purpose of preventing the takeover bid. This stipulation may be waived only with the approval of a general meeting of shareholders after a bid has been announced.
Transactions which, in reality, involve the sale of the com-pany’s business shall be laid before a general meeting of shareholders for approval.
Deviations from the code of practice: None
15. AuditorThe company’s auditor is appointed by the AGM and is inde-pendent of SalMar ASA. Each year, the board of directors shall receive written confirmation from the auditor that the requirements with respect to independence and objectivity have been met.
Each year, the auditor shall draw up a plan for the execution of their auditing activities, and the plan shall be made known to the board of directors and the Audit and Risk Committee. The auditor shall meet with the Audit and Risk Committee annually to review and evaluate the company’s internal con-trol activities.
The auditor shall hold at least one meeting each year with the board of directors, at which no representatives of the company’s management is present. The auditor attends the board meeting at which the year-end financial statements are considered. The auditor attends the company’s AGM.
The board shall inform the AGM of the remuneration payable to the auditor, broken down into an auditing and other ser-vices component. The AGM shall approve the auditor’s fees.
The company has drawn up guidelines to regulate the extent to which it is permitted to use the auditor to perform services other than audit-related services.
Deviations from the code of practice: None
66 Corporate governanCe at SalMar aSa

Executive management

GUSTAV WITZØEPresident & CEO
Mr. Witzøe is the co-founder of SalMar ASA. He holds a degree in engineering. After several years as an engineer he co-founded BEWI AS, a company producing styrofoam boxes for the fish farming industry. Mr. Witzøe held the position as managing director of BEWI AS until 1990. Since Mr. Witzøe founded SalMar ASA in 1991 he has gained extensive experience in fish farming and processing.
Born: 1953Shares: Mr Witzøe indirectly owns 93.02% of Kverva AS, which in turn through Kverva Industrier AS owns
52.46% of the shares in SalMar ASA. Mr Witzøe is also a director of Kverva AS.RSU-Rights: None
FRODE ARNTSENDirector, Processing and Sales
Frode Arntsen took the position as Director, Processing and Sales on 1 December 2017. He has a background from the Norwegian Military, and is educated as a lecturer within management. He has worked in the seafood industry since 2000, and has previously held senior/director positions at Lerøy Midnor, HitraMat and Lerøy Midt.
Born: 1970Shares: 1,917RSU-Rights: 5,419
TRINE SÆTHER ROMULDCFO & COO
Trine Sæther Romuld took over as CFO & COO on 1 July 2019. Romuld has extensive experience from a broad range of management positions within seafood, consulting and auditing, from both Norwegian and international companies. In addition, Romuld has significant experience as board member and leader of audit committee for listed companies. Romuld is a state authorized public accountant from Norwegian school of economics (NHH).
Born: 1968Shares: 3,550RSU-Rights: 3,010
ULRIK STEINVIKDirector, Business Support
Steinvik started in the position as Director Business Support in August 2017. Mr. Steinvik holds the title as Norwegian state authorized public accountant. Before Steinvik joined SalMar in 2006 he served with Arthur Andersen Norway and Ernst & Young AS from 1998 to 2006. He graduated from the Norwegian School of Economics and Business Administration in 2002.
Born: 1974Shares: 78,734RSU-Rights: 4,880
ROGER BEKKENCOO Farming
Roger Bekken took over as COO Farming on 4 June 2018. Mr. Bekken has worked in the seafood sector since 1991. He has held a variety of executive positions in the industry. Before joining SalMar in 2014, he was COO of Farming at Norway Royal Salmon (NRS). From 2014 until June 2018, Mr. Bekken was managing director at SalMar Farming AS.
Born: 1967Shares: 12,868RSU-Rights: 5,215
68 ExEcutivE managEmEnt

Shareholder information
69

SalMar's 20 largest shareholders
Name Shareholding 31.12.2019 Shareholding (%)
Kverva Industrier AS 59,436,137 52.46%
Folketrygdfondet 6,555,764 5.79%
State Street Bank and Trust Comp 2,336,703 2.06%
State Street Bank and Trust Comp 1,967,732 1.74%
Lin AS 1,274,620 1.12%
Clearstream Banking S.A. 1,245,941 1.10%
Verdipapirfondet DNB Norge 1,238,495 1.09%
State Street Bank and Trust Comp 1,074,633 0.95%
JPMorgan Chase Bank, N.A., London 958,175 0.85%
AB Sic i Low Vol Equ Portf 893,366 0.79%
JPMorgan Chase Bank, N.A., London 864,254 0.76%
BNP Paribas Securities Services 852,477 0.75%
JPMorgan Chase Bank, N.A., London 837,631 0.74%
Euroclear Bank S.A./N.V. 787,793 0.70%
State Street Bank and Trust Comp 740,945 0.65%
Pictet & Cie (Europe) S.A. 729,497 0.64%
JPMorgan Chase Bank, N.A., London 691,578 0.61%
SIX SIS AG 660,490 0.58%
Handelsbanken Norden 556,900 0.49%
State Street Bank and Trust Comp 556,112 0.49%
Total 20 largest shareholder 84,259,243 74.37%
Other shareholders 29,040,756 25.63%
Total 113,299,999 100.00%
Shareholders 6,237
Total no. of shares 113,299,999
Share price
Janu
ary
Febr
uary
Mar
ch
Apr
il
May
June July
Aug
ust
Sept
embe
r
Oct
ober
Nov
embe
r
Dec
embe
r
600
500
400
300
200
100
0
2018 2019
70 Shareholder information

Share price development
Share price per 01.01.2019 was NOK 428.00 thus valuing SalMar at NOK 48,492 million.
At year-end the share price was NOK 449.30 valuing SalMar at NOK 50,906 million.
Technical information
As at 31 December 2019 SalMar ASA had 113,299,999 shares outstanding, with each share having a face value of NOK 0.25.
As at 31 December 2019 the company had approx. 6,237 shareholders. The company’s VPS number is ISIN NO 001-0310956.
Account operator is Nordea Bank. The company’s ticker on the Oslo Stock Exchange is SALM.
IR-contact in SalMar
Communication with shareholders, investors and analysts is a high priority for SalMar. The objective is to ensure that the financial market and shareholders receive cor-rect and timely information, thus providing the soundest possible foundation for a valuation of the company. All notices sent to the stock exchange are made available on both the company’s website, the Oslo Stock Exchange’s www.newsweb.no site and through news agencies.
If you would like to subscribe to news from SalMar, please send an e-mail to [email protected] so that we can include your e-mail in our news distribution list.
Håkon HusbyHead of Investor Relations
[email protected]+47 936 30 449
Trine Sæther RomuldCFO & COO
[email protected]+47 991 63 632
Financial calendar 2020
The results will be published through the company’s homepage, Oslo Børs News site www.newsweb.no and other newswires at about 06.30 am CET. SalMar holds quarterly presentations open to the public. The presenta-tions will take place at 08.00 am CET at Hotel Continental in Stortingsgaten 24/26 in Oslo, Norway. The annual general meeting will be held at Frøya.
Annual report will be published through the company’s homepage, Oslo Børs News site www.newsweb.no and other newswires. Changes will be communicated.
Results 4th quarter
2019
Annual report 2019
Results 1st quarter
2020
Ordinary general meeting
Results 2nd quarter
2020
Results 3rd quarter
2020
26 February
2020
23 April 2020
19 May
2020
3 June
2020
27 August 2020
12 November
2020
71

Report of the Board of Directors 2019
SalMar can look back on a year of good financial results, despite several unwanted biological incidents contributing to an increase in production costs and therefore lower profits than in 2018. At the same time, the business in Iceland reported sharply improved profitability and operational performance.
72

ATLE EIDEChairman of the Board
Mr. Eide holds the position as senior partner in HitecVision. From 2003 to 2007 he was the CEO of Marine Harvest ASA and one of its predecessors Pan Fish ASA. Mr. Eide’s previous work experience includes the CEO position of a number of listed and unlisted companies. Mr. Eide has also held a number of non-executive board positions in companies such as Fokus Bank, Acta, Cermaq and NRS. Mr. Eide has served as the Board Chair in SalMar ASA since 06.06.2017.
HELGE MOENMember of the Board
Mr. Moen is partner in Kverva and responsible for Kverva Finans AS. Moen has extensive experience from the investment and corporate finance industry. Previous employers include CentraKlaveness AS, First Securities and Midt-Norge Fonds. Moen also holds and has held a number of non-executive board positions in companies such as Pelagia AS, Steinsvik Group AS and Pharmaq AS. Moen has served on the board of SalMar ASA since 06.06.2017.
KJELL A. STOREIDEMember of the Board
Mr. Storeide is a graduate of the Norwegian School of Economics and Business Administration (NHH) in Bergen. From1990 to 2004 he was the CEO and co-owner of Stokke Gruppen AS. Mr. Storeide is chairman of several industrial companies in Norway. Mr. Storeide joined SalMar’s board of directors in February 2008.
MARGRETHE HAUGEMember of the Board
Margrethe Hauge is a partner at H&O Industrier AS, which provides strategic business development and change management services to international companies. Until 2018, Ms Hauge was employed at MRC Global Inc as Regional Managing Director with responsibility for the Nordic region and Germany. She has previously held executive management positions at TTS Group ASA and Kverneland Group ASA, and started her career as a trainee with Hydro Seafood AS. Margrethe Hauge has a master’s degree in business administration from the University of Mannheim in Germany, and has served on the boards of a wide variety of commercial enterprises and voluntary organisations. She has been a member of the board of SalMar ASA since 6 June 2017.
BRIT ELIN SOLENGEmployee representative
Ms. Soleng has worked in SalMar since March 2013 when she joined SalMar in the finance department as an administrative employee. Soleng has previous experience from administrative positions from, among others, Marine Harvest and Nutreco.
JON ERIK ROSVOLLEmployee representative
Mr. Rosvoll has worked in SalMar since 2006 and is currently working as a feed operator at the feed center on Smøla, in addition he has been union representative since 2007.
73

In 2019, SalMar harvested a total of 143,300 tonnes in Norway and 9,800 tonnes in Iceland, and generated gross operating revenues of 12.2 billion. Operational EBIT totalled NOK 3.1 billion in 2019, 11 per cent down on the year before. The Group expects to harvest 152,000 tonnes in Norway and 12,000 tonnes in Iceland in 2020.
Business and strategySalMar ASA is a Norwegian public limited company, whose shares are quoted on the Oslo Stock Exchange under the ticker SALM.
The Group is one of the world’s largest and most efficient producers of Atlantic salmon, and is vertically integrated along the entire value chain from broodfish, roe and smolt to harvesting, processing and sales. At the close of 2019, SalMar had a total of 100 licences for the production of Atlantic salmon in Norway: 68 in Central Norway (Møre & Romsdal and Trøndelag), and 32 in Northern Norway (Troms & Finn-mark). In addition, SalMar has one time-limited demonstration licence in Troms. The Group also has partnership agreements relating to 11 licences.
In 2016, SalMar was the first company in Norway to be awarded so-called development licences by the Norwegian Directorate of Fisheries. The purpose of these licences is to promote increased investment in sustainability, desired changes in production methods, innovation and increased overall value creation in the industry. The threshold for being granted a development licence is extremely high. The fact that the first eight development licences ever awarded by the Directorate went to SalMar’s offshore installation Ocean Farm 1 is therefore an important testament to the Group’s research and development efforts. The first production cycle at Ocean Farm 1 was harvested out early in 2019, with good biological results. Efforts are now well underway with the second production cycle, whose biological performance has so far proved even better.
In February 2019, the Group was awarded a further eight development licences for the Smart Fish Farm concept, though its shareholding in MariCulture AS (51 per cent). Smart Fish Farm is an offshore installation designed to withstand location in considerably more exposed areas of the ocean and to have twice the production capacity of Ocean Farm 1. It features an enclosed central column for the treatment of fish as well as the control and management of the facility. In addition, it will have an advanced system for the transport of fish linked to the surrounding eight production chambers.
In 2019, SalMar’s various investments in offshore fish farming were brought together in a separate subsidiary, SalMar Ocean AS, under the leadership of SalMar’s former CEO Olav-Andreas Ervik. This change reflects SalMar’s ambition to lead the way
with respect to technological advancements and biological production, to help achieve the environmentally sustainable development of the Norwegian aquaculture industry. There will be close cooperation and interaction between the Group’s offshore and traditional inshore fish farming operations, to ensure that mutual transfer of knowledge and experience benefits both parts of the business.
SalMar has a substantial harvesting and processing capac-ity at InnovaMar in Frøya and Vikenco in Aukra. The Group is currently building Northern Norway’s largest and most up-to-date salmon harvesting plant in Senja. The facility will be called InnovaNor, and is expected to generate significant local value creation in the region when it goes into operation in the summer of 2021.
In February 2019, SalMar increased its shareholding in Arnarlax, Iceland’s largest fish farming company. At the close of the year, SalMar held 59.4 per cent of the company’s shares. In addition, SalMar owns 50 per cent of Scottish Sea Farms Ltd (through Norskott Havbruk AS), the UK’s second largest producer of farmed salmon.
SalMar is headquartered in Frøya, Sør-Trøndelag. The Group’s registered address is 7266 Kverva.
Ambition and strategic foundationIt is SalMar’s clearly expressed ambition to be the world’s best aquaculture company, driven by our vision: “Passion for Salmon”.
SalMar wishes to be a driving force for sustainable growth in the global aquaculture industry, and is convinced that the establishment of salmon farming in the open ocean is an important and correct step towards this goal. For SalMar, offshore fish farming represents an important part of the solution to the industry’s challenges relating to both pro-duction areas and biological performance. Not least because conditions offshore largely reflect the natural habitat of Atlantic salmon. In this way, salmon can be farmed on the fish’s own terms, rather than on terms circumscribed by equipment limitations.
SalMar will therefore pursue two separate growth strategies going forward: one for inshore fish farming and one for off-shore fish farming.
Coastal fish farming. The core of SalMar’s strategic position in the area of inshore fish farming will continue to be cost leadership and operational efficiency. This will be achieved by operating a focused value chain, with significant emphasis on upstream activities. Furthermore, Sales and Processing will secure optimal exploitation of the harvested salmon to obtain the best possible price. In addition to cost leadership,
74 RepoRt of the BoaRd of diRectoRs 2019

the company focuses on performance, with the aim of achiev-ing excellence at all levels and in all aspects of production.
SalMar’s inshore fish farming will represent the core of the Group’s production and earnings capacity for many years to come. The company wishes to maintain a leading role in further inshore industrial development. It will also actively seek out attractive M&A opportunities and take part in the opportunities for growth that come along, provided they are on commercially acceptable terms.
Offshore fish farming. to strengthen and concentrate its efforts in the area of offshore fish farming, SalMar has established the subsidiary SalMar Ocean. The company will be a pioneer and lead the development of offshore salmon farming. It has the potential to become the Group’s largest source of growth in the years ahead.
The promising results demonstrated by the first and second generations of salmon produced at the pilot Ocean Farm 1 facility reinforces the Group’s belief in this strategic direction.
Important events in 2019Ocean Farm 1. Harvesting of the first generation of salmon to be raised at Ocean Farm 1, which is located in an area of sea called Frohavet, off the coast of Frøya, was concluded at the start of 2019. The fish achieved good growth and a uniform high quality. Few salmon lice were observed and it was not necessary to apply any delousing treatments. At the same time, costs were in line with the Group’s best-perform-ing traditional sea farms. The transfer of the second genera-tion of fish took place in the autumn of 2019, and preliminary biological performance data shows further improvements compared with the first generation.
In Febaruary 2019, SalMar – through its 51 per cent share-holding in Mariculture AS – was awarded a further eight development licences for the offshore concept Smart Fish Farm. Smart Fish Farm is an offshore installation designed to withstand location in considerably more exposed areas of the ocean and to have twice the production capacity of Ocean Farm 1.
Construction of InnovaNor. In 2019, construction of a new harvesting and processing plant got underway in Senja, northern Norway. The facility is called InnovaNor. This is an important move to strengthen the region as an important industrial engine in the Group’s development and will contribute to local value creation and new employment opportunities. At the same time, InnovaNor will provide the same flexibility and immediate capacity to harvest fish in a biologically sound way as the Group has at its InnovaMar facility in Central Norway. It will also help to optimise logistics.
Construction work is proceeding on schedule, and the facility is expected to go into operation in the summer of 2021.
Investment in smolt production capacity. In the autumn of 2019, SalMar decided to expand its hatchery in Senja. This will create a significant competence centre for RAS technology and smolt production in the region. The project is expected to cost NOK 850 million, with construction work planned to get underway in the second quarter of 2020. The first smolt are expected to be delivered in 2022. SalMar is also considering the construction of a new hatchery in Tjuin, Trøndelag. To this end, it acquired a parcel of land in the area in the fourth quarter 2019. Proximity to the Group’s existing facility at Follafoss will facilitate the build-up of a powerful centre of hatchery competence in this region as well.
New CEO. Gustav Witzøe took over as SalMar’s CEO in Octo-ber 2019. Witzøe is SalMar’s founder and largest shareholder through Kverva Industrier AS. He was previously Director for Strategic Projects at SalMar. Witzøe replaced Olav-Andreas Ervik, who became CEO of the newly established subsidiary SalMar Ocean, which has primary responsibility for the Group’s offshore aquaculture projects.
Increased shareholding in Arnarlax. In February 2019, SalMar increased its shareholding in Arnarlax from 42 per cent to 54 per cent. As a result of this transaction, SalMar made a compulsory offer to purchase the remaining shares in Arnarlax in March 2019. At the close of the year, SalMar’s shareholding in Arnarlax stood at 59.4 per cent.
Events after the balance sheet dateTraffic lights. On 4 February 2020, the Norwegian Minis-try of Trade, Industry and Fisheries announced that it had decided which colours to give the 13 different salmon farm-ing zones under its “traffic lights scheme”. Nine zones were given a green light, two were given an amber light and two zones received a red light. SalMar has licences in the green-light zones PO6–7 and PO11–13. The Group also has licences in the amber-light zone PO10 and the red-light zone PO5. Green-light zones qualified for an overall 6 per cent increase in capacity, of which 1 per cent was allocated at a fixed price of NOK 156,000 per tonne at the end of February 2020. The remaining 5 per cent will be sold at auction. This is expected to take place before the summer of 2020. At the end of February 2020, SalMar purchased its share of the awarded growth in capacity at the designated fixed price, and the company is prepared to participate in the auction as long at it takes place on commercially acceptable terms.
Change in SalMar’s board of directors. On 7 February 2020, SalMar announced that Trine Danielsen had notified the Nomination Committee that she was resigning from SalMar ASA’s board of directors. Ms Danielsen resigned her seat on
75

the board because she had been appointed State Secretary at the Ministry of Trade, Industry and Fisheries with immediate effect. Her replacement will be elected at the company’s next AGM in June 2020.
Important competence to SalMar Ocean. On 25 February 2020, SalMar announced that Torger Rød (45) had joined the board of directors of SalMar Ocean. Rød has an MEng from the Norwegian University of Science and Technology (NTNU) and is employed as SVP Project Development at Equinor.
SalMar halts payment of a dividend for 2019. On 17 March 2020, SalMar’s board of directors decided that the NOK 21 per share dividend for 2019 previously announced in connection with the presentation of the quarterly results in February would not be paid out. The decision was made after a thorough assessment by the company’s board and management, in light of the uncertainty attaching to the spread of the COVID-19 pandemic and the consequences it could have for the entire value chain and on a number of local communities along the Norwegian coast.
Market conditionsSupply, exports and price of Atlantic salmonThe global supply of Atlantic salmon increased for the third year in succession, ending 7 per cent up in 2019. The world’s two leading producer countries, Norway and Chile, increased their output by 6 per cent and 5 per cent, respectively.
Supply of Atlantic salmon in 1,000 tonnes WFE 2018 2019 Change
Norway 1,253 1,333 6%
Chile 660 690 5%
UK 154 184 20%
North America 165 164 -1%
Faeroes 72 87 21%
Oher countries 101 125 24%
Total, global supply 2,405 2,583 7%
Norway exported around 1,280,000 tonnes round weight of Atlantic salmon in 2019, up 6 per cent on 2018. The value of Norway’s salmon exports rose by 7 per cent, which reflects the fact that the average price of Atlantic salmon was much the same in 2019 as the year before.
Norway exported 74 per cent of its volume to the EU in 2019. Countries with a significant processing industry, such as Poland and Denmark, increased their imports of Norwegian salmon (Poland up by 6 per cent and Denmark up by 15 per cent). The main Asian markets (Vietnam/China/Hong Kong) also grew strongly (up by 29 per cent). At the same time, France and the UK reduced their imports (France down by 10 per cent and the UK down by 6 per cent).
SalMar sold directly to 56 different countries in 2019. Europe was the most important destination, with Poland, Sweden and the Netherlands as the largest single markets. The sec-ond most important destination was Asia, with Japan, South Korea and Taiwan as the largest single markets. Since sales to Russia were discontinued in 2014, North America has been the third largest export destination.
The price of Atlantic salmon (NASDAQ) remained relatively stable at a consistently high level in the first half-year. The price fell heavily through the autumn, but bounced back sharply in October and rose steadily through to the new year. The year’s lowest price was recorded in week 40 at NOK 40.50 per kg, while the highest price came in week 52 at NOK 77.82 per kg. The average price of salmon (NASDAQ Salmon Index) for 2019 came to NOK 57.96 per kg, compared with NOK 59.97 per kg the year before.
From the close of 2018 until the close of 2019, the Nor-wegian currency (NOK) weakened by 1 per cent against the USD and by 4 per cent against the GBP. Against the EUR, the NOK strengthened by 1 per cent. Any weakening of the NOK against the respective trading currencies could lead to an increase in salmon prices measured in NOK and vice versa.
Framework conditionsNorwaySalMar’s 100 licences are located in the regions Central Nor-way and Northern Norway.
In 2017, the Norwegian government introduced a new sys-tem for regulating the growth of the aquaculture industry in order to safeguard its environmental sustainability and stability. Under this system, growth is controlled by means of variable growth cap, environmental indicators and division into production zones. The system is called the “traffic light system”, since production zones are designated as being green, amber or red. Growth is permitted in green zones, growth is put on hold in amber zones, while production in red zones must be halted or reduced in scale. Growth is assessed every other year, and capacity adjusted by 6 per cent. Growth is divided between new licences and increased capacity at existing licences. In Norway, there are currently 13 production zones. In February 2020, the Ministry of Trade, Industry and Fisheries announced that nine of these were designated green, two amber and two red. See the section “Events after the balance sheet date” for further details.
In September 2018, the Norwegian government appointed a commission to assess how taxation of the aquaculture industry should be framed. The commission published its report (NOU 2019: 18) in November 2019. A majority of the commission’s members proposed the introduction of an economic rent tax amounting to 40 per cent of the food producers’ profits, in addition to corporation tax at the rate of
76 RepoRt of the BoaRd of diRectoRs 2019

22 per cent. If the majority proposal were adopted, it would have wide-ranging consequences for the Norwegian salmon farming industry, suppliers and other industrial ripple effects that this sector causes in Norway. Even though Norway’s inshore coastal waters are well suited to the production of Atlantic salmon, competition from other countries is increas-ing sharply. In many countries, the amount being invested in inshore and onshore fish farming has reached unparalleled levels, and a significant proportion of the salmon output that Norway used to be alone in producing, now takes place in other countries’ national waters. The use of new aquaculture technology will enable salmon to be produced within what are currently large export markets for Norwegian producers. This applies to the USA, for example, where billions are being invested in onshore fish farming facilities.
Against this backdrop, therefore, there can be no doubt that jobs and investments in salmon production will to a greater extent end up in countries other than Norway, and in other sectors, if we impose additional taxation on Norwegian food producers that compete in world markets. Norway’s aquacul-ture sector is one of the largest contributors to value creation and tax revenues along the Norwegian coast. In 2018, it contributed approx. NOK 4 billion to coastal municipalities and central government through the Aquaculture Fund in consideration for new capacity growth. Fish farming licences in Norway have largely been acquired at the prevailing market price, to a large extend through their purchase and sale in the market, as well as through payments to the public authorities. In both 2018 and 2019, SalMar companies and employees contributed over NOK 1.1 billion in direct and indirect taxes to central and municipal authorities. SalMar wishes to remain a major contributor to society, as a taxpayer and as an entre-preneur that creates employment opportunities up and down the Norwegian coast.
SalMar’s board of directors is pleased that members of the Norwegian Confederation of Trade Unions (LO), Confeder-ation of Norwegian Enterprise (NHO) and the Norwegian Association of Local and Regional Authorities (KS) have joined forces to oppose the proposal to introduce an economic rent tax. Statements by the Norwegian Labour Party in February 2020 also indicate that there is a parliamentary majority against an economic rent tax in the shape presented by the commission. SalMar’s board of directors hopes that this can form the basis of a broad majority, such that the aquaculture industry can be assured of stable, acceptable and predict-able framework conditions, in the same way as the rest of Norway’s business community.
IcelandTo date, framework conditions for salmon farming in Iceland have been characterised by unpredictability. Politicians and various special interest organisations continue to debate how much the sector should be allowed to grow and which
inshore sites it should be given access to. The Icelandic authorities have also introduced a special tax on salmon farming, whose level is linked to the price of salmon. Arnarlax is engaged in an active and constructive dialogue with the authorities with respect to these issues, primarily through its membership of the Icelandic fisheries organisation SFS. The company believes there is a positive mood with respect to giving salmon production in Iceland room to grow.
ScotlandFramework conditions for salmon farming in Scotland have remained relatively constant over several years. The growing influence of special interests (NGOs, organised anglers, etc) has led to more challenging regulations than in Norway, which has in turn contributed to a higher level of costs (lower efficiency, smaller economies of scale). The Scottish author-ities have expressed the wish that the aquaculture sector will grow from its present output level of around 170,000 tonnes. However, the ongoing Brexit negotiations create uncertainty about customs duties and tariffs for Scottish salmon in the European market.
Access to marketsChina still accounts for only a small portion of the market for Norwegian salmon. This is largely due to the imposition in 2015 of restrictions on the importation of Norwegian salmon from selected regions. Over time, active efforts have been made to improve access to the Chinese market. In May 2019, China lifted its restrictions on the Norwegian counties to which they had applied. This move also encompasses SalMar’s harvesting plant InnovaMar in Frøya.
Russia was previously an important market for SalMar and other Norwegian salmon producers. However, trade restric-tions introduced in the wake of the Crimean conflict in 2014 mean that the Russian market remains closed to Norwegian fish farmers.
See the “Outlook” section for comments relating to the spread of COVID-19.
Financial performanceIn the first quarter of 2019, SalMar increased its shareholding in Arnarlax to over 50 per cent, with effect for accounting purposes from 1 February 2019. This resulted in Arnarlax being reported as an associate in January, and then being consolidated into the Group’s financial statements from 1 February 2019. Comparable figures for 2018 have not been restated accordingly.
With effect from 1 January 2019, a new accounting standard for leasing agreements came into effect. IFRS 16 Leases has been implemented in SalMar’s financial statements, and has had a material impact on certain items in profit and loss and
77
in the balance sheet. Comparable figures for 2018 have not been restated accordingly. See the notes to the financial statements for further details.
Going concernThe annual financial statements for 2019 have been pre-pared on the assumption that SalMar is a going concern pursuant to section 3-3a of the Norwegian Accounting Act. With reference to the Group’s results and financial position, as well as forecasts for the years ahead, the conditions required for continuation as a going concern are hereby confirmed to exist. In the opinion of the board of directors, the Group’s financial position is good.
Consolidated income statementThe Group generated consolidated operating revenues of NOK 12,237.6 million in 2019, compared with NOK 11,342.6 million in 2018. This represents a year-on-year increase of 8 per cent.
In 2019, SalMar harvested 153,100 tonnes overall; 143,300 tonnes in Norway and 9,800 tonnes in Iceland. In addition, Norskott Havbruk harvested 25,900 tonnes, of which Sal-Mar’s share comes to 13,000 tonnes (50 per cent).
The average price of salmon (NASDAQ) in 2019 came to NOK 57.96 per kg, down 3 per cent from the average in 2018, which came to NOK 59.97 per kg. As usual, the price of salmon fluctuated through the year. The price peaked at NOK 77.82 per kg in week 52 and had its lowest recorded price, NOK 40.50 per kg, in week 40.
Around 20 per cent of SalMar’s total volume harvested in 2019 was sold under fixed-price contracts. The terms of these contracts vary, but normally last for more than 12 months. Overall, the price achieved under these fixed-price contracts was higher than the spot price (NASDAQ) for the year as a whole. This was materially better than the price achievement in 2018, when the contract portfolio reduced average price achievement. The volume sent for secondary processing in 2019 was at practically the same level as in 2018, approx. 59,000 tonnes in total.
After several years in succession of steadily improving bio-logical performance, 2019 was a more challenging year. Weak biological performance at several sites, as well as pre-mature harvesting due to intense salmon lice pressure and algal blooms led to higher production costs. Fish were har-vested earlier than planned at a lower average weight, which affected both costs and price achievement. Fish Farming Northern Norway had an unusually challenging year. How-ever, based on significantly improved results in the fourth quarter and an ongoing improvement programme in the seg-ment, lower production costs are expected for both Fish Farming Northern Norway and the Group as a whole in 2020.
The SalMar Group had payroll costs of NOK 1,202.5 million in 2019, compared with NOK 1,040.4 million in 2018. The number of full-time equivalents (FTEs) in the Group rose by 15 per cent in 2019, from 1,479 FTEs at the close of 2018 to 1,703 FTEs at the close of 2019. This is largely attributable to the consolidation of Arnarlax in the financial statements.
SalMar’s ongoing investment programme has increased the value of the Group’s operating assets over time. Together with the implementation of IFRS 16 Leases and the consol-idation of Arnarlax, this explains the higher level of depreci-ation in 2019 compared with 2018.
The SalMar Group made an Operational EBIT of NOK 3,067.6 million in 2019, compared with NOK 3,460.8 million in 2018. The decrease is, as described above, largely attributable to slightly lower salmon prices and higher production costs.
Operational EBIT is SalMar’s most important measure of its performance under IFRS, since it shows the results of underlying operations during the period. Specific items not associated with underlying operations are presented on separate lines in the consolidated financial statements.
Fair value adjustments reduced profits by NOK 33.0 million in 2019, while they boosted profits by NOK 845.8 million in 2018. Fair value adjustments comprise changes in the value of the biomass, unrealised effects of forward currency contracts relating to future contract deliveries and financial salmon price derivatives (Fish Pool), as well as provisions for contract-related losses. The change in the fair value of the biomass reduced profits by NOK 151.6 million. This is largely attributable to lower price expectations at the close of 2019 than at its start. Changes in provisions for contract-related losses, the fair value of financial salmon derivatives and the unrealised effect of forward currency contracts boosted profits by a total of NOK 118.6 million.
SalMar made an operating profit of NOK 3,034.6 million in 2019, down from NOK 4,306.6 million in 2018.
SalMar’s associates, ie companies over which SalMar’s share-holding gives it a considerable influence, contributed less in 2019. This is largely attributable to a weaker performance by Norskott Havbruk. SalMar’s share of the profit from these investments totalled NOK 118.7 million, the bulk of which derived from Norskott Havbruk. The corresponding figure for 2018 was NOK 252.9 million.
Net financial items in 2019 totalled NOK 5.1 million, com-pared with NOK -107.0 million in 2018. The change is largely due to the gain recognised in connection with Arnarlax’s transition from associate to subsidiary. SalMar’s interest expenses for 2019 totalled NOK 170.2 million, an increase of NOK 116.1 million from 2018. This is largely attributable
78 RepoRt of the BoaRd of diRectoRs 2019

to the implementation of IFRS 16 Leases and the consoli-dation of Arnarlax.
SalMar’s profit before tax in 2019 totalled NOK 3,158.4 mil-lion, down from NOK 4,452.6 million in 2018. A tax expense of NOK 613.9 million has been calculated for 2019. This is NOK 259.4 million lower than in 2018.
SalMar’s net profit for the year totalled NOK 2,544.5 million in 2019, compared with NOK 3,579.2 million in 2018.
Consolidated cash flowSalMar achieved a positive cash flow from operating activities of NOK 3,029.5 million in 2019, compared with NOK 2,781.6 million in 2018. Through 2019, SalMar’s working capital rose by NOK 50.4 million, the bulk of which relates to increased biomass. In 2018, working capital rose by NOK 531.7 million. In addition, SalMar paid NOK 690.7 million in corporation tax in 2019, which is NOK 17.9 million more than in 2018.
Net expenditures with respect to investing activities totalled NOK 1,317.4 million in the period, compared with net expendi-tures of NOK 833.8 million in 2018. The investment pro-gramme relating to the expansion and maintenance of the Group’s hatcheries has proceeded as planned, and the Group invested a total of NOK 287.8 million in 2019. This includes expansion of the hatchery at Follafoss, purchase of land near the hatchery at Kjørsvikbugen, the start-up of construction of a closed-containment installation that is due to go into operation in the autumn of 2020, and the start-up of work to design and engineer the expansion of the hatchery in Senja. NOK 390 million was invested in the Sales and Pro-cessing segment. This includes maintenance investments, the construction of a new harvesting and processing plant in Northern Norway, called InnovaNor, and the expansion of Vikenco. Within the area of inshore and offshore farming, the company has invested NOK 553.8 million. This is largely made up of equipment maintenance, but also includes modi-fications to Ocean Farm 1 as well as design and engineering work on the new Smart Fish Farm installation. Investments in the acquisition of a larger shareholding in Arnarlax, as well as maintenance investments in Iceland, accounted for NOK 288.6 million. Other investments, including the acquisition of the sales company YuFish in Singapore, accounted for NOK 52.0 million. SalMar received dividends totalling NOK 254.8 million from Norskott Havbruk and YuFish in 2019.
Net cash flow from financing activities totalled NOK 1,720.3 million in 2019, compared with NOK 1,890.2 million in 2018. In 2019, SalMar paid its shareholders a dividend totalling NOK 2,617.2 million. The Group renewed its instalment loan in the summer of 2019, increasing it to NOK 1,000 million. As a result of the consolidation of Arnarlax, debt liabilities have also been included. See Note 18 to the consolidated financial statements for further details. Net interest paid,
excluding interest relating to leasing liabilities, totalled NOK 104.9 million, which is on a par with the year before.
In total, this gave SalMar a negative cash flow for 2019 of NOK 8.2 million, which has reduced the Group’s holding of cash and cash equivalents to NOK 231.0 million at the close of the year. Unused drawing rights at the close of the year totalled NOK 2,771.4 million.
Consolidated balance sheetAs at 31 December 2019, SalMar’s total balance sheet came to NOK 17,986.1 million, an increase of NOK 2,850.5 million since the close of 2018.
The book value of the Group’s intangible assets rose by NOK 1,338.0 million in 2019. This is largely attributable to the increase associated with the consolidation of Arnarlax. In all, the book value of the Group’s consolidated intangible assets totalled NOK 4,741.9 million at the close of 2019. The book value of fish farming licences, patents, etc, accounts for NOK 4,295.5 million of this amount.
The book value of property, plant and equipment totalled NOK 4,939.6 million at the close of 2019, this includes right-to-use assets of NOK 569.7 million, up from NOK 3,591.5 million in 2018.
The Group’s non-current financial assets totalled NOK 814.2 million at the close of 2019. This is NOK 401.3 million less than at the same point in 2018 and is due primarily to the fact that Arnarlax has ceased to be recognised as an asso-ciate and is now included in the Group’s consolidated finan-cial statements.
The Group’s biological assets were valued at NOK 5,720.8 million at the close of the year. This is NOK 415.2 million more than at the close of 2018. Measured in tonnes, stocks were 12 per cent higher at the close of 2019 than at the start of the year. This is largely attributable to the consolidation of Arnarlax. The cost of producing the biomass increased by NOK 496.9 million or 15 per cent. Total production costs came to NOK 3,766.8 million. Fair value adjustment of the biomass at the close of the year came to NOK 1,954.0 million, which is NOK 81.7 million lower than at the start of the year.
Trade receivables rose from NOK 630.1 million at the start of the year to NOK 739.4 million at the close. At year-end, a provision of NOK 21.1 million had been made to cover uncertain claims, including SalMar’s own risk with respect to credit insurance.
At the close of 2019, the Group’s equity totalled NOK 9,740.1 million up from NOK 9,139.8 million at the close of 2018. The equity ratio has decreased from 60.4 per cent at the close of 2018 to 54.2 per cent at the close of 2019.
79

Net interest-bearing debt (interest-bearing debt less cash and cash equivalents) totalled NOK 2,902.1 million at the close of the year, up from NOK 1,527.7 million at the close of 2018. In June 2019, SalMar renegotiated its instalment loan facility, which was due to mature in that month. As a result of SalMar’s increased shareholding in Arnarlax, that company’s liabilities have been consolidated into the Group’s financial statements. See Note 18 for further details.
Based on its taxable profit for 2019, the Group expects to pay NOK 588.5 million in corporation tax.
The NOK 2,850.5 million increase in the value of the Group’s assets in 2019 can be attributed to an increase in inter-est-bearing debt of NOK 1,709.6 million, an increase in leas-ing liabilities of NOK 285.8 million, an increase in interest-free liabilities of NOK 254.8 million, as well as an increase in equity of NOK 600.3 million. The Group’s solvency and financial position remain strong at the close of 2019.
Reporting segmentsFish Farming Central Norway
NOK million 2019 2018
Operating revenue 5,670.4 5,962.0
Operational EBIT 2,164.6 2,533.3
Per kg gutted weight
Operational EBIT (NOK) 22.71 25.31
Fish Farming Central Norway, the Group’s largest fish farming segment, posted good financial results in 2019, despite a variable biological performance. The segment’s operating revenues decreased by 5 per cent from 2018 to 2019, while Operational EBIT decreased by 15 per cent.
Operational EBIT per kg gutted weight fell by 10 per cent in the same period, which can largely be explained by increased production costs. All the salmon produced by SalMar is sold internally at prices equivalent to market prices (NASDAQ). On average, the segment experienced a decrease in the price achieved for its harvested salmon of NOK 0.10 per kg. The production cost of the harvested biomass has, on average, risen by NOK 2.50 per kg compared with 2018.
Operationally, 2019 was a mixed year, with periodic chal-lenges related to high levels of lice towards the end of the year. As a result, it was decided to harvest fish earlier than planned to reduce the biological risk. The lower average weight of the fish harvested resulted in a slightly lower price achieved and higher costs. Fish transferred to sea farms
in 2018 accounted for the bulk of the harvested volume through 2019.
Fish Farming Central Norway harvested a total of 95,300 tonnes in 2019, compared with 100,000 tonnes in 2018. This represents a decrease of 5 per cent. At the close of the year, the segment had 3 per cent more sea-going biomass than at the start of 2019. SalMar expects this segment to harvest 103,000 tonnes in 2020. The increase com-pared with 2019 is due primarily to volumes deriving from Ocean Farm 1.
Fish Farming Northern Norway
NOK million 2019 2018
Operating revenue 2,788.7 2,645.0
Operational EBIT 931.4 1,153.9
Per kg gutted weight
Operational EBIT (NOK) 19.41 27.24
Fish Farming Northern Norway had a rather disappointing year, both financially and operationally. A higher harvested volume contributed to higher operating revenues, but Oper-ational EBIT fell by 19 per cent compared with 2018.
Operational EBIT per kg gutted weight came to NOK 19.4 in 2019, down from NOK 27.2 in 2018. The reduction is attributable to a NOK 3.5 increase in production costs per kg gutted weight and a NOK 4.5 decrease in price achieve-ment. The segment was negatively affected by biological challenges relating to disease. In response, it was decided in the third quarter to harvest fish earlier than planned at a low average weight. This resulted in high costs and low price achievement. In the fourth quarter, biological performance was showing clear signs of steady improvement, which bodes well for 2020.
Fish Farming Northern Norway harvested 48,000 tonnes in 2019, compared with 42,400 tonnes in 2018. At the close of the year, the segment had 6 per cent less sea-going biomass than at the start of 2019. SalMar expects the segment to harvest 49,000 tonnes in 2020.
80 RepoRt of the BoaRd of diRectoRs 2019

Arnarlax
NOK million 20191 2018
Operating revenue 627 400
Operational EBIT 100 -79
Per kg gutted weight
Operational EBIT (NOK) 10.21 -11.82
Arnarlax engages in the farming of salmon in Iceland. In the first quarter 2019, SalMar increased its shareholding in Arnarlax to over 50 per cent, with effect for accounting purposes from 1 February 2019. As a result, Arnarlax was reported as an associate in January and was then consoli-dated and treated as a separate business segment from 1 February 2019.
SalMar controlled 59 per cent of the business at the close of 2019. Arnarlax is a young company that is leading the development of a sustainable aquaculture industry in Ice-land. While 2018 was a challenging year for the company, with difficulties caused by disease, 2019 saw substantial performance improvements across the board.
Revenues rose from NOK 400 million in 2018 to NOK 627 million in 2019. The company posted an Operational EBIT of NOK 100 million, compared with NOK -79 million in 2018.
The company harvested a total of 9,800 tonnes in 2019, up from 6,700 tonnes the year before. For 2020, Arnarlax is expected to harvest around 12,000 tonnes of salmon.
Operational EBIT per kg gutted weight came to NOK 10.21 in 2019, compared with NOK -11.82 in 2018. Through the year, Arnarlax harvested primarily fish transferred to sea farms in 2017. The significantly improved biological performance of this generation compared with previous years resulted in lower production costs. Combined with better capacity utili-sation at the harvesting plant, this has boosted profitability. At the same time, there is still room for improvement through-out the value chain, particularly in the area of logistics.
Bjørn Hembre was appointed as Arnarlax’s new CEO with effect from January 2019. Hembre has previously worked at SalMar and brings a great deal of expertise from several senior positions within the SalMar Group.
Sales and Processing
NOK million 2019 2018
Operating revenues 11,698.6 11,432.0
Operational EBIT 124.4 -12.8
1 The 2019 result applies from February 2019, from when Arnarlax was consolidated into the SalMar Group’s financial statements. The result stated for 2018 is not consolidated.
This segment is responsible for placing and selling the entire Group’s harvested volume in Norway, which it buys from SalMar’s in-house producers at the market price. As a result of better price achievement, operating revenues rose from NOK 11,432.0 million in 2018 to NOK 11,698.6 million in 2019. Operational EBIT totalled NOK 124.4 million in 2019, compared with NOK -12.8 million in 2018. The increase is attributable largely to better price achievement and a posi-tive contribution from fixed-price contracts.
In 2019, around 20 per cent of the volume harvested was sold under fixed-price contracts. Overall, these fixed-price contracts have resulted in a higher price achievement than the spot price (NASDAQ) for the year as a whole. This is an improvement on 2018, when contracts were in line with the average price achievement. Fish disposed of in the spot market have provided improved and satisfactory margins.
Around 102,000 tonnes of fish were harvested at Inno-vaMar in 2019, compared with 140,000 tonnes in 2018. Operations at InnovaMar depend on the biological production cycle, and substantial fluctuations in the volume harvested from one period to the next have made it difficult to achieve cost-optimal output from an industrial perspective. However, the plant’s flexibility has created added value for SalMar as a whole, since it enables production at the sea farms to be optimised.
From a strategic point of view, SalMar believes it is correct to process a relatively large portion of the raw material in Nor-way. It increases the quality of the product that is sold to the customer, enables by-products to be dealt with efficiently, saves on freight charges and boosts local value creation.
In 2019, construction of a new harvesting and processing plant got underway in Senja, Northern Norway. The plant, dubbed InnovaNor, is on schedule and is expected to go into operation in the summer of 2021.
AssociatesNorskott HavbrukThrough its wholly owned subsidiary Scottish Sea Farms, Norskott Havbruk engages in the farming of salmon in main-land Scotland, Orkney and Shetland. SalMar controls 50 per cent of the business.
2019 was a mixed year for Norskott Havbruk. The company generated gross operating revenues of NOK 1,834.4 million in 2019, compared with NOK 2,057.0 million in 2018.
Biological challenges in 2019 led to the early harvesting of fish, which reduced their average weight and had a nega-tive impact on both costs and price achieved. Operational
81
EBIT for the year came to NOK 291.9 million, compared with NOK 660.8 million in 2018. The company harvested 25,900 tonnes in 2019, down from 27,500 tonnes in 2018.
Operational EBIT per kg gutted weight came to NOK 11.3 in 2019, a decrease of NOK 12.8 per kg from 2018. The decrease is largely attributable to higher production costs. Norskott Havbruk expects to harvest some 26,000 tonnes in 2020.
Norskott Havbruk is recognised as an associate, with SalMar’s 50 per cent share of the company’s profit or loss after tax and fair value adjustment of the biomass being recognised as financial income. SalMar’s share of the company’s profit after tax came to NOK 106.5 million in 2019, compared with NOK 265.0 million in 2018.
The parent company’s financial statements and allocation of the profit for the yearThe parent company, SalMar ASA, is a shareholding and administrative entity. Group management and administra-tive resources are employed by this company. In 2019, it employed a total of 33.7 full-time equivalents.
SalMar ASA made a net profit for the year of NOK 2,239.1 million in 2019, compared with NOK 2,747.6 million in 2018. The bulk of its revenues derive from investments in subsid-iaries and associates. 2019 was a satisfactory year for the company’s subsidiaries, with a total of NOK 2,559.2 million in dividends/group contributions being recognised. In addition, the company recognised NOK 252.9 million in dividends from its investment in the associate Norskott Havbruk. SalMar ASA manages the Group’s primary financing arrangements and recognised NOK 140.4 million in interest income on loans to subsidiaries. Interest expenses amounting to NOK 66.4 million were incurred in association with the Group’s financing arrangements.
SalMar ASA had assets worth a total NOK 8,886.4 million in its balance sheet at the close of 2019. Of this amount, non-current financial assets accounted for NOK 6,117.4 million, NOK 3,209.1 million of which comprised loans to sub-sidiaries. Current receivables totalled NOK 2,748.9 million and largely comprise receivables of dividend/group contributions from subsidiaries. The company had holdings of cash and cash equivalents of NOK 9.8 million at the close of 2019. Equity as at 31 December 2019 totalled NOK 4,844.4 million, which corresponds to an equity ratio of 55 per cent. Non-current liabilities totalled NOK 2,281.2 million and comprised inter-est-bearing debt. Current liabilities totalled NOK 1,760.9 million, of which tax payable accounted for NOK 558.8 million, while current payables to group companies accounted for NOK 863.7 million.
The board of directors is proposing payment of a dividend of NOK 0.00 per share for the 2019 financial year. The board proposes the following allocation of the year’s profit:
Dividend provision NOK 0 million
Transferred to other equity NOK 2,239.1 million
Total NOK 2,239.1 million
At the close of the year, the company had a distributable reserve of NOK 4,816.1 million.
Risks and risk managementRisk management is a key function of the management team. The Group has systems and routines in place to monitor important risk factors in all business areas, and places particu-lar emphasis on the control and follow up of production facil-ities in accordance with quality and certification standards.
It is the CEO’s responsibility to ensure that the Group oper-ates in compliance with all relevant legislation and operating guidelines for group entities. Follow-up and control of risk factors, as well as compliance with the Group’s values and code of conduct, is carried out in the line organisation as part of day-to-day operations.
See the section “Outlook” for comments on the spread of the COVID-19 pandemic and the notes to the financial state-ments for details of legal action being taken against the company in the EU, USA and Canada.
Operational riskSalMar’s most important operational risk relates to the bio-logical development of its fish stocks, at both its hatcheries and sea farms. Even though SalMar develops and implements risk-reducing measures, the nature of the industry is such that the inherent biological risk will always be present. In recent years, the aquaculture industry has faced challenges associated with the increasingly widespread presence of salmon lice and greater prevalence of medicinally resistant lice. This has forced SalMar, along with the rest of the indus-try, to change the methods used and intensify its efforts to deal with the lice situation.
SalMar takes a holistic, strategic approach to biological risk, including lice, which encompasses preventive measures and activities designed to limit damage to its stocks. SalMar continuously makes operational assessments to protect the welfare of its fish.
Access to suitable production locations is a crucial preventive measure. For SalMar, it is important that production take place in areas that have the capacity needed to sustain-ably produce the volumes involved. SalMar’s offshore fish
82 RepoRt of the BoaRd of diRectoRs 2019

farming strategy, managed via SalMar Ocean and opera-tionalised through the Ocean Farm and Smart Fish Farm projects, could lead to new and better locations being used. Selective breeding and the genetic development of a more robust salmon is another important preventive measure to reduce biological risk. Measures to reduce the length of time the fish spend at sea through the transfer of larger smolt and production in closed-containment facilities are strategic focus areas for SalMar.
Our operating procedures are designed to reduce biological risk. With respect to the lice situation, the use of self-pro-duced cleaner fish for biological delousing is an extremely important measure. SalMar has invested heavily in a dedi-cated cleaner fish production facility at Langstein in Trond-heimsfjord. Furthermore, substantial investments have been made in measures to prevent salmon lice entering the net-pens in the form of lice skirts. Vaccination against various fish diseases is also a key aspect of our operating procedures.
Over time, SalMar has built up an effective response capability to deal with biological challenges. Our harvesting capacity at InnovaMar enables us to respond effectively. This will be reinforced with the realisation of the InnovaNor project. Furthermore, SalMar has good access to wellboat capacity. In the past couple of years, a substantial delousing capacity has been built up in the form of mechanical delousing equipment that also collects the lice to prevent reproduction.
It will always be necessary to use medication in connection with any form of biological production. However, such medi-cation must be applied prudently to prevent the development of resistance.
Financial riskThe follow-up of internal controls associated with financial reporting is carried out through management’s day-to-day supervision, the process owners’ follow-up and monitoring by the board’s Audit Committee. Non-conformances and improvement areas are followed up and remedial measures implemented. Financial risk is managed by a central unit at head office, and financial hedging instruments are employed where they are considered appropriate.
Foreign exchange riskThe bulk of the Group’s output is sold internationally, with accounts settled largely in EUR, USD, GBP and JPY. Changes in exchange rates therefore represent both a direct and indirect financial risk for the Group. Sales in foreign currencies are hedged on the transaction date, while contract sales are hedged when the contract is entered into. The company uses forward contracts as hedging instruments. Foreign exchange exposure linked to the Group’s costs is, however, more limited, since input factors and salaries are paid largely in NOK. All interest-bearing debt is, moreover, in NOK. Use of
forward currency contracts is described in Note 11 to the financial statements.
Interest rate riskThe borrowing portfolio is currently at floating interest rates, which means that the Group is affected by changes in interest rates.
Price riskSalMar’s entire business is related to salmon, and is therefore directly and indirectly affected by developments in salmon prices. The Group’s profitability and cash flows are strongly correlated with movements in the price of salmon. Historically, salmon prices have been highly volatile seen in an annual, quarterly and monthly perspective. In 2019, the spot price of Atlantic salmon fluctuated between NOK 77.82 and NOK 40.50 per kg, measured weekly.
The global salmon market is largely a fresh-fish market, where most of the fish harvested is sold immediately to processing companies or directly to the consumer. For several years, growth in demand has been relatively stable, while growth in supply has varied more substantially from year to year. In addition to planned output volumes defined by the number of smolt transferred to sea farms, supply is also affected by a number of external factors. Fluctuations in sea tempera-tures, the spread of salmon lice and outbreaks of disease are all factors which, directly or indirectly, affect fish growth and thus supply. As a consequence, relatively substantial variations in supply may occur within short periods of time. With relatively stable demand, this can result in considerable price instability.
SalMar sells a portion of its output through fixed-price con-tracts. The Group has drawn up guidelines for such contracts to limit exposure to salmon price volatility. It is the Sales and Processing segment which sells the entire Group’s harvested volume. The impact of the Group’s fixed-price contracts is therefore recognised in this segment’s financial statements. Approximately 20 per cent of the Group’s volume was sold under fixed-price contracts in 2019.
Credit riskThe risk of a counterparty not having the financial resources to meet its obligations has, historically, been considered low, and SalMar’s losses resulting from bad debts have been small. The Group has guidelines to ensure that sales are made only to customers who have not previously had material payment problems, and that outstanding sums do not exceed defined credit limits. Credit insurance is taken out whenever coun-terparty risk is not deemed to be low.
The Group does not have any significant credit risk associated with an individual counterparty or counterparties which may
83
be considered a group due to similarities in the credit risk they represent.
Liquidity riskLiquidity risk is the risk that the Group will not be able to meet its financial obligations as they fall due.
SalMar’s objective is to have sufficient cash, cash equiva-lents or short and medium-term credit facilities to meet its day-to-day funding requirement. The Group prepares rolling cash-flow forecasts to ensure that it has sufficient liquidity at all times. Furthermore, a flexible financing structure is main-tained through established credit lines. Unused credit facili-ties are described in the notes to the financial statements.
The Group’s equity ratio, its prospects for future profits and current credit facilities mean that the Group’s liquidity risk is considered to be low.
R&DFor many years, SalMar has engaged in active partnerships with various R&D environments, including partnerships relating to the operation of R&D licences. The scale and professionalism of important development activities has increased and continues to do so. For SalMar it is important to be a professional, but demanding partner, such that the outcomes of ongoing trials are as relevant as possible, while plans and protocols reflect the practicalities of commercial fish farming. SalMar has allocated personnel specifically to organising and assisting R&D environments involved in such collaborative efforts, while production staff are becoming increasingly experienced with regard to the best way to safeguard research results in a busy working day. Proxim-ity to the research, and the opportunity to influence both its planning and its area of focus are important sources of motivation for SalMar.
The scale of SalMar’s R&D activities in a wide range of fields was substantial in 2019. During the year, SalMar continued to focus on fish welfare and lice control. Development projects were conducted at the secondary processing plant, and great emphasis has been placed on feed optimisation and control at the sea farms. In addition, SalMar continuously assesses its own work processes and aims to establish more long-term projects and a closer cooperation with the supply industry and research institutions.
SalMar’s efforts in the field of breeding and genetics includes a collaboration with Benchmark Holding plc’s SalmoBreed subsidiary, through the joint venture, SalMar Genetics. SalMar is pleased to see that this model has created a solid founda-tion for the further development of the Rauma strain in the years ahead, and that this work may also offer synergies in other areas that SalMar is focusing on.
In 2019, SalMar expanded its R&D activities in the area of feed and feeding in collaboration with its main feed provider. SalMar sees a substantial need for greater focus on basic knowledge of how the fish are fed and how we can ensure the entire pop-ulation enjoys optimal conditions throughout the production cycle. It is SalMar’s clearly expressed goal to initiate better and more comprehensive research into these issues under large-scale conditions. To contribute to this, SalMar provides funds for a professorship in the field of aquaculture at the Norwegian University of Science and Technology (NTNU).
The establishment of fish farming in the open ocean is an important part of SalMar’s strategy to ensure sustainable growth. To strengthen and concentrate its efforts in this area, SalMar created the subsidiary SalMar Ocean AS under the leadership of the Group’s former CEO Olav-Andreas Ervik. The Group’s ambition is to retain its leadership in this field, with respect to both technological advancements and biological pro-duction. In this way it aims to contribute to the environmentally sustainable development of the Norwegian aquaculture sector.
In 2016, the Ocean Farm project was the first to be awarded special development licences by the Norwegian authorities. The objective is to reduce the operation’s environmental foot-print, improve fish welfare and provide an answer to the aqua-culture sector’s shortage of suitable sites. At the start of 2019, SalMar, through its subsidiary MariCulture AS, was granted eight development licences for its Smart Fish Farm project. This installation will be even more technologically advanced than Ocean Farm 1, and will be specially designed to withstand location in considerably more exposed operating conditions.
Organisation, sustainability and social responsibilityIt is SalMar’s goal to secure long-term profitability and growth through sustainable aquaculture and processing activities, and by acting as a responsible corporate citizen. For SalMar, sustainability means doing business in an ethical manner and maintaining high moral standards, as well as contributing to even greater awareness of the environment in which we operate every day. We will protect the environment and ensure that it is managed in a way that benefits future generations.
As an employer, SalMar aims to provide a safe and develop-ing workplace. The Group works continuously to enhance measures and processes associated with health, safety and the environment (HSE), as well as provide professional devel-opment opportunities for managers and employees through, among other things, the SalMar School.
Pursuant to section 3-3c of the Norwegian Accounting Act, the board of directors has drawn up guidelines covering busi-ness ethics and corporate social responsibility. These are available from the Group’s website www.salmar.no. SalMar’s
84 RepoRt of the BoaRd of diRectoRs 2019

activities in the area of social responsibility, including human rights, labour rights, the working environment, equality, dis-crimination, anti-corruption and the external environment, are described in a separate section of this annual report.
Shares and shareholdersIn 2019, SalMar’s shares were traded at prices varying between NOK 355.50 and NOK 460.90 per share. The price on 30 December, the last day of trading in 2019, was NOK 449.30 per share.
At the AGM on 5 June 2019, the board was authorised to increase the company’s share capital. The authorisation was an extension of the one granted by the 2018 AGM and allows the board to increase the company’s share capital by up to NOK 2,832,000.
The AGM also authorised the board of directors to acquire the company’s own (treasury) shares in an amount such that the total holding of treasury shares does not at any time exceed 10 per cent of the outstanding share capital. The authorisa-tion may be used to purchase company shares in connection with stock option schemes for senior management and as a means of returning value to existing shareholders.
The board was also authorised to introduce a new share-based incentive scheme for senior executives. The pro-gramme entitles participating employees to receive shares free of charge. Entitlements are accrued over a three-year period. An employee may be awarded share entitlements equivalent to no more than half a year’s salary, with the accrual of 2/3 of those entitlements dependent on the achievement of certain performance criteria. The value of the shares released under the programme in an individual year may not exceed one whole year’s salary.
In addition, the board was authorised to take out a con-vertible loan to enable the company to make use of such financial instruments as part of its overall financing at short notice. The authorisation applies to an overall loan of NOK 2,000,000,000. The capital increase resulting from conver-sion may not exceed NOK 2,832,000, and must be seen in the context of the authorisation to increase the company’s share capital, such that both authorisations may not exceed 10 per cent of the total number of shares in the company.
All authorisations granted to the board remain valid until the 2020 AGM, which will be held on 3 June, and none have been exercised since the 2019 AGM.
SalMar ASA has one main shareholder, Kverva AS, which owned 52.46 per cent of the company’s shares at the close of 2019. Kverva AS is controlled by SalMar’s founder Gustav Witzøe, who is also the Group’s CEO.
The company’s 20 largest shareholders owned a total of 74.37 per cent of the shares at the close of 2019. As at 31 December 2019, SalMar ASA was the 26th largest share-holder with a holding of 377,141 shares or 0.33 per cent of the total number of shares outstanding. SalMar acquired no treasury shares in 2019.
The articles of association contain no stipulations limiting the transferability of the company’s shares. Furthermore, the company is not aware of any agreements between share-holders that limit the possibility of trading in or exercising voting rights with respect to shares.
Corporate governanceSalMar complies with the legislation, regulations and rec-ommendations to which a public limited company is subject, including Section 3-3b of the Norwegian Accounting Act on corporate governance, day-to-day obligations of a company listed on the Oslo Stock exchange and the current version of the Norwegian Code of Practice for Corporate Governance. These principles are discussed in detail in a separate chapter of the annual report.
The Group’s board of directors comprises four members elected by the shareholders and two employee representa-tives. Two of the board members are women, including one employee representative.
Changes in the board’s compositionAt SalMar ASA’s annual general meeting (AGM) on 5 June 2019, the seats on the board held by Atle Eide and Mar-grethe Hauge were up for election. Both Eide and Hauge had notified the Nomination Committee that they were seeking re-election, and both were re-elected to the board for a period of two years. Furthermore, the Nomination Committee had recommended the re-election of Gustav Magnar Witzøe as the personal deputy for Helge Moen. Witzøe is indirectly the majority shareholder in SalMar ASA through his ownership interest in Kvarv AS and thereby Kverva AS. The AGM voted to re-elect Witzøe for a period of two years.
As mentioned under “Events after the Balance Sheet Date”, SalMar announced in February 2020 that Trine Danielsen had notified the Nomination Committee’s chair that she was resigning her seat on the board with immediate effect because she had been appointed State Secretary at the Ministry of Trade, Industry and Fisheries. Her replacement will be elected at SalMar’s 2020 AGM.
Information relating to the competence and background of the various board members is available from SalMar’s website www.salmar.no.
85

OutlookMarket outlookAt the close of 2019, Norway had a standing biomass of 784,200 tonnes round weight, unchanged from the level recorded at the close of 2018. In the UK, the biomass at the close of the year stood at 104,900 tonnes, 5 per cent up on the year before. At 345,700 tonnes, Chile’s biomass was 8 per cent higher than it was 12 months before. The overall biomass in the Faeroes was estimated at 49,600 tonnes at the close of the year, up 9 per cent year on year.
Provisional forecasts for 2020 (Kontali Analyse) indicate a global increase in supply of around 4 per cent. The largest contributor is Norway, which expects to increase its output by 37,400 tonnes. However, for the second year in succession, the largest relative growth is expected to come from “Other countries”, where out-put is expected to rise by 18 per cent or 22,700 tonnes.
Supply of Atlantic salmon in 1,000 tonnes WFE 2020 Change
Norway 1,371 3%
Chile 720 4%
North America 163 0%
UK 186 1%
Faeroes 96 10%
Other countries 148 18%
Total, global supply 2,683 4%
Outlook for SalMar and its associatesSalMar expects to harvest a higher volume in 2020 than in 2019. In all, SalMar expects to harvest 152,000 tonnes in Norway and 12,000 tonnes in Iceland in 2020. In addition, SalMar expects its share of the volume harvested by Norskott Havbruk (50 per cent) to come to 13,000 tonnes in 2020.
It is expected that around 45 per cent of the volume will be harvested in the first half-year, with the rest in the second half. At the time of writing, the contract rate for 2020 is around 20 per cent of the expected volume harvested. The contract portfolio’s average price and volume is relatively stable through the whole of 2020, with the average price slightly above the 2019 level.
The lice situation in Central Norway is stable and under con-trol, but still requires extra vigilance and preventive measures during certain challenging parts of the year. Over time, SalMar has invested heavily to increase its competence and capacity to handle biological challenges in the best possible way. These efforts have paid off, and the biological situation for Fish Farming Central Norway is good. The situation for Fish Farming Northern Norway is generally good, but SalMar has experienced challenges in certain areas.
SalMar has a high level of preparedness at its harvesting facility, so that extraordinary events can be handled in com-pliance with the regulations. The completion of InnovaNor, Northern Norway’s largest and most modern harvesting plant, in 2021 will further improve capacity and operational flexibil-ity in this region. In addition, efforts are continuously being made to develop the most sustainable and best production sites. In this context, SalMar’s offshore farming strategy, including the realisation of the Smart Fish Farm project, is therefore important.
Feed is the most important cost factor in salmon farming, accounting for around 50 per cent of total production costs. Given that recent months’ changes in exchange rates hold firm through the year, this indicates that prices will be higher in 2020 than in 2019.
All in all, this means that SalMar expects the cost price of its harvested biomass in 2020 to be slightly lower than in 2019.
InvestmentsSalMar will continue its ongoing maintenance/upgrade invest-ment programme, and expects to invest around NOK 283 million in 2020, largely in activities related to its sea farms.
Furthermore, SalMar plans several investments to promote growth along the entire value chain in 2020. In the hatchery area, capacity in Senja is being expanded, which will create a significant competence centre for RAS technology and smolt production in the region. The project is expected to cost NOK 850 million. Construction is expected to get underway in the second quarter 2020, with the first smolt being deliv-ered in 2022. SalMar is also considering the construction of a new hatchery at Tjuin in Trøndelag, with a view to which the Group purchased a plot of land in the area in the fourth quarter 2019. Proximity to the company’s existing hatchery at Follafoss will facilitate the built up of a strong centre of expertise relating to smolt production in this region as well. Investments in hatcheries are expected to total NOK 354 million in 2020. NOK 556 million will be invested in harvesting capacity (InnovaNor) and NOK 56 million in SalMar Ocean for the further development of the Smart Fish Farm, which will make it possible to farm fish in the open ocean. In total, SalMar expects to invest around NOK 1,421 million in 2020.
In addition, the purchase of additional capacity under the gov-ernment’s “traffic light” scheme will also come in 2020. In the first quarter this year, SalMar purchased its share of the awarded growth in capacity at the designated fixed price. For this is paid a total consideration of NOK 106 million. SalMar is also prepared to participate in the auction round scheduled for 23 June 2020, as long as it takes place on commercially acceptable terms.
86 RepoRt of the BoaRd of diRectoRs 2019

Coronavirus (COVID-19) pandemicSalMar is prepared to take the steps necessary, operationally, strategically and financially, to safeguard the company going forward. The production and delivery of food is essential for society, and must be protected in every way possible. The board and company are giving the highest priority to imple-menting the measures necessary in an extremely uncertain situation. Internally, measures have been implemented to reduce the spread of infection, all meetings, both internal and external, involving multiple participants have discontinued, and business travel has been reduced to a minimum.
SalMar is monitoring the situation carefully and keeping abreast of all the instructions issued by the health author-ities. At the same time the Group is engaged in a fruitful dialogue with our customers and distribution companies worldwide, so that our fantastic product can reach its intended destination.
On 17 March 2020, SalMar’s board of directors gave notice that, in light of the critical situation society finds itself in as a result of the coronavirus pandemic, the dividend of NOK 21 per share for 2019 that had been announced in connection with the presentation of the quarterly results at the end of February would not be paid out. This decision was taken after a thorough assessment by the company’s board and management on the basis of the uncertainty attaching to the spread of the virus and the consequences it could have for the entire value chain and for a number of local communities up and down the Norwegian coast.
The board’s assessmentBy means of hard work and dedication over many years, Sal-Mar has built up a strong position in a growing aquaculture industry. Norway in general, and central Norway in particular, affords excellent natural fish farming conditions. SalMar will continue to manage these resources in the best possible way for its shareholders, employees, customers and affected local communities.
Based on its strong competitive and financial position, the SalMar Group aims to retain its standing as one of the world’s leading aquaculture companies, with continued good profit-ability going forward.
The COVID-19 coronavirus situation is challenging, and we as an organisation are trying to deal with it as best we can from day to day. There is no way of knowing how long this situation will last or what its long-term consequences may be. SalMar produces healthy food in a sustainable way, and the world’s population needs food. Our task is to handle the sit-uation as well as we can and ensure that SalMar’s operations continue as normally as possible. Despite the considerable uncertainty attaching to assessments of future market and production-related conditions, both with and without the spread of the coronavirus, the board is of the view that the Group’s outlook is extremely bright.
From the point of view of financial results, 2019 was a good year for SalMar. The board considers SalMar’s financial posi-tion to be sound, but in light of the COVID-19 pandemic, it considers that not paying a dividend is the right thing to do to protect the interests of both shareholders and society at large. SalMar has a strong balance sheet and a low debt ratio. The board therefore considers that SalMar’s financial capacity for further growth remains strong.
The SalMar culture, expressed through our corporate ten-ets, is fundamental to the entire business, and our vision, “Passion for Salmon”, is the lodestone that guides us on our way towards realising our ambition of being the world’s best aquaculture company. SalMar’s employees are our most important resource in our quest for further success. Con-tinuous development of the organisation is therefore a key focus area for the Group. The board would like to thank all the company’s employees for their dedicated efforts, on which the SalMar Group’s enduring success is based.
Frøya, 2 April 2020
Atle S. Eide Kjell A. Storeide Margrethe Hauge Helge K. MoenChairman of the Board Member of the Board Member of the Board Member of the Board
Jon Erik Rosvoll Brit Elin Soleng Gustav WitzøeEmployee representative Employee representative CEO
87

Renumeration statement to senior executives
Statement regarding the determination of salary and other benefits payable to senior executives of SalMar ASA for 2020.
88

1. IntroductionPursuant to section 6-16a of the Public Limited Companies Act, the board of directors of SalMar ASA (the Company) has issued the following statement containing guidelines for the determination of salary and other benefits payable to the Company’s CEO and other senior executives (collectively termed “senior executives”) in the 2020 financial year. The statement was approved by the board of directors of SalMar ASA on 2 April 2020. In accordance with the provisions of sections 6-16a and 5-6(3), the guidelines will be submitted to SalMar ASA’s Annual General Meeting (AGM) on 3 June 2020 for a consulta-tive vote, with the exception of clause 3 “Share-based incentive schemes”, which will be submitted to the AGM for approval.
The guidelines in clause 3 “Share-based incentive schemes” are binding on the board. The remaining guidelines are not binding, though any deviations therefrom must be decided by the board. In the event of any such decision, the reason for deviating from the guidelines must be noted in the board meeting’s minutes.
2. Decision-making authorityThe board of directors determines the salary and other ben-efits payable to the CEO. The CEO determines the salary and other benefits payable to other senior executives. The board shall exercise general oversight of the remuneration paid to other senior executives, and may issue more specific guidelines for the remuneration of other senior executives in addition to those presented below. If the CEO wishes to offer remuneration to senior executives that exceeds such more specific guidelines, a proposal therefor shall be submitted to the board of directors for approval.
3. Guidelines for remuneration in the 2020 financial yearThe Company’s senior executive remuneration policy is based on the following main principles:
• Executive salaries shall be competitive• Executive salaries shall be motivating
On the basis of these main principles, the board has drawn up the following remuneration structure for the company’s senior executives.
Basic salaryBasic salary is the main element in the executive’s compen-sation package. Basic salary shall correspond to the going rate in the market, and shall reflect the individual position’s duties and level of responsibility.
BonusSalMar has a bonus scheme for group management that is determined by the board of directors. The board carries out an
annual assessment of the scheme and determines the bonus criteria for the coming year. Variable salary increments under the scheme may not exceed 33% of the individual executive’s basic salary. Within this framework, individual bonuses are determined on the basis of an overall assessment of con-tribution, performance, development and results achieved.
Share-based incentive schemesSalMar has a share-based incentive scheme for senior exec-utives in the Group. The first such programme was approved by the AGM on 4 June 2014. The programme encompasses incumbents of senior positions and key individuals within the Group. The programme entitles the employee to receive shares free of charge. This entitlement accrues over a three-year period. The individual employee may be awarded share entitlements worth the equivalent of 6 months’ salary. Accrual of 2/3 of the entitlements depends on the achieve-ment of predefined performance criteria. The value of the shares released under the various programmes in an individual year may not exceed one full year’s salary.
The intention is that the incentive scheme shall be continued with the establishment of annual programmes. The board will adjust these annual programmes as it deems necessary, and each individual programme will be submitted to the AGM for approval. A total of three programmes are in effect in 2020.
Pension schemesMembers of group management participate in the Group’s general pension scheme. The scheme is a defined contri-bution plan and lies within the framework stipulated in the Mandatory Occupational Pensions Act.
Notice and severance payIn principle, senior executives must serve a 6-month period of notice. In selected cases, and depending on the position, severance pay of 6 to 12 months may be paid.
Benefits-in-kindThe Company shall not offer benefits-in-kind over and above these which are normal for senior executives in compara-ble companies.
Other variable elements of remunerationIn addition to that stipulated above, the Company may not offer senior executives any variable elements in the remu-neration they receive or special benefits that supplement their basic salary.
4. Remuneration policy for the 2019 financial yearThe Company’s senior executive remuneration policy for the 2019 financial year has been carried out in accordance with the statement for 2019 adopted by the AGM on 5th of June 2019.
89

Consolidated financial statements SalMar ASA 2019
90

Income statement NOK 1,000
Operating revenues and operating expenses Note 2019 2018
Revenues from contracts with customers 12,202,197 11,301,338
Other operating revenues 35,392 41,216
Total operating revenues 3, 23 12,237,589 11,342,554
Cost of goods sold 26 5,770,027 4,585,491
Payroll costs 20, 24, 25 1,202,494 1,040,438
Depreciation of PP&E and intangible assets 4, 5, 6 716,807 487,778
Write-downs of PP&E 5 1,642 0
Other operating expenses 13, 24, 26 1,479,023 1,768,036
Total operating expenses 9,169,992 7,881,743
Operational EBIT 3,067,597 3,460,812
Fair value adjustments 15 -32,995 845,831
Operating profit/loss 3,034,601 4,306,642
Income from investments in associates 10 118,655 252,933
Financial items
Interest income 29 12,465 10,964
Financial income 8, 29 236,926 34,347
Interest expenses 18, 29 170,190 116,101
Financial expenses 29 74,093 36,218
Net financial items 5,108 -107,007
Profit/loss before tax 3,158,365 4,452,568
Tax 19 613,877 873,343
Net profit/loss for the year 2,544,487 3,579,225
Other comprehensive income (OCI) Items which may subsequently be reclassified to profit & loss
Translation differences and OCI in associates 12,636 -5,627
Translation differences in associates - reclassified to profit & loss 8 -4,395 0
Translation differences in subsidiaries 31,667 4,898
Total OCI for the year 2,584,395 3,578,495
Allocation of the year's net profit
Non-controlling interests 7 56,452 10,812
Shareholders in SalMar ASA 2,488,035 3,568,413
Allocation of the year's total OCI
Non-controlling interests 7 69,951 10,812
Shareholders of SalMar ASA 2,514,444 3,567,683
Earnings per share 28 22,06 31,70
Diluted earnings per share 28 22,03 31,60
91

Balance sheet as at 31 December NOK 1,000
Assets
Non-current assets
Intangible assets Note 2019 2018
Licences, patents, etc 4, 21 4,295,467 2,957,486
Goodwill 4 446,465 446,465
Total intangible assets 4,741,932 3,403,951
Property, plant & equipment
Land, buildings & other operating assets 5, 21 4,369,921 3,591,490
Right-to-use assets 6, 21 569,700 0
Total property, plant & equipment 4,939,621 3,591,490
Non-current financial assets
Investments in associates 10 717,819 1,188,971
Investments in shares & other securities 11 472 394
Pension fund assets 11, 20 1,510 7,324
Other receivables 11, 13, 24 94,415 18,812
Total non-current financial assets 814,216 1,215,500
Total non-current assets 10,495,768 8,210,941
Current assets
Biological assets 14, 21 5,720,810 5,305,616
Other inventory 14, 21 468,728 459,934
Total inventory 6,189,538 5,765,550
Receivables
Trade receivables 11, 13, 21 739,429 630,061
Other receivables 11, 12, 13 330,332 289,416
Total receivables 1,069,761 919,477
Bank deposits, cash & cash equivalents 11, 16, 18 230,990 239,596
Total current assets 7,490,289 6,924,623
Total assets 17,986,057 15,135,564
92 Consolidated finanCial statements salmar asa 2019

Balance sheet as at 31 December NOK 1,000
Equity and liabilities
Equity
Paid-in equity 2019 2018
Share capital 17 28,325 28,325
Treasury shares -94 -140
Share premium fund 415,286 415,286
Other paid-in equity 201,508 153,895
Total paid-in equity 645,025 597,365
Retained earnings
Other equity 8,362,685 8,450,748
Total retained earnings 8,362,685 8,450,748
Non-controlling interests 7 732,391 91,729
Total equity 9,740,100 9,139,842
Liabilities
Non-current liabilities
Deferred tax 19 1,757,557 1,541,431
Debt to credit institutions 2, 11, 18, 21 2,751,570 689,927
Long-term leasing liabilities 2, 6, 11, 18, 21 488,871 329,190
Total non-current liabilities 4,997,999 2,560,548
Current liabilities
Debt to credit institutions 2, 11, 18, 21 381,539 733,583
Short-term leasing liabilities 2, 6, 11, 18, 21 140,733 14,604
Trade payables 11, 18 1,305,050 1,194,760
Tax payable 19 588,455 690,717
Public charges payable 218,923 300,591
Other current liabilities 12, 22 613,258 500,919
Total current liabilities 3,247,958 3,435,174
Total liabilities 8,245,956 5,995,721
Total equity and liabilities 17,986,057 15,135,564
Frøya, 2 April 2020
Atle S. Eide Kjell A. Storeide Margrethe Hauge Helge K. MoenChairman of the Board Member of the Board Member of the Board Member of the Board
Jon Erik Rosvoll Brit Elin Soleng Gustav WitzøeEmployee representative Employee representative CEO
93

Statement of cash flow NOK 1,000
Cash flow from operating activities: Note 2019 2018
Profit before tax 3,158,365 4,452,568
Tax paid in the period 19 -690,717 -672,778
Depreciation and write-downs 4, 5, 6 718,448 487,778
Options charged to expenses 24, 25 47,614 39,707
Share of profit/loss from associates 10 -118,655 -252,933
Gains/losses on exit of subsidiaries 8, 29 -225,873 0
Gains/losses on sale of non-current assets 5 0 -281
Net interest paid 29 157,725 105,137
Change in fair value adjustments 15 32,995 -845,831
Change in inventory / biological assets at cost -110,688 -436,195
Change in trade receivables -89,095 -112,152
Change in trade payables 41,329 -54,215
Change in other time-limited items 108,087 70,837
Net cash flow from operating activities 3,029,535 2,781,642
Cash flow from investing activities:
Receipts from sale of PP&E 5 0 210
Payments for puchase of PP&E and intangible assets 4, 5 -1,347,398 -945,997
Payments for puchase of shares and other securities 8, 10 -199,358 -114,429
Dividends from associates 10 254,804 242,200
Lending to third parties -25,475 -15,793
Net cash flow from investing activities -1,317,427 -833,809
Cash flow from financing activities:
New long-term borrowings 18 2,341,847 500,000
Repayment of long-term borrowings 18 -1,061,284 -136,670
Payments on leasing liabilities (including interest) 18 -213,522 0
Net change in overdraft 18 53,669 3,788
Net interest paid -104,941 -105,137
Dividend paid -2,617,154 -2,147,176
Payment for acquisition of non-controlling interests 8, 9 -118,897 -4,980
Net cash flow from financing activities -1,720,282 -1,890,175
Net change in bank deposits, cash & cash equivalents -8,175 57,657
Foreign exchange effects -431 4,839
Bank deposits, cash & cash equivalents as at 1 Jan 239,596 177,098
Bank deposits, cash & cash equivalents as at 31 Dec 230,990 239,596
Unused drawing rights 18 2,771,410 3,422,516
See Note 18 for further details of the Group's various credit facilities.
Restricted funds accounted for NOK 87,772,000 of the company's total cash & cash equivalents of NOK 230,990,000. See Note 16 for further details.
94 Consolidated finanCial statements salmar asa 2019

Statement of equity NOK 1,000
2018 NoteShare
capitalTreasury
shares
Share premium
fund
Other paid-in equity
Translation differences
Other equity
Non-controlling
interestsTotal
equity
Equity as at 1 Jan 2018 28,325 -189 415,286 114,188 47,588 6,974,861 88,070 7,668,128
Net profit for the year 3,568,413 10,812 3,579,225
Other comprehensive income (OCI)
Translation differences in associates 10 -5,627 -5,627
Translation differences in subsidiaries 4,898 4,898
Total OCI -730 -730
Total OCI for the year -730 3,568,413 10,812 3,578,495
Transactions with shareholders
Share-based remuneration - capital injection 25 39,707 39,707
Share-based remuneration - deferred tax 19 3,151 3,151
Share-based remuneration - release 25 48 -48 0
Payment of dividend 17 -2,138,356 -8,820 -2,147,176
Exit of non-controlling interests 9 -4,980 0 -4,980
Other changes 851 1,668 2,518
Total transactions with shareholders 0 48 0 39,707 0 -2,139,384 -7,152 -2,106,781
Equity as at 31 Dec 2018 28,325 -140 415,286 153,895 46,858 8,403,890 91,729 9,139,842
2019 NoteShare
capitalTreasury
shares
Share premium
fund
Other paid-in equity
Translation differences
Other equity
Non-controlling
interestsTotal
equity
Equity as at 1 Jan 2019 28,325 -140 415,286 153,895 46,858 8,403,890 91,729 9,139,842
Net profit for the year 2,488,035 56,452 2,544,487
Other comprehensive income (OCI)
Translation differences in associates 10 12,636 12,636
Translation differences in associates - reclassified to profit/loss 8 -4,395 -4,395
Translation differences in subsidiaries 18,169 13,499 31,667
Total OCI 26,409 13,499 39,908
Total OCI for the year 26,409 2,488,035 69,951 2,584,395
Transactions with shareholders
Share-based remuneration - capital injection 25 47,614 47,614
Share-based remuneration - deferred tax 19 -1,775 -1,775
Share-based remuneration - release 25 46 -46 0
Payment of dividend 17 -2,592,997 -24,157 -2,617,154
Addition of non-controlling interests 8 500 705,239 705,738
Exit of non-controlling interests 8, 9 -8,527 -110,371 -118,897
Other changes 337 337
Total transactions with shareholders 0 46 0 47,614 0 -2,602,507 570,711 -1,984,137
Equity as at 31 Dec 2018 28,325 -94 415,286 201,508 73,267 8,289,417 732,390 9,740,100
95

Notes to the financial statements 2019
96

NOTE 1 Accounting principles 98
NOTE 2 Financial risk management 106
NOTE 3 Segments 108
NOTE 4 Intangible assets 111
NOTE 5 Property, plant & equipment 114
NOTE 6 Leases 115
NOTE 7 Group companies 117
NOTE 8 Business combinations 118
NOTE 9 Non-controlling interests 119
NOTE 10 Associates 120
NOTE 11 Financial instruments by category 122
NOTE 12 Derivatives 123
NOTE 13 Receivables, provisions for bad debts 124
NOTE 14 Inventory and biological assets 125
NOTE 15 Fair value adjustments 127
NOTE 16 Bank deposits 128
NOTE 17 Share capital and shareholders 128
NOTE 18 Interest-bearing debt 129
NOTE 19 Deferred tax and tax expense 132
NOTE 20 Pension costs, assets and liabilities 133
NOTE 21 Liens and guarantees 133
NOTE 22 Other current liabilities 134
NOTE 23 Operating revenues 134
NOTE 24 Payroll costs, no. of employees, remunerations, loans to employees, etc 135
NOTE 25 Share-based incentives 137
NOTE 26 Operating expenses 139
NOTE 27 Government grants 139
NOTE 28 Earnings per share 140
NOTE 29 Financial income and expenses 140
NOTE 30 Related parties / individual transactions 141
NOTE 31 Allegations of price fixing 141
NOTE 32 Events after the balance sheet date 141
NOTE 33 New and amended accounting standards 142

Note 1 Accounting principles
GeneralSalMar ASA is registered and domiciled in Norway, and the company’s shares are traded on the Oslo Stock Exchange. The company’s head office is located at Industriveien 51, 7266 Kverva, in the municipality of Frøya. The consolidated financial statements were formally approved by the board of directors on 2 April 2020.
The most important accounting principles used in the prepa-ration of the consolidated financial statements are presented below. These principles are applied in the same way in all the periods presented unless otherwise indicated.
Principles underlying the financial statementsThe consolidated financial statements have been drawn up in accordance with IFRS and interpretations determined by the International Accounting Standards Board that have been approved by the EU. In 2019, a material change was made relating to IFRS 16 Leases. The standard has been implemented with effect from 1st of January 2019. See Note 6 and Note 33 for further details.
The consolidated financial statements are based on the principles of historic cost, with the exception of the following accounting items, which are recognised at fair value:
• Biological assets (Note 14)• Derivatives (Note 12)
Consolidation principlesThe consolidated financial statements include SalMar ASA and its subsidiaries as at 31 December. The Group therefore controls an entity in which it has invested when, and only when, the Group:
− has control over the entity,− is exposed to or entitled to a variable return on its
investment in the entity, and− has the opportunity to exercise its control over the
entity to influence its return.
If the Group has a majority of the voting rights in an entity, the entity is presumed to be a subsidiary of the Group. To substantiate this presumption, and where the Group does not hold a majority of the voting rights, the Group considers all relevant facts and circumstances to evaluate whether the Group has control over the entity in which it has invested. This includes assessing the size of its shareholding, its voting share, the shareholder structure and its relative strength, as well as options controlled by the Group and shareholder agreements or other agreements. The assessment is per-formed for each investment. A reassessment is performed
when facts and circumstances indicate that changes have taken place in one or more of the controlling elements. As at 31 December, SalMar ASA had a majority of voting rights in all its subsidiaries.
The consolidated financial statements have been prepared in accordance with uniform accounting principles for similar transactions in all the companies included in the consolidated accounts. All material transactions and balances between group companies have been eliminated.
The acquisition method is used in connection with the recog-nition of business combinations. Subsidiaries are consolidated from the date on which the Group achieves control, and are excluded from consolidation when control is ceded. This means that the acquired company’s assets and liabilities are reported at fair value on the date of acquisition, with any excess value being classified as goodwill. The entity perspec-tive is applied in connection with acquisitions where control is established. The exception is goodwill, where for each acqui-sition it is optional whether to recognise only the controlling owner’s share or 100 per cent. In those cases where the fair value of the acquired assets exceeds the amount paid, the difference is treated as income in profit and loss. Deferred tax is capitalised to the extent to which identifiable excess values ascribed to assets and liabilities lead to an increase or decrease in future tax payable when these differences are reversed in future periods. Deferred tax is capitalised and calculated using a nominal, undiscounted tax rate.
When shares are acquired in stages, the value of the assets and liabilities on the date the Group was formed is utilised. Later acquisition of assets in existing subsidiaries will not affect the value of assets or liabilities.
When the Group no longer has control, any remaining share-holding is measured at fair value, with changes recognised through profit and loss. Fair value subsequently represents acquisition cost in future accounting periods, either as an investment in an associated company, jointly controlled entity or financial asset. Amounts which were previously recognised in other comprehensive income relating to this company are treated as if the Group had divested the underlying assets and liabilities. This may mean that amounts which have pre-viously been recognised in other comprehensive income are reclassified to profit and loss.
Non-controlling interestsThe share of the profit or loss after tax attributable to non-controlling interests is presented on a separate line after the Group’s net profit for the year. The share of equity
98 Notes to the fiNaNcial statemeNts 2019

attributable to non-controlling interests is presented on a separate line under group equity.
Transactions with non-controlling interests in subsidiaries are recognised as equity transactions. In connection with the purchase of shares from non-controlling interests, the difference between the consideration paid and the shares’ relative share of the book value of the subsidiary’s net assets is recognised in the parent company’s equity. Gains and losses deriving from the sale of shares to non-controlling interests is recognised correspondingly in equity.
AssociatesThe Group has investments in associates. Associates are entities over whose financial or operational management the Group has significant influence, but not control or joint control. Significant influence normally exists where the Group has 20-50 per cent of the voting rights.
Investments in associates are recognised in accordance with the equity method. The investment is recognised on the date of its purchase at acquisition cost, and the Group’s share of profit/loss in subsequent periods is taken to income or expenses. The capitalised amount includes any implicit goodwill identified on the date of purchase.
The Group’s share of the profit/loss from associates is recog-nised in profit and loss and attributed to the book value of the investment. The Group’s share of other comprehensive income in the associate is recognised in the Group’s com-prehensive income and attributed to the investment’s book value. Correspondingly, the Group’s share of sums recognised directly in equity in underlying investments is presented in the Group’s statement of equity. Unrealised gains associated with transactions with associates are eliminated in proportion to the Group’s share of the business.
Should indications of impairment arise, the book value of the investment is written down. Any impairment in value is recognised in the share of profit/loss from associates in the financial statements. When the Group’s share of losses exceeds the investment in an associate, its book value is written down to zero, and no further losses are recognised.
If an investment ceases to be an associate, such that the equity method no longer applies, the remaining shareholding is measured at fair value.
Revenue from contract with customersRevenue from contracts with customers relates to the sale of salmon and trout, as whole fish or as further processed products. Such revenues are taken to income when con-trol over the product or service has been transferred to the customer, and in an amount that reflects what the Group expects to receive for the product or service. The transfer of
control to the customer will normally occur when the product or service is delivered. The date of delivery depends on the terms agreed with each individual customer. The normal credit time granted is 30 days net.
Dividend is taken to income when the shareholders’ right to receive a dividend has been authorised by the Annual General Meeting.
Government grantsOperating grants are periodised and classified together with the revenue they are intended to augment or the expense they are intended to reduce. Investment grants reduce the asset’s book value, and are taken to income through reduced future depreciation.
Segment reportingOperating segments are reported in the same way as they are reported internally to the company’s highest deci-sion-making bodies.
The company’s highest decision-making body, which is responsible for the allocation of resources and the evalua-tion of the operating segments’ earnings, is defined as group management. The Group’s business activities comprise the farming of salmon and trout on the one hand, and its process-ing and sale on the other. In addition, the Group’s business activities in Iceland are reported as a separate entity and are defined as a separate segment.
In Norway, the fish farming segment is divided into two regions: Fish Farming Central Norway and Fish Farming Northern Norway. The Group’s hatchery activities are included in these segments. Fish Farming Central Norway and Fish Farming Norther Norway are defined as separate segments, which are reported and administered as such inter-nally. The operating segment Arnarlax in Iceland is a fully integrated aquaculture company with its own hatchery, sea farms, harvesting plant and sales force. The combined results for this business are reported through the operating segment Arnarlax.
Classification principlesLiquid assets consist of cash and bank deposits.
Assets which form part of the production cycle or fall due for payment within 12 months are classified as current assets. Other assets are classified as non-current assets. Liabilities which form part of the production cycle or fall due for pay-ment within 12 months are classified as current liabilities. Other liabilities are classified as non-current.
The next year’s instalment on long-term debt is classified as a current liability.
99

Changes in the fair value of biological assets are presented on a separate line under operating profit/loss, along with the unrealised value of Fish Pool contracts and any change in the unrealised value of forward currency contracts that have been entered into to hedge future deliveries. Operat-ing profit/loss is reported before fair value adjustment of the biomass in order to show the Group’s underlying sales performance during the period.
CurrenciesThe consolidated financial statements are presented in Nor-wegian kroner (NOK), which is both the parent company’s functional currency and the Group’s presentation currency.
Transactions in foreign currencies are translated into NOK at the time the transaction takes place. Realised foreign exchange gains/losses deriving from the settlement and translation of monetary items in foreign currencies at the rate in effect on the balance sheet date are recognised in profit and loss.
Any foreign exchange differences on monetary items that are part of the net investment in a foreign entity or on cur-rency positions deemed to constitute cash-flow hedging are recognised in other comprehensive income.
The fair value of currency hedging instruments is calculated on the balance sheet date at the market price for contracts with a similar maturity profile. Changes in the fair value and realised effect of such instruments are recognised in profit and loss as a net financial item when they do not meet the requirements for hedge accounting. The exception is a change in the fair value of forward currency contracts which have been entered into to hedge future deliveries. These are recognised in profit and loss on the line for fair value adjustments. Financial derivatives are classified as current assets or current liabilities in the balance sheet. See note 12 for further details.
The profit and loss account and balance sheet of group com-panies (none with hyperinflation) with a functional currency other than the presentation currency are translated thus:
a) The balance sheet is translated at the exchange rate in effect on the balance sheet date.
b) The profit and loss account is translated at the average exchange rate (if the average does not give a generally reasonable estimate of the transaction rate, the actual transaction rate is used).
c) Translation differences are recognised in comprehensive income and are specified as a separate item under equity.
Intangible assetsIntangible assets that are purchased individually are cap-italised at acquisition cost. Intangible assets acquired in connection with the purchase of a business entity are cap-italised at acquisition cost when the criteria for separate posting are met.
Intangible assets with a limited economic life are depreciated systematically. Intangible assets are written down to their recoverable value if the expected financial benefits do not cover their book value and any remaining production costs.
Costs relating to research and development are charged to expenses as they accrue. R&D costs are capitalised when specific criteria relating to future revenues are met. Capi-talised R&D costs are recognised at acquisition cost, less accumulated depreciation and write-downs. Capitalised R&D costs are depreciated in a straight line over the asset’s esti-mated period of use.
Breeding nuclei are capitalised at acquisition cost, less accu-mulated depreciation and write-downs.
LicencesLicences that the Group owns are capitalised at cost.
Licences granted in Norway are deemed to have an indef-inite usable life and are therefore not depreciated, but are tested annually for impairment. Any excess value identified in connection with the acquisition of licences is capitalised as an intangible asset. In connection with ordinary operations, there are no licence terms relating to reversion.
In Iceland, licences are granted for a period of 16 years before they must be renewed. The licences will be renewed if the applicant meets the requirements set pursuant to statute and regulation at the time the licence comes up for renewal. A small charge must be paid for the licence’s renewal. Because licences have a 16-year life, with the possibility of renewal, SalMar has elected to presume that these licences have an indeterminate life. They are therefore not depreciated, but are tested annually for impairment.
GoodwillWhen another business entity is taken over for a considera-tion that exceeds the value of the individual assets, the differ-ence is recognised as goodwill in the balance sheet. Goodwill deriving from the purchase of subsidiaries is included under intangible assets, while goodwill deriving from the acquisition of associates is included under shares in associates. Goodwill is recognised at historic cost.
When assessing the need to write down licences and good-will, these are assigned to relevant cash flow-generating enti-ties or those groups which are expected to benefit from the
100 Notes to the fiNaNcial statemeNts 2019
acquisition. Write-downs are performed in accordance with an assessment of the recoverable value of each of the cash flow-generating entities to which the licences and goodwill are assigned. To identify the Group’s cash flow-generating entities the assets are grouped according to the lowest level to which separate and independent cash flows may be ascribed. Recoverable value is the higher of fair value, less sales costs and value in use. When assessing the sales value of licences, reference is made to similar transactions that have been undertaken. Value in use is calculated by estimating future cash flows for the next three years based on approved budgets and forecasts. Cash flows after three years are assumed to equal the expected rate of inflation. Cash flows are discounted by a rate of interest before tax which takes account of relevant market risk. If the calcu-lated value in use is lower than the book value of the cash flow-generating entity, goodwill is written down first and then other assets as required.
Property, plant & equipmentProperty, plant and equipment are capitalised at acquisi-tion cost, less accumulated depreciation and write-downs. Interest on building loans is part of acquisition cost. When assets are sold or divested, the book value is derecognised and any loss or gain posted to profit and loss. Ordinary depre-ciation commences from the date on which the asset goes into normal operation, and is calculated on the basis of its economic lifespan. Depreciation is assigned in a straight line over the expected economic lifespan of the asset, taking into consideration its estimated residual value. If an asset comprises significant components with varying lifespans, these components are depreciated separately. The scrap value of the property, plant and equipment, as well as the depreciation period and depreciation method employed, are reassessed annually.
Facilities under construction are not depreciated. Depreciation is charged to expenses when the facilities are ready for use.
If the situation or circumstances indicate that the book value of an asset cannot be recovered, an assessment is made of whether to write down its value. If the recoverable value of a non-current asset is lower than its book value and the impairment is not expected to be temporary, the asset is written down to recoverable value. The recoverable value is the higher of net sales price and value in use. Value in use is the present value of the future cash flows which the asset will generate.
Financial instrumentsA financial instrument is any contract that gives rise to a financial asset on the part of one undertaking and a finan-cial liability or equity instrument on the part of another.
Financial assetsThe Group’s financial assets comprise: derivatives, unlisted equity investments, trade receivables and cash & cash equivalents.
The classification of financial assets at initial recognition depends on the nature of the asset’s contractually deter-mined cash flows, and which business model the Group applies to the management of its financial assets. At initial recognition, financial assets are recognised at fair value. Transaction costs may be added if financial assets are meas-ured at amortised cost.
The Group classifies its financial assets in two categories:
- Financial assets measured at amortised cost.- Financial assets measured at fair value with
changes in value through profit and loss.
The Group does not currently have any derivatives earmarked as hedging instruments recognised at fair value or financial assets at fair value through other comprehensive income.
Financial assets measured at amortised costThe Group measures financial assets at amortised cost if the following conditions have been met:
- the financial asset is being kept in a business model whose purpose is to receive contractually determined cash flows, and
- the contractual terms for the financial asset give rise to cash flows solely comprising payments of interest and principal on certain dates.
Subsequent measurement of financial assets is at amortised cost and is subject to loss provisions. Gains and losses are recognised in profit and loss when the asset is derecognised, modified or written-down.
The Group’s financial assets at amortised cost include trade receivables and other current deposits. Trade receivables which do not have a substantial financing element are meas-ured at the transaction price in accordance with IFRS 15 Revenue from Contracts with Customers.
Financial instruments measured at fair value with changes in value through profit and lossThe Group makes use of derivatives to hedge its underlying risk. The instruments used are forward currency contracts, interest rate swap agreements and salmon price hedging (Fish Pool contracts). This category also includes the Group’s unlisted equity instrument. Such instruments are recognised at fair value oln the date the contract was entered into, and are also subsequently measured at fair value.
101

Derivatives are recognised in the balance sheet as financial assets when their fair value is positive and as financial lia-bilities when their fair value is negative.
Derecognition of financial assetsA financial asset (or, if relevant, a portion of a financial asset or a portion of a group of similar financial assets) is derecognised if:
- The contractual entitlement to receive cash flows from the financial asset expires, or
- The Group has transferred the contractual entitlement to receive cash flows from the financial asset or retains the right to receive the cash flows from a financial asset, but at the same time pledges to transfers these to a counterparty, and either
a) the Group has transferred the bulk of the risk and benefits associated with the asset, or
b) the Group has neither transferred nor retained the bulk of the risk and benefits associated with the asset, but has transferred control over the asset.
Provisions for losses on financial assetsThe Group has made a provision for expected losses on all debt instruments that are not classified at fair value through profit and loss.
The Group measures expected credit losses on the basis of a specific assessment of each individual customer. The Group measures its loss provision on the basis of expected credit losses over each reporting period, and not based on a 12-month expected loss.
Financial liabilitiesFinancial liabilities are, at initial recognition, classified as loans and liabilities, or derivatives earmarked as hedging instruments in an effective hedging arrangement. Derivatives are initially recognised at fair value. Loans and liabilities are recognised at fair value adjusted for directly attributable transaction costs.
Derivatives are financial liabilities when their fair value is negative, and are treated for accounting purposes in the same way as derivatives that are assets.
Loans and liabilitiesAfter initial recognition, interest-bearing loans will be meas-ured at amortised cost. Gains and losses are recognised in profit and loss when the liability is derecognised.
Inventory and biological assetsInventory consists of feed, packaging materials, roe, fry, live fish held in sea farms and processed fish. Stocks of feed, packaging materials, roe, smolt and processed fish are valued
at the lower of cost and net realisation value. The cost price of goods produced in-house is the full production cost.
The FIFO principle is used in connection with the periodic assignment of inventory costs. Net realisation value is esti-mated sales price, less variable finishing and sales costs.
Live fish held in sea farms are recognised at fair value less a deduction for sales costs.
Biological assetsThe way live fish is accounted is regulated by IAS 41 Agri-culture. The general rule is that such assets are measured at fair value less sales costs. Fair value is measures in line with IFRS 13. Biological assets are valued in accordance with valuation level 3, ie based on factors not drawn from observable markets. Changes in value are recognised and classified under fair value adjustments in profit and loss. This is intended to provide a better understanding of the Group’s profit/loss on the sale of goods.
Roe, fry, smolt and cleaner fish are valued at historic cost. Historic cost is deemed to be the best estimate of fair value for these assets, due to little biological conversion.
The fair value of biological assets held at the Group’s sea farms is calculated using a cash-based present value model. The present value is calculated on the basis of estimated revenues, less estimated remaining production costs until the fish is harvestable at the individual site. A fish is har-vestable when it has reached the estimated weight required for harvesting specified in the company’s budgets and plans. The estimated value is discounted to present value on the balance sheet date. Present value is estimated for the bio-mass at each site.
Incoming cash flows are calculated as the estimated biomass at harvest multiplied by the price expected to be achieved at the same time. The estimated biomass (volume) at har-vest is calculated on the basis of the number of individual fish held in sea farms on the balance sheet date, adjusted for expected mortality until harvest and multiplied by the estimated weight of the fish at harvest.
The price is calculated using the Fish Pool forward price for the estimated harvesting date that was in effect on the balance sheet date. Forward prices are adjusted for an exporter supplement, as well as harvesting, sales and carriage costs. In addition, an adjustment is made to take account of expected differences in fish quality. Price adjustments are made at the site level.
Estimated remaining production costs are estimated costs that a rational person would presume necessary for the farming of fish up until they reach a harvestable weight. In
102 Notes to the fiNaNcial statemeNts 2019
the model, instead of being a separate cost element in he calculation, compensation for licence fees and site leasing costs is included in the discount factor, and thereby reduces the fair value of the biomass.
The fair value of the biomass is calculated using a monthly discounting of the cash flow based on the second last har-vesting month in the harvesting plan. The discount factor is intended to reflect three main components:
1. The risk of incidents that affect the cash flow.2. Synthetic licence fees and site leasing costs.3. The time value of money.
The discount factor is set on the basis of an average for all the Group’s sites and which, in the Group’s assessment, provides a sensible growth curve for the fish – from smolt to harvestable fish.
The risk adjustment must take account of the risk involved in investing in live fish. A fish spends on average 18 months at a sea farm, and the risk will be higher the longer the time until harvest. Biological risk, the risk of increased costs and price risk will be the most important elements to be recognised. The present value model includes a theoretical compensation for licence fees and site leasing costs as a surplus to the discount factor in the model, instead of being a cost-reducing factor in the calculation.
For a more detailed description of the various assumptions used in the model, see the section “Important accounting estimates and evaluations”.
Partnership agreementsBiomass farmed under partnership agreements is recognised as the Group’s own fish, since the Group assumes the bulk of the financial risk relating to the fish.
Principles for recognition of incident-based mortalityIncident-based mortality is recognised at sites which, in one period, have a 3 per cent mortality rate caused by an indi-vidual incident, or if mortality caused by the same incident over several periods exceeds 5 per cent. The assessment relates to the number of fish, and is made at the site level.
Directly recognised incident-based mortality is included in the cost of goods sold, unless the mortality is due to cir-cumstances which would indicate presentation on the line for exceptional biological events.
Exceptional biological eventsThe Group classifies exceptional biological events on a sep-arate line in profit and loss.
SalMar’s assessment of exceptional biological events relates to the following specific events:
− The culling of entire salmon stocks at the orders the regulatory authorities
− Individual incidents involving the escape of substantial numbers of salmon
In connection with the culling of salmon stocks at the orders of the regulatory authorities, the amount charged to expenses comprises the full production cost of the culled stock, plus costs incurred in connection with the clean-up and closure of the site. In the event of escaped fish, the amount charged to expenses corresponds to the full production cost of the escaped fish, plus costs incurred in connection with their recapture.
Fixed-price contractsThe Group enters into sales contracts for salmon products on an ongoing basis. The contracts involve physical settlement, and deliveries associated with the contracts form part of the Group’s normal business activities. The contracts contain no built-in derivative elements. A provision is made with respect to fixed-price contracts resulting in an obligation on the part of the Group to sell harvestable fish at a lower price than that which forms the basis for an estimation of the fair value of the biomass. The impact on profit and loss for the year is posted to ‘Fair value adjustments’.
Share capital and share premiumOrdinary shares are classified as equity. Transaction costs directly related to equity transactions are recognised directly in equity, less tax. If a group company purchases shares in the parent company, the consideration paid for such treas-ury shares, including any transaction costs – less tax – is recognised as a reduction in equity (allocated to the parent company’s shareholders) until the shares are cancelled or resold. If treasury shares are subsequently sold, the consid-eration received, less direct marginal transaction costs and associated tax effects, is recognised as an increase in equity allocated to the parent company’s shareholders.
TaxThe tax expense is matched against the profit/loss before tax and comprises tax payable (tax on the year’s direct taxable income) and changes in net deferred tax. Tax is recognised in profit and loss unless it refers to items which are posted in other comprehensive income or are taken directly to equity. In this case tax is included in the net amount posted in other comprehensive income or taken directly to equity.
Tax payable for the period is calculated in accordance with the tax legislation and regulations issued, or largely issued, by the tax authorities on the balance sheet date.
103

Deferred tax in the balance sheet is a nominal amount calculated on the basis of temporary differences between accounting and tax values, as well as any tax loss carried forward at the end of the financial year. Deferred tax assets are capitalised when the probability that a taxable income will be made, which will allow the asset to be utilised, can be documented. Deferred tax assets and liabilities are presented net in the balance sheet.
Deferred tax is calculated on the difference between the accounting and taxable values of licences.
PensionsThe Group has a defined-contribution pension scheme for its employees. Contributions are recognised as payroll costs as and when the liability to make such contributions accrues. Prepaid contributions are recognised as an asset to the extent that the contribution may be refunded or used to reduce future contributions. Once the contributions have been paid in, the Group has no further payment liability.
Share-based incentivesThe Group operates a share-based incentive scheme in which the companies receive services from the employees in return for equity instruments (RSU entitlements) in the Group. The fair value of the services the entities received from employ-ees in return for the RSU entitlements granted is recognised as a cost in profit and loss.
The fair value of RSU entitlements is set on the date they are awarded. The fair value of the RSU entitlements that are not at market terms is set as the share price on the date the award was made. The probability of the performance criteria being met is taken into account when assessing how many RSU entitlements will be redeemed. The fair value of the RSU entitlements that are at market terms is calculated on the basis of a Monte-Carlo simulation. The most important input data when calculating the value of these RSU entitlements are the share price on the date of the award, volatility, risk-free interest, expected dividend and vesting period.
The value thus set is posted to profit and loss periodically over the options’ accrual period, with a corresponding increase in paid-in equity. The accrual period is the period from the establishment of the scheme until the options are fully vested. Employer’s national insurance contributions are recognised over the expected accrual period.
ProvisionsA provision is recognised when, and only when, the company has a constructive liability (legal or self-imposed) deriving from an event which has occurred, and it is probable (more likely than not) that a financial settlement will take place as a result of that liability, and that the amount in question can be reliably quantified. Provisions are reviewed on each
balance sheet date, and the level reflects the best estimate for the liability.
Leasing contractsWith effect from 1 January 2019, the Group has implemented IFRS 16 Leases. IFRS 16 sets out principles for the recogni-tion, measurement, presentation and disclosure of leasing agreements. Under IFRS 16, assets and liabilities relating to the majority of leasing agreements must be recognised in the balance sheet. An exception is made for short leases with a term of less than 12 months and for leases relating to assets with a low underlying value. Leasing costs asso-ciated with this kind of agreements are recognised in profit and loss as they arise. When assessing the non-terminable contract period, an assessment has been made of whether there is reasonable assurance that the option to extend will be exercised.
Where the Group has entered into complex leasing agree-ments, the service element is hived off to calculate the value of the right-to-use asset. In the main, this applies to leasing agreements for wellboats and service boats, where crew costs and other elements are included in the leasing amount, and where the estimated market price of the service element is hived off.
When the leasing contract goes into effect, the leasing liabil-ity is measured at the present value of the leasing payments with the help of the Group’s marginal interest rate.
Under IFRS 16, right-to-use assets are depreciated from the date on which the contract goes into effect until the end of the right-to-use asset’s usable life or the end of the leasing period, whichever comes first.
IFRS 16 Leases replaces the existing IFRS for leases, IAS 17 Leases. In the 2018 financial year, leasing agreements were recognised in accordance with IAS 17. Under the terms of this standard, operating assets which are leased on terms which transfer the bulk of the financial risk and control to the company (financial leasing) were recognised in the balance sheet as property, plant and equipment, and the correspond-ing leasing liability was included under non-current liabili-ties at the present value of the leasing payments. Leasing payments with respect to operational leasing agreements were classified as operating expenses and were posted to profit and loss in a straight line over the term of the contract.
Events after the balance sheet dateNew information regarding the company’s financial position on the balance sheet date which is received after the balance sheet date has been recognised in the year-end financial statements. Events after the balance sheet date which do not affect the company’s financial position on the balance sheet
104 Notes to the fiNaNcial statemeNts 2019

date, but which will affect the company’s future financial position are reported if material.
Statement of cash flowThe Group’s statement of cash flow shows a breakdown of the Group’s overall cash flow into operating, investing and financing activities. The statement shows the individual activity’s impact on liquid assets. Cash flow deriving from the acquisition and sale of businesses is presented under investing activities.
Important accounting estimates and evaluationsPreparation of the financial accounts in accordance with IFRS requires that management make evaluations, estimates and assumptions that affect the application of accounting principles and the book value of assets and liabilities in the balance sheet, as well as figures for revenue and expenses for the financial year. Estimates and their underlying assump-tions are based on historical experience and other factors deemed relevant and probable at the time the evaluations are made. These evaluations affect the book value of the assets and liabilities where the valuation is not based on other sources. Estimates are reviewed continuously and final values and results may differ from these estimates. Changes in accounting estimates are included in the period in which the changes occur.
The evaluations and estimates deemed to be of greatest significance for the Group are as follows:
Fair value adjustment of the biomassLive fish are measured at fair value in accordance with IAS 41. The principles for calculating fair value are described under the accounting principle for biological assets.
The valuation is based on a number of assumptions that require considerable discretionary judgement. The key assumptions relate to volume, costs, price and the discount rate.
The estimated volume at harvest is based on the number of fish held at the sea farms, adjusted for estimated growth and mortality from the time the fish were transferred to the sea until they are ready for harvest. The actual volume harvested may deviate from the estimated volume as a result of bio-logical developments. Uncertainty with regard to biological developments may affect the date of harvest and therefore the period for discounting in the model.
Expected market prices underpin the measurement of fish at fair value. The industry considers the Fish Pool forward price to be the best estimate of market prices. The market price for fish has historically demonstrated the capacity for rela-tively large fluctuations from period to period and between seasons. The price will, moreover, change in accordance with
the size and quality of the fish at harvest. At the same time, the date of harvest will depend on the biological development of the fish.
Considerable uncertainty attaches to the estimated remain-ing production costs to harvest. Biological challenges such as disease and lice infestation will affect fish-related costs. In addition, uncertainty will attach to the price of other impor-tant input factors, such as feed.
Expected future cash flows for the individual site are dis-counted by a monthly discount factor. The discount factor comprises several elements (see the section on biological assets above). As previously mentioned, a synthetic licence fee and site leasing cost is added to the discount factor in the model instead of these being taken into account as a cost-reducing factor in the calculation. In order to engage in the farming of salmon and trout, it is necessary to have access to infrastructure such as licences and sites. The mar-ket price for a licence in today’s market is high, and it could be assumed that in a hypothetical market, there would be a considerable cost attached to use of this infrastructure and the licences necessary to operate a fish farming business. This cost is reflected in the size of the discount rate and will be subject to considerable discretionary judgement.
Fair value at acquisitionIn connection with an acquisition, the cost price of the acquired entity must be allocated such that the opening balance in the Group’s accounts reflects the estimated fair value of the acquired assets and liabilities. To determine the fair value at acquisition alternative methods are used to determine the fair value of assets for which there is no active market. Value in excess of that which can be attrib-uted to identifiable assets and liabilities is recognised in the balance sheet as goodwill. If the fair value of equity in the acquired entity exceeds the consideration paid, the excess is immediately recognised as income. The allocation of cost price in connection with business combinations changes if new information is obtained with respect to the fair value on the date of takeover and assumption of control, no later than 12 months after the acquisition took place.
See Note 8 ‘Business combinations’ for further details.
105

Note 2 Financial risk management
Financial riskThrough its activities, the Group is exposed to various kinds of financial risk: market risk, credit risk and liquidity risk. The company’s management assesses these risks on an ongoing basis and draws up guidelines for dealing with them. The Group makes use of financial derivatives to hedge against certain risks.
The Group has bank loans raised for the purpose of providing capital for investment in the company’s business. In addition, the company has financial instruments such as trade receiv-ables, trade payables, etc, which are ascribable directly to day-to-day business operations. For hedging purposes, the company has certain forward currency contracts. The com-pany does not make use of financial instruments, including financial derivatives, for the purpose of speculation.
Market riskInterest rate riskSince the Group has no material interest-bearing assets, its profit/loss and cash flow from operating activities are largely independent of changes in market rates.
The Group’s interest rate risk derives from long-term bor-rowings. Borrowing at floating interest rates represents an interest rate risk for the Group’s cash flow, which is partly reduced by the opposite effect on cash equivalents which earn floating interest. Fixed-rate loans expose the Group to fair value interest rate risk. The borrowing portfolio is currently at floating interest rates, which means that the Group is affected by changes in interest rates. Loans are capitalised at amortised cost.
Given the financial instruments in effect on 31 December 2019, a 0.5% rise in the rate of interest would reduce the Group’s profit by NOK 18,814,000 (2018: NOK 8,837,000), all other variables remaining constant.
Foreign exchange riskThe Group operates internationally, and is exposed to foreign exchange risk in several currencies. This risk is particularly relevant with respect to the USD, EUR, GBP and JPY. Foreign exchange risk arises from future trading transactions, capi-talised assets and liabilities, and net investments in foreign business operations. The foreign exchange risk associated with revenues and assets denominated in foreign currencies is partly hedged through the use of forward contracts and currency accounts. The use of forward currency contracts is described in Note 12.
Given the financial instruments in effect on 31 December 2019, a 10% fall in the value of the NOK would increase the
Group’s profit before tax by NOK 232,306,000 (2018: NOK 289,143,000). The Group’s most important currencies are the USD, EUR, GBP and JPY.
A 10% reduction in the exchange rate for each of these currencies as at 31 December 2019 would have had the following effect on the Group’s profit before tax:
Figures in 1,000 31.12.2019 31.12.2018
EUR 97,247 67,121
JPY 18,187 31,731
GBP -1,216 3,643
USD 125,032 191,997
Credit riskThe risk that counterparties do not have the financial strength to meet their obligations is considered low, since, historically, losses due to bad debts have been small. The Group has no material credit risk relating to individual coun-terparties or counterparties which may be considered a group due to similarities in the credit risk. The Group has guidelines to ensure that sales are made only to customers that have not previously had material payment problems, and that outstanding balances do not exceed fixed credit limits. Part of the total accounts receivable is insured. The gross credit risk on the balance sheet date corresponds to the Group’s receivables portfolio on the balance sheet date. See Note 13.
Liquidity riskLiquidity risk is the risk that the Group will not be able to meet its financial obligations as they fall due. Cash flow forecasts are drawn up on a regular basis and the Accounts Dept mon-itors rolling forecasts of the Group’s liquidity requirements to ensure that the Group has sufficient cash equivalents to meet operational liabilities, as well as at all times having adequate flexibility in the form of unused credit facilities (see Statement of Cash Flow), such that the Group does not infringe borrowing limits or specific borrowing conditions. The Group’s objective is to have sufficient cash, cash equiv-alents or medium-term credit facilities to meet its borrowing requirements in the short term. See Note 18 for details of the Group’s available credit facilities.
The table below details the Group’s non-derivative financial liabilities classified by maturity structure. The figures pre-sented in the table are undiscounted contractual cash flows. See Note 18 for details of the maturity structure.
106 Notes to the fiNaNcial statemeNts 2019

Maturity structure for financial liabilities as at 31 Dec 2019
Maturity Total 2020 2021 2022 2023 2024 After 2024
Long-term debt 2,901,563 149,992 573,396 135,197 1,475,197 488,138 79,643
Interest on long-term debt 257,726 82,648 70,410 58,450 36,151 8,965 1,103
Leasing liabilities 629,604 140,733 93,540 62,858 36,787 17,799 277,887
Interest on leasing liabilities 417,622 49,102 44,899 41,841 39,549 37,801 204,430
Short-term credit facilities 231,547 231,547 - - - - -
Interest on short-term debt 2,709 2,709 - - - - -
Trade payables 1,305,050 1,305,050 - - - - -
Total liabilities 5,745,821 1,961,781 782,245 298,346 1,587,684 552,703 563,063
Maturity structure for financial liabilities as at 31 Dec 2018
Maturity Total 2019 2020 2021 2022 2023 After 2023
Long-term debt 1,311,027 621,100 21,100 21,100 520,887 20,675 106,166
Interest on long-term debt 55,584 19,209 13,044 12,639 7,436 2,237 1,019
Leasing liabilities 343,794 14,328 14,265 11,508 8,715 10,767 284,210
Interest on leasing liabilities 443,463 41,691 41,120 40,444 39,678 38,729 241,801
Short-term credit facilities 112,484 112,484 - - - - -
Interest on short-term debt 995 995 - - - - -
Trade payables 1,194,760 1,194,760 - - - - -
Total liabilities 3,462,106 2,004,567 89,529 85,691 576,716 72,408 633,196
Payment termsThe normal payment terms for the Group’s trade payables is 30 days net, with the exception of payables relating to the purchase of feed which has a longer credit time.
See Note 18 for further details of the Group’s non-current liabilities.
Capital structure and equityThe objective of the Group’s capital management is to safe-guard the Group’s continued operations in order to secure a return on investment for shareholders and other stakehold-ers, and maintain an optimal capital structure for reducing capital costs. By ensuring a good debt-to-equity ratio the Group will support its business operations, and thereby max-imise the value of the Group’s shares.
The Group manages and makes changes to its capital struc-ture in response to an ongoing assessment of the financial conditions under which the business operates, and its short and medium-term outlook, including any adjustment in divi-dend payouts, buyback of treasury shares, capital reduction or issue of new shares. No changes were made in the guidelines covering this area in 2019.
The company monitors its capital management on the basis of the covenants stipulated. These are based on equity ratio and the ratio of net interest-bearing debt to EBITDA. See Note 18 for further details.
As at 31 December 2019, the Group had an equity ratio of 54.2 per cent (60.4 per cent as at 31 December 2018). At the close of 2019, the Group had a net interest-bearing debt of NOK 2,902,100 (2018: NOK 1,527,700). See Note 18 for further details of the Group’s net interest-bearing debt.
Assessment of fair valueThe table below shows financial instruments and liabilities at fair value in accordance with the valuation method. The various levels are defined as follows:
* Quoted price in an active market for an identical asset or liability (level 1)
* Valuation based on observable factors, either direct (price) or indirect (deduced from price) other than a quoted price (used in level 1) for the asset or liability concerned (level 2)
* Valuation based on factors which are not derived from observable markets (non-observable assumptions) (level 3)
The table below presents the Group’s assets and liabilities measured at fair value. See Note 12 for details of forward contracts and Fish Pool contracts measured at fair value level 2. See also Note 14 for details of biological assets measured at fair value in level 3.Derivatives
107

31 Dec 2019 NOK 1,000
Assets Level 1 Level 2 Level 3 Total
Derivatives
- Interest rate swap agreements - 13,418 - 13,418
- Currency derivatives built into customer contracts 15,652 15,652
- Forward currency contracts 34,343 34,343
Equity instruments
- Unlisted equity instruments - - 472 472
TOTAL assets - 47,761 16,124 63,884
Liabilities
Derivatives
- Forward currency contracts - 38,674 - 38,674
TOTAL liabilities - 38,674 - 38,674
31 Dec 2018 NOK 1,000
Assets Level 1 Level 2 Level 3 Total
Derivatives
- Interest rate swap agreements - 5,080 - 5,080
Equity instruments
- Unlisted equity instruments - - 394 394
TOTAL assets - 5,080 394 5,474
Liabilities
Derivatives
- Forward currency contracts - 123,958 - 123,958
TOTAL liabilities - 123,958 - 123,958
For debt instruments, interest-bearing debt and other finan-cial liabilities, fair value is practically the same as book value (amortised cost). The Group has “per tem” interest terms that
are deemed to equal the market rate on the balance sheet date. See Note 11 for further details. See Note 12 for further details of currency derivatives built into customer contracts.
Note 3 Segments
Operating segments are reported in the same way as they are reported internally to company management, which is responsible for the allocation of resources and the evaluation of the operating segments’ earnings.
The Group’s business comprises the farming of salmon and trout on the one hand, and its processing and sale on the other. The Group’s business in Iceland is reported as a sep-arate segment. Fish farming in Norway is divided into two regions, Fish Farming Central Norway and Fish Farming North-ern Norway, which are defined as separate segments, and are reported and administered as such internally. The Group’s hatchery operations are also included in these segments. In addition, a Sales & Processing segment reports separately. The Arnarlax segment in Iceland is a fully integrated aquacul-
ture company, with its own hatchery, sea farms, harvesting plant and sales force. This segment’s results are reported in total through the business segment Arnarlax. See Note 8 for further details of Arnarlax and its acquisition.
Group management evaluates the segments’ performance on the basis of Operational EBIT, as well as exceptional bio-logical events.
The column Other/Eliminations includes costs relating to options, R&D costs relating to jointly operated licences and overheads not allocated to segments. In addition, a portion of the depreciation relating to the Ocean Farm 1 installation has been transferred from Fish Farming Central Norway to this column. Depreciation corresponding to normal depreciation
108 Notes to the fiNaNcial statemeNts 2019

of an installation with the same capacity is recognised in the fish farming segment’s accounts. Depreciation other than this is transferred to Other/Eliminations.
Sales between segments are carried out in accordance with the arm’s length principle. When revenues from external par-ties are reported to group management, they are measured at the same amount recognised in profit and loss. Assets and liabilities allocated to segments are not reported to group management.
The Group is managed on the basis of figures reported in accordance with NGAAP. Deviations in profit and loss deriving from reporting in accordance with IFRS are presented in the column ‘GAAP difference’.
In the past two years, the company has had no individual customers which accounted for more than 10 per cent of the Group’s sales revenues.
2019 NOK 1,000
Fish Farming Central
Norway
Fish Farming Northern
NorwaySales &
Processing ArnarlaxGAAP
differenceOther/
EliminationsSalMar Group
External operating rev. - sale of goods and services 13,117 190,053 11,387,902 611,125 - - 12,202,197
Internal operating rev. - sale of goods and services 5,633,891 2,596,040 294,040 15,968 - -8,539,940 -0
TOTAL revenues from contracts with customers
5,647,008 2,786,094 11,681,942 627,094 - -8,539,940 12,202,197
Compensation 3,446 - 419 - - - 3,865
Leasing income 2,890 998 - - - - 3,888
Other operating revenues 17,057 1,612 16,257 - - -7,286 27,640
Total operating revenues 5,670,400 2,788,703 11,698,617 627,094 - -8,547,225 12,237,589
Depreciation 450,143 130,190 64,707 50,528 - 81,238 776,807
Write-downs - - 1,642 - - - 1,642
Operating expenses 3,055,639 1,727,155 11,507,829 476,439 - -8,375,517 8,391,545
Operational EBIT 2,164,618 931,358 124,440 100,126 - -252,947 3,067,597
Fair value adjustments - - - -32,995 - -32,995
Operating profit/loss 2,164,618 931,358 124,440 100,126 -32,995 -252,947 3,034,601
Share of profit/loss from associates 118,655
Net financial items 5,108
Profit before tax 3,158,365
Tax 613,877
Net profit for the year 2,544,487
Year’s investments in PP&E 586,070 199,322 390,003 108,844 0 2,029 1,286,268
Year’s investments in right-to-use assets 17,455 0 6,710 - 0 0 24,165
Year’s investments in businesses 0 0 0 179,777 0 0 179,777
109
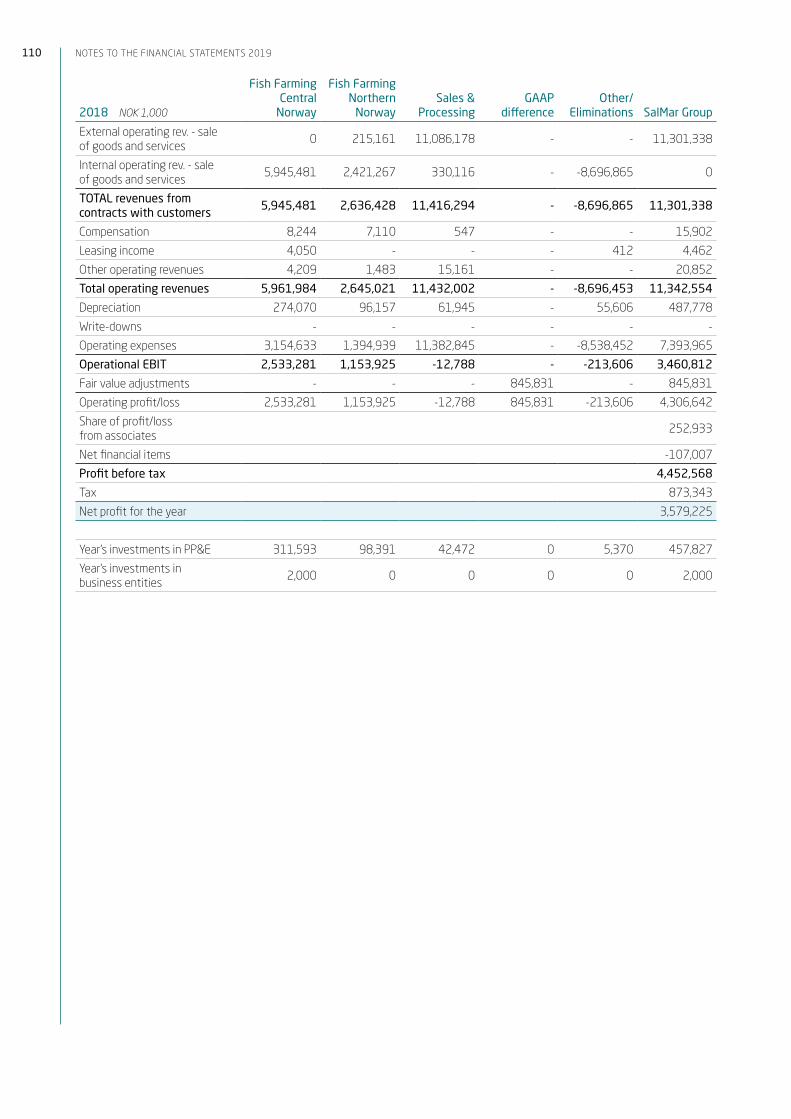
2018 NOK 1,000
Fish Farming Central
Norway
Fish Farming Northern
NorwaySales &
ProcessingGAAP
differenceOther/
Eliminations SalMar Group
External operating rev. - sale of goods and services 0 215,161 11,086,178 - - 11,301,338
Internal operating rev. - sale of goods and services 5,945,481 2,421,267 330,116 - -8,696,865 0
TOTAL revenues from contracts with customers
5,945,481 2,636,428 11,416,294 - -8,696,865 11,301,338
Compensation 8,244 7,110 547 - - 15,902
Leasing income 4,050 - - - 412 4,462
Other operating revenues 4,209 1,483 15,161 - - 20,852
Total operating revenues 5,961,984 2,645,021 11,432,002 - -8,696,453 11,342,554
Depreciation 274,070 96,157 61,945 - 55,606 487,778
Write-downs - - - - - -
Operating expenses 3,154,633 1,394,939 11,382,845 - -8,538,452 7,393,965
Operational EBIT 2,533,281 1,153,925 -12,788 - -213,606 3,460,812
Fair value adjustments - - - 845,831 - 845,831
Operating profit/loss 2,533,281 1,153,925 -12,788 845,831 -213,606 4,306,642
Share of profit/loss from associates 252,933
Net financial items -107,007
Profit before tax 4,452,568
Tax 873,343
Net profit for the year 3,579,225
Year’s investments in PP&E 311,593 98,391 42,472 0 5,370 457,827
Year’s investments in business entities 2,000 0 0 0 0 2,000
110 Notes to the fiNaNcial statemeNts 2019

Note 4 Intangible assets
NOK 1,000 Licences GoodwillOther intangible
assets TOTAL
Acquisition cost 1 Jan 2018 2,402,597 464,855 123,394 2,990,847
Additions 453,591 0 34,579 488,170
Additions upon business acquisitions 0 0 7,177 7,177
Acquisition cost 31 Dec 2018 2,856,188 464,855 165,150 3,486,194
Additions 0 0 61,130 61,130
Additions upon business acquisitions 1,267,498 0 0 1,267,498
Translation differences 25,116 0 0 25,116
Acquisition cost 31 Dec 2019 4,148,803 464,855 226,280 4,839,939
Acc. dep. and write-downs 1 Jan 2018 21,000 18,390 26,481 65,872
Year’s depreciation 0 0 16,371 16,371
Acc. dep. and write-downs 31 Dec 2018 21,000 18,390 42,852 82,242
Year’s depreciation 0 0 15,763 15,763
Acc. dep. and write-downs 31 Dec 2019 21,000 18,390 58,615 98,005
Book value 31 Dec 2019 4,127,803 446,465 167,665 4,741,932
Book value 31 Dec 2018 2,835,188 446,465 122,298 3,403,951
Book value 1 Jan 2018 2,381,597 446,465 96,913 2,924,975
Economic life Unlimited Unlimited 5-50 years
Depreciation plan Straight-line
Other intangible assets totalling NOK 167.7 million are made up almost entirely of capitalised R&D costs. NOK 38.4 million of these are associated with the development of the Ocean Farm 1 installation. These costs are depreciated over 5 years. In addition, NOK 102.9 million are capitalised costs relating to the development of the Group’s new Smart Fish Farm.
This project is in a development phase and depreciation has not yet commenced. In addition, the capitalised amount includes excess value relating to the purchase of breeding nuclei. Breeding nuclei are depreciated over 50 years and their residual value as at 31 December 2019 was NOK 24.4 million.
Specification of fish farming licences 2019 NOK 1,000No. of
licences MAB tonnesAcquisition
costBook value
31.12.2019
Fish Farming Northern Norway 32 33,406 1,212,914 1,207,914
Fish Farming Central Norway 68 53,611 1,643,274 1,627,274
Norway 100 87,017 2,856,188 2,835,188
Iceland 25,200 1,267,498 1,292,616
Group 112,217 4,123,686 4,127,803
Arnarlax has permission to produce 25,200 tonnes MAB in Iceland’s Westfjords region. In Iceland, licences are granted for a period of 16 years before renewal is required. Of the total MAB, 3,000 tonnes must be renewed in the course of 2022, 10,000 tonnes in the course of 2026, and 12,200 tonnes in the course of 2029.
In 2016, the Group was also granted 8 development licences for use in connection with its Ocean Farm 1 offshore sea farm. The installation went into operation in the autumn of 2017, and the first generation produced there was fully harvested
out in January 2019. An application will be made to convert these licences into ordinary production licences in 2020.
In 2019, SalMar – via the company Mariculture AS – was finally granted a further 8 development licences by the Norwegian Directorate of Fisheries to further develop the Smart Fish Farm concept, a specially designed deepwater installation for the farming of fish in the open sea. See above.
Apart from this, the Group has 1 time-limited licence as well as partnership agreements relating to 11 licences.
111

Specification of fish farming licences 2018 NOK 1,000No. of
licences MAB tonnesAcquisition
costBook value
31.12.2018
Fish Farming Northern Norway 32 33,406 1,212,914 1,207,914
Fish Farming Central Norway 68 53,611 1,643,274 1,627,274
100 87,017 2,856,188 2,835,188
The NOK 453.6 million increase in the cost of licences in 2018 relates to investment in 2,886 tonnes MAB. NOK 90.5 million was invested as consideration for 754 tonnes MAB in connection with the award of a 2 per cent increase in capacity that was undertaken during the year. In addition, NOK 363.1 million was invested as consideration for 2,132 tonnes MAB in connection with an auction carried out in 2018.
In 2016, the Group was also granted 8 development licences for use in connection with its Ocean Farm 1 offshore sea farm. The installation went into operation in the autumn of 2017, and the first generation produced there was fully harvested out in January 2019.
Apart from this, the Group had 2 time-limited licences as well as partnership agreements relating to 10 licences.
Specification of goodwill 2019 NOK 1,000 Acquisition year Acquisition cost Book value 31.12.2019
Fish Farming Northern Norway 2006 95,114 95,114
Fish Farming Central Norway 1999-2014 357,818 351,351
452,932 446,465
Specification of goodwill 2018 NOK 1,000 Acquisition year Acquisition cost Book value 31.12.2018
Fish Farming Northern Norway 2006 95,114 95,114
Fish Farming Central Norway 1999-2014 357,818 351,351
452,932 446,465
Annual testing for impairment of licences and goodwillGoodwill and licences that are defined as having an inde-terminate usable life are not depreciated, but are tested annually for impairment.
In Iceland, licences are granted for a period of 16 years before they must be renewed. The licences will be renewed if the applicant meets the requirements set pursuant to statute and regulation at the time the licence comes up for renewal. A small charge must be paid for the licence’s renewal. SalMar has elected to presume that these licences have an indeter-minate life. They are therefore not depreciated, but are tested annually for impairment.
It is the book value of the cash-flow generating entities that is tested for impairment either annually or more frequently if
there are indications that a write-down is needed. The book value of, respectively, licences and goodwill are compared with their recoverable value. Recoverable value is the higher of value in use or fair value less sales costs.
SalMar has identified the Group’s segments as cash-flow generating entities. In connection with acquisitions, good-will and intangible assets are allocated to the cash-flow generating entity within the Group to which they belong. The cash-flow generating entities are the lowest level in which independent cash flows can be identified, and are not higher than the Group’s geographically determined marine-phase production segments (Fish Farming Central Norway and Fish Farming Northern Norway), Sales and Processing, and the Group’s activities in Iceland.
Cash-flow generating entity NOK 1,000 Goodwill Licences Total 31.12.2019
Fish Farming Northern Norway 95,114 1,207,914 1,303,028
Fish Farming Central Norway 351,351 1,627,274 1,978,625
Arnarlax - Iceland - 1,292,616 1,292,616
446,465 4,127,803 4,574,268
112 Notes to the fiNaNcial statemeNts 2019

Impairment is tested by calculating the present value of future cash flows (estimated value in use) in the cash-flow generating entity, and comparing it with the book value of its capital employed. A write-down is performed if the book value exceeds estimated value in use.
Future net cash flows are estimated on the basis of the Group’s budget and forecasts for the next three years. No real growth is assumed when calculating the terminal value, ie growth is stipulated at the expected rate of inflation. Value in use is calculated on the basis of a 6.5 per cent return on investment after tax. The same return on investment is required for all cash-flow generating entities. As with all estimates, cash flow forecasts are sensitive to changes in underlying assumptions.
Estimated value in use will be affected most strongly by the following assumptions:
• Discount rate• EBIT margin per kg
• Salmon price• Production costs
• Estimated future harvested volume• Level of investment
Discount rate: the discount rate used reflects management’s estimate of the risk specified for each cash-flow generating entity. The discount rate is set using the 10-year govern-ment bond rate in effect at the time of the assessment. The discount rate after tax is calculated at 6.5 per cent. This corresponds to a pre-tax requirement of 8.3 per cent.
EBIT margin per kg: EBIT per kg is highly volatile with respect to changes in salmon prices. Salmon price estimates are based on the actual long-term price level in the market in which the fish is sold. Estimates for production cost are based on historic figures, adjusted for known changes. Since the long-term net margin used in the assessment is deemed to be lower than last year’s EBIT per kg, a normalised long-term EBIT per kg has been used.
Future harvested volume: future harvested volumes are esti-mated on the basis of current production and harvesting plans, adjusted for expected increases in future output given current licences.
Based on the above assessments, there were no grounds for any write-down of the book values of fish farming licences or goodwill as at 31 December 2019 or 31 December 2018. All segments have a materially positive difference between the calculated recoverable value and book value.
Sensitivity analysisThe assessment is based on a comparison of the present value of estimated future cash flows and the book value of each cash-flow generating entity. Sensitivity analyses are also carried out to assess estimated present values by looking at the change in salmon prices, production costs and, thereby, net margins and discount rates.
The table below shows how much the assumptions under-pinning the calculation must change for the calculations to result in break-even.
Cash-flow generating entity Fish Farming Northern Norway Fish Farming Central Norway Arnarlax, Iceland
EBIT margin pr kg (NOK) -14.10 -16.20 -4.30
Discount rate after tax 6.58% 10.83% 1.75%
113

Note 5 Property, plant & equipment
NOK 1,000
Land, buildings & other real
property
Plant, operating equipment,
fixtures, etc
Vessels and other operating
assets TOTAL
Of which leased operating
assets
Acquisition cost 1 Jan 2018 1,224,204 3,898,996 529,348 5,652,548 566,621
Additions 126,115 254,450 77,261 457,827 0
Disposals 0 2,587 0 2,587 0
Acquisition cost 31 Dec 2018 1,350,319 4,150,860 606,610 6,107,789 566,621
Acc. acquis. cost 1 Jan 2019 - leases reclassified as right-to-use assets (Note 6) 203,615 49,052 313,954 566,621
Additions resulting from business transfers 0 193,836 117,884 311,720
Additions 123,761 590,648 571,858 1,286,268
Disposals 0 370 0 370
Translation differences 0 5,084 1,594 6,677
Acquisition cost 31 Dec 2019 1,270,466 4,891,006 983,992 7,145,463
Acc. dep. & write-downs 1 Jan 2018 194,152 1,584,473 269,154 2,047,779 210,585
Year’s depreciation 55,898 334,657 80,852 471,407 41,002
Reversed depreciation on exit of subsidiaries and minority interests 0 2,887 0 2,887 592
Acc. dep. & write-downs 31 Dec 2018 250,050 1,916,243 350,007 2,516,300 250,994
Acc. acquis. cost 1 Jan 2019 - leases reclassified as right-to-use assets (Note 6) 134,171 40,672 76,151 250,994 0
Year’s depreciation 65,885 387,343 55,663 508,890 0
Year’s write-downs 0 1,550 92 1,642 0
Translation differences 0 -349 53 -295 0
Acc. dep. & write-downs 31 Dec 2019 181,764 2,264,115 329,664 2,775,542 0
Book value 31 Dec 2019 1,088,701 2,626,891 654,328 4,369,921 0
Book value 31 Dec 2018 1,100,269 2,234,617 256,604 3,591,490 315,627
Book value 1 Jan 2018 1,030,052 2,314,523 260,194 3,604,770 357,181
Economic life 5-33 years 5-25 years 3-15 years
Depreciation plan Straight-line Straight-line Straight-line
Gains/losses on sale of non-current assets 0 0 0 0
Book value 31 Dec 2018 - leases reclassified as right-to-use assets 69,444 8,380 237,803 315,627
Annual leasing of off-balance sheet operating assets 2018 24,955 17,770 369,865 412,590
As at 31 December 2019, the company had capitalised a total of NOK 477,052,000 in connection with work on investment projects that had not been completed and put into operation, and where depreciation had not commenced. This breaks down into NOK 463,094,000 for real property and NOK 13,958,000 for plant and equipment. As at 31 December 2018, the Group had correspondingly capital-ised NOK 220,335,000 in work on investment projects that had not been completed and put into operation, and where depreciation had not commenced. This broke down into NOK
104,587,000 for real property, NOK 68,098,000 for plant and equipment, and NOK 47,650,000 for vessels and other operating assets.
As a result of the implementation of IFRS 16 Leases, leased operating assets that used to be capitalised under IAS 17 were transferred to a new Note 6 with effect from 2019. The book value of the transferred assets totalled NOK 315,627,000 as at 1 January 2019.
114 Notes to the fiNaNcial statemeNts 2019

Note 6 Leases
Right-to-use assetsWith effect from 1 January 2019, the Group has implemented IFRS 16 Leases. IFRS 16 sets out principles for the recogni-tion, measurement, presentation and disclosure of leasing agreements. The standard requires the lessee to recognise right-to-use assets and leasing liabilities in the balance sheet. The new standard requires the lessee to recognise assets and liabilities for the majority of leasing agreements. An exception is made for short leases with a term of less than 12 months and for leases relating to assets with a low under-lying value. Previously, under IAS 17, only financial leasing agreements were recognised in the balance sheet.
SalMar has elected to use the modified retrospective method and simplification option, under which the value of right-to-use assets is set as equal to the calculated leasing liability on the implementation date. Comparable figures have not been restated. Leases that were previously recognised in accordance with IAS 17 have been reclassified in the balance sheet as right-to-use assets with effect from 1 January 2019.
The Group leases a variety of different categories of asset whose leasing agreements have been recognised as an asset with associated liabilities. Material leases relating to office space and installations, for example the InnovaMar production facility in Frøya, have been entered into. Material leases also relate to wellboats, service boats, machinery and equipment. In addition, the Group has leases lasting less than 12 months and leases relating to assets of low value. These are recognised in profit and loss on an ongoing basis. The Group has defined assets of low value to be assets whose leasing cost is less than NOK 500,000 per year.
See Note 31 for details of the consequences arising from implementation of IFRS 16.
The Group’s right-to-use assets are categorised and pre-sented in the table below:
NOK 1,000
Land, buildings & other real
property
Plant, operating equipment,
fixtures, etc
Vessels and other operating
assets TOTAL
Reclassification - leases previously recognised in the balance sheet in accordance with IAS 17 (Note 5) 203,615 49,052 313,954 566,621
Implementation - leases recognised in the balance sheet in accordance with IFRS 16 27,167 120,336 237,051 384,553
Additions resulting from business transfers 1,591 0 30,153 31,745
Adjustment following regulation of contracts 0 0 6,487 6,487
Additions 0 6,710 17,455 24,165
Translation differences 0 0 -724 -724
Acquisition cost 31 Dec 2019 232,373 176,098 604,376 1,012,847
Reclassification - leases previously recognised in the balance sheet in accordance with IAS 17 (Note 5) 134,171 40,672 76,151 250,994
Year’s depreciation 23,280 50,047 118,826 192,153
Acc. dep. & write-downs 31 Dec 2019 157,451 90,719 194,977 443,147
Book value 31 Dec 2019 74,922 85,378 409,399 569,700
Book value 1 Jan 2019 96,611 128,715 474,854 700,180
Lowest remaining leasing period or economic life 2 - 13 years 1 - 5 years 1 - 9 years
Depreciation method Straight-line Straight-line Straight-line
115

In 2013, the Group renegotiated the InnovaMar leasing agreement in connection with the sale of its shares in the company that owns the factory. Recognition in the balance sheet is based on an expectation that the lessor will demand that SalMar acquire the property after the lease expires. In connection with the renegotiation, the leasing period was extended from 15 to 20 years, with an option to extend after the expiry of the agreement in return for a reduced annual leasing cost. The lessor has, furthermore, the right but not the obligation to demand that SalMar, as tenant, acquires the property after the expiry of the agreement for
the sum of NOK 70 million. The change in the terms of the leasing agreement means that the building and the leasing liability have been recognised in the balance sheet with effect from 1 October 2013. In total, the property was recognised in the balance sheet at a value of NOK 222.7 million as at 31 December 2019. The investment breaks down into the components building, technical installation and land. The portion allocated to buildings is depreciated over 30 years. Correspondingly, the portion allocated to technical installa-tions is depreciated over 13 years. Land is not depreciated.
Other leasing liabilities recognised in profit and loss NOK 1,000 2019
Costs relating to leases lasting less than 12 months 61,987
Costs relating to leases of low value 15,847
Total leasing costs included in other operating expenses 77,834
Costs relating to short leases apply largely to the ad hoc hiring of service boats. Leases for low-value assets relate largely to the rental of real property, such as onshore bases, warehousing, quays and employee housing, as well as the leasing of various items of equipment.
Breakdown of associated leasing liabilities NOK 1,000 2019
Leasing liability 1 Jan 2019 - previously recognised in the balance sheet in accordance with IAS 17 343,392
Implementation 1 jan 2019 - leasing liability recognised in the balance sheet in accordance with IFRS 16 384,553
Additions resulting from business transfers 31,745
New leasing liabilities recognised in the period 24,165
Adjustment of leasing liability 6,487
Payment of instalments and interest -213,522
Interest expenses relating to the leasing liability 52,784
Total leasing liability 31 Dec 2019 629,604
Short-term leasing liabilities 140,733
Long-term leasing liabilities 488,871
Total leasing liability 629,604
Cash flow relating to leasing liabilities in the period NOK 1,000 2019
Paid instalments on recognised leasing liabilities -160,738
Paid interest on recognised leasing liabilities -52,784
Leasing liabilities charged to expenses in the period -77,834
Total cash flow relating to leasing liabilities -291,356
See Note 2 for details of the leases’ maturity structure.
116 Notes to the fiNaNcial statemeNts 2019
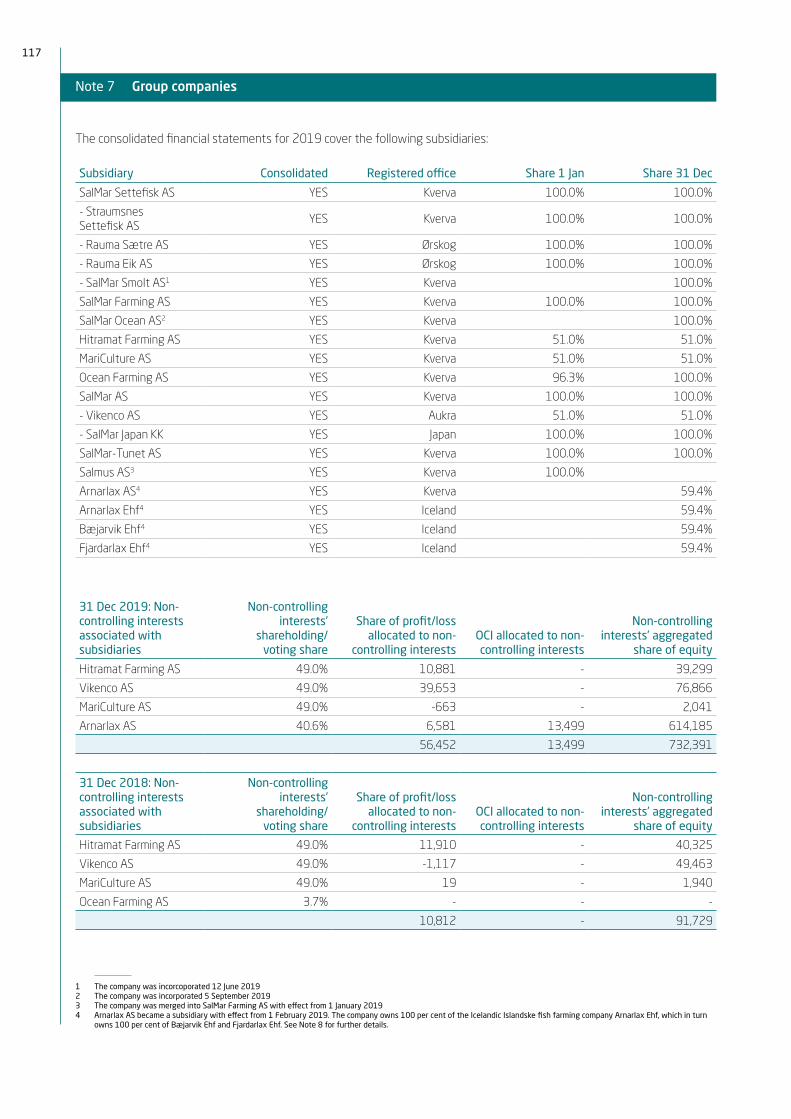
Note 7 Group companies
1 The company was incorcoporated 12 June 20192 The company was incorporated 5 September 20193 The company was merged into SalMar Farming AS with effect from 1 January 20194 Arnarlax AS became a subsidiary with effect from 1 February 2019. The company owns 100 per cent of the Icelandic Islandske fish farming company Arnarlax Ehf, which in turn
owns 100 per cent of Bæjarvik Ehf and Fjardarlax Ehf. See Note 8 for further details.
The consolidated financial statements for 2019 cover the following subsidiaries:
Subsidiary Consolidated Registered office Share 1 Jan Share 31 Dec
SalMar Settefisk AS YES Kverva 100.0% 100.0%
- Straumsnes Settefisk AS YES Kverva 100.0% 100.0%
- Rauma Sætre AS YES Ørskog 100.0% 100.0%
- Rauma Eik AS YES Ørskog 100.0% 100.0%
- SalMar Smolt AS1 YES Kverva 100.0%
SalMar Farming AS YES Kverva 100.0% 100.0%
SalMar Ocean AS2 YES Kverva 100.0%
Hitramat Farming AS YES Kverva 51.0% 51.0%
MariCulture AS YES Kverva 51.0% 51.0%
Ocean Farming AS YES Kverva 96.3% 100.0%
SalMar AS YES Kverva 100.0% 100.0%
- Vikenco AS YES Aukra 51.0% 51.0%
- SalMar Japan KK YES Japan 100.0% 100.0%
SalMar-Tunet AS YES Kverva 100.0% 100.0%
Salmus AS3 YES Kverva 100.0%
Arnarlax AS4 YES Kverva 59.4%
Arnarlax Ehf4 YES Iceland 59.4%
Bæjarvik Ehf4 YES Iceland 59.4%
Fjardarlax Ehf4 YES Iceland 59.4%
31 Dec 2019: Non-controlling interests associated with subsidiaries
Non-controlling interests’
shareholding/voting share
Share of profit/loss allocated to non-
controlling interestsOCI allocated to non-controlling interests
Non-controlling interests’ aggregated
share of equity
Hitramat Farming AS 49.0% 10,881 - 39,299
Vikenco AS 49.0% 39,653 - 76,866
MariCulture AS 49.0% -663 - 2,041
Arnarlax AS 40.6% 6,581 13,499 614,185
56,452 13,499 732,391
31 Dec 2018: Non-controlling interests associated with subsidiaries
Non-controlling interests’
shareholding/voting share
Share of profit/loss allocated to non-
controlling interestsOCI allocated to non-controlling interests
Non-controlling interests’ aggregated
share of equity
Hitramat Farming AS 49.0% 11,910 - 40,325
Vikenco AS 49.0% -1,117 - 49,463
MariCulture AS 49.0% 19 - 1,940
Ocean Farming AS 3.7% - - -
10,812 - 91,729
117

Note 8 Business combinations
Acquisitions in 2019Arnarlax ASOn 14 February 2019, the Group acquired 3,328,670 shares in Arnarlax AS, corresponding to 12.28 per cent of the com-pany’s shares. Prior to this transaction, SalMar owned 41.95 per cent of Arnarlax’s shares and had a considerable influ-ence over the company. The investment was classified as an associate in accordance with the equity method until the date on which control was achieved. On that date, the entire investment in Arnarlax was deemed to have been realised and a new cost price established. The investment’s fair value when control was achieved totalled NOK 614.0 million, and a gain of NOK 225.9 million was recognised in the period. NOK 4.4 million of this amount derives from translation dif-ferences that have been reclassified to profit and loss in the period. The gain is classified as financial income in the Income Statement.
After the transaction, SalMar owned 54.23 per cent of the shares in Arnarlax AS. For accounting purposes, the trans-action was treated as a business transfer with effect from 1 February 2019. The company’s functional currency is the EUR.
Arnarlax AS owns 100 per cent of the shares in Arnarlax Ehf. Arnarlax Hf is Iceland’s largest salmon farmer, and is located in the country’s Westfjords region. The company was estab-lished in Iceland in 2009, and harvested its first fish in 2016. It is a fully integrated salmon farming operation, with its own hatchery, sea farms, wellboat, harvesting plant and sales force. Strategically, the transaction represents a natural next step for SalMar, since the Group wishes to further develop Arnarlax and salmon farming in Iceland going forward. Sal-Mar paid NOK 179.8 million for the shares, corresponding to NOK 55.00 per share. Allocation of the consideration paid is presented in the table below and must be deemed to be final.
NOK 1,000 No. of shares ShareholdingCost price of shares at
group establishment
Fair value of existing shareholding in Arnarlax before control achieved 11,163,611 41.95% 613,999
Cash consideration paid for shares at transaction of 14 Feb 2019 3,268,670 12.28% 179,777
Fair value of the Group’s shareholding in Arnarlax when control achieved 14,432,281 54.23% 793,775
Transaction costs totalling NOK 2.4 million have accrued in connection with the acquisition. The transaction costs are recognised in profit and loss in the year of acquisition.
Effect on the balance sheet of the acquisition NOK 1,000 Book valueAdjustment to
fair value Fair value
Licences 221,267 1,046,231 1,267,498
Property, plant & equipment 331,946 -20,147 311,799
Right-to-use assets 31,745 - 31,745
Other non-current assets 20,491 - 20,491
Biological assets 525,279 -88,922 436,357
Other current assets 53,707 -632 53,075
Cash & cash equivalents 4,594 - 4,594
Deferred tax assets/liabilities 24,869 -215,389 -190,520
Other non-current liabilities -301,589 - -301,589
Leasing liabilities -31,745 - -31,745
Current liabilities -137,932 - -137,932
Net identifiable assets and liabilities 742,631 721,141 1,463,772
Fair value of shareholding before control acheived -613,999
Non-controlling interests -669,997
Cash consideration 179,777
118 Notes to the fiNaNcial statemeNts 2019

Subsequent changes in non-controlling interestsIn accordance with a shareholders’ agreement, the acquisition triggered a compulsory offer to the remaining non-controlling shareholders in Arnarlax AS. The shareholders were offered a price per share of NOK 55.78. The offer period expired on 10 April 2019, at which time SalMar acquired a further 2,006,630 shares in Arnarlax AS, corresponding to 7.54 per cent of the shares. Following this transaction, SalMar owned 61.77 per cent of the shares in Arnarlax AS. The non-con-trolling interests were thereby reduced and a consideration of NOK 111.9 million was recognised in equity.
In August 2019, SalMar sold 2.41 per cent of its shares in Arnarlax AS to Gyda Ehf for NOK 55.78 per share. The trans-action resulted in an increase in non-controlling interests, and a total consideration of NOK 35.7 million has been recognised in equity. The consideration was settled in the form of a sell-er’s credit to Gyda Ehf (see Note 13 for further details). The
company is owned by Kjartan Olafsson who chairs Arnarlax AS’s board of directors. Following the transaction, SalMar owns 59.36 per cent of the shares in Arnarlax AS.
Acquisitions in 2018MariCulture ASOn 11 April 2018, the Group agreed the acquisition of 51 per cent of the shares in MariCulture AS. For accounting purposes, the transaction was treated as a business trans-fer. The purpose of the acquisition was to secure access to technology developed by MariCulture AS. The company engages in activities in the field of aquaculture and has applied for development licences for the “Smart Fish Farm” concept, a deepwater installation that will make it possible to farm fish in the open ocean. No material transaction costs were associated with the acquisition. A breakdown of the consideration paid for the shareholding is presented below.
Effect on the balance sheet of the acquisition NOK 1,000 Book value Adjustment to fair value Fair value
Intangible assets - 7,177 7,177
Current assets - - -
Cash & cash equivalents 24 - 24
Deferred tax - -1,162 -1,162
Non-current liabilities -555 -555
Other current liabilities -1,562 - -1,562
Net identifiable assets and liabilities -2,093 6,014 3,922
Non-controlling interests 1,922
Cash consideration 2,000
Note 9 Non-controlling interests
Change in non-controlling interests in 2018 and 2019In 2018, the Group acquired a 2.9 per cent shareholding in Ocean Farming AS from non-controlling interests in the company. The consideration totalled NOK 5.0 million, and non-controlling interests in the company were reduced from 6.6 per cent to 3.7 per cent. In 2019, the Group bought out the last 3.7 per cent of non-controlling interests for a con-sideration of NOK 7.0 million.
Following the date of group establishment for Arnarlax AS, there have been changes in non-controlling interests. See Note 8 for further details.
119

Note 10 Associates
The Group has the following investments in associates as at 31 Dec 2019:
Company Registered office Sector Shareholding 1 Jan Shareholding 31 Dec
Norskott Havbruk AS Bergen Fish Farming 50.00% 50.00%
SalMar Genetics AS Rauma Genetics/breeding 50.00% 50.00%
Kirkenes Processing AS Kirkenes Salmon harvesting 50.00% 50.00%
Romsdal Processing AS Molde Harvesting & processing 44.45% 44.45%
Yu Fish Ltd Singapore Sales - 45.30%
Eldisstødin Isthor Hf Island Smolt production - 50.00%
All associates are recognised in accordance with the equity method. Since none of the Group’s associates is listed on a stock exchange, no observable market values are available.
Companies recognised in accordance with the equity method NOK 1,000
Norskott Havbruk AS Arnarlax AS Other TOTAL
Opening balance 1 Jan 2019 761,141 402,684 25,149 1,188,971
- of which undepreciated excess value 0 2,689 2,689
- of which undepreciated goodwill 0 3,421 3,421
Additions of shares at cost 0 0 24,025 24,025
Additions of shares through acquisitions 0 0 20,491 20,491
Share of the year’s profit/loss 106,492 636 11,527 118,655
Items recognised in other comprehensive income 21,878 -10,001 758 12,636
Other changes 0 -855 1,164 309
Dividend received -252,900 0 -1,904 -254,804
Disposal of shares 0 -392,463 0 -392,463
Closing balance 31 Dec 2019 636,612 0 81,210 717,819
Arnarlax ASUntil 1 February 2019, SalMar had a considerable influ-ence over Arnarlax AS, and the investment was treated for accounting purposes as an associate in accordance with the equity method. From 1 February 2019, the Group went from a shareholding of 41.95 per cent to 54.23 per cent, giving it control of the company. On the date that control was achieved, SalMar’s shares in the associate were consid-ered to have been realised and a gain recognised. Arnarlax AS is consolidated into SalMar’s financial statements with effect from the date of group establishment. See Note 8 for further details.
Eldisstødin Isthor HfThrough the acquisition of Arnarlax, the Group acquired 50 per cent of Eldisstødin Isthor Hf. At the time of Arnarlax AS’s acquisition, Isthor was valued at NOK 20,491,000. Through the acquisition, the Group has considerable control over the company, and the investment is treated for accounting pur-poses as an associate in accordance with the equity method.
Yu Fish LtdIn January 2019, the Group agreed to purchase 45.3 per cent of the shares in Yu Fish Ltd, thus obtaining a consid-erable influence over the company. A consideration of NOK 24,025,000 was paid for the shares. Yu Fish Ltd engages in the sale of seafood products and is located in Singapore. The investment is classified as an associate in and is recognised in accordance with the equity method.
120 Notes to the fiNaNcial statemeNts 2019

Companies recognised in accordance with the equity method NOK 1,000 Norskott Havbruk AS Arnarlax AS Other TOTAL
Opening balance 1 Jan 2018 746,739 251,535 25,525 1,023,796
Additions of shares 0 160,070 0 160,070
Share of the year’s profit/loss 264,993 -11,683 -376 252,933
Items recognised in other comprehensive income -8,390 2,762 0 -5,627
Dividend received -242,200 0 0 -242,200
Closing balance 31 Dec 2018 761,141 402,684 25,149 1,188,971
Material associatesBased on an overall assessment, in which size and complexity have been taken into account, Norskott Havbruk AS is con-sidered to be a material associate. In 2018, Arnarlax AS was defined as a material associate. See the description above and in Note 8 for further details.
Further details relating to Norskott Havbruk AS are pre-sented below.
The following table shows a summary of financial informa-tion relating to material associates, based on 100% figures:
Norskott Havbruk AS Arnarlax AS
NOK 1,000 2019 2018 2018
Operating revenues 1,834,449 2,057,006 400,360
Operating expenses 1,542,506 1,396,202 479,240
Fair value adjustments -48,015 -9,985 82,544
Net profit/loss 212,984 529,985 -29,273
Current assets 1,048,123 1,303,476 574,897
Non-current assets 1,598,027 1,330,163 655,755
Current liabilities 360,869 336,395 366,254
Non-current liabilities 1,011,663 774,567 104,908
Equity 1,273,618 1,522,677 1,230,653
The Group’s share of equity 636,809 761,339 318,578
Book value 31 Dec 636,612 761,141 402,684
Norskott Havbruk ASLocated in Bergen, Norskott Havbruk AS is a holding company that owns 100 per cent of Scottish Sea Farms Ltd, the second largest aquaculture company in the UK, with operations in mainland Scotland and Shetland.
Norskott Havbruk is 50/50 owned by SalMar ASA and Lerøy Seafood AS. The board of directors has 4 members, with each shareholder represented by 2 directors. The shareholders alternate in having the board’s chair. Since neither of the company’s owners has overall control, it is considered to be an associate.
121
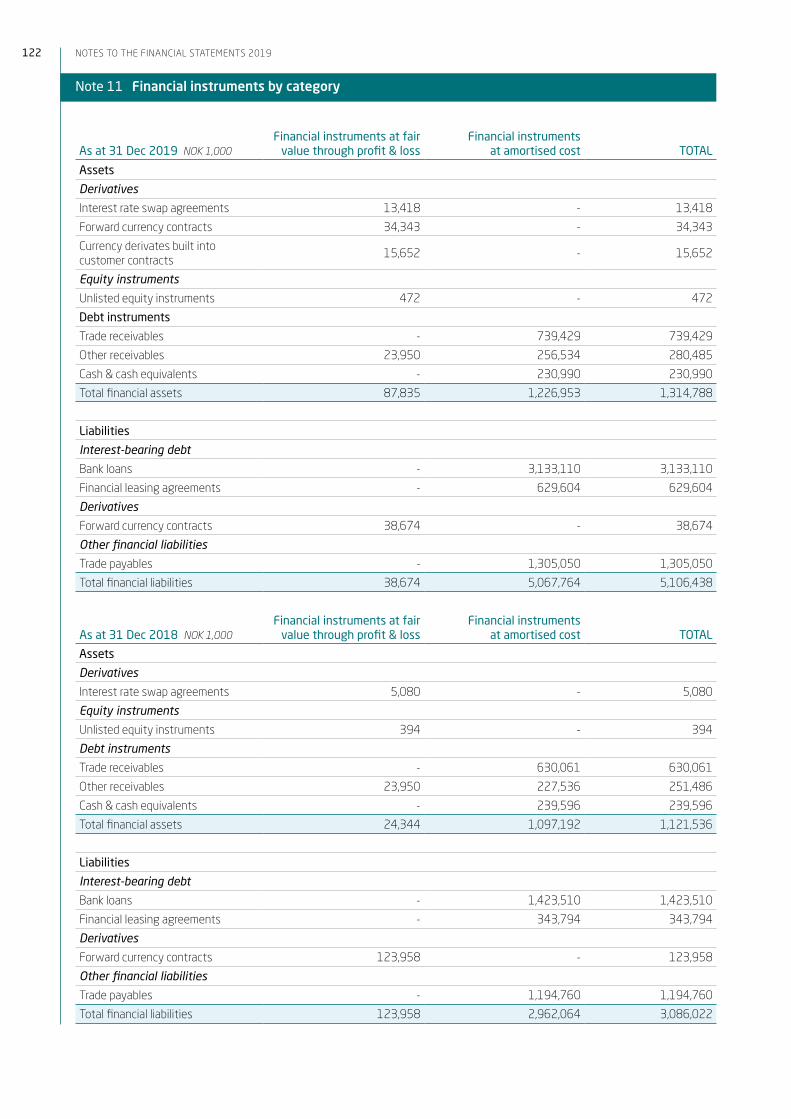
Note 11 Financial instruments by category
As at 31 Dec 2019 NOK 1,000Financial instruments at fair
value through profit & lossFinancial instruments
at amortised cost TOTAL
Assets
Derivatives
Interest rate swap agreements 13,418 - 13,418
Forward currency contracts 34,343 - 34,343
Currency derivates built into customer contracts 15,652 - 15,652
Equity instruments
Unlisted equity instruments 472 - 472
Debt instruments
Trade receivables - 739,429 739,429
Other receivables 23,950 256,534 280,485
Cash & cash equivalents - 230,990 230,990
Total financial assets 87,835 1,226,953 1,314,788
Liabilities
Interest-bearing debt
Bank loans - 3,133,110 3,133,110
Financial leasing agreements - 629,604 629,604
Derivatives
Forward currency contracts 38,674 - 38,674
Other financial liabilities
Trade payables - 1,305,050 1,305,050
Total financial liabilities 38,674 5,067,764 5,106,438
As at 31 Dec 2018 NOK 1,000Financial instruments at fair
value through profit & lossFinancial instruments
at amortised cost TOTAL
Assets
Derivatives
Interest rate swap agreements 5,080 - 5,080
Equity instruments
Unlisted equity instruments 394 - 394
Debt instruments
Trade receivables - 630,061 630,061
Other receivables 23,950 227,536 251,486
Cash & cash equivalents - 239,596 239,596
Total financial assets 24,344 1,097,192 1,121,536
Liabilities
Interest-bearing debt
Bank loans - 1,423,510 1,423,510
Financial leasing agreements - 343,794 343,794
Derivatives
Forward currency contracts 123,958 - 123,958
Other financial liabilities
Trade payables - 1,194,760 1,194,760
Total financial liabilities 123,958 2,962,064 3,086,022
122 Notes to the fiNaNcial statemeNts 2019
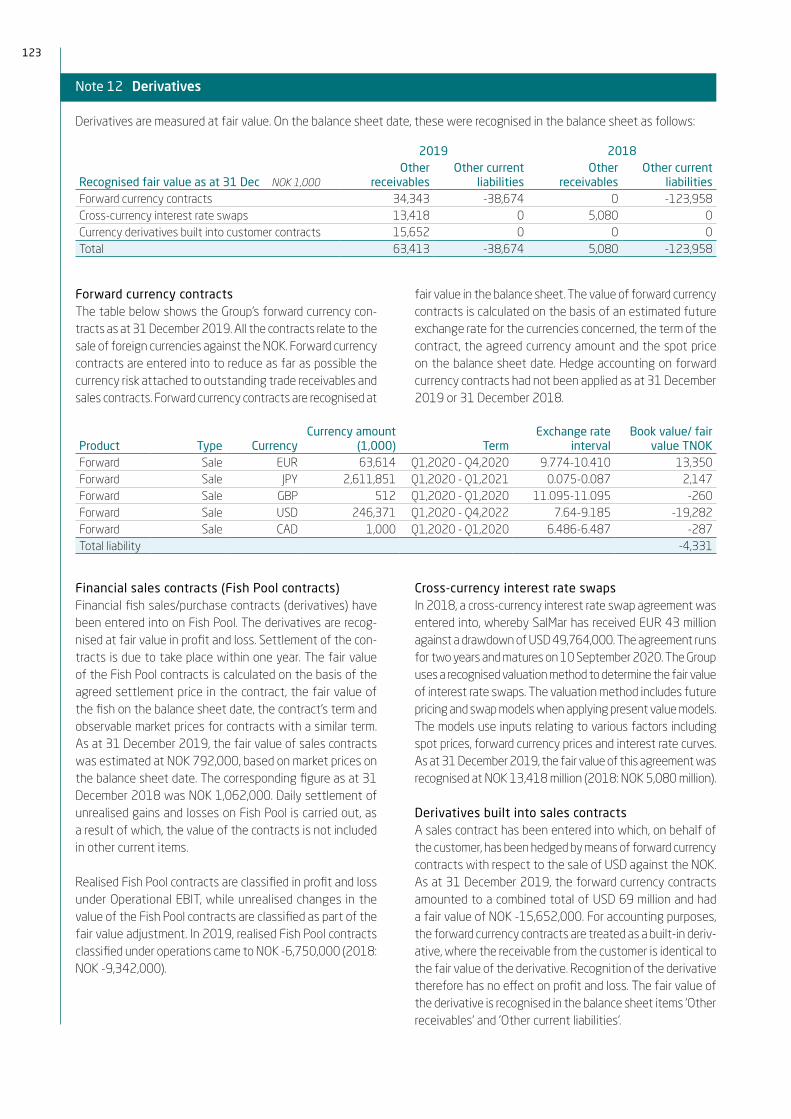
Note 12 Derivatives
Derivatives are measured at fair value. On the balance sheet date, these were recognised in the balance sheet as follows:
2019 2018
Recognised fair value as at 31 Dec NOK 1,000Other
receivablesOther current
liabilitiesOther
receivablesOther current
liabilitiesForward currency contracts 34,343 -38,674 0 -123,958Cross-currency interest rate swaps 13,418 0 5,080 0Currency derivatives built into customer contracts 15,652 0 0 0Total 63,413 -38,674 5,080 -123,958
Forward currency contractsThe table below shows the Group’s forward currency con-tracts as at 31 December 2019. All the contracts relate to the sale of foreign currencies against the NOK. Forward currency contracts are entered into to reduce as far as possible the currency risk attached to outstanding trade receivables and sales contracts. Forward currency contracts are recognised at
fair value in the balance sheet. The value of forward currency contracts is calculated on the basis of an estimated future exchange rate for the currencies concerned, the term of the contract, the agreed currency amount and the spot price on the balance sheet date. Hedge accounting on forward currency contracts had not been applied as at 31 December 2019 or 31 December 2018.
Product Type CurrencyCurrency amount
(1,000) TermExchange rate
intervalBook value/ fair
value TNOKForward Sale EUR 63,614 Q1,2020 - Q4,2020 9.774-10.410 13,350Forward Sale JPY 2,611,851 Q1,2020 - Q1,2021 0.075-0.087 2,147Forward Sale GBP 512 Q1,2020 - Q1,2020 11.095-11.095 -260Forward Sale USD 246,371 Q1,2020 - Q4,2022 7.64-9.185 -19,282Forward Sale CAD 1,000 Q1,2020 - Q1,2020 6.486-6.487 -287Total liability -4,331
Financial sales contracts (Fish Pool contracts)Financial fish sales/purchase contracts (derivatives) have been entered into on Fish Pool. The derivatives are recog-nised at fair value in profit and loss. Settlement of the con-tracts is due to take place within one year. The fair value of the Fish Pool contracts is calculated on the basis of the agreed settlement price in the contract, the fair value of the fish on the balance sheet date, the contract’s term and observable market prices for contracts with a similar term. As at 31 December 2019, the fair value of sales contracts was estimated at NOK 792,000, based on market prices on the balance sheet date. The corresponding figure as at 31 December 2018 was NOK 1,062,000. Daily settlement of unrealised gains and losses on Fish Pool is carried out, as a result of which, the value of the contracts is not included in other current items.
Realised Fish Pool contracts are classified in profit and loss under Operational EBIT, while unrealised changes in the value of the Fish Pool contracts are classified as part of the fair value adjustment. In 2019, realised Fish Pool contracts classified under operations came to NOK -6,750,000 (2018: NOK -9,342,000).
Cross-currency interest rate swapsIn 2018, a cross-currency interest rate swap agreement was entered into, whereby SalMar has received EUR 43 million against a drawdown of USD 49,764,000. The agreement runs for two years and matures on 10 September 2020. The Group uses a recognised valuation method to determine the fair value of interest rate swaps. The valuation method includes future pricing and swap models when applying present value models. The models use inputs relating to various factors including spot prices, forward currency prices and interest rate curves. As at 31 December 2019, the fair value of this agreement was recognised at NOK 13,418 million (2018: NOK 5,080 million).
Derivatives built into sales contractsA sales contract has been entered into which, on behalf of the customer, has been hedged by means of forward currency contracts with respect to the sale of USD against the NOK. As at 31 December 2019, the forward currency contracts amounted to a combined total of USD 69 million and had a fair value of NOK -15,652,000. For accounting purposes, the forward currency contracts are treated as a built-in deriv-ative, where the receivable from the customer is identical to the fair value of the derivative. Recognition of the derivative therefore has no effect on profit and loss. The fair value of the derivative is recognised in the balance sheet items ‘Other receivables’ and ‘Other current liabilities’.
123

Note 13 Receivables, provisions for bad debts
The Group’s receivables are measured at amortised cost. Receivables denominated in foreign currencies are valued at the daily rate. Book value equals fair value.
NOK 1,000 2019 2018
Trade receivables 760,523 636,721
Provisions for bad debts -21,094 -6,661
Other current receivables 330,332 289,416
Other non-current receivables 95,925 26,136
Total 1,165,686 945,613
Included in the item Other current receivables above are prepaid expenses in the amount of 80,849 51,662
Included in the item Other current receivables above are derivatives in the amount of 63,413 5,080
Included in the item Other current receivables above are VAT refunds due in the amount of 135,074 166,733
Included in the item Other non-current receivables above are the following, falling due for payment in more than one year 94,415 18,812
Included in the item Other non-current receivables above are pension assets in the amount of 1,510 7,324
In connection with the sale of a tranche of shares in Arnarlax AS to Gyda Ehf, a seller’s credit agreement was entered into for the amount of the consideration payable for the shares. This totalled NOK 35.7 million. The loan, including accrued interest, must be paid off in full no later than 31 December 2025. In the financial statements, the loan is recognised
under ‘Other non-current receivables’. See Note 8 for fur-ther details.
Bad debts are classified as other operating expenses in profit and loss. Changes in provisions for bad debts and bad debts charged to expenses during the period are presented below.
NOK 1,000 2019 2018
Provisions for bad debt 1 Jan 6,661 9,032
Additions resulting from acquisitions 11,697 0
Provisions for bad debts 31 Dec 21,094 6,661
Change in provisions for bad debts during the period 2,737 -2,371
Actual bad debts 5,298 2,641
Change in provisions for bad debts 2,737 -2,371
Bad debts charged to expenses during the period 8,034 270
See Note 2 for further details of the credit risk and foreign exchange risk associated with trade receivables.
As at 31 December, the company’s outstanding trade receivables had the following payment profile:
Total Not due <30 d 30-45d 45-90d >90d
2019 760,523 548,819 143,784 12,226 1,361 54,333
2018 636,721 478,682 93,194 11,949 16,106 36,790
124 Notes to the fiNaNcial statemeNts 2019

Buyout of trade receivablesSalMar has entered into an agreement with a financial insti-tution for the buyout of trade receivables that meet certain specified criteria. SalMar transfers trade receivables that meet these criteria as and when they arise and receives immediate settlement thereof. Normally, the customer’s pay-ment would have taken 30-45 days to arrive. The financial institution assumes all material risk with respect to the
receivable from the time of its transfer. The transfer of such receivables is deemed to be a transaction and is derecognised from the balance sheet on the date it takes place. As at 31 December 2019, a total of NOK 375.4 million in outstanding receivables had been transferred and derecognised from the balance sheet (31 December 2018: NOK 661.3 million). The change in trade receivables deriving from this derecognition is included in operating activities in the statement of cash flow.
Note 14 Inventory and biological assets
Book value of inventory 2019 2018
Raw materials 160,712 135,500
Goods in progress (entirely biological assets) 5,720,810 5,305,616
Finished goods 308,017 324,434
Total inventory 31 Dec 6,189,538 5,765,550
Book value of biological assets recognised at fair value 2019 2018
Roe, fry, smolt and cleaner fish at cost 277,748 225,389
Biological assets held at sea farms at cost 3,489,040 3,044,550
Total biological assets before fair value adjustment 3,766,788 3,269,939
Fair value adjustment of biological assets 1,954,022 2,035,677
Total biological assets 31 Dec 5,720,810 5,305,616
Raw materials comprise mainly feed for smolt and marine-phase fish production. It also includes raw materials for use in processing, as well as packaging.
Stocks of biological assets are associated with SalMar’s fish farming activities on land and at sea, and comprise roe, fry, smolt, cleaner fish and fish held at sea farms.
Finished goods comprises whole salmon, fresh and frozen, as well as processed salmon products.
Change in the book value of biological assets (NOK 1,000) 2019 2018
Biological assets 1 Jan 5,305,616 4,135,523
Increase resulting from acquisitions 367,017 0
Increase resulting from production/purchase 4,931,296 4,379,789
Reduction resulting from sale/harvesting -4,810,918 -4,144,478
Reduction resulting from incident-based mortality -245 0
Fair value adjustments 1 Jan (reversed) -2,035,677 -1,100,895
Fair value adjustment - change in estimate (see comment below) 0 287,816
Fair value adjustments 31 Dec (new) 1,954,022 1,747,861
Translation differences 9,699 0
Biological assets 31 Dec 5,720,810 5,305,616
Incident-based mortalityIncident-based mortality is recognised at sites where a single incident leads to a 3 per cent mortality rate in one period, or a mortality rate over several periods in excess of 5 per cent.
The assessment relates to the number of fish and is car-ried out at site level. The Group had one incident early in 2019 in Iceland that resulted in incident-based mortality as defined above. The total effect on the Group’s operating
125

profit at cost was NOK 5.1 million. The Group had no such incidents in 2018.
Biological assets held at sea farms 31 Dec 2019 NOK 1,000Biomass (tonnes)
Acquisition cost
Value adjustment Book value
< 1 kg (LW) 8,447 568,096 274,072 842,168
1-4 kg 70,828 2,226,834 1,230,085 3,456,919
> 4 kg (GW) 26,833 694,105 449,865 1,143,970
Biological assets held at sea farms 106,108 3,489,035 1,954,022 5,443,057
Roe, fry, smolt and cleaner fish at cost 277,748 - 277,748
Biological assets 3,766,783 1,954,022 5,720,805
Biological assets held at sea farms 31 Dec 2018 NOK 1,000Biomass (tonnes)
Acquisition cost
Value adjustment Book value
< 1 kg (LW) 9,206 476,971 478,118 955,089
1-4 kg 74,078 2,280,596 1,388,065 3,668,661
> 4 kg (GW) 11,131 286,982 169,495 456,477
Biological assets held at sea farms 94,415 3,044,550 2,035,677 5,080,227
Roe, fry, smolt and cleaner fish at cost 277,748 - 225,389
Biological assets 3,269,939 2,035,677 5,305,616
Valuation of biological assets:The way live fish are accounted for is regulated by IAS 41 Agriculture. The general rule is that such assets must be recognised at fair value in accordance with IFRS 13. The valuation of biological assets is included in valuation level 3, ie based on factors not drawn from observable markets.
Roe, fry, smolt and cleaner fish are recognised at historic cost, since this is considered the best estimate of fair value.
The company’s stocks of live fish held at sea farms are, in accordance with IAS 41, recognised at fair value. In 2018, the technical model used to calculate the fair value of live fish was modified. With effect from 2018, a present value model has been used, rather than the growth model used earlier. The change in model had a NOK 287.8 million positive effect in 2018, which was treated in the accounts as an estimate change recognised in profit & loss pursuant to IAS 8.
Present value is calculated on the basis of estimated reve-nues less production costs remaining until the fish is harvest-able at the individual site. A fish is harvestable when it has reached the estimated weight required for harvesting speci-fied in the company’s budgets and plans. The estimated value is discounted to present value on the balance sheet date.
The expected biomass at harvest is calculated on the basis of the number of individuals held at sea farms on the bal-ance sheet date, adjusted for expected mortality up until the point of harvest and multiplied by the fish’s estimated weight at harvest.
Fair value is calculated on the basis of Fish Pool forward prices for the estimated harvesting date that were in effect on the balance sheet date. The forward prices are adjusted for an exporter supplement, as well as harvesting, sales and carriage costs. In addition, an adjustment is made to take account of expected differences in fish quality.
The discount rate for 2019 was 7 per cent per month, which reflects the biomass’s capital cost, risk and synthetic licence fees and site rental charges. The discount rate is unchanged from 2018. For the business in Iceland, a discount rate of 5 per cent per month has been presumed. The discount rate reflects the capital cost of the biomass, risk and synthetic licence and site leasing. For further details of the various premises used in the model, please see the description in Note 1 and the section on “important accounting estimates and discretionary assessments”.
126 Notes to the fiNaNcial statemeNts 2019

The calculation is based on following forward prices:
Expected harvesting period: Forward price 31.12.2019 Expected harvesting period: Forward price 31.12.2018
Q1-2020 66.10 Q1-2019 64.02
Q2-2020 66.90 Q2-2019 65.00
Q3-2020 55.00 Q3-2019 59.52
Q4-2020 56.40 Q4-2019 61.48
1st half 2021 59.50 1st half 2020 62.90
2nd half 2021 58.35 2nd half 2020 60.10
Sensitivity assessments:The estimated fair value of biological assets has been calculated using different parameters. The effect on the book value of biological assets is summarised below:
2019 Increase
Effect on estimated fair value 31.12.2019
(NOK 1,000) Decrease
Effect on estimated fair value 31.12.2019
(NOK 1,000)
Change in forward price + NOK 5 per kg 565,767 - NOK 5 per kg -565,767
Change in discount factor 1% -332,882 -1% 369,591
Change in harvesting time 1 month earlier 415,497 1 month later -411,986
Change in biomass 1% 69,316 -1% -69,316
2018 Increase
Effect on estimated fair value 31.12.2018
(NOK 1,000) Decrease
Effect on estimated fair value 31.12.2018
(NOK 1,000)
Change in forward price + NOK 5 per kg 496,533 - NOK 5 per kg -496,533
Change in discount factor 1% -327,456 -1% 362,420
Change in harvesting time 1 month earlier 394,241 1 month later -333,099
Change in biomass 1% 64,601 -1% -64,601
Note 15 Fair value adjustments
Fair value adjustments are part of the Group’s operating profit/loss, but changes in fair value are presented on a separate line to provide a greater understanding of the Group’s profit/loss on sold goods. The item comprises:
2019 2018
Change in fair value of the biomass -151,584 934,782
Change in provisions for loss-making contracts -1,520 30,036
Unrealised change in value of Fish Pool contracts -270 -31,395
Unrealised change in value of forward currency contracts 120,378 -87,592
Recognised fair value adjustments -32,995 845,831
127

Note 16 Bank deposits
As at 31 December 2019, the item ‘Bank deposits, cash & cash equivalents’ included restricted tax deductions amounting to NOK 85,862,000 (2018: NOK 87,244,000). The Group had additional restricted funds associated with Fish Pool contracts in the amount of NOK 1,910,000 (2018: NOK 38,958,000).
Note 17 Share capital and shareholders
As at 31 December 2019, the parent company’s share cap-ital comprised:
NOK 1,000 No. Face value Book value
Ordinary shares 113,299,999 0.25 28,325
There were no changes in share capital during the year.
ShareholdersThe company’s 20 largest shareholders as at 31 Decem-ber 2019 were:
No. Shareholding Voting share
Kverva Industrier AS 59,436,137 52.46% 52.63%
Folketrygdfondet 6,555,764 5.79% 5.81%
State Street Bank and Trust Comp 2,336,703 2.06% 2.07%
State Street Bank and Trust Comp 1,967,732 1.74% 1.74%
Lin AS 1,274,620 1.12% 1.13%
Clearstream Banking S.A. 1,245,941 1.10% 1.10%
Verdipapirfondet DNB Norge 1,238,495 1.09% 1.10%
State Street Bank and Trust Comp 1,074,633 0.95% 0.95%
JPMorgan Chase Bank, N.A., London 958,175 0.85% 0.85%
AB Sic i Low Vol Equ Portf 893,366 0.79% 0.79%
JPMorgan Chase Bank, N.A., London 864,254 0.76% 0.77%
BNP Paribas Securities Services 852,477 0.75% 0.75%
JPMorgan Chase Bank, N.A., London 837,631 0.74% 0.74%
Euroclear Bank S.A./N.V. 787,793 0.70% 0.70%
State Street Bank and Trust Comp 740,945 0.65% 0.66%
Pictet & Cie (Europe) S.A. 729,497 0.64% 0.65%
JPMorgan Chase Bank, N.A., London 691,578 0.61% 0.61%
SIX SIS AG 660,490 0.58% 0.58%
Handelsbanken Norden 556,900 0.49% 0.49%
State Street Bank and Trust Comp 556,112 0.49% 0.49%
Total 20 largest shareholders 84,259,243 74.37% 74.62%
Total other shareholders 29,040,756 25.63% 25.38%
Total no. of shares 113,299,999 100.00% 100.00%
128 Notes to the fiNaNcial statemeNts 2019

Shares owned by members of the board and senior executives:
Name No. of shares Shareholding
Gustav Witzøe1 CEO 1
Trine Sæther Romuld CFO & COO 2,300 0.00%
Ulrik Steinvik2 Director, Business Support 78,734 0.07%
Frode Arntsen Director, Sales & Processing 1,917 0.00%
Roger Bekken COO Farming 12,868 0.01%
1 Shares owned indirectly through Kvarv AS, the parent company in the Kverva Group. Kvarv AS owns 93.02 per cent of the shares in Kverva AS, which, in turn, owns 100 per cent of the shares in Kverva Industrier AS. Kverva Industrier AS owns 52.46 per cent of the shares in SalMar ASA and commands a voting share of 52.63 per cent. Gustav Witzøe com-mands a voting share of 80 per cent and has a shareholding of 1 per cent in Kvarv AS through his ownership of A-shares in the company, in the company.
2 Owns 15,751 shares directly and indirectly through personal related parties. Also owns 100 per cent of the shares in Nordpilan AS. Nordpilan AS owns 0.2 per cent of the shares in Kverva AS, which in turn owns 100 per cent of the shares in Kverva Industrier AS. Kverva Industrier AS owns 52.46 per cent of the shares in SalMar ASA and a and commands a corresponding voting share of 52.63 per cent.
No members of the company’s board of directors owned shares in SalMar ASA as at 31 December 2019.
Board authorisationsThe board has been authorised to raise the share capital by a maximum of NOK 2,832,000, through the issue of up to 11,328,000 shares. The authorisation is valid until the 2020 AGM or 30 June 2020 at the latest.
The board has also been authorised to acquire treasury shares with a face value of NOK 2,691,800, a total of 10,766,997 shares. The board’s authorisation is valid until the 2020 AGM, or 30 June 2020 at the latest.
The board has also been authorised to issue convertible loans to enable the company to use such financial instruments as
part of its overall short-term financing. The board’s author-isation applies to a total loan amount of NOK 2 billion. The capital increase resulting from conversion may not exceed NOK 2,832,000. The authorisation must be seen in conjunc-tion with the authorisation to increase share capital, such that the total increase in capital for both authorisations combined may not exceed 10 per cent of share capital. The authorisation permits existing shareholders’ preference rights to be waived. The board’s authorisation is valid until the 2020 AGM, or 30 June 2020 at the latest.
DividendNo dividend will be paid for the 2019 financial year. As at 31 December 2018, a dividend of NOK 23.00 per share, totalling NOK 2,593.0 million had been proposed.
Note 18 Interest-bearing debt
Long-term interest-bearing debt NOK 1,000 2019 2018Debt to credit institutions 2,901,563 1,311,027Next year's instalment on long-term debt -149,992 -621,100Total long-term interest-bearing debt 31 Dec 2,751,570 689,927
Leasing liabilities 629,604 343,794Next year's instalment on leasing liabilities -140,733 -14,604Long-term leasing liabilities 31 Dec 488,871 329,190
Total long-term interest-bearing debt 31 Dec 3,240,442 1,019,116
Short-term interest-bearing debtDebt to credit institutions 231,547 112,484Next year's instalment on long-term debt 149,992 621,100Total debt to credit institutions 381,539 733,583Next year's instalment on leasing liabilities 140,733 14,604Total short-term interest-bearing debt 31 Dec 522,272 748,188
Total interest-bearing debt 3,762,714 1,767,304Cash & cash equivalents 230,990 239,596Leasing liabilities 629,604Net interest-bearing debt 2,902,120 1,527,708
129
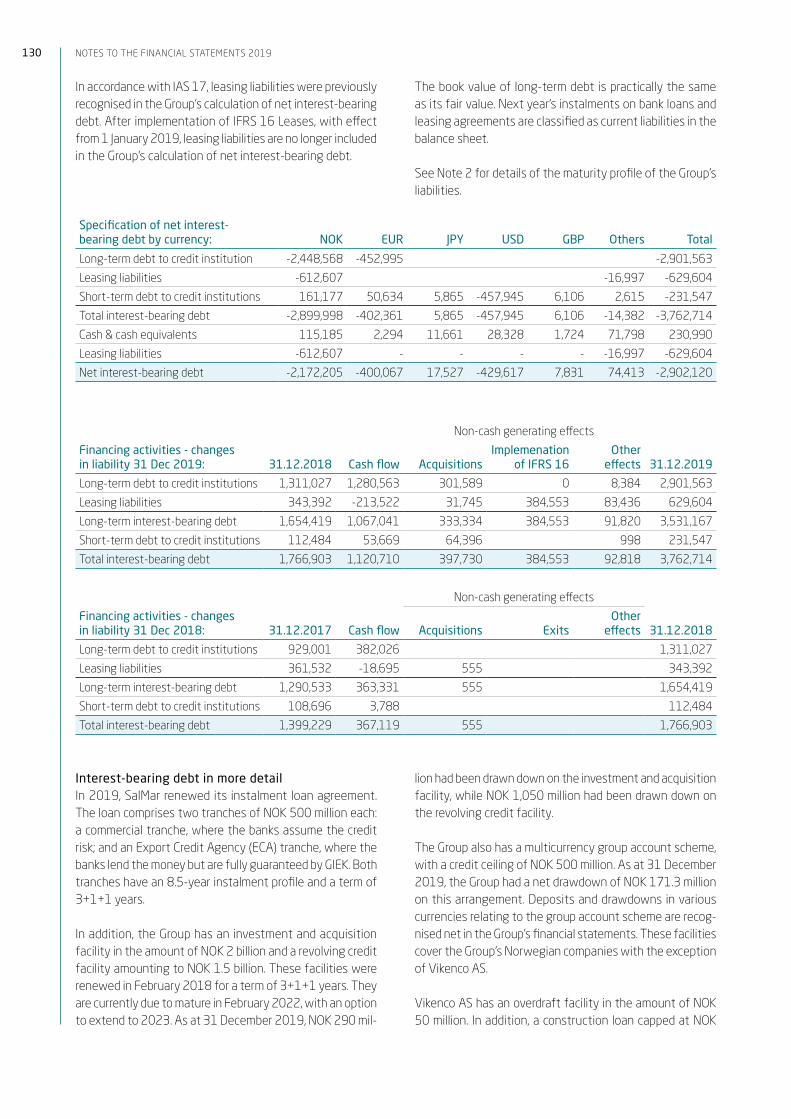
In accordance with IAS 17, leasing liabilities were previously recognised in the Group’s calculation of net interest-bearing debt. After implementation of IFRS 16 Leases, with effect from 1 January 2019, leasing liabilities are no longer included in the Group’s calculation of net interest-bearing debt.
The book value of long-term debt is practically the same as its fair value. Next year’s instalments on bank loans and leasing agreements are classified as current liabilities in the balance sheet.
See Note 2 for details of the maturity profile of the Group’s liabilities.
Specification of net interest-bearing debt by currency: NOK EUR JPY USD GBP Others Total
Long-term debt to credit institution -2,448,568 -452,995 -2,901,563
Leasing liabilities -612,607 -16,997 -629,604
Short-term debt to credit institutions 161,177 50,634 5,865 -457,945 6,106 2,615 -231,547
Total interest-bearing debt -2,899,998 -402,361 5,865 -457,945 6,106 -14,382 -3,762,714
Cash & cash equivalents 115,185 2,294 11,661 28,328 1,724 71,798 230,990
Leasing liabilities -612,607 - - - - -16,997 -629,604
Net interest-bearing debt -2,172,205 -400,067 17,527 -429,617 7,831 74,413 -2,902,120
Non-cash generating effects
Financing activities - changes in liability 31 Dec 2019: 31.12.2018 Cash flow Acquisitions
Implemenation of IFRS 16
Other effects 31.12.2019
Long-term debt to credit institutions 1,311,027 1,280,563 301,589 0 8,384 2,901,563
Leasing liabilities 343,392 -213,522 31,745 384,553 83,436 629,604
Long-term interest-bearing debt 1,654,419 1,067,041 333,334 384,553 91,820 3,531,167
Short-term debt to credit institutions 112,484 53,669 64,396 998 231,547
Total interest-bearing debt 1,766,903 1,120,710 397,730 384,553 92,818 3,762,714
Non-cash generating effects
Financing activities - changes in liability 31 Dec 2018: 31.12.2017 Cash flow Acquisitions Exits
Other effects 31.12.2018
Long-term debt to credit institutions 929,001 382,026 1,311,027
Leasing liabilities 361,532 -18,695 555 343,392
Long-term interest-bearing debt 1,290,533 363,331 555 1,654,419
Short-term debt to credit institutions 108,696 3,788 112,484
Total interest-bearing debt 1,399,229 367,119 555 1,766,903
Interest-bearing debt in more detailIn 2019, SalMar renewed its instalment loan agreement. The loan comprises two tranches of NOK 500 million each: a commercial tranche, where the banks assume the credit risk; and an Export Credit Agency (ECA) tranche, where the banks lend the money but are fully guaranteed by GIEK. Both tranches have an 8.5-year instalment profile and a term of 3+1+1 years.
In addition, the Group has an investment and acquisition facility in the amount of NOK 2 billion and a revolving credit facility amounting to NOK 1.5 billion. These facilities were renewed in February 2018 for a term of 3+1+1 years. They are currently due to mature in February 2022, with an option to extend to 2023. As at 31 December 2019, NOK 290 mil-
lion had been drawn down on the investment and acquisition facility, while NOK 1,050 million had been drawn down on the revolving credit facility.
The Group also has a multicurrency group account scheme, with a credit ceiling of NOK 500 million. As at 31 December 2019, the Group had a net drawdown of NOK 171.3 million on this arrangement. Deposits and drawdowns in various currencies relating to the group account scheme are recog-nised net in the Group’s financial statements. These facilities cover the Group’s Norwegian companies with the exception of Vikenco AS.
Vikenco AS has an overdraft facility in the amount of NOK 50 million. In addition, a construction loan capped at NOK
130 Notes to the fiNaNcial statemeNts 2019

200 million has been taken out. As at 31 December 2019, no drawdowns had been made on these credit facilities.
The Group’s Icelandic segment has its own financing arrange-ments, comprising an instalment loan of EUR 15 million, a revolving credit facility of EUR 35 million and an overdraft with a EUR 5 million ceiling. The loan agreement has a term of 3 years from December 2018. The revolving credit facility is limited by a borrowing base calculated on the value of certain specified assets. As at 31 December 2019, the borrowing base came to EUR 33.8 million, while drawdowns on that same date totalled EUR 31.3 million. EUR 4.6 million had been drawn on the overdraft facility at the close of 2019. The instalment loan is repaid quarterly by 1/40.
Financial covenantsThe most important financial covenants for the long-term financing of SalMar ASA are, respectively, a solvency require-ment, which stipulates that the Group’s recognised equity ratio shall exceed 35%, and a profitability requirement, which stipulates that the Group’s interest coverage rate (EBITDA/net financial expenses) shall not fall below 4.0.
Correspondingly, the Group’s Icelandic segment has a sol-vency requirement, which stipulates that the company’s recognised equity ratio shall not exceed 35 per cent, and a profitability requirement which stipulates that its inter-est coverage rate shall not fall below 3.5. The company’s NIBD/12-month rolling EBITDA shall not exceed 5.0 in 2019 or 4.0 for subsequent periods.
As at 31 December 2019, the Group was not in violation of its financial covenants.
Financing of trade payablesThe Group has entered into an agreement with the com-pany’s feed suppliers to extend the credit given on feed orders. The feed supplier has agreed the discounting of the trade payable with the Group’s bank. The liability springs from supply agreements containing provisions for variable credit times, and the terms obtained from the bank are not materially different from the terms which could have been obtained from the feed suppliers. As a result, the liability is classified as a trade payable, and the change is included in operating activities in the statement of cash flow. As at 31 December 2019, the Group owed its bank NOK 695.3 million in connection with this type of financing. The corresponding figure as at 31 December 2018 was NOK 697.9 million.
Buyout of trade receivablesSalMar has entered into an agreement with a financial insti-tution for the buyout of trade receivables that meet certain predefined criteria. See Note 13 for further details of this arrangement.
Leasing liabilitiesSee Note 6 for further details of the Group’s capitalised leasing liabilities.
131

Note 19 Deferred tax and tax expense
The year’s tax expense breaks down as follows: NOK 1,000 2019 2018Tax payable 588,343 690,717Change in deferred tax 24,059 252,376Effect of change in tax rate 0 -71,181Tax paid abroad 4,906 1,340Surplus/shortfall in tax provisions in previous years -3,431 91Tax on ordinary profit 613,877 873,343
Tax payable in the balance sheet 2019 2018Tax payable for the year - Norway 583,978 684,718Tax payable for the year - abroad 4,364 5,998Tax payable on changes in previous years’ tax assessments 113 0Tax payable in the balance sheet 588,455 690,717
Breakdown of temporary differences 2019 2018Intangible and operating assets 3,208,850 2,042,260Financial leasing -51,090 -27,765Inventory 5,284,741 5,287,251Receivables -16,758 -4,918Other -358,876 -306,620Profit & loss account 13,039 16,298TOTAL temporary differences 8,079,905 7,006,506
Total temporary differences in Norway 7,078,812 7,006,506Total temporary differences abroad 1,001,092 0Total temporary differences 8,079,905 7,006,506
Deferred tax liabilities (+) / deferred tax assets (-) 1,757,557 1,541,431Tax rate used to calculate deferred tax in Norway 22% 22%Tax rate used to calculate deferred tax abroad 20%
Change in deferred tax in the balance sheet: 2019 2018Deferred tax 1 Jan 1,541,431 1,362,222Deferred tax associated with acquisitions 190,520 1,162Change in deferred tax 24,059 252,376Effect of change in tax rate - effect recognised in profit and loss 0 -71,181Deferred tax associated with equity transactions 1,775 -3,151Other changes -4,949 3Translation differences 4,721 0Deferred tax 31 Dec 1,757,557 1,541,431
Reconciliation from nominal to actual tax rates 2019 2018Profit before tax 3,158,365 4,452,568Expected tax at nominal tax rate 694,840 1,024,091Effect of different tax rates compared with nominal rates -393 0Effect of change in tax rate 0 -71,181Permanent differences (22%/23%) -82,046 -80,998Tax paid abroad 4,906 1,340Surplus/shortfall in tax provisions in previous years -3,431 91Calculated tax expense 613,877 873,343Effective tax rate 19.4% 19.6%
Permanent differences apply to the following: 2019 2018Option expenses 10,475 9,133Options redeemed -16,356 -21,923Skattefunn (Norwegian tax refund scheme for R&D expenses) -750 -2,197Share of profit/loss from associates -26,104 -58,175Gain from exit of subsidiaries -49,692 0Other 382 -7,836Total -82,046 -80,998
132 Notes to the fiNaNcial statemeNts 2019
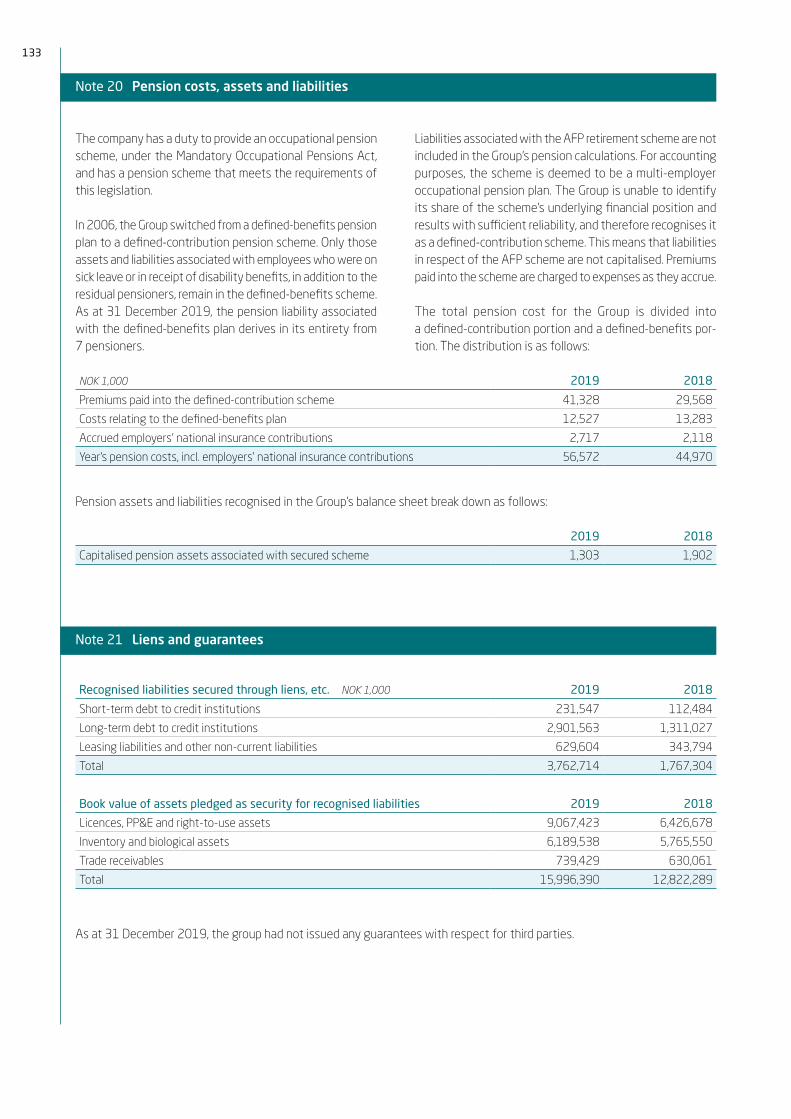
Note 20 Pension costs, assets and liabilities
The company has a duty to provide an occupational pension scheme, under the Mandatory Occupational Pensions Act, and has a pension scheme that meets the requirements of this legislation.
In 2006, the Group switched from a defined-benefits pension plan to a defined-contribution pension scheme. Only those assets and liabilities associated with employees who were on sick leave or in receipt of disability benefits, in addition to the residual pensioners, remain in the defined-benefits scheme. As at 31 December 2019, the pension liability associated with the defined-benefits plan derives in its entirety from 7 pensioners.
Liabilities associated with the AFP retirement scheme are not included in the Group’s pension calculations. For accounting purposes, the scheme is deemed to be a multi-employer occupational pension plan. The Group is unable to identify its share of the scheme’s underlying financial position and results with sufficient reliability, and therefore recognises it as a defined-contribution scheme. This means that liabilities in respect of the AFP scheme are not capitalised. Premiums paid into the scheme are charged to expenses as they accrue.
The total pension cost for the Group is divided into a defined-contribution portion and a defined-benefits por-tion. The distribution is as follows:
NOK 1,000 2019 2018
Premiums paid into the defined-contribution scheme 41,328 29,568
Costs relating to the defined-benefits plan 12,527 13,283
Accrued employers’ national insurance contributions 2,717 2,118
Year’s pension costs, incl. employers’ national insurance contributions 56,572 44,970
Pension assets and liabilities recognised in the Group’s balance sheet break down as follows:
2019 2018
Capitalised pension assets associated with secured scheme 1,303 1,902
Note 21 Liens and guarantees
Recognised liabilities secured through liens, etc. NOK 1,000 2019 2018
Short-term debt to credit institutions 231,547 112,484
Long-term debt to credit institutions 2,901,563 1,311,027
Leasing liabilities and other non-current liabilities 629,604 343,794
Total 3,762,714 1,767,304
Book value of assets pledged as security for recognised liabilities 2019 2018
Licences, PP&E and right-to-use assets 9,067,423 6,426,678
Inventory and biological assets 6,189,538 5,765,550
Trade receivables 739,429 630,061
Total 15,996,390 12,822,289
As at 31 December 2019, the group had not issued any guarantees with respect for third parties.
133

Note 22 Other current liabilities
Other current liabilities comprise:
NOK 1,000 2019 2018
Accrued holiday pay 100,930 84,758
Derivatives 38,674 123,958
Provisions for loss-making sales contracts 6,040 4,520
Provisions for future clean-up operations 115,696 104,358
Other accrued costs and provisions 351,918 183,325
TOTAL other current liabilities 613,258 500,919
Note 23 Operating revenues
Operating revenues NOK 1,000 2019 2018
Sale of goods and services - revenues from contracts with customers 12,202,197 11,301,338
Compensation 3,865 15,902
Leasing revenues 3,888 4,462
Other operating revenues 27,640 20,852
Total operating revenues 12,237,589 11,342,554
See also Note 3 for details of operating revenues associated with the Group’s business segments.
Group revenues by geographic market: 2019 % 2018 %
Asia 2,802,436 22.9% 2,346,619 20.7%
USA/ Canada 2,123,275 17.4% 1,989,222 17.5%
Europe, excl. Norway 5,050,639 41.3% 5,150,952 45.4%
Norway 2,169,170 17.7% 1,786,583 15.8%
Other 92,070 0.8% 69,179 0.6%
Total operating revenues 12,237,589 100.0% 11,342,554 100.0%
The Group’s revenues by currency: 2019 % 2018 %
NOK 3,444,567 28.1% 3,093,603 27.3%
JPY 616,775 5.0% 516,734 4.6%
GBP 217,385 1.8% 299,043 2.6%
USD 3,884,022 31.7% 3,604,962 31.8%
EUR 3,609,437 29.5% 3,595,792 31.7%
SEK 193,573 1.6% 119,474 1.1%
KRW 96,997 0.8% 70,940 0.6%
CAD 139,344 1.1% 42,008 0.4%
ISK 35,489 0.3% 0 0.0%
Total operating revenues 12,237,589 100.0% 11,342,554 100.0%
134 Notes to the fiNaNcial statemeNts 2019

Note 24 Payroll costs, no. of employees, remunerations, loans to employees, etc
Payroll costs
NOK 1,000 2019 2018
Salaries, incl. holiday pay and bonuses 990,890 865,811
Employers’ national insurance contributions 71,845 65,793
Pension costs (see Note 19) 54,669 44,430
Options 47,119 39,707
Other benefits 37,971 24,697
Total 1,202,494 1,040,438
No. of full-time equivalents employed during the financial year. 1,702.0 1,479.0
Auditor:The remuneration (excl. VAT) paid to the Group’s auditor breaks down as follows:
NOK 1,000 EY Other
Statutory auditing services 1,376 2,064
Other certification services 74 0
Tax advisory services 2,020 0
Other services 95 400
Total 2019 3,565 2,465
NOK 1,000 EY Other
Statutory auditing services 1,229 0
Other certification services 108 0
Tax advisory services 141 0
Other services 171 0
Total 2018 1,648 0
Loans and sureties granted to employees Loans Sureties
Employees 1,096 0
No loans have been granted to any of the Group’s senior executives.
135
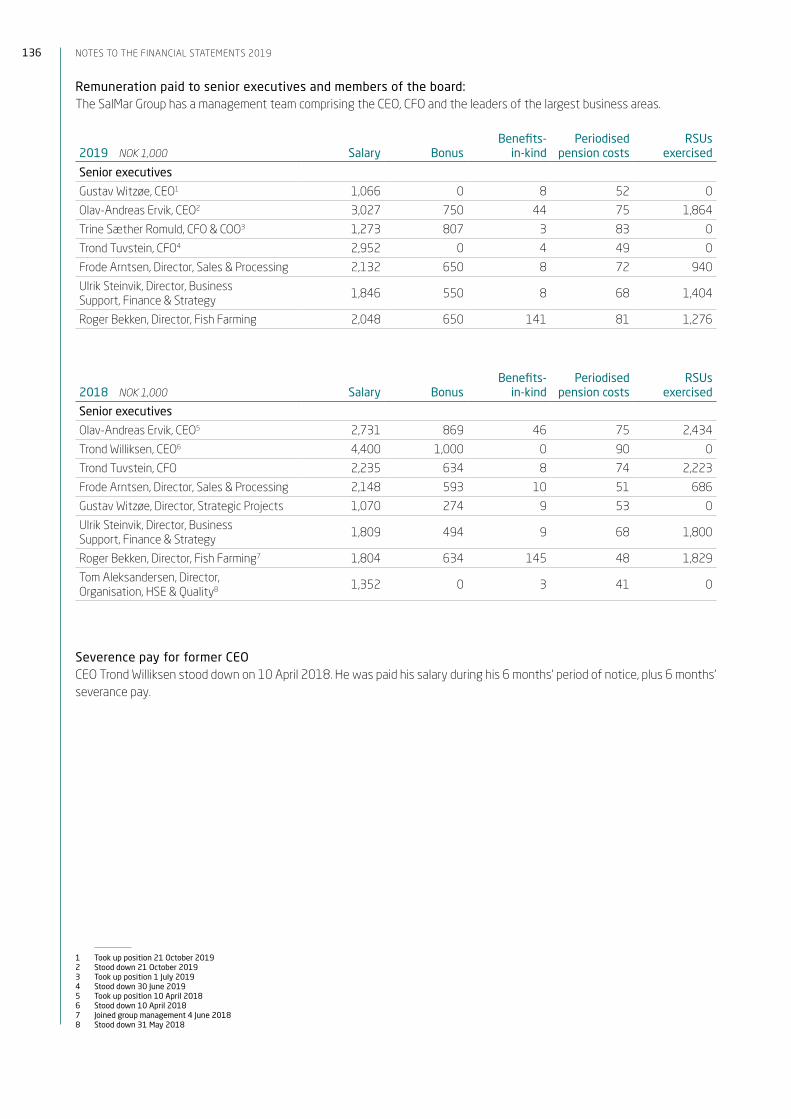
Remuneration paid to senior executives and members of the board:The SalMar Group has a management team comprising the CEO, CFO and the leaders of the largest business areas.
2019 NOK 1,000 Salary BonusBenefits-
in-kind Periodised
pension costs RSUs
exercised
Senior executives
Gustav Witzøe, CEO1 1,066 0 8 52 0
Olav-Andreas Ervik, CEO2 3,027 750 44 75 1,864
Trine Sæther Romuld, CFO & COO3 1,273 807 3 83 0
Trond Tuvstein, CFO4 2,952 0 4 49 0
Frode Arntsen, Director, Sales & Processing 2,132 650 8 72 940
Ulrik Steinvik, Director, Business Support, Finance & Strategy 1,846 550 8 68 1,404
Roger Bekken, Director, Fish Farming 2,048 650 141 81 1,276
2018 NOK 1,000 Salary BonusBenefits-
in-kind Periodised
pension costs RSUs
exercised
Senior executives
Olav-Andreas Ervik, CEO5 2,731 869 46 75 2,434
Trond Williksen, CEO6 4,400 1,000 0 90 0
Trond Tuvstein, CFO 2,235 634 8 74 2,223
Frode Arntsen, Director, Sales & Processing 2,148 593 10 51 686
Gustav Witzøe, Director, Strategic Projects 1,070 274 9 53 0
Ulrik Steinvik, Director, Business Support, Finance & Strategy 1,809 494 9 68 1,800
Roger Bekken, Director, Fish Farming7 1,804 634 145 48 1,829
Tom Aleksandersen, Director, Organisation, HSE & Quality8 1,352 0 3 41 0
1 Took up position 21 October 20192 Stood down 21 October 20193 Took up position 1 July 20194 Stood down 30 June 20195 Took up position 10 April 20186 Stood down 10 April 20187 Joined group management 4 June 20188 Stood down 31 May 2018
Severence pay for former CEOCEO Trond Williksen stood down on 10 April 2018. He was paid his salary during his 6 months’ period of notice, plus 6 months’ severance pay.
136 Notes to the fiNaNcial statemeNts 2019

Board of Directors
1 The fee includes NOK 85,000 in remuneration as chair of the Audit Committee (2018:NOK 70,000).2 The fee includes NOK 55,000 as a member of the Audit Committee (2018: NOK 47,500).
NOK 1,000 Directors’ fees 2019 Directors’ fees 2018
Atle Eide, Chair 410 400
Kjell A. Storeide1 305 285
Helge Moen2 275 263
Margrethe Hauge 220 215
Trine Danielsen 220 108
Geir Berg, employee representative 0 108
Brit Elin Soleng, employee representative 110 108
Jon Erik Rosvoll, employee representative 56 0
Directors’ fees are not performance-related.
Directors’ fees payable to employee representatives are stated above. Total remuneration from the Group to employ-ee-elected members of the board of directors, including direc-tors’ fees as stated above and redeemed RSUs, is as follows:
NOK 1,000 2019 2018
Geir Berg 0 1,927
Brit Elin Soleng 805 758
Jon Erik Rosvoll 743 0
Note 25 Share-based incentives
Restricted Share Unit Plan (RSU):In accordance with the authorisation granted by the com-pany’s AGM, SalMar ASA’s board of directors has introduced a share-based incentive scheme (Restricted Share Unit Plan) for senior executives and key personnel employed by the company and its subsidiaries. As at 31 December 2019, the plan encompasses up to 166,572 shares, and has a term of three years. To this must be added the award for 2019, which formally took place on 31 January 2020 and encompassed a total of 131,425 RSUs. The company’s board members do not receive options, with the exception of employee rep-resentatives, who may take part in the programme in their capacity as an employee. The company’s liabilities under the plan will be covered by its existing holding of treasury shares.
Participants of the plan are granted Restricted Share Units (RSUs) free of charge. These will be released and transferred as shares to participants after an accrual period subject to predefined performance criteria. The shares are then trans-ferred to the employee free of charge. The plan comprises three accrual periods of, respectively, one, two and three calendar years. Each accrual period covers 1/3 of the total annual RSUs in the plan. One RSU affords a contingent enti-tlement to one share. The award of RSUs in each of the three accrual periods rests on the following performance criteria:
• 1/3 of the RSUs will vest irrespective of the performance criteria.
• 1/3 of the RSUs will vest provided that SalMar achieves a better EBIT/kg ratio than other aquaculture enterprises listed on the Oslo Stock Exchange during the accrual period.
• 1/3 of the RSUs will vest provided that SalMar’s shares deliver a higher total shareholder return (TSR) than a defined group of comparable companies during the accrual period.
The plan stipulates that RSUs will vest only if the partici-pant is still an employee of the Group. The total gains from released RSUs during the course of one calendar year may not exceed 100% of the participant’s basic salary.
The fair value of RSU entitlements is calculated on the date they are awarded. The total fair value for the entitlements as at 31 December 2019 is calculated to be 74,840,800 (2018: NOK 92,678,300). The cost is periodised over the accrual period, and a total of NOK 47,614,000 was charged to expenses in connection with the scheme in 2019 (2018: 39,707,000). Provisions for employer’s national insurance contributions linked to the scheme have also been made. The expense will become real to the extent that the performance criteria are met.
137
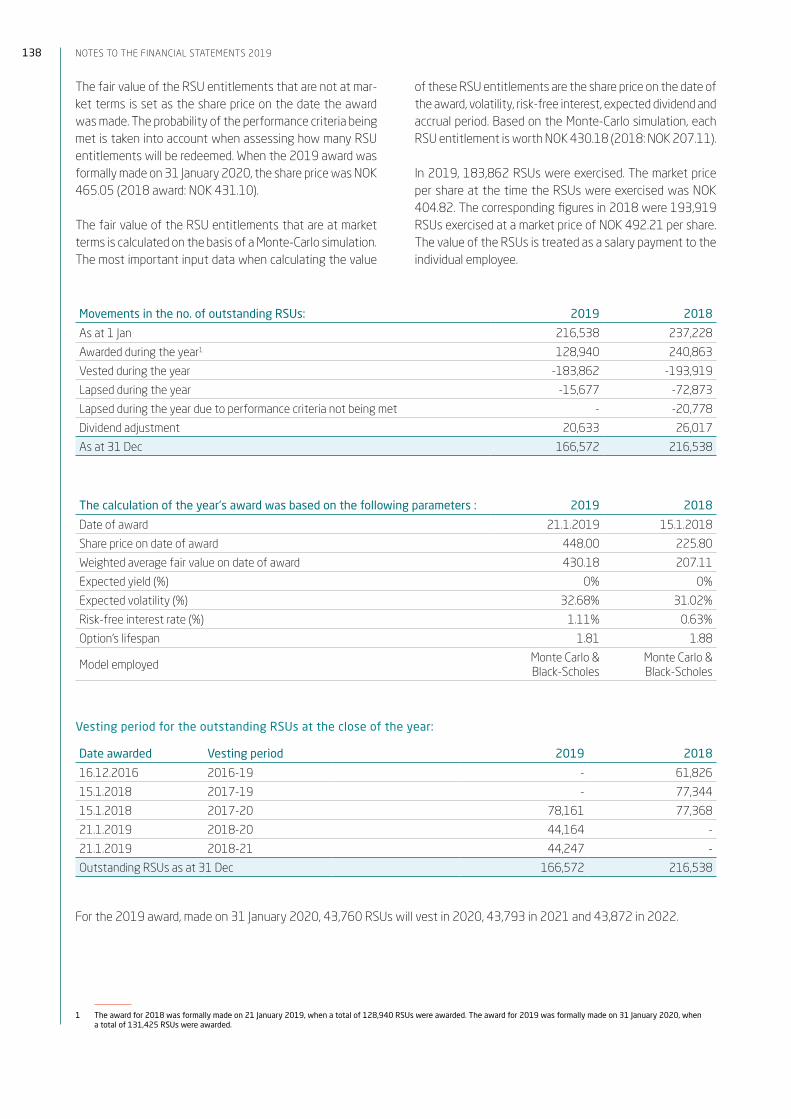
The fair value of the RSU entitlements that are not at mar-ket terms is set as the share price on the date the award was made. The probability of the performance criteria being met is taken into account when assessing how many RSU entitlements will be redeemed. When the 2019 award was formally made on 31 January 2020, the share price was NOK 465.05 (2018 award: NOK 431.10).
The fair value of the RSU entitlements that are at market terms is calculated on the basis of a Monte-Carlo simulation. The most important input data when calculating the value
1 The award for 2018 was formally made on 21 January 2019, when a total of 128,940 RSUs were awarded. The award for 2019 was formally made on 31 January 2020, when a total of 131,425 RSUs were awarded.
of these RSU entitlements are the share price on the date of the award, volatility, risk-free interest, expected dividend and accrual period. Based on the Monte-Carlo simulation, each RSU entitlement is worth NOK 430.18 (2018: NOK 207.11).
In 2019, 183,862 RSUs were exercised. The market price per share at the time the RSUs were exercised was NOK 404.82. The corresponding figures in 2018 were 193,919 RSUs exercised at a market price of NOK 492.21 per share. The value of the RSUs is treated as a salary payment to the individual employee.
Movements in the no. of outstanding RSUs: 2019 2018
As at 1 Jan 216,538 237,228
Awarded during the year1 128,940 240,863
Vested during the year -183,862 -193,919
Lapsed during the year -15,677 -72,873
Lapsed during the year due to performance criteria not being met - -20,778
Dividend adjustment 20,633 26,017
As at 31 Dec 166,572 216,538
The calculation of the year’s award was based on the following parameters : 2019 2018
Date of award 21.1.2019 15.1.2018
Share price on date of award 448.00 225.80
Weighted average fair value on date of award 430.18 207.11
Expected yield (%) 0% 0%
Expected volatility (%) 32.68% 31.02%
Risk-free interest rate (%) 1.11% 0.63%
Option’s lifespan 1.81 1.88
Model employed Monte Carlo & Black-Scholes
Monte Carlo & Black-Scholes
Vesting period for the outstanding RSUs at the close of the year:
Date awarded Vesting period 2019 2018
16.12.2016 2016-19 - 61,826
15.1.2018 2017-19 - 77,344
15.1.2018 2017-20 78,161 77,368
21.1.2019 2018-20 44,164 -
21.1.2019 2018-21 44,247 -
Outstanding RSUs as at 31 Dec 166,572 216,538
For the 2019 award, made on 31 January 2020, 43,760 RSUs will vest in 2020, 43,793 in 2021 and 43,872 in 2022.
138 Notes to the fiNaNcial statemeNts 2019
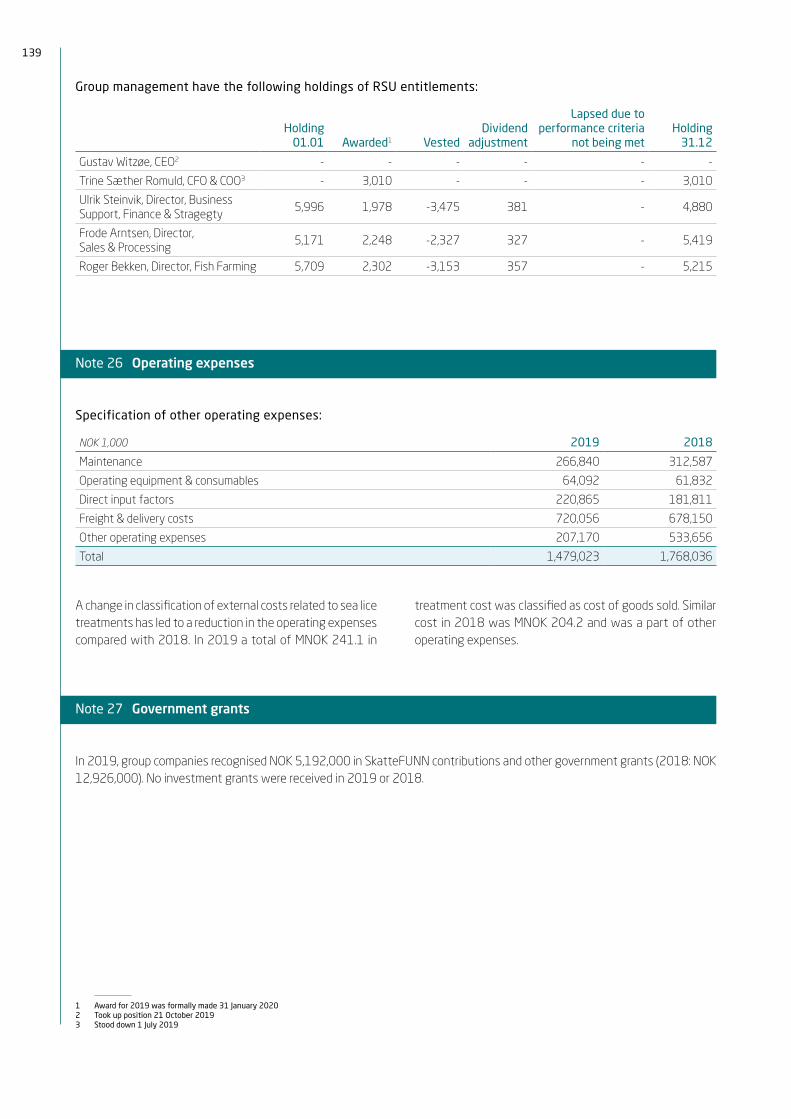
Group management have the following holdings of RSU entitlements:
Holding 01.01 Awarded1 Vested
Dividend adjustment
Lapsed due to performance criteria
not being metHolding
31.12
Gustav Witzøe, CEO2 - - - - - -
Trine Sæther Romuld, CFO & COO3 - 3,010 - - - 3,010
Ulrik Steinvik, Director, Business Support, Finance & Stragegty 5,996 1,978 -3,475 381 - 4,880
Frode Arntsen, Director, Sales & Processing 5,171 2,248 -2,327 327 - 5,419
Roger Bekken, Director, Fish Farming 5,709 2,302 -3,153 357 - 5,215
1 Award for 2019 was formally made 31 January 20202 Took up position 21 October 20193 Stood down 1 July 2019
Note 26 Operating expenses
Specification of other operating expenses:
NOK 1,000 2019 2018
Maintenance 266,840 312,587
Operating equipment & consumables 64,092 61,832
Direct input factors 220,865 181,811
Freight & delivery costs 720,056 678,150
Other operating expenses 207,170 533,656
Total 1,479,023 1,768,036
A change in classification of external costs related to sea lice treatments has led to a reduction in the operating expenses compared with 2018. In 2019 a total of MNOK 241.1 in
treatment cost was classified as cost of goods sold. Similar cost in 2018 was MNOK 204.2 and was a part of other operating expenses.
Note 27 Government grants
In 2019, group companies recognised NOK 5,192,000 in SkatteFUNN contributions and other government grants (2018: NOK 12,926,000). No investment grants were received in 2019 or 2018.
139

Note 28 Earnings per share
NOK 1,000 2019 2018
Net profit for the year (controlling interest’s share) 2,488,035 3,568,413
No. of shares outstanding as at 1 Jan 112,738,996 112,545,077
Effect of share issue - -
Effect of treasury shares allocated to employees (see Note 25) 183,862 193,919
Average no. of shares outstanding through the year 112,769,640 112,577,397
Diluting effect of RSU entitlements granted (see Note 25) 152,271 357,873
Average no. of diluted shares outstanding through the year 112,921,911 112,935,270
Earnings per share
Basic 22.06 31.70
Diluted 22.03 31.60
Note 29 Financial income and expenses
Financial items NOK 1,000: 2019 2018
Interest income 12,465 10,964
Gains on exit of associates 225,873 -
Change in value of cross-currency swaps 8,337 33,516
Other financial income 2,716 832
Total financial income 236,926 34,347
Interest expenses 170,190 116,101
Foreign exchange effects 74,093 34,470
Other financial expenses - 1,748
Total financial expenses 74,093 36,218
Net financial items 5,108 -107,007
For presentation purposes, some items of financial income and expenses were reclassified in 2018, so that financial items are presented gross in the Income Statement.
140 Notes to the fiNaNcial statemeNts 2019

Note 30 Related parties / individual transactions
The Group’s parent company is SalMar ASA. The overall parent company is Kverva AS, which owns 52.46% of the shares in SalMar ASA. The ultimate parent company is Kvarv AS, which
prepares its own consolidated accounts in accordance with NGAAP. See Note 17 for further details.
Transactions with related parties in 2019: Sales Purchases Receivables Liabilities
Associates of the SalMar Group 29,304 44,610 2,678 8,859
Companies controlled by the parent company Kverva AS 1,590,113 270,066 177,480 5,042
Associates of the parent company Kverva AS 39 0 0 710
Companies controlled by Gustav Witzøe and related parties 0 3,812 0 0
Transactions with related parties in 2018: Sales Purchases Receivables Liabilities
Associates of the SalMar Group 87,083 32,258 15,266 330
Companies controlled by the parent company Kverva AS 1,017,860 292,644 106,492 11,777
Associates of the parent company Kverva AS 44 31 0 490
Companies controlled by Gustav Witzøe and related parties 0 7,109 0 0
Transactions between the Group and related parties are undertaken at market terms and conditions.
In addition, dividend has been received from associates. See Note 9 for further details.
Note 31 Allegations of price fixing
On 6 February 2019, the European Commission decided to launch an inquiry into SalMar ASA and a number of other Norwegian aquaculture companies to discover whether any illegal price fixing has taken place. In the USA, SalMar ASA was one of several Norwegian fish farming companies against which complaints were filed on 23 April, 29 April, 9 May, 15 May, 17 May, 20 May, 28 May and 11 June 2019. The cases have been combined into a class action suit claiming compensation for losses resulting from alleged price fixing between the fish farmers concerned.
In a complaint filed on 11 October 2019, legal proceed-ings were initiated against SalMar ASA, and several other
Norwegian fish farming companies. The case is framed as a class action suit and relates to the same matters as the EU’s investigation and the class action suit in the USA.
On 8 November 2019, the U.S. Department of Justice Anti-trust Division announced that it was launching an investiga-tion into the aquaculture industry, including SalMar.
Since SalMar is of the opinion that the company has not participated in any form of illegal price fixing, no provisions have been made in respect of these matters.
Note 32 Events after the balance sheet date
The outbreak of Covid-19 and the measures taken to limit the spread of the underlying coronavirus infection are events that have taken place after the balance sheet date. At present, we do not see that this will have a material impact on the SalMar Group’s income and the future book value of group assets. For further details, see the Group’s Annual Report.
141

Note 33 New and amended accounting standards
New and amended standards and interpretations that have come into effectThe SalMar Group has implemented IFRS 16 Leases with effect from 1 January 2019. The effect of the implementation of this new accounting standard is described below.
Several other amendments and interpretations applied for the first time in 2019, but have no material impact on the consolidated financial statements.
IFRS 16 LeasesIFRS 16 Leases replaces IAS 17, the previously applied IFRS for leasing agreements. IFRS 16 is mandatory with effect from 1 January 2019, and the Group elected to utilise the modified retrospective method and simplification option, where the value of right-to-use assets on the implemen-tation date is set equal to the calculated leasing liability. Comparable figures have not been restated.
The Group has recognised leasing agreements in accordance with the accounting standard. The costs relating to these agreements are recognised as and when they arise. On the implementation date, the leasing liability was measured at the present value of leasing payments with the help of the
Group’s marginal borrowing rate of 3 per cent. Leases with a term of less than 12 months are deemed to be short-term agreements and are not recognised in the balance sheet. The same applies to leases that are not deemed to be material. Leasing costs relating to such leases are charged to expenses as they arise. In those cases where the Group has entered into complex leasing agreements, the service element is hived off in order to calculate the value of the right-to-use asset. In the main, this applies to leases relating to wellboats and service boats, where crew costs and an estimated market price for the service element have been hived off.
Under IFRS 16, the expensed leasing amount is replaced by depreciation on a right-to-use asset and an interest expense relating to the leasing liability. Payments relating to leasing liabilities were previously recognised as a deduction in cash flow from operating activities. Under IFRS 16, these pay-ments will be recognised in cash flow from financing activities with effect from 1 January 2019.
The table below shows the effect of IFRS 16’s implemen-tation. With respect to its effect on profit and loss, only the effect of new contracts under IFRS 16 is presented, to show how profit and loss is affected compared with previous years.
IFRS 16 has had the following effect on the financial statements in the period NOK 1,000
Leases previously recognised in the balance sheet in accordance with IAS 17 315,627
Leases recognised in the balance sheet - implementation of IFRS 16 384,553
Right-to-use assets as at 1 Jan 2019 700,180
Operational leasing liabilities as at 31 Dec 2018 451,124
Leases with a term of less than 12 months -18,723
Leases relating to low-value assets -13,112
Discount effect -34,735
Leasing liaibilties previously recognised in the balance sheet in accordance with IAS 17 343,392
Leasing liability as at 1 Jan 2019 727,945
Effect on profit and loss - implementation of IFRS 16 excl. previous IAS 17 NOK 1,000 2019
Ordinary depreciation -153,965
Leasing costs (incled in Other operating expenses) 156,772
Operational EBIT 2,807
Interest expense -11,041
EBIT (profit/loss before tax) -8,234
142 Notes to the fiNaNcial statemeNts 2019
Standards, amendments and interpretations of existing standards that have not yet come into effectStandards and Interpretations that were adopted prior to the presentation of the consolidated financial statements but which had not come into effect by that date are listed below. Only standards that it is assumed may affect the consolidated financial statements are mentioned.
New standards that come into effect after 1 January 2020Several IFRSs, amendments to standards and IFRIC interpre-tations, which apply as at 1 January 2020 or later, have not been implemented. Based on provisional assessments, these standards and interpretations will have no material impact on the consolidated financial statements for 2020 or later.
143

Annual financial statements SalMar ASA 2019
144
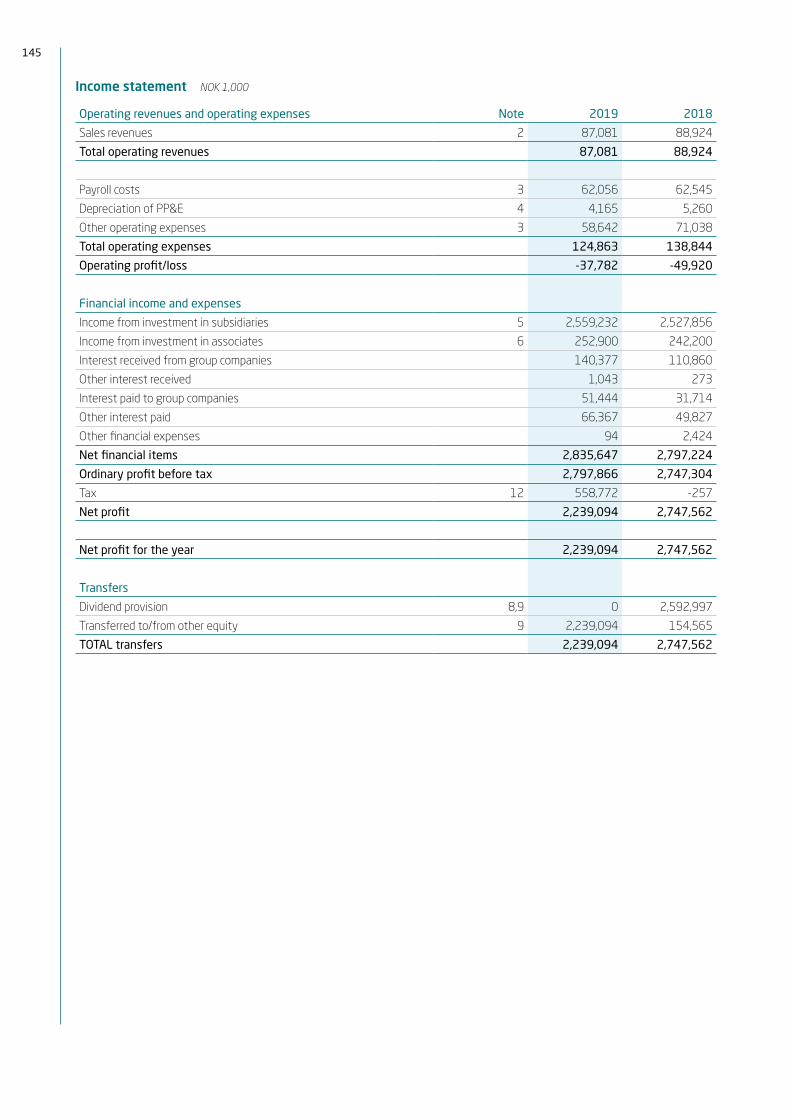
Income statement NOK 1,000
Operating revenues and operating expenses Note 2019 2018
Sales revenues 2 87,081 88,924
Total operating revenues 87,081 88,924
Payroll costs 3 62,056 62,545
Depreciation of PP&E 4 4,165 5,260
Other operating expenses 3 58,642 71,038
Total operating expenses 124,863 138,844
Operating profit/loss -37,782 -49,920
Financial income and expenses
Income from investment in subsidiaries 5 2,559,232 2,527,856
Income from investment in associates 6 252,900 242,200
Interest received from group companies 140,377 110,860
Other interest received 1,043 273
Interest paid to group companies 51,444 31,714
Other interest paid 66,367 49,827
Other financial expenses 94 2,424
Net financial items 2,835,647 2,797,224
Ordinary profit before tax 2,797,866 2,747,304
Tax 12 558,772 -257
Net profit 2,239,094 2,747,562
Net profit for the year 2,239,094 2,747,562
Transfers
Dividend provision 8,9 0 2,592,997
Transferred to/from other equity 9 2,239,094 154,565
TOTAL transfers 2,239,094 2,747,562
145

Balance sheet as at 31 December NOK 1,000
Assets
Non-current assets
Intangible assets Note 2019 2018
Deferred tax assets 12 1,574 1,675
Total intangible assets 1,574 1,675
Property, plant & equipment
Land, buildings & other real property 4 2,652 2,279
Plant, equipment & operating movables 4 6,073 8,581
Total property, plant & equipment 14 8,725 10,860
Non-current financial assets
Investments in subsidiaries 5, 14 2,708,901 2,063,730
Loans to group companies 7, 11, 14 3,209,088 3,163,772
Investments in associates 6 162,787 565,344
Investments in shares & other securities 103 113
Other receivables 7 36,567 88
Total non-current financial assets 6,117,444 5,793,047
Total non-current assets 6,127,744 5,805,582
Current assets
Receivables
Trade receivables 14 504 426
Short-term receivables from group companies 11,14 2,732,165 2,758,955
Other receivables 14 16,235 14,648
Total receivables 2,748,903 2,774,029
Bank deposits, cash & cash equivalents 16 9,772 12,393
Total current assets 2,758,675 2,786,422
Total assets 8,886,419 8,592,004
146 AnnuAl finAnciAl stAtements sAlmAr AsA 2019

Balance sheet as at 31 December NOK 1,000
Equity and liabilities
Equity
Paid-in equity Note 2019 2018
Share capital 8, 9 28,325 28,325
Treasury shares 9 -94 -140
Share premium fund 9 415,285 415,285
Other paid-in equity 9 194,517 147,312
Total paid-in equity 638,033 590,783
Retained earnings
Other equity 9 4,206,351 1,967,257
Total retained earnings 4,206,351 1,967,257
Total equity 9 4,844,384 2,558,040
Liabilities
Other non-current liabilities
Debt to credit institutions 13, 14 2,281,176 1,100,000
Total other non-current liabilities 2,281,176 1,100,000
Current liabilities
Debt to credit institutions 13, 14 171,299 81,675
Trade payables 3,625 1,841
Tax payable 12 558,790 0
Dividend 8, 9 0 2,592,997
Public charges payable 152,518 223,659
Short-term payables to group companies 11 863,660 2,023,597
Other current liabilities 10,967 10,195
Total current liabilities 1,760,858 4,933,964
Total liabilities 4,042,035 6,033,964
Total equity and liabilities 8,886,419 8,592,004
Frøya, 2 April 2020
Atle S. Eide Kjell A. Storeide Margrethe Hauge Helge K. MoenChairman of the Board Member of the Board Member of the Board Member of the Board
Jon Erik Rosvoll Brit Elin Soleng Gustav WitzøeEmployee representative Employee representative CEO
147

Statement of cash flow NOK 1,000
Cash flow from operating activities Note 2019 2018
Ordinary profit before tax 2,797,866 2,747,304
Tax paid in the period 12 -245 -657,699
Ordinary depreciation 4 4,165 5,260
Income from investments in subsidiaries 5 -2,559,232 -2,527,856
Income from investments in associates 6 -252,900 -242,200
Options recognised in expenses 3 6,609 5,492
Change in trade receivables 54,876 -121,847
Change in trade payables 9,701 -9,554
Change in other time-limited items -72,674 124,162
Net cash flow from operating activities -11,835 -676,936
Cash flow from investing activities
Payments for purchases of PP&E 4 -2,029 -5,370
Change in intra-group balances 11 -1,149,388 -468,847
Net group contributions and dividends received from subsidiaries 5, 11 2,531,069 2,781,284
Dividends received from associates and other investments 6 252,900 242,200
Net payments for investments in subsidiaries and associates 6 -301,141 -119,433
Net cash flow from investing activities 1,331,410 2,429,834
Cash flow from financing activities
Repayment of long-term borrowings -658,824 0
Receipts from new long-term borrowings 1,840,000 400,000
Net change in overdraft 89,624 -12,004
Dividend (paid) -2,592,997 -2,138,356
Net cash flow from financing activities -1,322,197 -1,750,361
Net change in bank deposits, cash & cash equivalents -2,622 2,536
Bank deposits, cash & cash equivalents as at 1 Jan 12,393 9,857
Bank deposits, cash & cash equivalents as at 31 Dec 9,772 12,393
Unused drawing rights 2,488,701 3,387,516
148 AnnuAl finAnciAl stAtements sAlmAr AsA 2019


Notes to the Financial Statements SalMar ASA 2019
150

NOTE 1 Accounting principles 152
NOTE 2 Operating income 153
NOTE 3 Payroll costs, no. of employees, remuneration, employee loans, etc 153
NOTE 4 Property, plant & equipment 154
NOTE 5 Subsidiaries 155
NOTE 6 Associates 156
NOTE 7 Receivables falling due more than one year hence 156
NOTE 8 Share capital and shareholders 156
NOTE 9 Equity 157
NOTE 10 Pension costs 157
NOTE 11 Intra-group balances, etc 157
NOTE 12 Tax 158
NOTE 13 Debt 159
NOTE 14 Liens, guarantees, etc 159
NOTE 15 Financial risk 160
NOTE 16 Bank deposits 160
NOTE 17 Events after the balance sheet date 160

Note 1 Accounting principles
The financial statements have been prepared in accordance with the Norwegian Accounting Act of 1998 and generally accepted accounting principles in Norway. The accounting principles described below apply only to the parent company SalMar ASA. Notes relating to the SalMar Group are presented along with the Group’s consolidated financial statements.
Use of estimatesPreparation of the financial statements in accordance with generally accepted accounting principles requires that man-agement make assessments, estimates and assumptions that affect the application of accounting principles, the rec-ognised value of assets and liabilities in the balance sheet, revenues and expenses for the financial year, as well as information relating to uncertain assets and liabilities on the balance sheet date. Estimates and their underlying assump-tions are based on historic experience and other factors which are deemed to be relevant and probable at the time the assessment is made. These assessments affect the book value of assets and liabilities where the valuation is not based on other sources. Estimates are assessed continually, and final values and results may deviate from these estimates. Changes in accounting estimates are recognised in the period in which the change takes place.
Classification and valuation of balance sheet itemsLiquidity is defined as cash and bank deposits.
Assets intended for permanent ownership or use are clas-sified as non-current assets. Other assets are classified as current assets and normally include items falling due for payment within one year, as well as items associated with the production cycle. The classification of current and non-cur-rent liabilities is based on the same criteria.
Non-current assets are valued at acquisition cost. If the recoverable portion of the non-current asset is lower than its book value, and the impairment is not expected to be temporary, the asset is written down to its recoverable value. Non-current assets with a limited economic life are depreci-ated systematically.
Current assets are valued at the lower of acquisition cost and fair value.
Other non-current liabilities are valued at par.
RevenuesServices are taken to income as they are performed. Operat-ing revenues are recognised less public charges, discounts, bonuses and other sales costs.
ReceivablesTrade receivables and other receivables are recognised at par less provisions for bad debts. Provisions for bad debts are determined on the basis of an assessment of the indi-vidual receivable.
Property, plant & equipmentItems of property, plant and equipment are capitalised at his-toric cost price and are depreciated over the asset’s expected lifespan. Costs directly relating to maintenance of property, plant and equipment are charged to operating expenses as they arise, while enhancements or improvements are added to the asset’s cost price and depreciated in line with the asset itself. If the recoverable value of an item of property, plant and equipment is lower than its book value, the asset is written down to its recoverable value. Recoverable value is the higher of net sales value and value in use. Value in use is the present value of future cash flows which the asset will generate.
SharesSubsidiaries, associates and other shares classified as non-current assets are valued in accordance with the cost method. Subsidiaries are companies in which SalMar ASA has a controlling influence, as a result of either legal or actual control. In principle, a controlling influence is deemed to exist when the company’s direct or indirect shareholding exceeds 50 per cent of the voting capital. Associates are companies in which SalMar has a considerable influence. Considerable influence is normally deemed to exist when the company owns 20–50 per cent of the voting capital. Investments are valued at the shares’ acquisition cost unless a write-down has been necessary. Write-downs to fair value are performed when the impairment is due to reasons that are not deemed to be of a temporary nature and are required under generally accepted accounting principles. Write-downs are reversed when the reason for the write-down no longer applies.
Dividend and other payouts are recognised as other financial income. If the dividend exceeds the share of withheld profit/loss after acquisition, the surplus amount represents a repay-ment of invested capital, and the payouts are deducted from the value of the investment in the balance sheet.
PensionsThe company has a defined-contribution occupational pen-sion scheme. Pension premiums are charged to expenses as they arise, and the Group has no other liabilities over and above this annual payment.
152 Notes to the FiNaNcial statemeNts salmar asa 2019

Share-based remuneration (Restricted Share Unit Plan – RSU)The company has share-based incentive schemes, under which the company receives services from the employees in return for equity instruments (RSUs). The fair value of the services rendered by the employees in return for the RSUs awarded is recognised as an expense, with a correspond-ing increase in paid-in equity. The total amount charged to expenses over the vesting period is determined on the basis of fair value at the time the RSUs were granted, and the number of RSUs which are expected to accrue.
Fair value includes the effect of any market terms, but does not take account of the impact of any vesting terms that are not market terms. However, vesting terms that are not mar-ket terms affect the number of RSUs that can be expected to be earned.
The total expense is periodised over the vesting period. On the balance sheet date, the company recalculates its esti-mates for the number of options that are expected to vest. The company recognises the effect of any changes in the
original estimates in profit and loss, with a corresponding adjustment in equity. The value of options relating to employ-ees of subsidiaries is posted to investments in subsidiaries.
TaxThe tax expense is matched against profit/loss before tax. Tax relating to equity transactions is recognised in equity. The tax expense comprises tax payable (tax on the compa-ny’s taxable income for the year as it appears in the income statement), and any change in net deferred tax. Deferred tax is calculated at the rate of 22 per cent on the temporary differences between accounting and tax values, as well as tax losses carried forward at the end of the financial year. Deferred tax liabilities and deferred tax assets are presented net in the balance sheet.
Statement of cash flowThe company’s statement of cash flow shows a breakdown of the company’s cash flow by operating, investing and financing activity. The statement shows the individual activity’s impact on liquidity. The statement of cash flow has been drawn up in accordance with the indirect method.
Note 2 Operating income
The parent company SalMar ASA is a holding company pri-marily engaged in the provision of administrative services to its subsidiaries.
Consequently, the parent company’s revenues derive solely from one business area, and are divided between revenues from intra-group services and other revenues as specified below.
NOK 1,000 2019 2018
Revenues from provision of administrative services to group companies 86,539 88,150
Other revenues 542 774
Total 87,081 88,924
Note 3 Payroll costs, no. of employees, remuneration, employee loans, etc
Payroll costs
NOK 1,000 2019 2018
Salaries, incl. holiday pay & bonuses 42,544 41,247
Employers’ national insurance contributions 5,461 6,597
Pension costs 1,507 1,447
Options/RSUs 6,609 5,492
Other benefits 5,936 7,762
Total 62,056 62,545
No. of people employed (full-time equivalents) during the financial year 33 32
153

Remuneration paid to senior company officers and the auditorPlease see Note 24 to the consolidated financial statements for details of the remuneration paid to senior executives.
Restricted Share Unit Plan (RSU)On 21 January 2019, 11 employees were formally awarded 18,390 RSUs in respect of the company’s shares for the 2018 financial year. Correspondingly, on 15 January 2018, 14 company employees were awarded 43,424 RSUs for the 2017 financial year. The award for 2019 was formally made on 31 January 2020. The RSUs vest over a period of 3 years, with 1/3 accruing each year. The fair value of the cost in SalMar ASA is calculated on the date of the award and periodised over the accrual period. The periodised cost in 2019 is NOK 6.6 million (2018: NOK 5.5 million). A provision has been made with respect to employers’ national insurance contributions on the cost.
Please see Note 25 to the consolidated financial statements for details of the share-based incentive schemes.
AuditorThe fee paid to the auditor, excl. VAT, breaks down as follows:
NOK 1,000 2019 2018
Statutory auditing services 288 275
Other certification services 4 30
Tax advisory services 1,748 13
Other services 107 137
Total 2,147 506
Note 4 Property, plant & equipment
NOK 1,000 Real property
Operating equipment,
fixtures, etc TOTAL
Acquisition cost 1 Jan 2019 2,450 30,119 32,569
Additions 373 1,656 2,029
Disposals 0 0 0
Acquisition cost 31 Dec 2019 2,823 31,775 34,598
Acc. depreciation & write-downs 1 Jan 2019 171 21,537 21,709
Year’s depreciation 0 4,165 4,165
Acc. depreciation 31 Dec 2019 171 25,702 25,873
Book value 31 Dec 2019 2,652 6,073 8,725
Economic lifespan No dep./3 years 5-10 years
Depreciation plan Straight line Straight line
Annual leasing of off-balance sheet operating assets 3,423 - 3,423
154 Notes to the FiNaNcial statemeNts salmar asa 2019

Note 5 Subsidiaries
Investments in subsidiaries are recognised in accordance with the cost method.
Company (NOK 1,000) Registered officeVoting share/ shareholding Book value 2019 Book value 2018
SalMar Settefisk AS Kverva 100.0% 226,884 229,898
SalMar Farming AS Kverva 100.0% 506,326 519,638
SalMar Ocean AS Kverva 100.0% 36
SalMar AS Kverva 100.0% 1,206,941 1,212,539
SalMar Tunet AS Kverva 100.0% 7,400 7,400
Hitramat Farming AS Hitra 51.0% 28,785 28,785
Ocean Farming AS Kverva 100.0% 69,759 63,460
Mariculture AS Stavanger 51.0% 2,000 2,000
Arnarlax AS Kverva 59.4% 660,769
TOTAL subsidiaries 2,708,901 2,063,730
In February 2019, SalMar ASA acquired 12.28 per cent of the shares in Arnarlax AS, for a consideration of NOK 179.8 million. SalMar ASA already owned 41.95 per cent of the shares and has had a considerable influence over the com-pany. Following the transaction, SalMar ASA owned 54.23 per cent of the company’s shares, and the investment has from this date been classified as a subsidiary. SalMar ASA acquired a further 7.54 per cent of the company’s shares in April 2019 for a total consideration of NOK 111.9 million. In August 2019, 2.41 per cent of the shares were sold for NOK 35.7 million. The consideration was settled in the form
of a seller’s credit to the buyer (see Note 7). Following this transaction, SalMar ASA owns 59.36 per cent of the shares in Arnarlax AS.
Arnarlax AS owns 100 per cent of the shares in Arnarlax Ehf. Arnarlax Ehf is Iceland’s largest salmon farming company, and is located in the country’s Westfjords district.
For further details of these transactions, please see Note 8 to the consolidated financial statements.
SalMar ASA has recognised group contributions from the following subsidiaries: NOK 1,000 2019 2018
SalMar Farming AS 2,546,839 18,676
Total recognised group contributions from subsidiaries 2,546,839 18,676
SalMar ASA has recognised dividends from the following subsidiaries: NOK 1,000 2019 2018
SalMar Farming AS 0 2,500,000
Hitramat Farming AS 12,393 9,180
Total recognised dividends from subsidiaries 12,393 2,509,180
Total recognised income from investments in subsidiaries 2,559,232 2,527,856
155
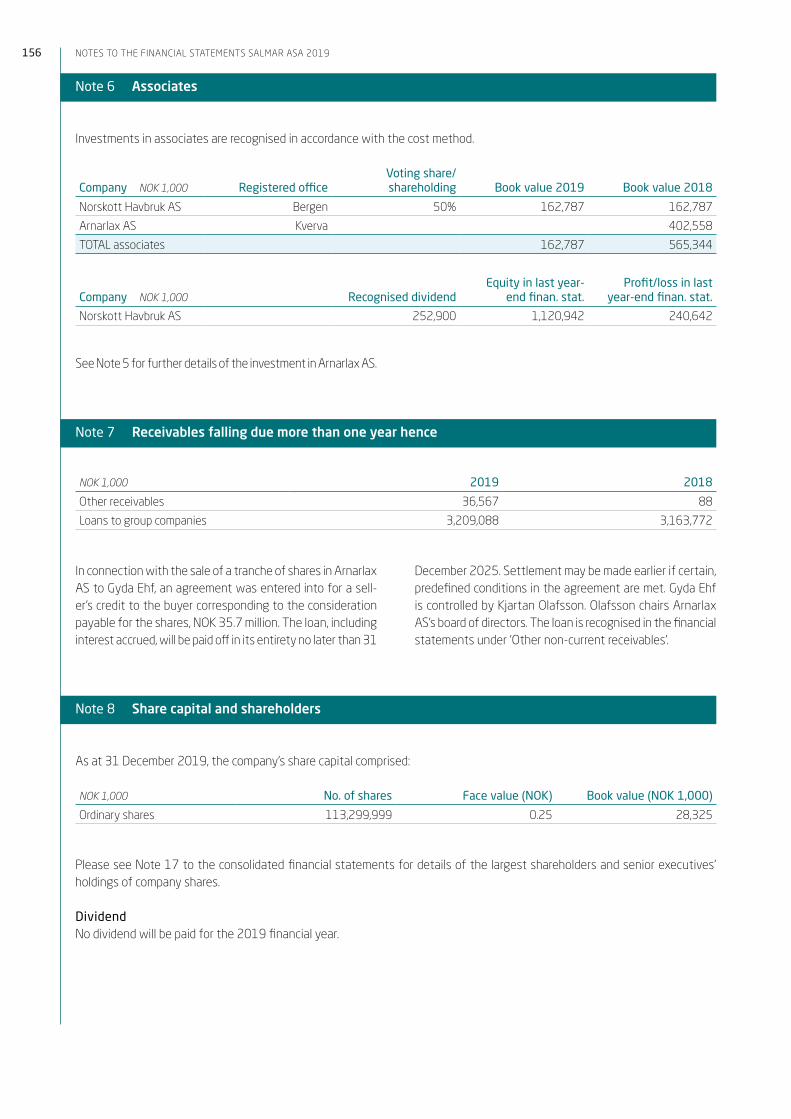
Note 6 Associates
Investments in associates are recognised in accordance with the cost method.
Company NOK 1,000 Registered officeVoting share/ shareholding Book value 2019 Book value 2018
Norskott Havbruk AS Bergen 50% 162,787 162,787
Arnarlax AS Kverva 402,558
TOTAL associates 162,787 565,344
Company NOK 1,000 Recognised dividendEquity in last year-
end finan. stat.Profit/loss in last
year-end finan. stat.
Norskott Havbruk AS 252,900 1,120,942 240,642
See Note 5 for further details of the investment in Arnarlax AS.
Note 7 Receivables falling due more than one year hence
NOK 1,000 2019 2018
Other receivables 36,567 88
Loans to group companies 3,209,088 3,163,772
In connection with the sale of a tranche of shares in Arnarlax AS to Gyda Ehf, an agreement was entered into for a sell-er’s credit to the buyer corresponding to the consideration payable for the shares, NOK 35.7 million. The loan, including interest accrued, will be paid off in its entirety no later than 31
December 2025. Settlement may be made earlier if certain, predefined conditions in the agreement are met. Gyda Ehf is controlled by Kjartan Olafsson. Olafsson chairs Arnarlax AS’s board of directors. The loan is recognised in the financial statements under ‘Other non-current receivables’.
Note 8 Share capital and shareholders
As at 31 December 2019, the company’s share capital comprised:
NOK 1,000 No. of shares Face value (NOK) Book value (NOK 1,000)
Ordinary shares 113,299,999 0.25 28,325
Please see Note 17 to the consolidated financial statements for details of the largest shareholders and senior executives’ holdings of company shares.
DividendNo dividend will be paid for the 2019 financial year.
156 Notes to the FiNaNcial statemeNts salmar asa 2019

Note 9 Equity
NOK 1,000Share
capitalTreasury
sharesShare premium
fundOther paid-
in equityOther
equityTotal
equity
Equity 31 Dec 2018 28,325 -140 415,285 147,312 1,967,257 2,558,040
Year’s change in equity:
Profit/loss in the period 0 0 0 0 2,239,094 2,239,094
Share-based remuneration - release 0 46 0 -46 0 0
Share-based remuneration - capital injection 0 0 0 47,614 0 47,614
Tax effect of share-based remuneration 0 0 0 -363 0 -363
Equity 31 Dec 2019 28,325 -94 415,285 194,517 4,206,351 4,844,384
Agreements relating to share-based remuneration have been entered into with senior company executives. See Note 3 for further details.
Note 10 Pension costs
The company has a statutory obligation to provide an occu-pational pension scheme under the Compulsory Occupational Pensions Act, and has a pension scheme that meets the requirements thereof.
The company has no defined-benefits pension schemes.
Premiums under the defined-contribution scheme are charged to expenses as they fall due. In 2019, NOK 1.5 million was charged to expenses in respect of this scheme, which covered 33 people. The corresponding amount charged to expenses in 2018 was NOK 1.4 million, while the scheme covered 32 people.
Note 11 Intra-group balances, etc
Non-current receivables Other short-term receivables
NOK 1,000 2019 2018 2019 2018
Group companies 3,209,088 3,163,772 2,732,165 2,758,955
Total 3,209,088 3,163,772 2,732,165 2,758,955
Non-current receivables Other short-term receivables
NOK 1,000 2019 2018 2019 2018
Group companies 0 0 863,660 2,023,597
TOTAL 0 0 863,660 2,023,597
Other short-term receivables from group companies, which totalled NOK 2,732.2 million as at 31 December 2019, includes group contributions receivable in the amount of NOK 2,546.8 million (2018: NOK 18.7 million). Other short-term receivables as at 31 December 2018 also includes NOK 2,500 million in dividend receivables from subsidiaries. Other short-term receivables over and above this are ordinary trade receivables.
The NOK 863.7 million in other short-term payables to group companies as at 31 December 2019 includes NOK 835.7 million in payables to group companies participating in the group account scheme (2018: NOK 2,003.7 million). The remaining short-term payables to group companies were ordinary trade payables.
157

Note 12 Tax
Breakdown of the year’s tax expense NOK 1,000 2019 2018
Tax payable 558,677 0
Change in deferred tax -263 -463
Tax provisions (shortfall/excess) in previous years 358 171
Effect of change in tax rate from 23% to 22% 0 35
Tax on ordinary profit/loss 558,772 -257
Breakdown of the year’s taxable income 2019 2018
Profit/loss before tax 2,797,866 2,747,304
Permanent differences -259,621 -2,749,317
Change in temporary differences 1,196 2,012
Year’s taxable income 2,539,441 0
Tax payable in the balance sheet 2019 2018
Tax payable on the year’s profit/loss 558,677 0
Tax payable from previous years, offset 113 0
Tax payable in the balance sheet 558,790 0
Breakdown of temporary differences 2019 2018
Operating assets -1,449 -345
Non-current financial assets 1 69
Profit & loss account 56 70
Other differences -5,765 -7,405
TOTAL temporary differences -7,156 -7,612
Deferred tax liabilities (+) / deferred tax assets (-) -1,574 -1,675
Deferred tax recognised in equity -363 518
Reconciliation from nominal to actual tax rate 2019 2018
Profit/loss before tax 2,797,866 2,747,304
Expected tax on income at nominal tax rate 615,530 631,880
Permanent differences (22% / 23%) -57,117 -632,343
Tax provisions (shortfall/excess) / effect of changed tax rate 358 206
Estimated tax expense 558,772 -257
Effective tax rate 20.0% 0.0%
The company’s tax rate is largely dependent on whether appropriations from subsidiaries are received in the form of a dividend or group contribution. Dividends from subsidiaries are tax-free income, while group contributions are taxable income. See Note 5 for further details.
158 Notes to the FiNaNcial statemeNts salmar asa 2019

Note 13 Debt
Loan repayment profileIn 2019, SalMar ASA renewed its instalment loan agreement. The loan comprises two tranches of NOK 500 million each: a commercial tranche, where the banks assume the credit risk; and an Export Credit Agency (ECA) tranche, where the banks lend the funds but are fully guaranteed by GIEK. Both tranches have an 8.5-year repayment profile, and a term of 3+1+1 years. In addition, the company has an investment and acquisition facility of NOK 2,000 million and a revolving credit facility of NOK 1,500 million. These facilities were renewed in February 2018 and also have a term of 3+1+1 years. These facilities therefore currently mature in February 2022, with an option to extend maturity to 2023. As at 31 December 2019, NOK 290 million had been drawn down on
the investment and acquisition facility and NOK 1,050 million on the revolving credit facility.
In addition, the company has an annually renewable overdraft facility capped at NOK 500.0 million. Interest terms are based on so-called ‘current terms’.
Financial covenantsThe most important financial covenants for the long-term financing of SalMar ASA are, respectively, a solvency require-ment, which stipulates that the Group’s recognised equity ratio shall exceed 35%, and a profitability requirement, which stipulates that the Group’s interest coverage rate (EBITDA/net financial expenses) shall not exceed 4.0.
Note 14 Liens, guarantees, etc
Recognised debt secured through liens, etc NOK 1,000 2019 2018
Short-term debt to credit institutions 171,299 81,675
Long-term debt to credit institutions 2,281,176 1,100,000
Total 2,452,475 1,181,675
Book value of assets pledged as security for recognised debt NOK 1,000 2019 2018
Operating assets 8,725 10,860
Shares 2,708,901 2,063,730
Trade receivables 504 426
Receivables 5,994,054 5,937,375
Total 8,712,183 8,012,390
Under the agreement with its bank, SalMar has assumed a joint and several liability in connection with a group account overdraft scheme, limited upwards to NOK 500 million.
SalMar ASA has issued a guarantee for NOK 95 million with respect to a long-term loan to SalMar AS and a guarantee for NOK 175 million with respect to a long-term loan to Ocean Farming AS. Both loans have been granted by Inno-vation Norway.
SalMar ASA has issued a guarantee totalling NOK 5 million to Nord-Trøndelag E-verk on behalf of SalMar Settefisk AS. The guarantee agreement was entered into on 1 January 2004, and is reduced by NOK 250,000 per year. As at 31 December 2019, the remaining amount guaranteed totalled NOK 1 billion.
SalMar ASA has issued a guarantee to Nordskag Næringspark AS for any and all amounts which SalMar AS owes Nordskag Næringspark AS under the leasing agreement between Sal-Mar AS and Nordskag Næringspark AS. The guarantee is valid during the leasing period, as stipulated in the leasing agreement, plus a further three months.
SalMar ASA has issued a guarantee totalling NOK 544.1 million to HENT AS as security for SalMar AS’s liabilities to creditors in connection with the EPC/turnkey contract for construction of a new harvesting and processing facility – InnovaNor.
159
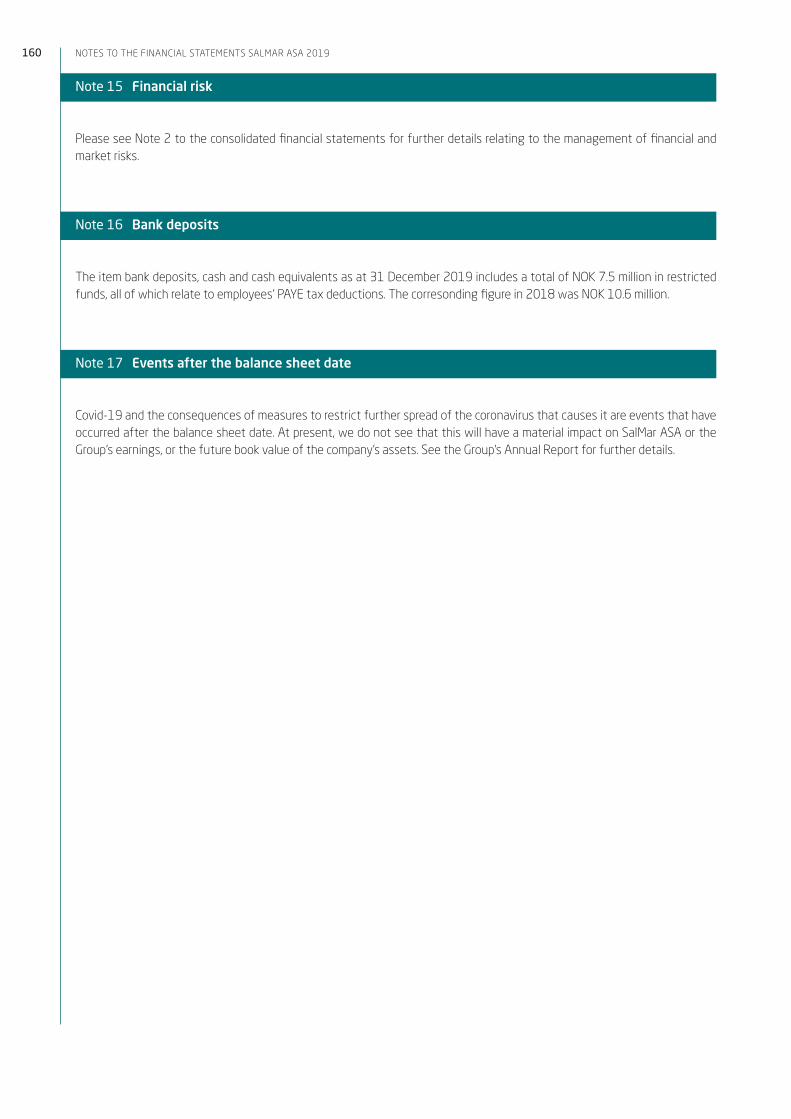
Note 15 Financial risk
Please see Note 2 to the consolidated financial statements for further details relating to the management of financial and market risks.
Note 16 Bank deposits
The item bank deposits, cash and cash equivalents as at 31 December 2019 includes a total of NOK 7.5 million in restricted funds, all of which relate to employees’ PAYE tax deductions. The corresonding figure in 2018 was NOK 10.6 million.
Note 17 Events after the balance sheet date
Covid-19 and the consequences of measures to restrict further spread of the coronavirus that causes it are events that have occurred after the balance sheet date. At present, we do not see that this will have a material impact on SalMar ASA or the Group’s earnings, or the future book value of the company’s assets. See the Group’s Annual Report for further details.
160 Notes to the FiNaNcial statemeNts salmar asa 2019

Statement by the board of directors and CEO
161

We confirm, to the best of our knowledge, that:• The Group financial statements for the period from 1 January to 31 December 2019 have been prepared in
accordance with IFRS, as adopted by the EU.• The financial statements of SalMar ASA for the period from 1 January to 31 December 2019 have been prepared in
accordance with Norwegian Accounting Act and accounting standards and practices generally accepted in Norway.• The financial statements give a true and fair view of the Group and the Company’s consolidated assets, liabilities,
financial position and results of operations.• The Report of Board of Directors provides a true and fair view of the development and performance of the business
and the position of the Group and the Company, together with a description of the key risks and uncertainty factors that the Group and the Company is facing.
Frøya, 2 April 2020
Atle S. Eide Kjell A. Storeide Margrethe Hauge Helge K. MoenChairman of the Board Member of the Board Member of the Board Member of the Board
Jon Erik Rosvoll Brit Elin Soleng Gustav WitzøeEmployee representative Employee representative CEO
162 Statement by the board of directorS and ceo

Auditor's report
163

A member firm of Ernst & Young Global Limited
Statsautoriserte revisorer Ernst & Young AS Havnegt. 9, NO-7010 Trondheim Postboks 1299 Pirsenteret, NO-7462 Trondheim
Foretaksregisteret: NO 976 389 387 MVA Tlf: +47 24 00 24 00 www.ey.no Medlemmer av Den norske revisorforening
INDEPENDENT AUDITOR’S REPORT
To the Annual Shareholders' Meeting of SalMar ASA
Report on the audit of the financial statements
Opinion We have audited the financial statements of SalMar ASA comprising the financial statements of the parent company and the Group. The financial statements of the parent company comprise the balance sheet as at 31 December 2019, the income statement, statements of cash flows for the year then ended and notes to the financial statements, including a summary of significant accounting policies. The consolidated financial statements comprise the balance sheet as at 31 December 2019, the statements of comprehensive income, cash flows and changes in equity for the year then ended and notes to the financial statements, including a summary of significant accounting policies.
In our opinion,
► the financial statements are prepared in accordance with the law and regulations ► the financial statements present fairly, in all material respects, the financial position of the parent
company as at 31 December 2019, and of its financial performance and its cash flows for the year then ended in accordance with the Norwegian Accounting Act and accounting standards and practices generally accepted in Norway
► the consolidated financial statements present fairly, in all material respects the financial position of the Group as at 31 December 2019 and of its financial performance and its cash flows for the year then ended in accordance with International Financial Reporting Standards as adopted by the EU
Basis for opinion We conducted our audit in accordance with laws, regulations, and auditing standards and practices generally accepted in Norway, including International Standards on Auditing (ISAs). Our responsibilities under those standards are further described in the Auditor’s responsibilities for the audit of the financial statements section of our report. We are independent of the Company and the Group in accordance with the ethical requirements that are relevant to our audit of the financial statements in Norway, and we have fulfilled our ethical responsibilities as required by law and regulations. We have also complied with our other ethical obligations in accordance with these requirements. We believe that the audit evidence we have obtained is sufficient and appropriate to provide a basis for our opinion.
Key audit matters Key audit matters are those matters that, in our professional judgment, were of most significance in our audit of the financial statements for 2019. These matters were addressed in the context of our audit of the financial statements as a whole, and in forming our opinion thereon, and we do not provide a separate opinion on these matters. For each matter below, our description of how our audit addressed the matter is provided in that context.
We have fulfilled the responsibilities described in the Auditor’s responsibilities for the audit of the financial statements section of our report, including in relation to these matters. Accordingly, our audit included the performance of procedures designed to respond to our assessment of the risks of material misstatement of the financial statements. The results of our audit procedures, including the procedures performed to address the matters below, provide the basis for our audit opinion on the financial statements.
164 Auditor's report

2
Independent auditor's report - SalMar ASA A member firm of Ernst & Young Global Limited
Fair value of biological assets
The Group measures biological assets at fair value less costs to sell in accordance with IAS 41 and IFRS 13. At December 31, 2019 the biological assets amounted to NOK 5 720.8 million. The difference between the fair value of the biological assets and the related cost is recognized as a fair value adjustment. In 2019, the recognized fair value adjustment amounted to NOK 151.6 million. The fair value adjustment included in the carrying amount was NOK 1 954.0 million.
For fish in sea the fair value less costs to sell was calculated using a model based on a net present value methodology. This is calculated based on assumptions of biomass volumes, quality, market prices at the harvest dates, remaining expenses to produce, harvest and sell the biomass and time in sea until harvest mature. The market prices are based on observable forward prices for the period when harvesting is expected. The fair value of biological assets was a key audit matter due to the significant amount, the level of judgements involved in the valuation and the assumptions used in the calculation.
We evaluated the valuation and the model against the requirements in IAS 41, IFRS 13 and industry practice. We observed the routines and tested controls related to the calculation of the fair value adjustment of the biomass. We compared the prices applied against observable market prices at the expected harvesting dates. In addition, we evaluated the estimated remaining expenses to produce the harvest mature fish, including assumptions on size distribution of the biomass, time in sea until harvest mature, mortality and quality of the live fish in sea. Furthermore, we evaluated the historical accuracy in prior periods’ estimates and the sensitivity analysis of changes in expected prices, biomass and discount rate. We recalculated the model used to calculate fair value for the relevant weight classes.
We assessed the Group’s disclosures regarding fair value of biological assets included in note 1, note 14 and note 15 with respect to the Group’s principles, significant estimates and assumptions.
Other information Other information consists of the information included in the Company’s annual report other than the financial statements and our auditor’s report thereon. The Board of Directors and Chief Executive Officer (management) are responsible for the other information. Our opinion on the financial statements does not cover the other information, and we do not express any form of assurance conclusion thereon.
In connection with our audit of the financial statements, our responsibility is to read the other information, and, in doing so, consider whether the other information is materially inconsistent with the financial statements or our knowledge obtained in the audit, or otherwise appears to be materially misstated. If, based on the work we have performed on the other information obtained prior to the date of the auditor’s report, we conclude that there is a material misstatement of this other information, we are required to report that fact. We have nothing to report in this regard.
Responsibilities of management for the financial statements Management is responsible for the preparation and fair presentation of these financial statements in accordance with the Norwegian Accounting Act and accounting standards and practices generally accepted in Norway for the financial statements of the parent company and International Financial Reporting Standards as adopted by the EU for the financial statements of the Group, and for such internal control as management determines is necessary to enable the preparation of financial statements that are free from material misstatement, whether due to fraud or error.
In preparing the financial statements, management is responsible for assessing the Company’s ability to continue as a going concern, disclosing, as applicable, matters related to going concern and using the going concern basis of accounting, unless management either intends to liquidate the Company or to cease operations, or has no realistic alternative but to do so.
165

3
Independent auditor's report - SalMar ASA A member firm of Ernst & Young Global Limited
Auditor’s responsibilities for the audit of the financial statements Our objectives are to obtain reasonable assurance about whether the financial statements as a whole are free from material misstatement, whether due to fraud or error, and to issue an auditor’s report that includes our opinion. Reasonable assurance is a high level of assurance, but is not a guarantee that an audit conducted in accordance with ISAs will always detect a material misstatement when it exists. Misstatements can arise from fraud or error and are considered material if, individually or in the aggregate, they could reasonably be expected to influence the economic decisions of users taken on the basis of these financial statements.
As part of an audit in accordance with law, regulations and generally accepted auditing principles in Norway, including ISAs, we exercise professional judgment and maintain professional scepticism throughout the audit. We also
► identify and assess the risks of material misstatement of the financial statements, whether due to fraud or error, design and perform audit procedures responsive to those risks, and obtain audit evidence that is sufficient and appropriate to provide a basis for our opinion. The risk of not detecting a material misstatement resulting from fraud is higher than for one resulting from error, as fraud may involve collusion, forgery, intentional omissions, misrepresentations, or the override of internal control;
► obtain an understanding of internal control relevant to the audit in order to design audit procedures that are appropriate in the circumstances, but not for the purpose of expressing an opinion on the effectiveness of the Company’s internal control;
► evaluate the appropriateness of accounting policies used and the reasonableness of accounting estimates and related disclosures made by management;
► conclude on the appropriateness of management’s use of the going concern basis of accounting and, based on the audit evidence obtained, whether a material uncertainty exists related to events or conditions that may cast significant doubt on the Company’s ability to continue as a going concern. If we conclude that a material uncertainty exists, we are required to draw attention in our auditor’s report to the related disclosures in the financial statements or, if such disclosures are inadequate, to modify our opinion. Our conclusions are based on the audit evidence obtained up to the date of our auditor’s report. However, future events or conditions may cause the Company to cease to continue as a going concern;
► evaluate the overall presentation, structure and content of the financial statements, including the disclosures, and whether the financial statements represent the underlying transactions and events in a manner that achieves fair presentation;
► obtain sufficient appropriate audit evidence regarding the financial information of the entities or business activities within the Group to express an opinion on the consolidated financial statements. We are responsible for the direction, supervision and performance of the group audit. We remain solely responsible for our audit opinion.
We communicate with those charged with governance regarding, among other matters, the planned scope and timing of the audit and significant audit findings, including any significant deficiencies in internal control that we identify during our audit.
We also provide those charged with governance with a statement that we have complied with relevant ethical requirements regarding independence, and communicate with them all relationships and other matters that may reasonably be thought to bear on our independence, and where applicable, related safeguards.
From the matters communicated with those charged with governance, we determine those matters that were of most significance in the audit of the financial statements of the current period and are therefore the key audit matters. We describe these matters in our auditor’s report unless law or regulation precludes public disclosure about the matter or when, in extremely rare circumstances, we determine that a matter should not be communicated in our report because the adverse consequences of doing so would reasonably be expected to outweigh the public interest benefits of such communication.
166 Auditor's report

4
Independent auditor's report - SalMar ASA A member firm of Ernst & Young Global Limited
Report on other legal and regulatory requirements
Opinion on the Board of Directors’ report and on the statements on corporate governance and corporate social responsibility Based on our audit of the financial statements as described above, it is our opinion that the information presented in the Board of Directors’ report and in the statements on corporate governance and corporate social responsibility concerning the financial statements, the going concern assumption and proposal for the allocation of the result is consistent with the financial statements and complies with the law and regulations.
Opinion on registration and documentation Based on our audit of the financial statements as described above, and control procedures we have considered necessary in accordance with the International Standard on Assurance Engagements (ISAE) 3000, «Assurance Engagements Other than Audits or Reviews of Historical Financial Information», it is our opinion that management has fulfilled its duty to ensure that the Company's accounting information is properly recorded and documented as required by law and bookkeeping standards and practices accepted in Norway.
Trondheim, 2 April 2020 ERNST & YOUNG AS
Christian Ronæss State Authorised Public Accountant (Norway)
(This translation from Norwegian has been made for information purposes only.)
167

w w w . s a l m a r . n o
Rose
nbor
g Re
klam
e 03
89


