146
LIGHT IS A FASCINATING TOOL Annual Report Geschäftsbericht 2015

ANN
UAL
REP
OR
T |
GES
CHÄF
TSB
ERIC
HT
2
015
LIGHT IS A FASCINATING TOOL
Annual ReportGeschäftsbericht
2015

ROFIN-SINAR TECHNOLOGIES INC.INVESTMENT PROFILE
The Vision & Mission.Light, when used as a manufacturing tool, is fascinating; it offers a virtually infinite potential of applications in materials processing. At ROFIN, our mission is to create sustainable value by pioneering key innovative laser technologies and highly efficient production solutions for a worldwide customer base.
The Company.For 40 years, our focus has been to develop advanced production methods for a wide variety of industrial applications. Over this time, ROFIN has become one of the leading global players in the industrial laser materials processing sector and possesses one of the industry’s most comprehensive product, technology and process portfolios. Headquartered in Plymouth, MI, and Hamburg, Germany, our Company maintains more than 20 production facilities in the US, Europe and Asia as well as an extensive global sales and service network. Innovative laser technology from ROFIN is currently being used in many traditional and emerging industries worldwide.
The Strengths.With a steady focus on our core competencies, we offer our clients both standard and customized production solutions based on a comprehensive range of products and technologies. Our in-depth technology and applications know-how benefits our large and diverse customer base in numerous end-markets. Close cooperation with our clients provides us with sector-specific market insight and essential expertise in the requirements and developments of each market. ROFIN has a highly esteemed brand name and a current installed base of more than 55,000 laser units. Our well-structured sales and service network ensures that our clients around the world receive the best possible support. The ROFIN management team has extensive international experience and ROFIN’s highly qualified employees are committed to our and our customers’ success.
The Growth Strategy.The core objectives of our growth strategy are to expand into new industries and applications, driving new laser products through technological innovation, capitalizing on our existing proprietary process technologies and introduce new process applications. We intend to gain further advantage from our strong and highly diversified core business whilst also leveraging the high growth potential of recent technology trends such as fiber laser and ultrashort pulse lasers. Another focus of our growth strategy is expanding our customer footprint and leveraging cross-selling opportunities among our business units. Acquisitions of select complementary business segments, technologies or product portfolios provide an additional channel of growth.
The Shares.ROFIN’s shares trade on the NASDAQ Global Select Market under the symbol RSTI and are listed in Germany in the “Prime Standard” segment of the Frankfurt Stock Exchange under ISIN US7750431022. ROFIN is amongst others part of the Standard & Poor’s SmallCap 600 Index and the Russell 2000 Index.
Adding Value with Light
Mit Licht Werte scha� en
ROFIN-SINAR TECHNOLOGIES INC.INVESTMENTPROFIL
Die Vision & Zielsetzung.Licht als „Werkzeug“ ist faszinierend: es bietet ein nahezu unbegrenztes Anwendungspotential in der Materialbearbeitung. Unser Ziel ist die Schaffung nachhaltiger Werte durch die Entwicklung neuer laserbasierter Schlüsseltechnologien und hocheffizienter Produktionslösungen für eine weltweite Kundenbasis.
Das Unternehmen.Seit 40 Jahren konzentriert sich unser Unternehmen auf die Entwicklung fortschrittlicher Fertigungsmethoden für eine Vielzahl industrieller Anwendungen. In dieser Zeit hat ROFIN sich zu einem der führenden Global Player im Bereich der Lasermaterialbearbeitung entwickelt und besitzt eines der breitesten Produkt-, Technologie- und Prozessportfolios im Markt. Mit Hauptsitzen in Plymouth, MI (USA), und Hamburg verfügen wir über mehr als 20 Produktionsstätten in den USA, Europa und Asien sowie über ein umfangreiches Vertriebs- und Servicenetz rund um den Globus. Innovative Lasertechnologie von ROFIN wird heute weltweit in vielen etablierten Industrien und Wachstumsbranchen genutzt.
Die Stärken.Wir fokussieren uns konsequent auf unsere Kernkompetenzen und bieten standardisierte und kundenspezifische Produktionslösungen auf breiter Produkt- und Technologiebasis. Von unserem tief greifenden Technologie- und Applikationswissen profitiert ein großer Kundenstamm in vielen diversifizierten Endmärkten. Eine enge Kooperation mit unseren Kunden gewährleistet die Marktnähe, die für eine fundierte Kenntnis der Marktbedürfnisse und -entwicklungen notwendig ist. ROFIN ist eine Marke mit sehr hoher globaler Akzeptanz und einer derzeit installierten Laserbasis von über 55.000 Einheiten. Unser gut strukturiertes Vertriebs- und Servicenetzwerk garantiert unseren Kunden in aller Welt die bestmögliche Betreuung. ROFIN hat ein international sehr erfahrenes Management sowie ein hochqualifiziertes Mitarbeiterteam, das sich für unseren und den Erfolg unserer Kunden engagiert.
Die Wachstumsstrategie.Die Kernziele unserer Wachstumsstrategie liegen in der Eröffnung neuer Industrien und Anwendungen, der Entwicklung neuer Laserprodukte durch technologische Innovation, der Vermarktung unserer geschützten Prozesstechnologien sowie der Einführung neuer Applikationsprozesse. Ziel ist es zudem, sowohl von unserem starken und breit diversifizierten Basisgeschäft als auch vom Wachstumspotential neuerer Technologietrends wie Faser- oder Ultrakurzpulslaser zu profitieren. Weitere Schwerpunkte unserer Wachstumsstrategie sind die Erweiterung unserer Kundenbasis und die Nutzung der Cross-Selling-Effekte in den verschiedenen Geschäftsbereichen. Die Akquisition ausgewählter komplementärer Geschäftsfelder, Technologien oder Produktportfolios bietet zusätzliche Wachstumsperspektiven.
Die Aktie.Die ROFIN-Aktie ist am NASDAQ Global Select Market unter dem Kürzel RSTI und im Prime Standard der Frankfurter Wertpapierbörse unter der ISIN US7750431022 notiert. ROFIN wird u.a. im Standard & Poor’s SmallCap 600 und im Russell 2000 Index geführt.
FACTS & FIGURES | ZAHLEN & FAKTEN
OVERVIEW | ÜBERBLICK
TECHNOLOGIES | TECHNOLOGIEN
SALES STRATEGY | VERTRIEBSSTRATEGIE
LASERS & LASER SYSTEMS WITH THE ROFIN BRAND | LASER & LASERSYSTEME DER MARKE ROFIN
ADDITIONAL GROUP BRANDS FOR LASERS & COMPONENTS | WEITERE MARKEN DER GRUPPE FÜR LASER & KOMPONENTEN
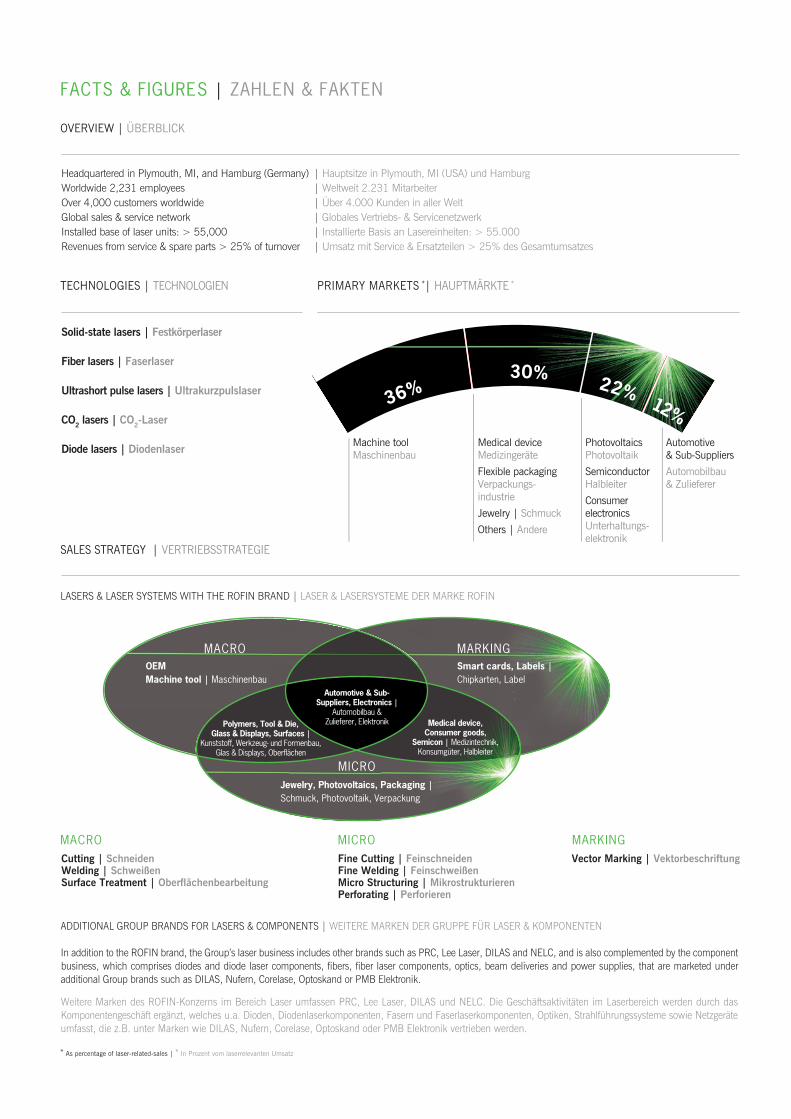
In addition to the ROFIN brand, the Group’s laser business includes other brands such as PRC, Lee Laser, DILAS and NELC, and is also complemented by the component business, which comprises diodes and diode laser components, fibers, fiber laser components, optics, beam deliveries and power supplies, that are marketed under additional Group brands such as DILAS, Nufern, Corelase, Optoskand or PMB Elektronik.
Weitere Marken des ROFIN-Konzerns im Bereich Laser umfassen PRC, Lee Laser, DILAS und NELC. Die Geschäftsaktivitäten im Laserbereich werden durch das Komponentengeschäft ergänzt, welches u.a. Dioden, Diodenlaserkomponenten, Fasern und Faserlaserkomponenten, Optiken, Strahlführungssysteme sowie Netzgeräte umfasst, die z.B. unter Marken wie DILAS, Nufern, Corelase, Optoskand oder PMB Elektronik vertrieben werden.
MACRO MICRO MARKING
PRIMARY MARKETS *| HAUPTMÄRKTE *
Headquartered in Plymouth, MI, and Hamburg (Germany) | Hauptsitze in Plymouth, MI (USA) und HamburgWorldwide 2,231 employees | Weltweit 2.231 MitarbeiterOver 4,000 customers worldwide | Über 4.000 Kunden in aller WeltGlobal sales & service network | Globales Vertriebs- & ServicenetzwerkInstalled base of laser units: > 55,000 | Installierte Basis an Lasereinheiten: > 55.000Revenues from service & spare parts > 25% of turnover | Umsatz mit Service & Ersatzteilen > 25% des Gesamtumsatzes
Solid-state lasers | Festkörperlaser
Fiber lasers | Faserlaser
Ultrashort pulse lasers | Ultrakurzpulslaser
CO2 lasers | CO2-Laser
Diode lasers | Diodenlaser
Cutting | SchneidenWelding | SchweißenSurface Treatment | Oberflächenbearbeitung
Fine Cutting | FeinschneidenFine Welding | FeinschweißenMicro Structuring | MikrostrukturierenPerforating | Perforieren
Vector Marking | Vektorbeschriftung
Machine toolMaschinenbau
Automotive& Sub-Suppliers
Automobilbau& Zulieferer
* As percentage of laser-related-sales | * In Prozent vom laserrelevanten Umsatz
Medical deviceMedizingeräte
Flexible packagingVerpackungs-industrie
Jewelry | Schmuck
Others | Andere
PhotovoltaicsPhotovoltaik
SemiconductorHalbleiter
Consumer electronicsUnterhaltungs-elektronik
3
6% 30% 22% 12%
MACRO MARKINGOEMMachine tool | Maschinenbau
Smart cards, Labels | Chipkarten, Label
Medical device,Consumer goods,
Semicon | Medizintechnik,Konsumgüter, Halbleiter
Polymers, Tool & Die, Glass & Displays, Surfaces |
Kunststoff, Werkzeug- und Formenbau,Glas & Displays, Oberflächen
Automotive & Sub-Suppliers, Electronics |
Automobilbau &Zulieferer, Elektronik
MICROJewelry, Photovoltaics, Packaging | Schmuck, Photovoltaik, Verpackung

Key Items
Kernpunkte
FACTS & FIGURES | ZAHLEN & FAKTEN
REVENUES | UMSÄTZE
GROWTH STRATEGY | WACHSTUMSSTRATEGIE
Fiscal Year 2015 | Geschäftsjahr 2015: USD 519.6 millionFiscal Year 2014 | Geschäftsjahr 2014: USD 530.1 million
SPLIT PER APPLICATION | VERTEILUNG NACH ANWENDUNG SPLIT PER REGION | VERTEILUNG NACH REGION
Capitalize on strong and highly diversified core
business | Nutzung des starken und breit diversifizierten
Basisgeschäfts
Develop innovative application processes capitalizing on proprietary
technology portfolio | Entwicklung innovativer Anwendungsprozesse auf Basis des firmeneigenen Technologieportfolios
Acquire complementary business operations, products or
technologies | Erwerb neuer Geschäftsbereiche, Technologien
oder Produkte
Leverage high growth potential of high-power fiber and ultrashort
pulse lasers | Nutzung des starken Wachstumspotentials bei Hochleistungs-
faser- & Ultrakurzpulslasern
Introduce new laser products through further advancements across existing
technologies | Einführung neuer Laserprodukte durch Weiterentwicklung
bestehender Technologien
Increase efficiency and profitability through streamlined processes and optimized
cost management | Effizienz- und Profitabilitäts-steigerung durch schlankere Prozesse und optimiertes Kostenmanagement
MACRO MICRO & MARKINGCOMPONENTS | KOMPONENTEN Asia | Asien Europe | EuropaNorth America | Nordamerika
38% 34%
15% 21%
47% 45%
GrowthStrategy

CORPORATE INFORMATION | INFORMATIONEN ZUM UNTERNEHMEN
BOARD OF DIRECTORS INVESTOR CONTACT | INVESTORENKONTAKT
AUDITORS | WIRTSCHAFTSPRÜFER
TRANSFER AGENTS AND REGISTRAR | REGISTER- UND TRANSFERSTELLE
SHARE INFORMATION | INFORMATIONEN ZUR AKTIE
Carl F. BaaselMember of the Board of Directors
of Scanlab AG, Germany
Chairman of the Board of Trustees
of the Fraunhofer Institute
for Laser Technology, Germany
Gary K. WillisDirector of Plug Power Corporation
Director of Middlesex Health Services, Inc.
Dr. Stephen D. FantonePresident of Optikos Corporation
Director of The Hertz Foundation
Chairman and Director of The Pioneer Institute
Ralph E. Reins
Daniel J. Smoke
Dr. Peter WirthChairman of the Board of Directors
USA40984 Concept Dr.
Plymouth, MI 48170
Tel.: +1-734-416-0210
Fax: +1-734-455 2741
Germany | DeutschlandBerzeliusstr. 87
22113 Hamburg
Tel.: +49-(0)-40-7 33 63-4256
Fax: +49-(0)-40-7 33 63 4138
Deloitte & Touche LLP
Detroit, Michigan, USA
Computershare
211 Quality Circle, Suite 210
College Station, TX 77845
USA
ROFIN-SINAR Technologies Inc. trades on the NASDAQ Global Select Market System under
the symbol RSTI and in the “Prime Standard” segment of the Frankfurt Stock Exchange under
ISIN US7750431022.
Die Aktie von ROFIN-SINAR Technologies ist am NASDAQ Global Select Market unter dem
Kürzel RSTI notiert und wird am Prime Standard der Frankfurter Wertpapierbörse unter der
ISIN US7750431022 gehandelt.
Thomas MerkChief Executive Officer
President
KEY FINANCIALS | FINANZKENNZAHLEN
RESULTS OF OPERATIONS | GESCHÄFTSERGEBNISSE
BALANCE SHEET | BILANZ
NET SALES | UMSATZERLÖSE
NET INCOME | JAHRESÜBERSCHUSS
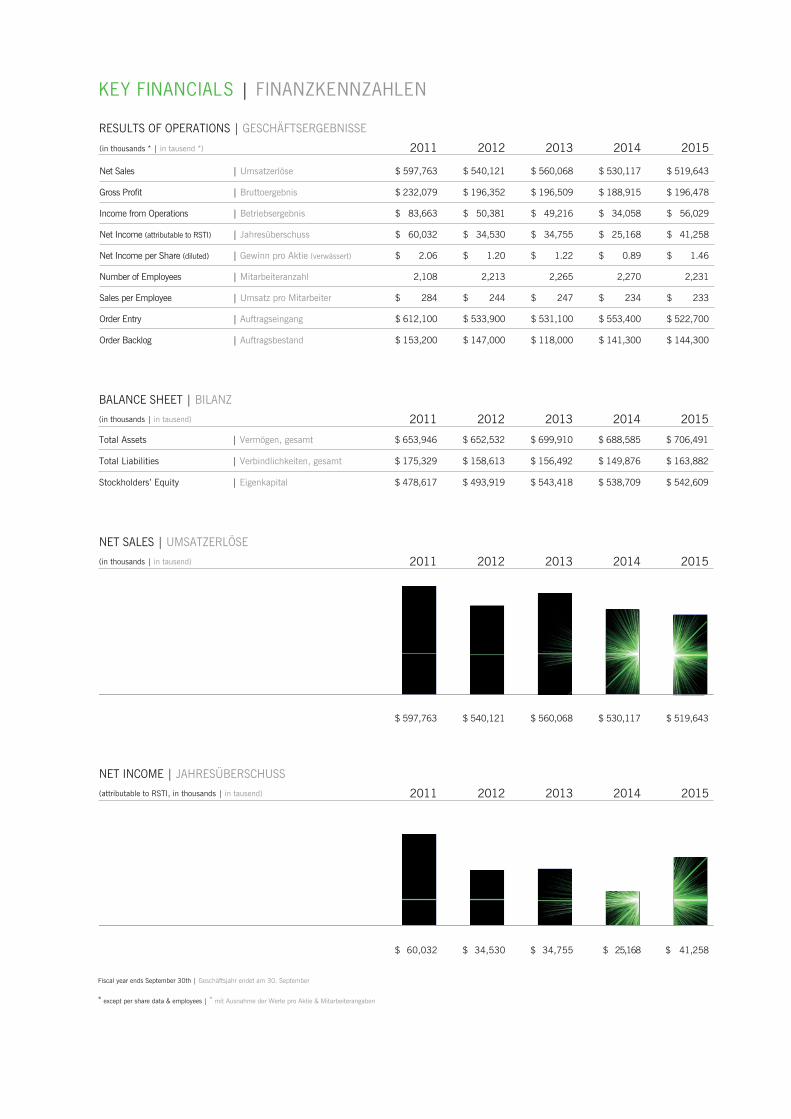
(in thousands * | in tausend *) 2011 2012 2013 2014 2015
Net Sales | Umsatzerlöse $ 597,763 $ 540,121 $ 560,068 $ 530,117 $ 519,643
Gross Profit | Bruttoergebnis $ 232,079 $ 196,352 $ 196,509 $ 188,915 $ 196,478
Income from Operations | Betriebsergebnis $ 83,663 $ 50,381 $ 49,216 $ 34,058 $ 56,029
Net Income (attributable to RSTI) | Jahresüberschuss $ 60,032 $ 34,530 $ 34,755 $ 25,168 $ 41,258
Net Income per Share (diluted) | Gewinn pro Aktie (verwässert) $ 2.06 $ 1.20 $ 1.22 $ 0.89 $ 1.46
Number of Employees | Mitarbeiteranzahl 2,108 2,213 2,265 2,270 2,231
Sales per Employee | Umsatz pro Mitarbeiter $ 284 $ 244 $ 247 $ 234 $ 233
Order Entry | Auftragseingang $ 612,100 $ 533,900 $ 531,100 $ 553,400 $ 522,700
Order Backlog | Auftragsbestand $ 153,200 $ 147,000 $ 118,000 $ 141,300 $ 144,300
(in thousands | in tausend) 2011 2012 2013 2014 2015
Total Assets | Vermögen, gesamt $ 653,946 $ 652,532 $ 699,910 $ 688,585 $ 706,491
Total Liabilities | Verbindlichkeiten, gesamt $ 175,329 $ 158,613 $ 156,492 $ 149,876 $ 163,882
Stockholders’ Equity | Eigenkapital $ 478,617 $ 493,919 $ 543,418 $ 538,709 $ 542,609
(in thousands | in tausend) 2011 2012 2013 2014 2015
$ 597,763 $ 540,121 $ 560,068 $ 530,117 $ 519,643
(attributable to RSTI, in thousands | in tausend) 2011 2012 2013 2014 2015
$ 60,032 $ 34,530 $ 34,755 $ 25,168 $ 41,258
Fiscal year ends September 30th | Geschäftsjahr endet am 30. September
* except per share data & employees | * mit Ausnahme der Werte pro Aktie & Mitarbeiterangaben

Dear Shareholders, Business Partners and Employees
“Light is a Fascinating Tool”
Here are the highlights for the fiscal year:
• Gross profit margin improved to 38% for the year. We achieved our 40% margin target in the fourth quarter. A favorable product mix and our ongoing cost reduction program were primary contributors to our margin improvement
• Fully diluted EPS was $1.46, an increase of 64% over last fiscal year
• We maintained a strong balance sheet and have confidence in our long-term prospects. As a result, we initiated our fifth share buyback program. We follow a balanced capital management strategy of investing in our business for growth and returning capital to shareholders, as appropriate
• Annual high-power fiber laser unit sales increased over 70% year-over-year. We continue to target high-power fiber lasers for growth
This is the first time that I am addressing you as the new CEO of the ROFIN group, and I want you to know that it is an honor to lead our great Company. ROFIN has a deep legacy of innovation and performance. We have one of the industry’s broadest product and technology portfolios, along with in-depth applications know-how in industrial laser material processing, and an extensive global footprint and customer reach. Building on these strengths and the many strategic alignments that the Company has implemented over the past few years, my goal is to bring fresh perspectives for future growth, to further enhance ROFIN’s technological and competitive edge, to increase profitability and – above all – to create additional value for our shareholders.
We are proud of the improvements we achieved in financial and operational performance in fiscal year 2015. We realized many of our strategic goals, further strengthening the diversity of our technological product portfolio, enhancing manufacturing capacities and broadening our addressable markets by offering innovative process applications and manufacturing solutions. In addition, we took steps to further improve process and structural efficiency, optimize cost structure and drive margin improvement. These actions both created near-term value for shareholders and better positioned the Group for a future of long-term sustainable success.
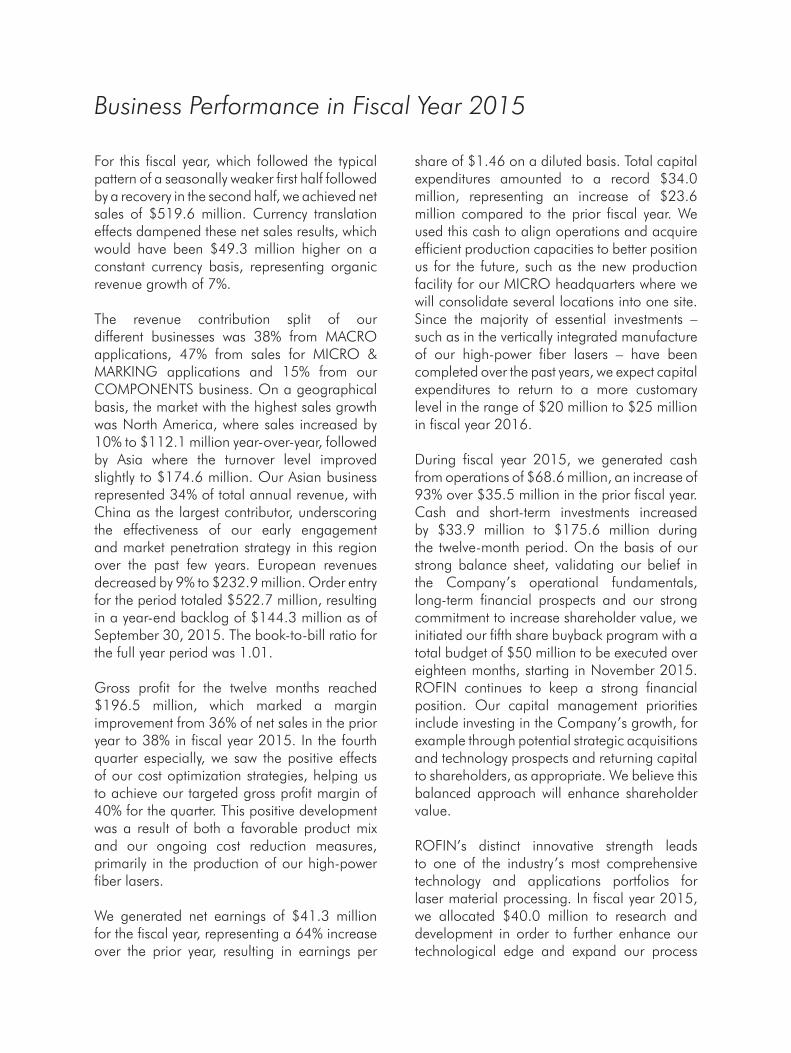
Business Performance in Fiscal Year 2015
For this fiscal year, which followed the typical pattern of a seasonally weaker first half followed by a recovery in the second half, we achieved net sales of $519.6 million. Currency translation effects dampened these net sales results, which would have been $49.3 million higher on a constant currency basis, representing organic revenue growth of 7%.
The revenue contribution split of our different businesses was 38% from MACRO applications, 47% from sales for MICRO & MARKING applications and 15% from our COMPONENTS business. On a geographical basis, the market with the highest sales growth was North America, where sales increased by 10% to $112.1 million year-over-year, followed by Asia where the turnover level improved slightly to $174.6 million. Our Asian business represented 34% of total annual revenue, with China as the largest contributor, underscoring the effectiveness of our early engagement and market penetration strategy in this region over the past few years. European revenues decreased by 9% to $232.9 million. Order entry for the period totaled $522.7 million, resulting in a year-end backlog of $144.3 million as of September 30, 2015. The book-to-bill ratio for the full year period was 1.01.
Gross profit for the twelve months reached $196.5 million, which marked a margin improvement from 36% of net sales in the prior year to 38% in fiscal year 2015. In the fourth quarter especially, we saw the positive effects of our cost optimization strategies, helping us to achieve our targeted gross profit margin of 40% for the quarter. This positive development was a result of both a favorable product mix and our ongoing cost reduction measures, primarily in the production of our high-power fiber lasers.
We generated net earnings of $41.3 million for the fiscal year, representing a 64% increase over the prior year, resulting in earnings per
share of $1.46 on a diluted basis. Total capital expenditures amounted to a record $34.0 million, representing an increase of $23.6 million compared to the prior fiscal year. We used this cash to align operations and acquire efficient production capacities to better position us for the future, such as the new production facility for our MICRO headquarters where we will consolidate several locations into one site. Since the majority of essential investments – such as in the vertically integrated manufacture of our high-power fiber lasers – have been completed over the past years, we expect capital expenditures to return to a more customary level in the range of $20 million to $25 million in fiscal year 2016.
During fiscal year 2015, we generated cash from operations of $68.6 million, an increase of 93% over $35.5 million in the prior fiscal year. Cash and short-term investments increased by $33.9 million to $175.6 million during the twelve-month period. On the basis of our strong balance sheet, validating our belief in the Company’s operational fundamentals, long-term financial prospects and our strong commitment to increase shareholder value, we initiated our fifth share buyback program with a total budget of $50 million to be executed over eighteen months, starting in November 2015. ROFIN continues to keep a strong financial position. Our capital management priorities include investing in the Company’s growth, for example through potential strategic acquisitions and technology prospects and returning capital to shareholders, as appropriate. We believe this balanced approach will enhance shareholder value.
ROFIN’s distinct innovative strength leads to one of the industry’s most comprehensive technology and applications portfolios for laser material processing. In fiscal year 2015, we allocated $40.0 million to research and development in order to further enhance our technological edge and expand our process

Growth Focus: Fiber Lasers
applications and product portfolio to broaden our market reach. We devoted the lion’s share of the resources during the reporting period to the further technological advancement of our high-power fiber lasers as well as into the development of our ultrashort pulse laser series.
We are particularly focused on both of these technologies, because of their expected continuing above average growth rates.
Our strategy to deliver attractive long-term value for shareholders involves maximizing the value of our strong cash-generating core business while investing heavily in the higher growth opportunities in fiber laser and ultrashort pulse lasers.
In terms of fiber lasers, we had a very successful fiscal year, demonstrating that the market recognizes the quality and performance of our lasers and that our initiatives to enhance technological progress and optimize our manufacturing cost structure continue to yield results. In fiscal year 2015, we shipped 1,300 units and our backlog at year-end for fiber laser products amounted to roughly 440 units. Our revenues from fiber laser products contributed over 30% to our overall laser-related sales of $301.4 million. In the high-power range, we were able to increase our unit sales by over 70% compared to the prior fiscal year and we are well-positioned to further ramp up production in the coming years. These results underscore our achievements in the high-power fiber laser market since 2007, when we recognized that fiber laser technology had the potential to develop from a pure, very low-power product in telecommunications to a laser source suited for industrial applications.
Since then, we have invested significantly in research and development, simultaneously ac-quiring capability across the entire production chain for fiber lasers, to build proprietary high-power fiber laser technology and establish vertical integration. The latter is essential to economically manufacturing high-power fiber
laser sources due to the high proportion of diode costs. ROFIN delivered its first fiber laser in the 1 kilowatt (kW) output power range in 2009 and today is able to offer multikilowatt lasers. With our recently released 8 kW model, we believe that we are in an excellent position to address additional markets and gain further market share. Over the course of fiscal year 2015, we improved the yield of our chip material and continued to ramp up our chip production. In order to achieve even higher output power pumping modules in the future, we reinforced our efforts to further optimizing the wafer structure and chip design.
With one of the broadest fiber laser portfolios in the industrial laser space – from single to multikilowatts – and the advantage of vertically integrated production in the high-power fiber laser area, we are well-positioned to further realize attractive return on our investment, drive margin expansion and increase market share. Additionally, ROFIN continues to pursue clear research and development projects in order to reduce manufacturing costs further, as it is our goal to lower these costs by at least a further 15% by the end of fiscal year 2016. We expect to see continued gross margin improvement from these cost-cutting measures, which should be further amplified by benefits from increased production volume and the related economy of scale effects.
We are also gaining momentum with our ultrashort pulse lasers and systems, the second domain in which we are focusing due to expect-ed material growth. These so-called “cold” laser sources in the femto- and picosecond pulse lengths range prevent thermal impacts on the manufactured parts and costly and time-consuming post-processing can be eliminated. Another advantage of these lasers, similar to other solid-state lasers, is the broad range of possible pulse lengths that they command. Ultrashort pulse lasers have additional features, such as frequency doubling or tripling with corresponding change of wavelength, so that the choice of material to be treated is almost unlimited. ROFIN was one of the first movers in this market when this technology matured for economic use in industrial production, and today we possess a complete product-lineup of ultrashort pulse laser sources and turnkey-solutions. Over the past years, the market for ultra-precise material processing tools for miniaturized parts has grown rapidly. Many applications have been made possible only through the use of ultrashort pulse lasers, further accelerating growth in this sector. We see major growth potential for supplementary applications in the medical device, automotive and photovoltaic industries.
In addition, we offer ultrashort pulse lasers in combination with our proprietary Smart-Cleave™FI application, a unique process tech-nology for the high-quality laser cutting of brittle materials by means of laser filamentation.
SmartCleave™FI provides one of the industry’s most advanced process technology, capable of substituting mechanical techniques and opening new markets for ultrashort pulse lasers, such as in the consumer electronics industry to cut strengthened and non-strength-ened cover-glass, ceramics or sapphire. Additional application potential includes the cutting of glass in the automotive, medical and pharmaceutical industries, as well as for displays and architectural glass. In the mid-term, we also see applications in the semiconductor industry. First installations for the cutting of brittle materials were made in Asia and Europe. ROFIN’s SmartCleave technology has the potential to fuel future ultrashort pulse laser business as we expect the order entry for this application to substantially increase over the years to come and contribute to ROFIN’s future growth.
In both key strategic growth areas, high-power fiber lasers and ultrashort pulse lasers, we have made significant progress and realized high growth rates compared to the overall market for industrial laser material processing. We are seeing the tangible results of our significant historical investments in these fields and we believe we are well-positioned for future gains.
Growth Focus: Ultrashort Pulse Lasers
Strong Core Business
In addition to those two growth focuses, we continue to capitalize on a strong and solid core business, comprised of a broad laser product line portfolio of solid-state, diode and CO2 laser technologies, as well as a steadily growing component business that has, over time, become a strong contributor to our overall revenue.
Most of our high-tech components, such as the specialty fibers from our subsidiary Nufern or the semiconductor laser components from our subsidiary DILAS, are both used in-house for the Company’s own product portfolio and integrated by other laser manufacturers into their products, underlining our strong position in the market place. This broad usage of our components enables us to benefit from an overall growing industrial laser market.
Among the highlights of fiscal year 2015 for this part of our Group’s business was the introduction of our new fiber-coupled diode laser system with 6 kilowatt output power, which was developed to address the most demanding customer requirements and to operate in the harshest of processing environments. Principal target applications are thermal applications such as brazing, cladding and hardening in the automotive, aviation and mining industries and their suppliers, to name just a few. These multikilowatt diode lasers round out the Company’s technology offering in the high-power laser range for industrial applications. In fiscal year 2015, we acquired a production facility in Mainz (Germany) for our DILAS subsidiary to secure production space and cleanroom capacity in order to take advantage of the anticipated long-term growth opportunities in this business.
Other highlights during the past fiscal year include advances we have made in low-power lasers for marking and micro processing. We launched several new products including frequency multiplied lasers, such as SHG
(second harmonic generation) and THG (third harmonic generation) lasers (i.e. in the UV range) that, through their wavelengths, allow the processing of very sensitive materials. Those lasers are ideally suited for marking, ablation, drilling and cutting and address promising application areas in the electronics or semiconductor markets as well as in the photovoltaic and consumer electronics industries. In addition, we have several prod-uct development efforts underway, which are expected to further broaden our product portfolio in this area to actively address high potential markets, e.g., with high-precision 3D marking and structuring applications where high peak performances without thermal impact are prerequisites for best production results.
In addition, we see significant continuing growth potential for low-power CO2 lasers in organic material processing applications. The predominance of CO2 lasers in applications such as leather-cutting in the footwear industry, the cutting of technical textiles such as airbags or perforating of foils in the packaging industry is attributed to the specific wavelength of these lasers. Due to the continuing success of our low-power CO2 lasers and their expanding use and demand across a broad range of industries, we started the construction of a new energy-efficient factory in the United Kingdom in fiscal year 2014, where these laser sources are manufactured. We expect to move into the new facility in early 2016. In addition to increased production capacity for these low-power lasers, we expect to benefit from additional synergies, enhanced lean manufacturing and overall improved efficiency through the facility.

We remain committed to strengthening our position as a global player in the growing market for industrial laser material processing by creating innovative new products, continually looking for opportunities to significantly expand
Cost Reduction & Efficiency ProgramsIn fiscal year 2015, we also had a special focus on controlling costs and increasing efficiency. In May 2015, we launched an additional cost saving and efficiency program beyond the measures already implemented. For example, we improved the cost structure in the production of our high-power fiber lasers through the implementation of our third generation design that has improved features and allows for fewer components and therefore reduced costs. In addition, overall higher efficiency in production and higher production volumes along with economies of scales supported the cost cutting effects in this area.
As part of our profitability and efficiency improvement program, we identified possible operational consolidations. In a first set of measures of what we are calling a “smooth consolidation” course, we merged two of our Switzerland-based subsidiaries into a single legal entity. Furthermore, we plan to merge two of our German subsidiaries in order to streamline administrative processes and benefit from synergies. In addition to the positive effects from these measures and from our new production plant for low-power CO2 lasers in Hull (UK), we also expect to see synergies and increased efficiency from the consolidation of our different MICRO sites under one roof in Gilching. The building was acquired in January 2015, and we expect to move in and commence operations latest at the end of calendar 2016.
As we consolidate and decrease our cost structure, we are mindful that our business covers many different technologies and
branches of completely different natures and know-how, depending on the products and industries. Nonetheless, the optimization of our Company structure is an ongoing process, and should provide more positive effects over time.
During this year, we also expanded our leadership team, creating a clear focus on key operational areas such as high-power fiber, ultrashort pulse lasers and the component business, important geographical regions and cost reduction, streamlining of processes and an increase in efficiency.
Lower costs in selling, general and ad-ministration have accompanied our cost-cutting efforts and since we have completed significant research and development projects in both areas of higher growth, we were able to return both of these line items to more normal levels as a percentage of net sales than in the prior year. Expenses for selling, general and administration represented 19% of net sales and expenses related to research and development amounted to 8% of net sales. Our mid-term target is to reduce selling and administration expenses to 18% of net sales, and expenses related to research and development to 7% of net sales. Through these and additional initiatives, we will con-tinue to target further cost control, while simultaneously actively promoting sales and development in key areas and markets.
Coupling these initiatives on the cost side with our strong product portfolio, we expect to see additional operating cost-savings of at least
the utilization of our lasers across the existing multiple end markets and pursuing applications in new markets for these exceptional industrial tools.

Yours sincerely
Thomas MerkCEO & PresidentROFIN-SINAR Technologies Inc.
$5 million in fiscal year 2016 and feel well-positioned for a successful fiscal year.
Based on the important progress and invest-ments that ROFIN has made over the past years, as well as on the ongoing and upcoming projects to further strengthen our performance and cost structure optimization, I am confident that we have created a solid foundation to drive future turnover and profitability.
Our fiscal year 2015 achievements prove the performance capabilities of our entire team.
I would like to take this opportunity to thank all employees for their unwavering dedication and contributions over the past year.
In addition, I want to thank our business partners and shareholders for their strong commitment and trust, and would like to extend my special thanks to the Board of Directors for their vision and guidance.
December 17, 2015

ROFIN-SINAR Technologies Inc.,40984 Concept Drive, Plymouth,MI 48170, USA, [email protected],www.rofin.com

REPORT ON FORM 10-K
Fiscal Year 2015

UNITED STATESSECURITIES AND EXCHANGE COMMISSION
Washington, D.C. 20549
FORM 10-K
ANNUAL REPORT PURSUANT TO SECTION 13 OR 15(d) OF THE SECURITIES EXCHANGE ACT OF 1934 For the fiscal year ended September 30, 2015
TRANSITION REPORT PURSUANT TO SECTION 13 OR 15(d) OF THE SECURITIES EXCHANGE ACT OF1934
For the transition period from to
Commission file number: 000-21377
ROFIN-SINAR TECHNOLOGIES INC.(Exact name of Registrant as specified in its charter)
Delaware 38-3306461(State or other jurisdiction ofincorporation or organization)
(I.R.S. EmployerIdentification No.)
40984 Concept Drive, Plymouth, MI 48170
(Address of principal executive offices) (Zip Code)
Registrant’s telephone number, including area code: (734) 455-5400 Securities registered pursuant to Section 12(b) of the Act:
Title of each class Name of each exchange on which registered
Common stock, par value $0.01 per Share The NASDAQ Global Select Market
Securities registered pursuant to Section 12(g) of the Act: NONE Indicate by check mark if the registrant is a well-known seasoned issuer, as defined in Rule 405 of the Securities Act. Yes No Indicate by check mark if the registrant is not required to file reports pursuant to Section 13 or Section 15(d) of the Act. Yes No
Indicate by check mark whether the registrant: (1) has filed all reports required to be filed by Section 13 or 15(d) of the Securities Exchange Act of 1934 during the preceding 12 months (or for such shorter period that the registrant was required to file such reports) and (2) has been subject to such filing requirements for the past 90 days. Yes No
Indicate by check mark whether the registrant has submitted electronically and posted on its corporate Website, if any, every Interactive Data File required to be submitted and posted pursuant to Rule 405 of Regulation S-T during the preceding 12 months (or for such shorter period that the registrant was required to submit and post such files). Yes No Indicate by check mark if disclosure of delinquent filers pursuant to Item 405 of Regulation S-K (§229.405 of this chapter) is not contained herein, and will not be contained, to the best of registrant’s knowledge, in definitive proxy or information statements incorporated by reference in Part III of this Form 10-K or any amendment to this Form 10-K.

2
Indicate by check mark whether the registrant is a large accelerated filer, an accelerated filer, a non-accelerated filer, or a smaller reporting Company. See definition of “accelerated filer”, “large accelerated filer”, and “smaller reporting company” in Rule 12b-2 of the Exchange Act.
Large accelerated filer Accelerated filer Non-accelerated filer Smaller reporting company Indicate by check mark whether the registrant is a shell company (as defined in Rule 12b-2 of the Exchange Act). Yes No
The aggregate market value of the voting and non-voting common equity held by non-affiliates of the registrant based upon the closing price of the common stock on March 31, 2015 (the last business day of the most recently completed second fiscal quarter) as reported by the NASDAQ Global Select Market was approximately $673,519,517. For the purposes hereof, “affiliates” include all executive officers and directors of the registrant. 28,360,103 shares of the registrant’s common stock, par value $0.01 per share, were outstanding as of November 25, 2015. Certain sections of the Company’s Proxy Statement to be filed in connection with the Company’s 2016 Annual Meeting of Stockholders expected to be held in March 2016, are incorporated by reference herein at Part III, Items 10-14.

3
ROFIN-SINAR TECHNOLOGIES INC.
TABLE OF CONTENTS
PagePART I ITEM 1. BUSINESS ITEM 1A. RISK FACTORS ITEM 1B. UNRESOLVED STAFF COMMENTS ITEM 2. PROPERTIES ITEM 3. LEGAL PROCEEDINGS ITEM 4. MINE SAFETY DISCLOSURES PART II ITEM 5. MARKET FOR REGISTRANT’S COMMON EQUITY, RELATED
STOCKHOLDER MATTERS AND ISSUER PURCHASES OF EQUITY SECURITIES
ITEM 6. SELECTED FINANCIAL DATA ITEM 7. MANAGEMENT’S DISCUSSION AND ANALYSIS OF FINANCIAL
CONDITION AND RESULTS OF OPERATIONS ITEM 7A. QUANTITATIVE AND QUALITATIVE DISCLOSURES ABOUT MARKET RISK ITEM 8. CONSOLIDATED FINANCIAL STATEMENTS AND SUPPLEMENTARY DATA ITEM 9. CHANGES IN AND DISAGREEMENTS WITH ACCOUNTANTS ON
ACCOUNTING AND FINANCIAL DISCLOSURE ITEM 9A. CONTROLS AND PROCEDURES ITEM 9B. OTHER INFORMATION PART III ITEM 10. DIRECTORS, EXECUTIVE OFFICERS AND CORPORATE GOVERNANCE ITEM 11. EXECUTIVE COMPENSATION ITEM 12. SECURITY OWNERSHIP OF CERTAIN BENEFICIAL OWNERS AND
MANAGEMENT AND RELATED STOCKHOLDER MATTERS ITEM 13. CERTAIN RELATIONSHIPS AND RELATED TRANSACTIONS AND
DIRECTOR INDEPENDENCE ITEM 14. PRINCIPAL ACCOUNTANT FEES AND SERVICES PART IV ITEM 15. EXHIBITS AND FINANCIAL STATEMENT SCHEDULES
42432333434
353738
494949
4950
515151
51
52
53
4
PART I Cautionary Note Regarding Forward-Looking Statements Certain statements in this Annual Report on Form 10-K constitute forward-looking statements within the meaning of the Private Securities Litigation Reform Act of 1995 (the “Reform Act”). Forward-looking statements include all statements that do not relate solely to historical or current facts, and can be identified by the use of words such as “may”, “believe”, “will”, “expect”, “project”, “anticipate”, “estimate”, “plan” or “continue”. These forward-looking statements are based on the current plans and expectations of our management and are subject to a number of uncertainties and risks that could significantly affect our current plans and expectations, as well as future results of operations and financial condition. These factors include (among others):
• downturns in the machine tool, automotive, semiconductor, electronics, photovoltaic, jewelry, flexible packaging, defense, and medical device industries which may have a material adverse effect on sales and profitability of the Company;
• the ability of the Company’s OEM customers to incorporate its laser products into their systems;
• the impact of exchange rate fluctuations, which may be significant because a substantial portion of the Company’s
operations is located in non-U.S. countries;
• the level of competition and the ability of the Company to compete in the markets for its products;
• the Company’s ability to develop new and enhanced products to meet market demand or to adequately utilize its existing technology;
• third party infringement of the Company’s proprietary technology or third party claims against the Company for the
infringement or misappropriation of proprietary rights;
• the scope of patent protection that the Company is able to obtain or maintain;
• competing technologies that are similar to or that serve the same uses as the Company’s technology;
• the Company’s ability to efficiently manage the risks associated with its international operations;
• risks associated with recent changes in the Company's senior management personnel;
• any adverse impact to the Company resulting from the announcement or implementation of any one or more of our cost reduction programs;
• the worldwide economic environment, including specifically, but not limited to, in Asia; and
• the other risks described under “ITEM 1A - Risk Factors”. In making these forward-looking statements, we claim the protection of the safe-harbor for forward-looking statements contained in the Reform Act. We do not assume any obligation to update these forward-looking statements to reflect actual results, changes in assumptions, or changes in other factors affecting such forward-looking statements.
ITEM 1. BUSINESS COMPANY OVERVIEW ROFIN-SINAR Technologies Inc. was incorporated in 1996 under the laws of the State of Delaware. ROFIN-SINAR's shares trade on the NASDAQ Global Select Market under the symbol RSTI. In this report, the terms “Company”, “ROFIN”, “RSTI”, “we”, “us”, and “our” mean ROFIN-SINAR Technologies Inc., and, to the extent applicable, all entities included in the Company's consolidated financial statements.

5
ROFIN-SINAR Technologies is a leader in the design, development, engineering, manufacturing and marketing of laser sources and laser-based system solutions for industrial material processing applications, which include primarily cutting, welding and marking a wide range of materials. The Company's product portfolio ranges from single laser-beam sources to highly complex systems, covering all of the key laser technologies such as CO2 lasers, fiber, ultrashort pulse, solid-state and diode lasers, and the entire power spectrum, from single-digit watts up to multi-kilowatts, as well as a comprehensive spectrum of wavelengths. An extensive range of laser components completes the product portfolio. Lasers are a non-contact technology for material processing, which have several advantages compared to conventional manufacturing tools that are desirable in industrial applications. The Company's lasers all deliver a high-quality beam at guaranteed power outputs and feature compact design, high processing speed, flexibility, low operating and maintenance costs and easy integration into the customer's production process thus meeting a broad range of material processing requirements of RSTI's customers.
Through its global manufacturing, distribution and service network, the Company provides a comprehensive range of laser sources and laser-based system solutions to the following principal target markets: the machine tool, automotive & sub-suppliers ("automotive"), semiconductor, electronics and photovoltaic industries. The Company sells directly to end users and to original equipment manufacturers (“OEMs”) that integrate ROFIN's laser sources with other system components. Many of ROFIN's customers are among the largest global participants in their respective industries. During fiscal 2015, 2014 and 2013, 21%, 19% and 20%, respectively, of the Company’s sales were in North America, 45%, 49% and 45%, respectively, were in Europe, and 34%, 32% and 35%, respectively, were in Asia.
ROFIN's sales approach in the laser-related business reflects the many different requirements of its customers throughout a multitude of industries, and is divided into three areas of core competence: Macro, Micro and Marking. The core of the Macro business section is high-powered laser sources, primarily used for cutting and welding as well as surface treatment applications. The Micro section concentrates on laser sources and laser-based system solutions that require less power output for micro-processing of materials. The Marking section specializes in innovative marking solutions on both organic and inorganic materials for many different industries. The activities in the components sector which comprises of diodes and diode laser components, power supplies, fibers and fiber beam deliveries as well as fiber laser components round out the Company's business activities in the industrial laser market. During fiscal 2015, 2014 and 2013, approximately 38%, 40% and 38%, respectively, of the Company’s revenues related to sales of laser products for macro applications, approximately 47%, 47% and 49%, respectively, related to sales of laser products for marking and micro applications, and approximately 15%, 13% and 13%, respectively, related to sales of components.
THE INDUSTRIAL LASER MARKET FOR MATERIAL PROCESSING Over the past decades, lasers have revolutionized industrial manufacturing and have been used increasingly to provide reliable, flexible, non-contact, compact and high-speed alternatives to conventional technologies for processing various kinds of metal and non-metal materials in a broad range of advanced manufacturing applications. The industrial laser market is generally considered to be made up of laser sources sold for industrial applications including material processing, medical therapeutic, instrumentation, research, telecommunications, optical storage, entertainment, image recording, inspection, measurement and control, bar-code scanning and other end-uses.
According to the Industrial Laser Solutions magazine's 2015 industry forecast published in January 2015, worldwide laser revenues for industrial material processing applications, which are ROFIN’s primary addressed markets, are expected to reach approximately $2.8 billion. The Company has sold more than 75,000 laser sources since 1975 and currently has over 4,000 active customers (including multinational companies with multiple facilities purchasing from the Company).
BUSINESS STRATEGY The Company's business strategy is to maximize shareholder value by, among other things, (i) strengthening its position as a leading supplier to the global market for macro (cutting and welding) applications; (ii) capitalizing on its leadership position in marking applications; (iii) extending its position in micro (fine cutting, fine welding, perforating and structuring applications); (iv) cross-selling its various laser products to its existing large customer base; (v) enlarging its market coverage geographically and by developing new applications; (vi) strengthening its product portfolio and customer base through acquisitions; (vii) capitalizing on its proprietary application process and technology portfolio; (viii) broadening its component product portfolio; (ix) focusing on continued cost reduction and efficiency improvement in processes and worldwide organizational structure.
6
The Company believes that the major sources of its future growth will be the following:
• Developing New Laser Products through Technological Innovation: Product innovation in response to evolving customer needs for increased output power, greater penetration and higher processing speeds is a key component of the Company's strategy. The Company is actively engaged in the research and development of its low- and high-power fiber laser family to further expand its solid-state laser offering for marking, micro and macro applications. The Company is also enhancing its research and development efforts in order to broaden its portfolio of short and ultrashort pulse lasers. The Company is also focusing its research and development activity on expanding the output power range of its CO2, diffusion cooled, wave-guide Slab lasers and enhancing the performance of its line of high power, fast-flow CO2 lasers. In addition, the Company is expanding its series of end and side pumped, solid-state lasers for marking and micro applications. Especially for those lasers there are also activities to enlarge the portfolio by green and ultraviolet ("SHG" and "THG") laser products. In addition, research and development is focused on expanding the Company's product range, especially in the field of passive and active fibers, laser diodes, power supplies and fiber delivery systems.
• Focusing on Cross-Selling to Existing Customers in Target Markets: The Company intends to continue to focus its sales and marketing activities on its traditional target markets (the machine tool, automotive, semiconductor, electronics, photovoltaic, flexible packaging and medical device industries). The Company has targeted and will continue to target these industries because they use advanced manufacturing processes that require continuing investments to improve production efficiency and because the Company has significant market presence in these sectors. In addition, building on the success of its laser marking of small integrated circuits, the Company intends to develop new applications, such as fine welding, cutting and drilling for the semiconductor and electronics industry. In the packaging industry, the Company is seeking new opportunities for foil perforation based on its extensive knowledge of paper perforation with lasers. In the photovoltaic industry, the Company intends to further exploit structuring and annealing applications for its macro and micro laser products such as scribing of thin film solar cells as well as crystalline solar cells. In the consumer electronics and medical device industries, the Company is seeking new opportunities to cut brittle material for various applications such as displays and cover glasses for consumer electronic products, medical glass and architecture glass.
• Capitalizing on Global Presence to Attract New Customers: The Company intends to capitalize on its customer base and the presence of its manufacturing, sales and service operations in the three principal geographic markets in which its customers operate (North America, Europe and the Asia/Pacific region) to increase market share in its existing industrial and geographic markets. The Company believes its global manufacturing, distribution and service network allows it to be more responsive to customers' needs and positions it to expand into additional promising markets which offer high long-term potential for growth.
• Offering Customized Solutions based on Standard Platforms: While the Company offers a wide range of laser applications and develops customized solutions for its customers, these applications and solutions are built on a focused number of product families comprised of standardized laser sources. For example, for its OEM customers in the machine tool industry, the Company provides customized laser versions. For its marking customers, the Company combines its standard laser markers with customized parts handling and software. For its micro applications customers, the Company delivers its standard laser sources in different customized packages. The Company believes that this product strategy has contributed to increases in product sales and intends to continue offering focused customization services and pursuing its initiatives to standardize its core products so as to lower its production costs and continue to improve its profitability.
• Acquiring Complementary Business Operations, Products, Applications or Technologies: Besides growing organically, one of ROFIN's targets is to grow through strategic acquisitions. Since 1997 the Company has successfully acquired and integrated fifteen businesses, including its acquisitions of DILAS Diodenlaser GmbH (“DILAS”) (1997), assets of Palomar Technologies UK Ltd. (1998), Rasant-Alcotec Beschichtungstechnik GmbH (“Rasant”) (1999), Baasel Lasertech (“CBL” now "RBL") (2000), Z-Laser S.A. (2001), Optoskand AB (“Optoskand”) (2004), PRC Laser Corporation (“PRC”) and Lee Laser, Inc. (“Lee”) (2004), H2B Photonics GmbH (“H2B”) (2006), ES Technologies Ltd. (2007), Corelase Oy (2007), m2k-laser GmbH (2007), Nufern (2008), Nanjing Eastern Laser Co. Ltd. (“NELC”) (2009), the coil winding business from Optelecom-NKF, Inc. (2010), LASAG AG (“LASAG”) (2011) and assets of FiLaser USA LLC (2014). Management believes that, collectively, these acquisitions have advanced the Company's worldwide expansion, strengthened the Company's position in the industrial laser material processing market and

7
positively contributed to the Company's financial performance during the last several years. The Company will continue to seek opportunities to make value-based acquisitions that complement its business operations, broaden its product offerings, or provide access to new geographical markets and applications.
LASER TECHNOLOGY The term “laser” is an acronym for “Light Amplification by Stimulated Emission of Radiation”. Lasers were first developed in the early 1960s in the United States. A laser consists of an active lasing medium that gives off its own light (radiation) when excited, an optical resonator with a partially-reflective output mirror at one end, a fully-reflective rear mirror at the other that permits the light to bounce back and forth between the mirrors through the lasing medium, and an external energy source used to excite the lasing medium. A laser works by causing the energy source to excite (pump) the lasing medium, which converts the energy from the source into an emission consisting of particles of light (photons). These photons stimulate the release of more photons, as they are reflected between the two mirrors, which form the resonator. The resulting build-up in the number of photons is emitted in the form of a laser beam through an output port or “window”. By changing the energy and the lasing medium, different wavelengths and types of laser light can be produced. The laser produces light from the lasing medium to achieve the desired intensity, uniformity, and wavelength through a series of reflective mirrors. The heat generated by the excitation of the lasing medium is dissipated through a cooling mechanism, which varies according to the type of laser technology.
Lasers are used for material processing because they have many advantages over other conventional production methods. In many areas of industrial manufacturing, lasers already allow for significantly greater precision, flexibility, and productivity and are often the only technology that enables efficient mass production of innovative products. The principal factors that distinguish different types of lasers and determine the particular laser suitable for a specific application, besides economic reasons, are wavelength, pulse duration, output power, and spatial coherence.
The principal types of laser technologies currently used for material processing are CO2 lasers, solid-state lasers, fiber lasers, and diode lasers.
CO2 lasers, which use CO2 gas as the lasing medium, are divided into high-power (above 500 watts) and low-power (below 500 watts) applications. There are two methods for CO2 excitation, radio frequency (“RF” or “HF”) and direct current (“DC”) excitation. Most high-power CO2 lasers are based on gas flow, in which a continuous supply of fresh laser gas flows through the laser cavity to create the energy necessary for excitation. Due to their ability to generate comparatively high levels of continuous-wave (“CW”) power, CO2 lasers are a particularly attractive laser medium for material processing applications. Material processing applications for CO2 laser sources vary according to the power output and configuration of the laser system. The primary applications for high-power CO2 lasers are cutting and welding of metal as well as surface treatment. Low-power CO2 lasers are used principally for marking, cutting and engraving of organic materials. While both low- and high- power CO2 lasers are used for cutting, the materials they are used to process and their physical size can vary significantly.
Traditional solid-state lasers use flash lamps or laser diodes as source of excitation and are referred to as “flash-lamp-pumped” or “diode-pumped” lasers. The lasing medium is a solid-state crystal, generally in the form of a rod or a disc. Widely used crystal rod material is either neodymium yttrium aluminum garnet (Nd:YAG) or neodymium vanadate (Nd:YVO4). The rod is positioned in a cavity, which is either a gold or ceramic reflector, and pumped using flash lamps or laser diodes from the side, or alternatively the rod is pumped from its ends with laser diodes. Typical output powers vary from 3 to 1,000 watts from a single rod and output powers in the multiple kilowatt range can be achieved by combining several cavities within a resonator. In the “disc design” the lasing medium is a thin crystal (typically ytterbium:YAG) disc, which is excited by laser diodes in an optical multi-pass configuration. By using multiple thin disc laser heads within one resonator, several kilowatts of power can be generated.
Fiber lasers are solid-state lasers that have their origin in low-power information and communication applications, and since 2003 have undergone a rapid development towards higher output powers, which has also made this technology very attractive for higher-power material processing applications. The lasing medium, typically ytterbium, is contained in a waveguide (the active fiber itself) and surrounded by a cladding, which guides the pump light to the lasing medium. With in-fiber components like fiber bragg gratings, tapered fiber bundles (pump light couplers), power combiners, and delivery fibers, from the generation of the light to the delivery of the light to the work piece, can be realized in an “all-in-fiber” technology. Today multi kW output power can be generated from a single fiber, no bigger in diameter than a human hair. Higher power can be generated by bundling multiple fibers. Typical industrial applications for solid-state and fiber lasers
8
vary according to the different output powers from marking and engraving, to micro processing such as fine cutting, fine welding or micro-structuring right up to macro processing (cutting, welding and surface treatment).
Solid-state and fiber lasers can be operated in cw, pulsed, q-switched or modelocked mode, covering the pulse width range from cw down to femtoseconds; lasers with pulse widths shorter than 10-8s are often referred to as ultrashort pulse lasers. Over the recent years ultrashort pulse laser technology has matured and today these lasers provide sufficient output power for industrial applications with typical pulse lengths in the range from some ten picoseconds to some 100 femtoseconds. These lasers provide pulses with high peak powers that are shorter than the time needed for most energy diffusion processes within the atomic lattice. Therefore heat transfer to surrounding material is dramatically reduced which eliminates almost all unwanted material change or thermal damage. This is the reason why this method is also referred to as “cold” or “a-thermal” material processing which is suitable for processing extremely sensitive materials. Ultrashort pulse lasers cut, drill and structure virtually any material with micron-scale precision and are perfect tools for applications in the electronics, semiconductor, micro technology, and medical device manufacturing industries.
Diode lasers are based on special semiconductor structures on a gallium arsenide (GaAs) die to generate laser light. A typical 10 mm long laser diode bar contains approximately 25 single laser emitters. When mounted on a specially designed, highly- efficient heat sink, a laser diode bar is able to produce up to 100 watts of laser output power. A single high-power laser diode module consists of: (1) a semiconductor laser diode bar; (2) a high-efficient heat sink, on which the laser bar is mounted; and optional (3) a micro-lens system, which is mounted in front of the laser bar to collimate or focus the light. Optical output power can be increased by combining the beamlets of several laser diode modules on top of each other. Through optical combination of such modules, output powers in the kilowatt range can be achieved. Diode lasers typically have larger spot diameters when focused, and are typically used for surface treatment such as cladding or hardening, for additive manufacturing as well as for soldering and plastic welding.
THE COMPANY’S LASER PRODUCTS The Company distinguishes itself from the majority of its competitors who specialize in only one or two of the three principal laser technologies for material processing by offering its customers CO2, solid-state, fiber, ultrashort pulse and diode laser sources, and solutions in a variety of configurations and options. As a technological leader in CO2, solid-state, fiber, ultrashort pulse and diode lasers, the Company is able to meet a broad range of its customers' cutting, welding and marking requirements. The Company's lasers all deliver a high-quality beam at guaranteed power outputs and feature compact design, high processing speed, flexibility, low operating and maintenance costs, and easy integration into the customer's production process. The Company's engineers and other technical experts work directly with the customer in the Company's applications centers to develop and customize the optimal solution for the customer's manufacturing requirements.
The Company currently offers a comprehensive range of laser products and related services for three principal material processing applications:
• cutting, welding and surface treatment (macro applications);
• marking and engraving; and
• fine cutting, spot and seam welding, micro drilling, scribing, perforating and fine structuring/ablation (micro applications).
Besides offering standard solutions and laser systems for some specialized niche applications, the Company works directly with its customers to develop and customize optimal solutions for their unique manufacturing requirements. In developing its laser-based solutions, the Company offers customers its expertise in:
• product development and manufacturing services based on 40 years of laser technology experience and applications know-how;
• application and process development, which means developing new laser-based applications for manufacturing customers and assisting them in integrating lasers into their production processes;
• system engineering, which means advising customers on machine design, including tooling, automation and controls for customers in need of “turn-key” solutions; and

9
• extensive after-sales support of its laser products, including technical support, field service, maintenance and training programs as well as rapid spare parts delivery.
The following table sets forth the Company’s net sales of laser products used for macro applications, laser products used for marking and micro applications, and components in fiscal 2015, 2014 and 2013:
September 30,Product Category* 2015 2014 2013 (in thousands)Laser macro products $ 200,358 $ 209,632 $ 214,623Laser marking and micro products 243,096 250,228 272,632Components 76,189 70,257 72,813 $ 519,643 $ 530,117 $ 560,068_____________
* For each laser product category, net sales include sales of service (including training, maintenance and repair) and spare parts. The laser sources sold by the Company consist of a laser head (containing the lasing medium, resonator, source of excitation, resonator optics and cooling mechanism), power supply and microcontroller (for control and monitoring). The Company's products are offered in different configurations and utilize different design principles according to the desired application. A large variety of laser systems provided by the Company are equipped with the uniform operating concept “ROFIN Control Unit” (RCU). The RCU is a real-time laser and handling control device, which allows control of any laser mode. The user interface allows full access from a terminal (for instance a touch screen) that is located directly on the machines, or via a preceding PC with an Ethernet connection. The standardized ROFIN Control Network allows the extended diagnosis of all laser components via the Intranet, the Internet or WLAN. With the open PLC programming system customers can individually adapt the process sequence.
For a more detailed discussion of the components of a laser source, see “Laser Technology”.
The following table sets forth the Company’s product categories by principal markets and principal applications:
PRODUCT CATEGORY PRINCIPAL MARKETS PRINCIPAL APPLICATIONSLaser macro products Machine tool Cutting and welding of metals Automotive Cutting and welding of metalsLaser marking products Semiconductor and electronics Marking of integrated circuits, wafers,
solar cells, electronic components andsmart cards
Automotive Marking of labels and car componentsMedical device Marking of medical devices
Laser micro products Medical devices, semiconductor andelectronics, photovoltaics, dental andjewelry
Fine welding, fine cutting, micro structuring/ablation, scribing and drilling
Automotive, consumer electronics,consumer goods
Fine cutting, scribing and plasticwelding
Packaging and paper industry Perforating and scribing of paperand foils
Components Laser industry, printing, defense industry, medical

10
LASER MACRO PRODUCTS The Company's business strategy for revenue growth in its macro laser business focuses on:
• further broadening and optimizing its high-power fiber laser portfolio by offering more efficient laser sources and additional features for improved performance and lower cost of ownership;
• further reduction of manufacturing costs of high-power fiber lasers;
• targeting the surface treatment market with its new DF060 HP fiber coupled 6 kW diode laser system;
• further developing the Tube Welding, Profile Welding and Scanner Welding System concepts;
• capitalizing on its strong CO2 laser portfolio, in the low-power as well as in the high-power range; and
• continuing research and product engineering for its solid-state, fiber, diode and CO2 laser series to further penetrate the market and to further increase the output power or vary the wavelengths for specific applications.
The Company's high-power laser macro product offering consists of laser products which are produced and marketed under the following brand names: ROFIN, PRC, NELC, Nufern and DILAS.
The Company's family of CO2 laser products for macro applications and their principal markets and applications, are discussed below.
LASER SERIES
POWER RANGE MODE OF
EXCITATION PRINCIPAL
MARKETS PRINCIPAL
APPLICATIONSDC Slab Series 1.0 kW - 8.0 kW Radio frequency Machine tool
Automotive Cutting and welding
SR / OEM Series 125 W - 650 W Radio frequency Machine toolElectronicsPackaging Textile industry
Cutting andstructuring of textile,paper and plasticsGlass marking andcuttingScribing
GL Series 1.0 kW - 2.0 kW Direct current Machine tool Cutting and weldingSTS Series 2.5 kW - 5.0 kW Direct current Machine tool Cutting and weldingCH Series 5.0 kW - 6.0 kW Direct current Machine tool Cutting and weldingFH Series 6.0 kW - 8.0 kW Direct current Machine tool Cutting and weldingSM Series 1.0 kW - 3.0 kW Direct current Machine tool
Packaging Cutting and welding
FA Series 4.0 kW - 5.0 kW Direct current Machine tool Cutting and weldingPLS Series 2.5 kW - 6.0 kW Direct current Machine tool Cutting and welding
The Company believes that it is the only laser manufacturer of diffusion cooled, Slab-based lasers in the high-power range. In the DC Slab Series laser design, a radio-frequency excited gas discharge occurs between two water-cooled electrodes that have a large surface area that permits maximum heat dissipation. Principal market for the Slab Series lasers is the machine tool industry.
The Company's SR and OEM Series diffusion cooled, wave-guide CO2 lasers are developed and produced by ROFIN-SINAR UK Ltd. Both Series are sealed-off lasers, which are also based on the Slab laser principle used for the DC Slab Series. These lasers are used mainly for cutting, marking and structuring applications. Principal markets are the machine tool, textile, electronics and packaging industries.
The Company's GL, CH, STS, FH, SM, FA and PLS Series fast-axial flow CO2 lasers are used for both cutting and welding applications and are marketed under the PRC and NELC brands. In the fast-axial flow principle, the gas discharge occurs in a tube in the same direction as the resonator, through which the laser gas mixture flows at a high speed. GL, CH, STS, FH, SM,

11
FA and PLS Series products are used primarily by the machine tool industry. The SM Series are also frequently used in the packaging industry, for example for dieboard cutting.
The Company's family of solid-state and fiber laser products for macro applications and their principal markets and applications, are discussed below.
LASER SERIES
POWER RANGE
MODE OFEXCITATION
PRINCIPALMARKETS
PRINCIPALAPPLICATIONS
DQ Series 500 W - 1.0 kW Laser diodes Automotive,Photovoltaics,Steel industry
Surface treatment
FL Series 500 W - 8.0 kW Laser diodes Automotive,Machine tool
Cutting and welding
NukW Series > 1.0 kW Laser diodes Defense industry Advancedapplications
The Company's DQ Series of Q switched, solid-state lasers are designed for applications such as removal, cleaning, and insulation of various materials in the automotive, steel and photovoltaic markets. To meet the different demands of these target markets, DQ Series lasers offer alternative set-up options which differ in power, pulse energy and number of laser sources per unit.
The Company's FL Series of high-brightness single or multi-mode fiber lasers use special fiber optics as the active medium. These fiber lasers are suitable for classic cutting and welding applications as well as for new applications such as remote cutting and scanner welding. In contrast to common laser concepts in which the created laser beam switches repeatedly between air and the active medium, this laser beam does not leave the fiber optic before entering the working process optic or the beam switch with subsequent launching into the working process. Due to this “all-in-fiber” technology, the risk of contamination can be avoided. Beam switches and energy splitters are available options allowing up to four work cells to be operated with only one laser.
The Company's NukW Series products are stand-alone fiber laser amplifiers that are produced and marketed under the Nufern brand. Their principal market is the defense industry, where they are used for advanced applications.
The Company's family of high-power diode laser products for welding and surface treatment applications, and their principal market, are discussed below.
LASER SERIES
POWER RANGE MODE OF
EXCITATION PRINCIPAL
MARKETS PRINCIPAL
APPLICATIONSDF Series 1.0 kW - 6.0 kW Direct current Machine tool Cladding, hardening,
additive manufacturingand welding
The Company's high-power diode lasers are designed to meet the requirements of a wide range of welding and surface treatment applications like cladding, hardening and additive manufacturing. The Company's high-power diode lasers are produced by Dilas and marketed under the ROFIN brand.
LASER MARKING PRODUCTS The Company entered the laser marking business in 1989 when it acquired Laser Optronic GmbH from Coherent General, Inc. and designed and introduced the “PowerLine” laser marker. Since then the Company has developed a broad line of market leading laser markers that deliver optimal results in terms of quality and speed on a wide range of materials. Based on its vast experience, ROFIN offers standardized and customized laser marking systems in different power ranges and wavelengths for use in various industrial segments. Strength and experience in research and development, application and software ensure innovative, standardized and tailored solutions which meet most exigent customer demands. The Company's laser marking products incorporate high value-added software - VisualLaserMarker - that provide the customer with full control of the laser marking process.

12
The Company believes that the following factors have contributed to the growth that it has experienced in the laser marking business:
• the Company's ability to tailor its laser marking solutions to the customer's requirements;
• the Company's expertise in solid-state laser beam power in different wavelengths, mode structure and high-frequency switching capability, which provides optimal quality in terms of marking contrast and speed on a wide variety of materials;
• the Company's proprietary software - VisualLaserMarker - which provides an interface between the laser marking products and the customer's computers and supports a broad range of network communication software; and
• the Company's focus on innovation, which is reflected in cutting-edge products that satisfy standard as well as complex market requirements.
The Company's business strategy for revenue growth in its laser marking business focuses on:
• to expand its position in worldwide laser marking markets with a particular focus on the semiconductor, electronics, automotive, smart card and medical device industries;
• to offer a balanced product portfolio covering different technologies (such as CO2, solid-state, short pulse and fiber lasers) in different wavelengths (i.e. infrared, green and UV) and different pulsing capabilities (i.e. ns or ps lasers);
• to pursue application development for existing and new products; and
• to capitalize on its installed base of lasers by cross-selling the Company's products to its existing customers.
The Company's laser marking product offering consists of laser products, which are produced and marketed under the following brand names: ROFIN and Nufern.
The Company's family of laser products for marking applications and their principal markets, are discussed below.
LASER SERIES
POWER RANGE MODE OF
EXCITATION PRINCIPAL
MARKETS PRINCIPAL
APPLICATIONSPowerLine 2 W - 100 W Laser diodes Semiconductor,
Electronics, Automotive, Medical device,General marking applications
Integrated circuitmarking, marking ofmetals, plastics andorganic materials, dayand night design,smart card, annealing
PowerLine Pico 2 W - 10 W Laser diode Electronics Marking of plasticsand metals
MultiScan VS / HE 100 W - 120 W Radio frequency Packaging,Consumer products,Pharmaceutical
Consumer goodsmarking
LabelMarker Series Stand-alone laser based system Automotive Label markingEasyMark Laser workstation General marking
applications,Medicalcomponents,Tool industry
Metal and plastics marking
EasyJewel Laser workstation Jewelry marking Metal markingCombiLine Series Laser workstation for integration of a wide
range of ROFIN laser markers General marking
applications Metal and plastics
markingNuQ Fiber Series 10 W - 50 W Laser diodes OEM/Integrators Marking,
engraving
13
PowerLine - The Company's latest generation of PowerLine laser marking products consist of a range of lasers with output power from 2 watts to 100 watts with a galvo-head, a state-of-the-art personal computer and ROFIN's proprietary VisualLaserMarker software. The modular design of the PowerLine markers with 19'' components enable the customers to order the most suitable configuration for their production processes or systems (e.g. OEM customers may order the laser head and 19'' modules for easy integration into the system specified by the end user). The PowerLine solid-state lasers incorporate diode modules which result in higher output power (and therefore higher marking speeds), high beam quality (and therefore constant and reliable marking quality), and longer service intervals. New-generation, completely air-cooled solutions provide further increases in efficiency in a compact size. PowerLine marking products are also available with fiber lasers with output powers of up to 100 watts (i.e. with PowerLine F 100), ensuring higher energy efficiency and therefore reduced operating costs. The availability of different wavelengths and pulse widths in the product portfolio enables the Company to provide solutions for a wide range of applications. This is especially true for the frequency multiplied lasers (green, UV) as well as shortpulse lasers that open new areas for the industrial utilization. The Company's proprietary VisualLaserMarker software provides customers with a user-friendly software environment that allows them to select fonts, import graphics, preview marking and control all laser parameters and job programs. Special options and accessories include a double marking head allowing speeds of up to 1,600 characters per second in certain applications (most notably marking of integrated circuits), as well as beam-switching and -splitting options for marking of products in multiple production lines using a single laser. Their main application - among a wide variety of possible applications - is marking in the semiconductor and electronics industries.
PowerLine Pico - The Company’s PowerLine Pico laser marker is an efficient tool for marking and engraving but is also suitable for thin film ablation and structuring. The exceptionally high pulse frequency of 200 to 800 KHz offers high throughput and allows for maximum pulse overlapping. The PowerLine Pico features a linear polarized and collimated output beam with 1064 nm and 532 nm wavelengths. Compared to nanosecond laser sources, the picosecond pulse length significantly reduces thermal damage in adjacent material. This results in better ablation quality, less surface roughness and enhanced precision of selective layer ablation. Furthermore, the shorter pulses significantly help reducing thermal penetration depth during delicate ablation processes, like marking of silicon. The Company believes that the PowerLine Pico perfectly meets the requirements of various applications in wafer production, medical device manufacturing and other industries.
MultiScan VS - This vector scanning marker utilizes a 100 watts sealed-off CO2 laser and features the ability to mark components that are moving at high speeds. The main application is the marking of consumer goods in the packaging industry (i.e. date coding). MultiScan HE - This vector scanning marker has been designed to operate in some of the harshest manufacturing environments and it utilizes a 120 watts sealed-off CO2 laser source. The main applications are the marking of beverage labels and the application of tracking data on "hot" glass containers during the manufacturing process.
LabelMarker Advanced - This stand alone, laser-based system is ROFIN's state-of-the art solution to address the high demands concerning speed and reliability in the process of label marking. The LabelMarker Advanced system delivers high efficiency and short marking time due to an integrated, powerful laser. As a comprehensive all-in-one solution, the LabelMarker Advanced is a compact laser system with a class 1 safety rating which can be used in any production area without additional safety requirements.
EasyMark - The EasyMark is a class 1 safety rating transportable desktop device. The 110 V to 230 V connection and integrated cooling based on thermo-electrical technology guarantees quick and easy initial operation. Besides a program-controlled z-axis and a rotary axis, the EasyMark offers various modules which can optionally be integrated. An aluminum T-slot plate facilitates mounting of customer-specific work piece carriers, thereby allowing the processing of work pieces of different sizes and shapes.
EasyJewel - The EasyJewel is a transportable desktop device with a class 1 safety rating specially developed to mark jewelry. The laser system offers the benefits of non-contact, abrasion-resistant, permanent marking onto almost any type of precious material with high speed and precision. Special machine features include quick and exact loading of regular and special shapes, jogging function to reach the optimum marking position and various software capabilities.
CombiLine Basic/CombiLine Advanced - These compact laser workstations have been designed for small and medium-size batches. They integrate a wide range of ROFIN laser markers depending on the customer's specific application. Supply units are incorporated in the housing to provide efficient use of the customer's floor space. Different versions (either with rotary or work table with various axes) enable exact adaptation to the required tasks.
NuQ - These pulsed fiber laser sources are produced and marketed under the Nufern brand and are designed for OEM customers and integrators. Their compact industry standard footprint allows easy integration into marking systems in a variety of industries.

14
LASER MICRO PRODUCTS After the acquisition of Baasel Lasertech in 2000, the Company formed a separate sales and marketing group focused on micro applications. This group markets and sells a broad range of laser products, including pulsed, fiber and other solid-state lasers for various spot and seam welding and fine cutting applications, CO2 Slab lasers for perforating applications, Q switched, solid-state and ultrashort pulse lasers for surface structuring/ablation, cutting, drilling and diode lasers for plastic welding applications. In 2011, the company acquired Lasag AG, Thun (Switzerland) with its primary markets including the medical device and aerospace industries.
The Company's business strategy for revenue growth in its micro applications business focuses on:
• continue to develop customers in the consumer electronics industry for fine welding and cutting applications as well as for plastic welding;
• focus on manufacturers of medical instruments and implants within the medical device industry using mainly cutting and welding applications;
• increase its sales of perforating systems to the packaging industry for applications like easy-tear and special perforated foils for food packaging that allow the transfer of air and keep moisture in packaged goods;
• further broadening its existing portfolio through expanding the output power range and offering different wavelengths (i.e. UV, infrared, green) and different laser technologies (i.e. fiber lasers, ultrashort pulse lasers, diode lasers);
• increase its sales in the photovoltaic market with different applications (e.g. through special laser solutions that realize an efficiency increase of solar cells);
• develop/broaden new markets for short and ultrashort pulse laser applications such as brittle material cutting based on the Company's proprietary process technology; and
• develop/broaden applications such as turbine drilling for the aerospace or power generation industries.
The Company's laser micro product offering consists of laser products which are produced and marketed under the ROFIN, DILAS, Corelase and Lee Laser brand names.

15
The Company's family of laser products for micro applications, and their principal markets, are discussed below.
LASER SERIES
POWER RANGE
MODE OFEXCITATION
PRINCIPALMARKETS
PRINCIPALAPPLICATIONS
Manual Welders
60 W - 200 W
Flash lamp
Jewelry,Mold making, Medical device
Spot and seamwelding
StarPulse 40 W - 500 W Flash lamp Medical device,Electronics
Spot and seamwelding
StarFiber 100 W - 600 W Diode
Electronics,Medical device
Fine cutting,fine welding
StarFiber P 150 W - 300 W Diode Medical device,Electronics,Watch industry
Precision drilling,cutting and welding
X-Lase
1 W - 24 W
Diode Semiconductor,Electronics, Displays
Scribing,fine cutting,fine welding
StarFemto 1 W - 15 W Diode Medical device,Watch industry,Automotive
Cutting,structuring,drilling
StarPico 15 W - 50 W Diode Medical device,Electronics,Displays & Glass,Photovoltaics,Tool industry
Cutting,structuring,drilling,ablation
PerfoLas Systems 1,000 W - 2,000 W Radio frequency Paper Perforating
StarShape Systems 100 W - 600 W Radio frequency Packaging Cutting, drilling,structuring
UW and MPS LaserSystems
n.a. n.a. Electronics, Energy,Medical device, Glass,Automotive,Semiconductor, Job shops
Cutting, weldingstructuring, brittle materials (e.g. sapphire)
Series LDP 10 W - 800 W Diode OEM Micro/Marking
Series LEP 2 W - 20 W Diode OEM Micro/Marking
Series LDPP 8 W - 200 W Diode OEM Fine cutting
Series LFP 7 W - 50 W Diode OEM Micro
COMPACT, MINI and EVOLUTIONDiode Laser System Series
10 W - 1,200 W Direct current Automotive,Electronics,Medical device,Consumer goods
Plastic welding,soldering, brazing,micro hardening
KLS Series 15 W - 250 W Flash lamp Automotive,Medical device,Consumer goods
Fine cutting, precision drilling,scribing
FLS Series 150 W - 800 W Flash lamp Aerospace,Power generation,Tooling
Drilling, cutting,welding
SLS Series 5 W - 220 W Flash lamp Medical device,Electronics,Automotive
Spot and seamwelding
QFS Series 50 W Diode Automotive Scribing
Manual Welders - The Company's manual welders for micro applications, which are sold under the names Performance, Tool Open, and Integral, consist of pulsed, solid-state lasers in the range of 60 to 200 watts, which are primarily used for fine welding applications in the medical device, jewelry and mold making industries.

16
StarPulse Series - The StarPulse Series consists of pulsed Nd:YAG rod lasers with power ratings from 40 to 500 watts. StarPulse lasers provide high peak powers and high pulse-to-pulse stability and are designed for use in fine welding applications such as laser welding of highly reflective materials in the medical device and electronics industries.
StarFiber Series - The robust and compact fiber laser systems of the StarFiber Series achieve nominal powers of 100 to 600 watts. The lasers can be operated in either pulse-modulated or continuous-wave mode. The StarFiber Series is designed for a broad range of applications including fine welding, such as welding of electro-mechanic components, and fine cutting, such as in the production of medical devices.
StarFiber P Series - The pulsed fiber lasers of the StarFiber P Series provide high pulse peak power and high beam quality and are ideally suited for processing a wide range of materials in the medical device, electronics and watch industries.
X-Lase - The X-Lase Series consists of picosecond pulse mode-locked fiber laser systems with a maximal output power of up to 24 watts. Main markets are in the semiconductor, electronics, and display industries. In these industries the X-Lase products can be used for thin film patterning, ablation and scribing applications. Additionally, specific versions of the X-Lase Series have been developed for fine cutting and fine welding of transparent and brittle materials like sapphire, glass or silicon carbide. The X-Lase Series are manufactured and marketed under the Corelase brand.
StarFemto - The StarFemto Series is comprised of femtosecond pulse mode-locked laser systems with a maximal output power of 15 watts. The main markets are medical implants, automotive and watch manufacturing, where they are mainly used for fine cutting, drilling, or structuring applications.
StarPico - The StarPico Series consists of picosecond pulse mode-locked laser systems with a maximal output power of 50 watts. The main markets are the medical device, electronics, tool, glass and solar industries, in which they are mainly used for fine cutting, drilling structuring and ablation.
PerfoLas Systems - The PerfoLas systems consist of a high-power CO2 laser and a specially designed beam delivery and paper handling system that includes a laser beam splitter (PerfoLas Multiplexer) which allows customers to drill more than 500,000 holes per second into paper or foils. The primary application for these lasers is perforation of paper and foils.
StarShape Systems - Each StarShape system consists of a CO2 laser in combination with a galvo scanning head and is used for precise cutting, drilling and surface structuring. The main market is the packaging industry.
The Universal Workstation (“UW”) and Modular Processing System (“MPS”) Series are modular, standard laser-based systems that have been designed to meet a variety of applications including welding, cutting, surface modification and ablation. Depending on the application, the UW and MPS Systems can be equipped with different laser sources (CO2, femtosecond, fiber, diode or solid-state laser) and modified for specific handling requirements. Our latest generation MPS systems are designed to accommodate the Ultrashort Pulse (USP) series products and address the market needs for applications such as cutting brittle materials (e.g. glass). Our next generation UW systems are designed to accommodate our high-power fiber lasers and address the needs for competitive 5 axis motion, high accuracy and high volume manufacturing.
The Series LDP and LEP are diode pumped, solid-state lasers that are produced and marketed under the Lee Laser brand and sold to OEM customers and system integrators for various micro and marking applications.
The Series LDPP are diode pulse-pumped Nd:YAG lasers that are produced and marketed under the Lee Laser brand and are designed specifically to precision cut thin metals. The main market is the medical device industry.
The Series LFP are hybrid diode pumped, solid state, picosecond lasers that are produced and marketed under the Lee Laser brand and are sold to OEM customers and system integrators for various micro applications.
The COMPACT, MINI and EVOLUTION Diode Laser System Series are laser systems that are manufactured and marketed under the DILAS brand. These systems are available in a wide range of output powers and wavelengths, including fiber-coupled direct beam or homogenized line source solutions, and are engineered for utilization in industrial laser materials processing, mainly for plastic welding, soldering and brazing applications in the automotive, medical device and electronic industries.
KLS Series - The KLS Series lasers are pulsed solid-state lasers that provide excellent beam quality and high peak power, which are ideal for fine cutting, drilling and scribing applications.

17
The FLS Series are lamp pumped, pulsed, solid-state lasers with high peak power for deep penetration cutting, welding and drilling for high throughput. Targeted industries are mainly the aerospace, power generation, and tooling industries.
SLS Series - The lasers of this series are pulsed Nd:YAG solid-state lasers with output powers in the range of 5 to 250 watts and pulse durations of up to 200 ms with outstanding process features for welding challenging metals and dissimilar materials. The SLS Series lasers are state-of-the-art production tools in the medical device industry, but are also used in many other applications in the aerospace, power generation, electronics and automotive industries.
QFS Series - The QFS fiber laser system, consisting of a q-switch laser and a motorized processing head, offers a complete solution for scribing connection rods and other car engine parts in the automotive industry.
The KLS, FLS, SLS and QFS Series are all manufactured by the Company's Switzerland-based subsidiary ROFIN-LASAG. A broad variety of accessories such as specific beam delivery components, scanners, as well as different processing heads for cutting, welding or drilling applications are offered in combination with these micro products.
COMPONENTS Power Supplies - The Company offers power supplies for pulsed and continuous wave, solid-state lasers, CO2 lasers, diode lasers as well as RF generators for acousto-optic Q-switches through its wholly-owned subsidiary PMB Elektronik GmbH.
Fiber and Optics Technology and Wafer Processing - Fiber coupling products and optical engines for primary use in fiber lasers are manufactured and marketed by the Company's Finland-based subsidiary Corelase Oy. In addition, the Company's wafer processing takes place in the Finland-based facility.
Laser Diodes and Modules - High-power semiconductor components such as high power, high-brightness laser diodes and modules are manufactured and marketed by the Company's subsidiaries DILAS and m2k-laser GmbH.
Fibers and Fiber Optic Beam Deliveries - Fibers, fiber components, beam splitters or switches, and beam combiners designed for use in industrial lasers or as beam delivery systems are manufactured and marketed by Optoskand AB.
Laser Processing heads specially optimized for fiber lasers and applications such as micro cutting, drilling and welding are manufactured and marketed by ROFIN-LASAG.
Active and Passive Fibers and Amplifiers - Fibers and fiber laser technology components are developed, manufactured and marketed by Nufern.
The Company's high-technology components are either integrated by other laser manufacturers into their products or are used for the Company's own product portfolio.
APPLICATIONS DEVELOPMENT In addition to manufacturing and selling laser sources for macro applications and marking and micro applications, ROFIN operates sixteen application centers in ten countries, where it develops laser-based solutions for customers seeking alternatives to conventional manufacturing techniques. Revenues derived from application development are not a significant component of total revenues. Applications development is generally a support service to the sales and marketing function and is performed to customize the laser to the particular needs of the customer. The Company currently has approximately 50 employees in applications development.
MARKETS AND CUSTOMERS ROFIN sells its laser products and laser-based system solutions to a wide range of industries. Our principal markets are the machine tool, semiconductor, electronics, photovoltaic and automotive industries.

18
The following table sets forth the allocation of the Company’s total laser-related sales (excluding service, spare parts and components) among our principal markets:
Fiscal Years Principal Market 2015 2014 2013 Primary ApplicationsMachine Tool 36% 40% 37% Cutting and weldingSemiconductor, Electronics, and Photovoltaic 22% 19% 27% Marking, cutting and
welding of integratedcircuits, electroniccomponents, smartcards, and structuringof solar cells
Automotive & Sub-Supplier 12% 10% 8%Cutting, welding, andcomponent marking
70% 69% 72%
The remaining 30%, 31% and 28%, of total laser sales in fiscal 2015, 2014 and 2013, respectively, were attributable to customers in a wide variety of other industries including aerospace, consumer goods, medical device manufacturing, flexible packaging, job shops, jewelry, universities and institutes. No one customer accounted for over 10% of total sales in any of these periods.
SALES, MARKETING AND DISTRIBUTION ROFIN sells its products in approximately 70 countries to OEMs, systems integrators and industrial end users who have in-house engineering resources capable of integrating ROFIN’s products into their own production systems. Lasers for cutting applications are marketed and sold principally to OEMs in the machine tool industry, which sell laser cutting machines incorporating ROFIN’s products without any substantial involvement by ROFIN. Lasers for welding applications are marketed and sold both to systems integrators and to end users. Laser marking products are marketed and sold directly to end users and to OEMs for integration into their handling systems (mainly for integrated circuit, solar cell and smart card marking applications). Laser micro products are marketed and sold directly to end users and to OEM customers (mainly for solar cell, medical devices and jewelry applications). In the case of both welding lasers and laser marking products, the end user is significantly involved in the selection of the laser component. In these cases, ROFIN’s application engineers work directly with the end user to optimize the application’s performance and demonstrate the advantages of the Company’s products. ROFIN has approximately 135 direct sales engineers operating in 24 countries, approximately 45 of whom are dedicated to marketing lasers for macro applications and approximately 90 of whom are dedicated to marketing lasers for marking and micro applications. ROFIN sales engineers work either in a well-defined geographic territory or are dedicated to specific industries or applications. In addition, ROFIN has 45 independent representatives marketing the Company’s laser products in Australia, Austria, Argentina, Brazil, Chile, China, Czech Republic, Denmark, Estonia, Finland, France, Germany, India, Israel, Italy, Korea, New Zealand, Northern Africa, Norway, the Middle East, the Philippines, Poland, Romania, Russia, Singapore, South Africa, Slovenia, Sweden, Switzerland, Thailand, Turkey and Ukraine. These independent representatives provide ROFIN with sales leads and opportunities, but do not distribute ROFIN’s products. All sales and delivery of products are conducted by the Company. Of the independent representative agreements, 19 are on an exclusive basis, with the other 26 on a non-exclusive basis. These agreements provide for a standard percentage of the net sales price to be paid as commissions to the representatives. The duration of the agreements is usually one year (with an automatic one-year extension) and a six-month cancellation clause.
ROFIN directs its worldwide sales and marketing of lasers for macro applications from its offices in Hamburg and Mainz (both Germany), Kingston upon Hull (UK), and East Granby, Connecticut, and of laser diode components, from Mainz and Freiburg (both Germany). Worldwide sales and marketing of laser marking products is directed from ROFIN’s offices in Gunding-Munich (Germany) and, for laser micro products and power supplies from Starnberg (Germany). Optical engines for fiber lasers for the worldwide market are sold and marketed from Tampere (Finland) and East Granby, Connecticut (USA), and fiber optics and beam delivery systems are sold and marketed from Gothenburg (Sweden). In Europe, ROFIN also maintains sales and service offices in Belgium, France, Italy, the Netherlands, Spain, Switzerland and the United Kingdom. North American sales of ROFIN’s macro and micro laser products are managed out of the Company’s Plymouth, Michigan, facility. North American sales of its marking products are managed out of its Devens, Massachusetts, facility. The Company also maintains sales offices in Chandler, Arizona; and Santa Clara, California, to support the expansion of ROFIN’s laser
19
business in the North American market, and a sales and service office in Mississauga (Canada) to support the Canadian market. North American sales of diode laser components are directed from Tucson, Arizona. PRC Laser directs its worldwide sales and marketing of lasers for macro applications from its office in Landing, New Jersey, Lee Laser directs its worldwide sales and marketing of lasers for micro applications from its office in Orlando, Florida, and ROFIN-LASAG directs its worldwide sales and marketing of lasers for micro applications from its office in Thun, Switzerland. NELC directs its sales and marketing of lasers for macro applications from its office in Nanjing (China). All four companies sell their products independently under their own brands. The Company maintains sales and service offices in China, India, Japan, Singapore, South Korea and Taiwan. The Company believes that the Asian/Pacific region will have a very important business potential over the next five years. The countries with the greatest long-term business potential in the future are expected to be China and India, principally due to the expansion of domestic machine tool, automotive, semiconductor, electronics and photovoltaic production in these countries.
CUSTOMER SERVICE, REPLACEMENT PARTS AND COMPONENTS During fiscal 2015, 2014 and 2013, approximately 42%, 42% and 39%, respectively, of the Company’s revenues were generated from sales of after-sales services, replacement parts and components for laser products. The Company believes that a high level of customer support is necessary to successfully develop and maintain long-term relationships with its OEM- and end-user customers. The Company seeks to maintain this close relationship as its customers’ needs change and evolve. Recognizing the importance of its existing and growing installed multinational customer base, the Company has expanded its local service and support platform into new geographic regions. ROFIN has 430 customer service personnel. The Company’s field service and in-house technical support personnel receive ongoing training with respect to the Company’s laser products, maintenance procedures, laser-operating techniques and processing technology. Most of the Company’s OEM customers also provide customer service and support to end users. Many of ROFIN’s laser products are operated 24 hours a day in high speed, quality-oriented manufacturing operations. Accordingly, the Company provides 24 hour, year-round service support to its customers in the United States, Germany and the majority of other countries in which it operates. The Company plans to continue adopting similar service support elsewhere. In addition, eight-hour response time is provided to certain key customers. This support includes field service personnel who reside in close proximity to the Company’s installed base. The Company provides customers with process diagnostic and verification techniques, as well as specialized training in the operation and maintenance of its systems. The Company also offers regularly scheduled and intensive training programs and customized maintenance contracts for its customers.
Of ROFIN’s 430 customer service personnel, approximately 276 employees operate in the field in about 50 countries. Field service personnel are also involved in the installation of the Company’s systems. ROFIN’s approach to the sale of replacement parts is closely linked to the Company’s strategic focus on rapid customer response. The Company provides around-the-clock order entry and provides same or next day delivery of parts worldwide in order to minimize disruption to customers’ manufacturing operations. ROFIN typically provides a minimum one-year warranty for its products with warranty extensions negotiated on a case-by-case basis; and for after-sales service and parts supply for up to a period of 10 years, if requested by a customer. The Company’s growing base of installed laser sources and laser-based systems is expected to continue to generate a stable source of revenues from sales of replacement parts and after-sales service. In addition, the Company offers components such as OEM-laser modules, optical engines, laser diodes, active and passive fibers, fiber optic delivery systems and power supplies. These high-technology components are either integrated by other laser manufacturers into their products or are used for the Company's own product portfolio.
COMPETITION
The Company believes that as manufacturing industries continue to modernize, seek to reduce production costs and require more precise and flexible production, the features of laser-based systems will become more desirable than systems incorporating conventional material processing techniques and processes. The increased acceptance of these laser applications by industrial users will be enhanced by laser product line expansion to include lower and higher power CO2 lasers, variations in wavelength, advancements in fiber-optic beam delivery systems, improvements in reliability and the introduction of lower and higher power
20
diode lasers, diode pumped, solid-state lasers, short and ultrashort pulse lasers and fiber lasers, capable of performing heavy industrial material processing and marking and micro applications. Laser Macro Products The market for laser macro products and systems is fragmented and addressed by a large number of competitors. Many of them are small or privately owned or compete with ROFIN on a limited geographic, industry- or application-specific basis. The Company also competes in certain target markets with competitors that are part of large industrial groups and have access to substantially greater financial and other resources than ROFIN. The overall competitive position of the Company will depend upon a number of factors, including product performance and reliability, price, customer support, manufacturing quality, the compatibility of its products with existing laser systems, and the continued development of products utilizing diode laser, diode pumped, solid-state laser and fiber laser technologies. Competition among laser manufacturers is also based on attracting and retaining qualified engineering and technical personnel.
ROFIN believes it is among the top three suppliers of laser sources in the worldwide market for macro applications. Companies such as Trumpf and Fanuc (for high-power CO2 lasers), Synrad and Coherent (for low-power CO2 lasers), Trumpf and IPG Photonics (for solid-state or fiber lasers), and Laserline and Jenoptik (for diode lasers and laser diodes) all compete in a subset of markets in which ROFIN operates. However, in the Company's opinion, none of these companies compete in all of the industries, applications and geographic markets currently served by ROFIN.
Laser Marking and Micro Products The Company's laser marking products compete with conventional ink-based and acid-etching technologies, as well as with laser mask-marking. The Company's micro products compete with conventional welding, etching and spark erosion technologies. The Company believes that its principal competitors in the laser marking and micro markets include Trumpf, GSI Group, Unitek Miyachi, Han's Laser and IPG Photonics. ROFIN also competes with manufacturers of conventional non-laser products in applications such as welding, drilling, cutting and marking.
Significant competitive factors in the market for laser marking and micro products include system performance and flexibility, cost, the size of each manufacturer's installed base, capability for customer support and breadth of product line. Because many of the required components to develop and produce a laser product for marking applications are commercially available, barriers to entry into this market are low and the Company expects new competitive products to enter this market. The Company believes that its product range for marking and micro applications will compete favorably in this market primarily due to performance and price characteristics of such products.
MANUFACTURING AND ASSEMBLY ROFIN manufactures and tests its high-power CO2, solid-state and fiber laser macro products at its Hamburg (Germany), Plymouth, Michigan; Landing, New Jersey; East Granby, Connecticut, and Nanjing (China) facilities. The Company’s laser marking products are manufactured and tested at its facilities in Gunding-Munich (Germany), Starnberg (Germany), Oxford (UK), Singapore and Devens, Massachusetts. ROFIN’s micro application products are manufactured and tested in Starnberg (Germany), Tampere (Finland), Thun (Switzerland) and Orlando, Florida. The Company’s diode laser products are manufactured and tested at its Mainz (Germany), Freiburg (Germany), Nanjing (China), and Tucson, Arizona, facilities. The Company’s low-power CO2 laser products are manufactured and tested in Kingston upon Hull (UK). Coating of ROFIN’s Slab laser electrodes is performed at the Overath (Germany) facility. The Company’s fiber optics and beam delivery systems are manufactured and tested in Gothenburg (Sweden), and power supplies are manufactured and tested in Starnberg (Germany). The Company’s active and passive fibers and amplifiers are manufactured and tested in East Granby, Connecticut. Optical engines for fiber lasers, fiber lasers modules and wafer material are designed and manufactured in Tampere (Finland).
Given the competitive nature of the laser business, the Company focuses substantial efforts on maintaining and enhancing the efficiency and quality of its manufacturing operations. The Company utilizes just-in-time and cell-based manufacturing techniques to reduce manufacturing cycle times and inventory levels, thus enabling it to offer on-time delivery and high-quality products to its customers. ROFIN’s in-house manufacturing includes only those manufacturing operations that are critical to achieve quality standards or protect intellectual property. These manufacturing activities consist primarily of product development, testing of components and subassemblies (some of which are supplied from within the Company and others of which are supplied by third party vendors and then integrated into the Company’s finished products), assembly and final testing of the completed product, as well

21
as proprietary software design and hardware/software integration. Although the Company minimizes the number of suppliers and component types, wherever practicable, it has at least two sources of supply for key items. ROFIN has a qualifying program for its vendors and generally seeks to build long-term relationships with such vendors. The Company purchases certain major components from single suppliers. The Company estimates that 8% of its revenues are from the sale of products that require specialized components currently only available from single sources. ROFIN has written agreements with such suppliers and has not had material delays in supplies from these sources. The Company believes that it could, if necessary, purchase such components from alternative sources, within four to six months, following appropriate qualification of such new vendors. ROFIN is committed to meeting internationally recognized manufacturing standards. Its Hamburg, Gunding-Munich, Starnberg, Mainz, Overath (all Germany), Thun (Switzerland), Gothenburg (Sweden), Monza (Italy), Paris (France), Daventry (UK), Kingston upon Hull (UK), Nanjing (China), Singapore, East Granby, Connecticut, and Tucson, Arizona, facilities are ISO 9001 certified.
RESEARCH AND DEVELOPMENT During fiscal 2015, 2014 and 2013, ROFIN’s net spending on research and development was $40.0 million, $45.9 million and $43.0 million, respectively. The Company’s net spending on research and development reflects receipt of funding mainly under German and other European governments and European Union grants totaling $0.7 million, $1.6 million, and $2.4 million in fiscal 2015, 2014 and 2013, respectively. ROFIN has approximately 290 employees engaged in product research and development. ROFIN’s research and development activities are directed at meeting customers’ manufacturing needs and application processes. Core competencies include solid-state lasers, fiber lasers, ultrashort pulse lasers, CO2 gas lasers, diode lasers, precision optics, electronic power supplies, fibers, fiber optics, beam delivery, control interfaces, software programming, and systems integration. The Company strives for customer-driven development activities and promotes the use of alliances with key customers and joint development programs in a wide range of its target markets.
The Company’s research and development activities are carried out in fifteen centers in Hamburg, Gunding-Munich, Starnberg, Freiburg and Mainz (all Germany), Kingston upon Hull (UK), Gothenburg (Sweden), Tampere (Finland), Thun (Switzerland), Plymouth, Michigan, Landing, New Jersey, Orlando, Florida, Tucson, Arizona, East Granby, Connecticut, and Nanjing (China), and are centrally coordinated and managed. ROFIN maintains close working relationships with the leading industrial, government and university research laboratories in Germany, including the Fraunhofer Institute for Laser Technology in Aachen, the Institute for “Technische Physik” of the German Space and Aerospace Research Center in Stuttgart, the Fraunhofer Institute for Applied Solid State Physics in Freiburg, the Fraunhofer Institute for Material Science in Dresden, the Laser Center in Hanover (all Germany), and elsewhere around the world, including the University of Edinburgh in the United Kingdom, Tampere University of Technology in Finland, and University of Bern in Switzerland. These relationships include funding of research, joint development programs, personnel exchange programs, and licensing of patents developed at these institutes.
INTELLECTUAL PROPERTY ROFIN owns intellectual property, which includes patents, proprietary software, technical know-how and expertise, designs, process techniques and inventions. While policies and procedures are in place to protect critical intellectual property rights, ROFIN believes that its success depends to a larger extent on the innovative skills, know-how, technical competence and abilities of ROFIN’s personnel. ROFIN protects its intellectual property in a number of ways including, in certain circumstances, through patents. ROFIN has sought patent protection primarily in the United States, Europe and Asia. ROFIN currently holds 262 patents for inventions relating to lasers, processes and power supplies with expiration dates ranging from 2015 to 2034. In addition, 204 patent applications have been filed and are under review by the relevant patent authorities. The Company holds 39 exclusive and non-exclusive licenses of patents and pending patent applications with relevance to its products and laser technology. ROFIN requires its employees and certain of its customers, suppliers, representatives, agents and consultants to enter into confidentiality agreements to further safeguard ROFIN’s intellectual property. ROFIN, from time to time, receives notices from third parties alleging infringement of such parties’ patent or other intellectual property rights by ROFIN’s products. While these notices are common in the laser industry and ROFIN has in the past been

22
able to develop non-infringing technology or license necessary patents or technology on commercially reasonable terms, ROFIN cannot assure that it would in the future prevail in any litigation seeking damages or expenses from ROFIN or to enjoin ROFIN from selling its products on the basis of such alleged infringement. Nor can ROFIN assure that it would be able to develop any non-infringing technology or to license any valid and infringed patents on commercially reasonable terms. In the event any third party made a valid claim against ROFIN or its customers and a license were not made available to ROFIN on commercially reasonable terms, ROFIN would be adversely affected. From time to time, ROFIN files notices of opposition to certain patents on laser technologies held by others, including academic institutions and competitors of ROFIN, which the Company believes could inhibit its ability to develop laser products for industrial material processing applications.
ORDER BACKLOG The Company’s order backlog was $144.3 million, $141.3 million and $118.0 million, as of September 30, 2015, 2014 and 2013, respectively. The Company’s order backlog, which contains relatively little service, training and spare parts, represents approximately three months of laser shipments. The order backlog as of September 30, 2015, consists of a 4% higher order backlog for macro applications, a minor increase in order backlog for micro and marking applications of less than 1%, and a 4% higher order backlog for components compared to the order backlog as of September 30, 2014. The fluctuation of the U.S. dollar in fiscal year 2015 had an unfavorable effect of approximately $13.1 million on year-to-year order backlog. The increase in the Company's order backlog as of September 30, 2014 compared to September 30, 2013, was attributable to 18% higher order backlog for macro applications, 18% higher order backlog for micro and marking applications, and a 35% higher order backlog for components. The fluctuation of the U.S. dollar in fiscal year 2014 had a favorable effect of approximately $2.2 million on year-to-year order backlog. An order is entered into backlog by ROFIN when a purchase order with an assigned delivery date has been received. Delivery schedules range from one week to six months, depending on the size, complexity and availability of the product or system ordered, although typical delivery dates for laser source products range between one to twelve weeks from the date an order is placed. Although there is a risk that customers may cancel or delay delivery of their orders, orders for standard non-customized lasers can typically be allocated to other customers without significant additional costs. The Company also manages this risk by establishing the right to charge a cancellation fee that covers any material and developmental costs incurred prior to the order being canceled. Enforcement of this right is dependent on many factors including, but not limited to, the customer’s requested length of delay, the number of other outstanding orders and the order and sales history with the same customer, and the ability to quickly convert the canceled order to another sale. The Company anticipates shipping the present backlog during fiscal year 2016. However, the Company’s backlog at any given date is not necessarily indicative of actual sales for any future period.
EMPLOYEES The following table sets forth the Company's employees by geographic regions as of September 30, 2015 and 2014:
September 30,2015 2014
North America 399 425Germany 1,041 1,066Asia 327 320Other 464 459
2,231 2,270
The average number of employees for the fiscal year ended September 30, 2015 was 2,255.
While the Company’s employees are not covered by collective bargaining agreements and the Company has never experienced a work stoppage, slowdown or strike, the Company’s employees at its Hamburg and Starnberg (both Germany) facilities are each represented by a nine-person works council and in Gunding-Munich (Germany) by a seven-person works council. Additionally, Hamburg and Gunding-Munich are represented by a four-person central works council. Matters relating

23
to compensation, benefits and work rules are negotiated and resolved between management and the works council for the relevant location. The Company considers its relations with its employees to be good.
GOVERNMENT REGULATION The majority of the Company’s laser products sold in the United States are classified as Class IV Laser Products under applicable rules and regulations of the Center for Devices and Radiological Health (“CDRH”) of the U.S. Food and Drug Administration. The same classification system is applied in the European markets. Safety rules are formulated with “Deutsche Industrie Norm” (i.e., German Industrial Standards) or ISO standards, which are internationally harmonized.
CDRH regulations generally require a self-certification procedure pursuant to which, for each product incorporating a laser device, a manufacturer must file periodic reporting of sales and purchases, and compliance with product labeling standards with CDRH. The Company’s laser products for macro, micro and laser marking applications can result in injury to human tissue if directed at an individual or otherwise misused. The Company believes that its laser products for macro, micro and marking applications, and its components are in substantial compliance with all applicable laws for the manufacture of laser devices.
In August 2012, the U.S. Securities and Exchange Commission (SEC) issued a rule under Section 1502 of the Dodd-Frank Wall Street Reform and Consumer Protection Act requiring companies to publicly disclose their use of conflict minerals that originated in the Democratic Republic of the Congo (DRC) or an adjoining country. Under the rule, issuers are required to conduct a “reasonable” due diligence process to ascertain the source of conflict minerals, defined as tantalum, tin, gold or tungsten, that are necessary to the functionality or production of their manufactured or contracted to be manufactured products. Companies are required to provide this disclosure on Form SD filed with the SEC. The Company filed its Form SD on June 1, 2015 for the 2014 calendar period.
AVAILABLE INFORMATION The Company makes available, free of charge on its internet website, its Annual Report on Form 10-K, quarterly reports on Form 10-Q, current reports on Form 8-K, and any amendments to those reports filed or furnished pursuant to Section 13(a) or 15(d) of the Exchange Act, as soon as reasonably practicable after they are electronically filed with, or furnished to, the Securities and Exchange Commission (the “SEC”). You can find these reports on the Company’s website at www.rofin.com under the heading “Investor Relations”. The information on the Company’s website is not incorporated by reference in this Annual Report on Form 10-K. These reports may also be obtained at the SEC’s Public Reference Room at 100 F Street NE, Washington, D.C. 20549. Information on the operation of the Public Reference Room is available by calling the SEC at (202) 551-8090. You may also access this information at the SEC’s website (http://www.sec.gov). This site contains reports, proxy and information statements, and other information regarding issuers that file electronically with the SEC.
24
ITEM 1A. RISK FACTORS THE GLOBAL ECONOMY, CAPITAL MARKETS, CREDIT DISRUPTIONS AND POLITICAL ENVIRONMENT CHANGES CAN ADVERSELY IMPACT OUR RESULTS OF OPERATIONS. Our business, operating results, or financial condition can be impacted by a number of macroeconomic factors, which could in turn affect our stock price. These macroeconomic factors include, but are not limited to, consumer confidence and spending levels, unemployment, consumer credit availability, global factory production and credit market conditions. Additionally, changes in the political environment in the markets in which we operate can adversely impact our business, such as foreign exchange import and export controls, tariffs and other trade barriers and price or exchange controls.
DOWNTURNS IN THE INDUSTRIES WE SERVE, PARTICULARLY IN THE MACHINE TOOL, AUTOMOTIVE, SEMICONDUCTOR, ELECTRONICS AND PHOTOVOLTAIC INDUSTRIES, MAY HAVE A MATERIAL ADVERSE EFFECT ON OUR SALES AND PROFITABILITY. Our business depends substantially upon capital expenditures particularly by manufacturers in the machine tool, automotive (and sub-suppliers), semiconductor, electronics and photovoltaic industries. Approximately 70% of our laser sales during fiscal year 2015 were to these industry markets. These industries are cyclical and have historically experienced periods of oversupply, resulting in significantly reduced demand for capital equipment, including the products manufactured and marketed by us. For the foreseeable future, our operations will continue to depend upon capital expenditures in these industries, which, in turn, depend upon the market demand for their products. Decreased demand from manufacturers in these industries, for example, during an economic downturn, may lead to decreased demand for our products. Although such decreased demand would reduce our sales, we may not be able to reduce expenses quickly, due in part to the need for continual investment in research and development and the need to maintain our extensive ongoing customer service and support capability. Although we order materials for assembly in response to firm orders, the lead time for assembly and delivery of some of our products creates a risk that we may incur expenditures or purchase inventories for products which we cannot sell.
Accordingly, any economic downturn or slowdown in the machine tool, automotive, semiconductor, electronics or photovoltaic industries could have a material adverse effect on our financial condition and results of operations.
A HIGH PERCENTAGE OF OUR SALES ARE OVERSEAS AND OUR RESULTS ARE THEREFORE SUBJECT TO THE IMPACT OF EXCHANGE RATE FLUCTUATIONS. Although we report our results in U.S. dollars, approximately 67% of our current sales are denominated in other currencies, including the Euro, Swedish krona, Swiss francs, British pound, Singapore dollar, Japanese yen, Korean won, Taiwanese dollar, Canadian dollar, Indian rupee, and Chinese RMB. The fluctuation of the Euro, and the other functional currencies, against the U.S. dollar has had the effect of increasing and decreasing (as applicable) reported net sales as well as cost of goods sold, gross margin, and selling, general and administrative expenses denominated in such foreign currencies when translated into U.S. dollars as compared to prior periods. We also face transaction risk from fluctuations in exchange rates between the various currencies in which we do business. We believe that a certain portion of the transaction risk of our operations in multiple currencies is mitigated by our hedging activities, utilizing forward exchange contracts and forward exchange options. We also continue to borrow in many of our operating subsidiaries' functional currencies to reduce exposure to exchange gains and losses. However, there can be no assurance that changes in currency exchange rates will not have a material adverse effect on our business, financial condition and results of operations.

25
OUR INABILITY TO MANAGE THE RISKS ASSOCIATED WITH OUR INTERNATIONAL OPERATIONS COULD ADVERSELY AFFECT OUR BUSINESS. Our products are currently marketed in approximately 70 countries, with the United States, Germany, the rest of Europe and the Asia/Pacific region being our principal markets. Our operations and sales in our principal markets are subject to risks inherent in international business activities, including:
• the general political and economic conditions in each such country or region;
• overlap of differing tax structures;
• climatic or other natural disasters in regions where we operate;
• increases in shipping costs or increases in fuel costs;
• longer payment cycles;
• acts of terrorism;
• increased vulnerability to the theft of, and reduced protection for intellectual property rights;
• management of an organization spread over various jurisdictions; and
• unexpected changes in regulatory requirements and compliance with a variety of foreign laws and regulations, such as import and export licensing requirements, trade restrictions, currency control and restrictions, delays, penalties or required withholdings on repatriation of earnings.
Any failure to manage the risks associated with our international business operations could have a material adverse effect on our financial condition and results of operations. Our profitability may be adversely affected by economic slowdowns in the United States, Europe or the Asia/Pacific region. A recession in these economies could trigger a decline in laser sales to the machine tool, automotive, semiconductor, electronics or photovoltaic industries, and any related weaknesses in their respective currencies could adversely affect customer demand for our products, the U.S. dollar value of our foreign currency denominated sales, and ultimately our consolidated results of operations.
We also are subject to risks that our operations outside the United States could be conducted by our employees, contractors, service providers, representatives or agents in ways that violate the Foreign Corrupt Practices Act or other similar anti-bribery laws. Any such violations could have a negative impact on our business and could result in government investigations and/or injunctive, monetary or other penalties. Moreover, we face additional risks that our anti-bribery policy and procedures may be violated by third-party sales representatives or other agents that help sell our products or provide other services, because such representatives or agents are not our employees and it may be more difficult to oversee their conduct.
OUR GLOBAL OPERATIONS ARE SUBJECT TO EXTENSIVE AND COMPLEX IMPORT AND EXPORT RULES THAT VARY AMONG THE LEGAL JURISDICTIONS IN WHICH WE OPERATE. FAILURE TO COMPLY WITH THESE RULES COULD RESULT IN SUBSTANTIAL PENALTIES.
Due to the international scope of our operations, we are subject to a complex system of import- and export-related laws and regulations, including U.S. export control and customs regulations and customs regulations of other countries. These regulations are complex and vary among the legal jurisdictions in which we operate. Any alleged or actual failure to comply with such regulations may subject us to government scrutiny, investigation and civil and criminal penalties, and may limit our ability to import or export our products or to provide services outside the United States. Depending on its size and scope, any of these penalties could have a material impact on our financial position, results of operations and cash flows.

26
WE DEPEND ON THE ABILITY OF OUR OEM CUSTOMERS TO INCORPORATE OUR LASER PRODUCTS INTO THEIR SYSTEMS. Our sales depend in part upon the ability of our OEM customers to develop and sell systems that incorporate our laser products. Adverse economic conditions, inadequate liquidity, large inventory positions, limited marketing resources and other factors affecting these OEM customers could subject us to risks of business failure by such customers and potential credit and inventory risks, and thus could have a substantial impact upon our financial results. We cannot provide assurances that our OEM customers will not experience financial or other difficulties that could adversely affect their operations and, in turn, our financial condition or results of operations.
WE EXPERIENCED IN THE PAST, AND EXPECT TO EXPERIENCE IN THE FUTURE, FLUCTUATIONS IN OUR QUARTERLY RESULTS. THESE FLUCTUATIONS MAY INCREASE THE VOLATILITY OF OUR STOCK PRICE. We have experienced and expect to continue to experience some fluctuations in our quarterly results. We believe that fluctuations in quarterly results may cause the market prices of our common stock, on the NASDAQ Global Select Market and the Frankfurt Stock Exchange, to fluctuate, perhaps substantially. Factors which may have an influence on the Company’s operating results in a particular quarter include:
• general economic uncertainties;
• fluctuations in demand for, and sales of, our products or prolonged downturns in the industries that we serve;
• the timing of the receipt of orders from major customers;
• product mix;
• competitive pricing pressures;
• the relative proportions of domestic and international sales;
• our ability to design, manufacture and introduce new products on a cost-effective and timely basis;
• the delayed effect of incurrence of expenses to develop and improve marketing and service capabilities;
• foreign currency fluctuations;
• ability of our suppliers to produce and deliver components and parts, including sole or limited source components, in a timely manner, in the quantity desired and at the prices we have budgeted;
• our ability to control expenses; and
• costs related to acquisitions of businesses. These and other factors make it difficult for us to release precise predictions regarding the development and financial results of our business. In addition, current conditions in the domestic and global economies are uncertain, i.e. currently in Asia, especially in China. As a result, it is difficult to estimate the level of growth for the economy as a whole or of capital expenditures in the industrial markets we serve. Because all of the components of our budgeting and forecasting are dependent on estimates of spending within these markets, the prevailing economic uncertainty renders estimates of future revenue and expenses even more difficult than usual to make. In addition, our backlog at any given time is not necessarily indicative of actual sales for any succeeding period. As our delivery schedule typically ranges from one week to six months, our sales will often reflect orders shipped in the same quarter that they are received. Moreover, customers may cancel or reschedule shipments and production difficulties could delay shipments. Accordingly, the Company’s results of operations are subject to significant fluctuations from quarter to quarter. See also “Business - Order Backlog”.
Other factors that we believe may cause the market price of our common stock to fluctuate, perhaps substantially, include announcements of new products, technologies, or customers by us or our competitors, developments with respect to intellectual property, and shortfalls in our operations relative to analysts’ expectations. In addition, in recent years, the stock market in general, and the shares of technology companies in particular, have experienced wide price fluctuations. These broad market and industry fluctuations, particularly in the semiconductor, electronics, photovoltaics, machine tool and automotive industries,

27
may adversely affect the market prices of our common stock on the NASDAQ Global Select Market and the Frankfurt Stock Exchange.
THE MARKETS FOR OUR PRODUCTS ARE HIGHLY COMPETITIVE AND INCREASED COMPETITION COULD INCREASE OUR COSTS, REDUCE OUR SALES OR CAUSE US TO LOSE MARKET SHARE. The laser industry is characterized by significant price and technical competition. Our current and proposed laser products for macro, marking and micro applications, and components, compete with those of several well-established companies, some of which are larger and have substantially greater financial, managerial and technical resources, more extensive distribution and service networks and larger installed customer bases than us. We believe that competition will be particularly intense in the solid-state, fiber, CO2 and diode laser markets, as many companies have committed significant research and development resources to pursue opportunities in these markets. There can be no assurance that we will successfully differentiate our current and proposed products from the products of our competitors or that the marketplace will consider our products to be superior to competing products. Because many of the components required to develop and produce a laser-based marking system are commercially available, barriers to entry into this market are relatively low, and we expect new competitive product entries in this market. To maintain our competitive position in these markets, we believe that we will be required to continue a high level of investment in engineering, research and development, marketing, and customer service and support. There can be no assurance that we will have sufficient resources to continue to make these investments, that we will be able to make the technological advances necessary to maintain our competitive position, or that our products will receive market acceptance. See also “Business - Competition”.
OUR FUTURE GROWTH AND COMPETITIVENESS DEPEND UPON OUR ABILITY TO DEVELOP NEW AND ENHANCED PRODUCTS TO MEET MARKET DEMAND AND TO INCREASE OUR MARKET SHARE FOR LASER MACRO AND MARKING AND MICRO PRODUCTS. If we are to increase our laser sales in the near term, these sales will have to come through increases in market share for our existing products, through the development of new products, or through the acquisition of competitors or their products. To date, a substantial portion of our revenues has been derived from sales of high-powered solid-state lasers, fiber lasers, CO2 laser sources and diode lasers. In order to increase market demand for these products, we will need to devote substantial resources to:
• continuing to broaden our fiber, solid-sate, CO2 and diode laser product range;
• continuing to increase the output power and vary the laser wavelengths of our product portfolio; and
• continuing to reduce the manufacturing costs of our product range to achieve more attractive pricing. A large part of our growth strategy depends upon being able to increase our worldwide market share for laser macro, marking and micro products.
Our future success depends on our ability to anticipate our customers’ needs and develop products that address those needs. Our ability to control costs is limited by our need to invest in research and development. If we are unable to implement our strategy to develop new and enhanced products, our business, operating results and financial condition could be adversely affected. We cannot provide assurance that we will successfully implement our business strategy or that any of the newly developed or enhanced products will achieve market acceptance or not be rendered obsolete or uncompetitive by products of other companies. See also “Management’s Discussion and Analysis of Financial Condition and Results of Operations” and “Business - The Company’s Laser Products”.
WE DEPEND ON OUR EXECUTIVE MANAGEMENT TEAM AND SKILLED PERSONNEL TO OPERATE OUR BUSINESS EFFECTIVELY IN A RAPIDLY CHANGING MARKET, AND IF WE ARE UNABLE TO RETAIN EXISTING OR HIRE ADDITIONAL PERSONNEL WHEN NEEDED, OUR ABILITY TO DEVELOP AND SELL OUR PRODUCTS COULD BE HARMED. Our future success depends in large part upon the leadership and performance of our executive management team and key employees at the operating level. These key employees include engineering, sales, marketing, manufacturing and support

28
personnel for our operations on a worldwide basis. Recruiting and retaining highly skilled personnel in certain functions continues to be difficult. At certain locations where we operate, the cost of living is extremely high and it may be difficult to retain key employees and management at a reasonable cost. We may not be successful in attracting, assimilating or retaining qualified personnel to fulfill our current or future needs. If we fail to attract additional employees or lose the services of one or more of our executive officers or key employees, or if one or more of them decide to join a competitor or otherwise compete directly or indirectly with us, we may not be able to successfully manage our business or achieve our business objectives. If we lose the services of any of our key employees at the operating or regional level, we may not be able to replace them with similarly qualified personnel, which could harm our business.
RECENT CHANGES IN OUR EXECUTIVE AND SENIOR MANAGEMENT TEAM MAY BE DISRUPTIVE TO, OR CAUSE UNCERTAINTY IN, OUR BUSINESS, RESULTS OF OPERATIONS, FINANCIAL CONDITION AND THE MARKET PRICE OF OUR COMMON STOCK.
Effective on July 1, 2015, Thomas Merk succeeded Günther Braun as President and Chief Executive Officer of the Company, and at the same time Mr. Merk replaced Mr. Braun as a member of the Board of Directors. In addition to these changes, we have also recently implemented a broader senior management team. These changes in our executive and senior management team may be disruptive to, or cause uncertainty in, our business. In addition, the departure of Mr. Braun, and the failure to ensure a smooth transition and effective transfer of knowledge involving senior employees, could hinder our strategic planning and execution. Any such disruption or uncertainty could have an adverse impact on our results of operations, financial condition and the market price of our common stock.
WE MAY NOT BE ABLE TO SUCCESSFULLY ACQUIRE NEW OPERATIONS OR INTEGRATE FUTURE ACQUISITIONS, WHICH COULD CAUSE OUR BUSINESS TO SUFFER. An important part of our growth strategy is making strategic acquisitions of companies with complementary operations, technologies or products. We regularly review potential acquisitions and periodically engage in discussions regarding such possible acquisitions. We may be unable to successfully complete potential strategic acquisitions if we cannot reach agreement on acceptable terms or for other reasons. Future acquisitions may require us to obtain additional debt or equity financing, which may not be available on terms acceptable to us, if at all. In connection with future acquisitions, we may assume the liabilities of the companies we acquire. Any debt that we incur to pay for future acquisition could contain covenants that restrict the manner in which we operate our business. Any new equity securities that we issue for this purpose would be dilutive to our existing stockholders. If we buy a company or a division of a company, we may experience difficulty integrating that company or division’s personnel and operations, which could negatively affect our operating results. In addition:
• the key personnel of the acquired company may decide not to work for us;
• we may experience additional financial and accounting challenges and complexities in areas such as tax planning, treasury management and financial reporting;
• we may be held liable for risks and liabilities (including for environmental-related costs) as a result of our acquisitions, some of which we may not discover during our due diligence;
• our ongoing business may be disrupted or receive insufficient management attention; and
• we may not be able to realize the synergies, cost savings or other financial benefits we anticipated.
PRODUCTION DIFFICULTIES AND PRODUCT DELIVERY DELAYS OR DISRUPTIONS COULD HAVE A MATERIAL ADVERSE EFFECT ON OUR BUSINESS.
We manufacture and test our products at our facilities in Germany, the United States, the United Kingdom, China, Finland, Sweden, Switzerland and Singapore. If use of any of our manufacturing facilities were interrupted by a natural disaster or otherwise, our operations would be negatively impacted until we could establish alternative production and service operations. Significant production difficulties could be the result of:
29
• mistakes made while transferring manufacturing processes between locations;
• changing process technologies;
• ramping production;
• installing new equipment at our manufacturing facilities; and
• shortage of key components. In addition, we may experience product delivery delays in the future. A significant disruption in third-party package delivery and import/export services, or significant increases in prices for those services, could interfere with our ability to ship products, increase our costs and lower our profitability.
We ship a significant portion of our products to our customers through independent package delivery and import/export companies. We also ship our products through national trucking firms, overnight carrier services and local delivery practices. If one or more of the package delivery or import/export providers experiences a significant disruption in services or institutes a significant price increase, the delivery of our products could be prevented or delayed. Such events could cause us to incur increased shipping costs that could not be passed on to our customers, negatively impacting our profitability and our relationships with certain customers.
THE ANNOUNCEMENT OF AND ANY FAILURE TO SUCCESSFULLY IMPLEMENT PROFITABILITY ENHANCEMENT PROGRAMS AND COST REDUCTIONS COULD ADVERSELY AFFECT OUR BUSINESS.
From time to time, we have implemented various profitability enhancement and cost reduction initiatives, including the efficiency and cost reduction programs that we announced in the second quarter of fiscal year 2015. These initiatives include evaluating the manufacturing of some products in lower cost regions, the consolidation of various facilities and operations, transitioning higher-cost external supply to internal manufacturing, working with our material suppliers to further lower costs, evaluation the appropriate business staffing levels and streamlining our overhead.
We cannot be sure that our cost reduction initiatives will be successfully or timely implemented, or that they will materially and positively impact our profitability. The cost reductions could adversely impact productivity and sales to an extent we have not anticipated. Even if we fully execute and implement these activities and they generate the anticipated cost savings, there may be other unforeseeable and unintended factors or consequences that could adversely impact our profitability and business.
IF WE FAIL TO ACCURATELY FORECAST COMPONENT AND MATERIAL REQUIREMENTS FOR OUR PRODUCTS, WE COULD INCUR ADDITIONAL COSTS AND INCUR SIGNIFICANT DELAYS IN SHIPMENTS, WHICH COULD RESULT IN A LOSS OF CUSTOMERS. We use rolling forecasts based on anticipated product orders and material requirements planning systems to determine our product requirements. It is very important that we accurately predict both the demand for our products and the lead times required to obtain the necessary components and materials. We depend on our suppliers for most of our product components and materials. Lead times for components and materials that we order vary significantly and depend on factors including the specific supplier requirements, the size of the order, contract terms, and current market demand for components. For substantial increases in our sales levels of certain products, some of our suppliers may need at least a nine-month lead time. If we over estimate our component and material requirements, we may have excess inventory, which would increase our costs. If we underestimate our component and material requirements, we may have inadequate inventory, which could interrupt and delay delivery of our products to our customers. Any of these occurrences would negatively impact our net sales, business, or operating results.
WE DEPEND ON LIMITED SOURCE SUPPLIERS THAT COULD CAUSE SUBSTANTIAL MANUFACTURING DELAYS AND INCREASE OUR COSTS IF A DISRUPTION IN SUPPLY OCCURS. We estimate that 8% of our revenues in fiscal 2015 were derived from sales of products that require specialized components only available from single sources. We also rely on a limited number of independent contractors to manufacture subassemblies

30
for some of our products. There can be no assurance that, in the future, our current or alternative sources will be able to meet all of our demands on a timely basis. If one or more of our suppliers or subcontractors experiences difficulties that result in a reduction or interruption in supply to us, or if they fail to meet any of our manufacturing requirements, our business could be harmed until we are able to secure alternative sources, if any. If we are unable to find necessary parts or components on commercially reasonable terms, we could be required to reengineer our products to accommodate available substitutions which could increase our costs and/or have a material adverse effect on manufacturing schedules, product performance and market acceptance. The manufacturing of our solid-state lasers require elements of rare earth in small quantities. Shortages of these elements, delays in their delivery and resulting increases of the market price for such materials might have an adverse effect on our production costs.
IF OUR GOODWILL OR OTHER INTANGIBLE ASSETS BECOME IMPAIRED, WE MAY BE REQUIRED TO RECORD A SIGNIFICANT CHARGE TO EARNINGS. Under accounting principles generally accepted in the United States, we review our intangible assets, subject to amortization, for impairment when events or changes in circumstances indicate the carrying value may not be recoverable. Goodwill is required to be tested for impairment at least annually. Factors that may be considered a change in circumstances indicating that the carrying value of our goodwill or other intangible assets may not be recoverable include declines in our stock price and market capitalization or future cash flow projections. A decline in our stock price, or any other adverse change in market conditions, particularly if such change has the effect of changing one of the critical assumptions or estimates we used to calculate the estimated fair value of our reporting units, could result in a change to the estimation of fair value that could result in an impairment charge. Any such material charges, whether related to goodwill or purchased intangible assets, may have a material negative impact on our financial and operating results.
WE COULD BE NEGATIVELY AFFECTED AS A RESULT OF A PROXY FIGHT.
In October 2015, we received notice from SilverArrow Capital Advisors LLP, SilverArrow Capital Holding Ltd., SAC Jupiter Holding Ltd., Pluto Fund Limited, Thomas Limberger, Robert Schimanko, Abdullah Saleh A. Kamel, Osama H. Al Sayed and Ernesto Palomba (collectively “SliverArrow”) (which reports that it owns over 9% of our common stock) declaring its intention to nominate three new independent directors at the Company’s 2016 annual meeting of stockholders. A proxy contest could negatively affect us because: responding to proxy contests, litigation and other actions by dissident shareholders can be costly and time-consuming, disrupting our operations and diverting the attention of management and our employees; perceived uncertainties as to our future direction may divert the attention of, damage morale and create instability among our business partners, management, and employees and adversely impact our existing and potential strategic and operational relationships and opportunities; we may experience difficulties in hiring, retaining and motivating personnel during the resulting uncertain and turbulent times; if individuals are elected to our Board with a specific agenda, it may adversely affect our ability to effectively and timely implement our current business plan which could have a material adverse effect on our results of operations and financial condition; increases in legal fees, administrative and associated costs incurred in connection with responding to a proxy contest and related litigation could be substantial; and a proxy contest, or the threat of one, could cause our stock price to experience periods of volatility or stagnation.
WE ARE EXPOSED TO LAWSUITS IN THE NORMAL COURSE OF BUSINESS WHICH COULD HAVE A MATERIAL ADVERSE EFFECT ON OUR BUSINESS, OPERATING RESULTS, OR FINANCIAL CONDITION. We are exposed to lawsuits in the normal course of our business, including product liability claims, if personal injury, death or commercial losses occur from the use of our products. While we typically maintain business insurance, including directors' and officers' policies, litigation can be expensive, lengthy and disruptive to normal business operations, including the potential impact of indemnification obligations for individuals named in any such lawsuits. We may not, however, be able to secure insurance coverage on terms acceptable to us in the future. Moreover, the results of complex legal proceedings are difficult to predict. An unfavorable resolution of a particular lawsuit, including a recall or redesign of products if ultimately determined to be defective, could have a material adverse effect on our business, operating results or financial condition.
ANY DEFECTS IN OUR PRODUCTS OR CUSTOMER PROBLEMS ARISING FROM THE USE OF OUR PRODUCTS MAY SERIOUSLY HARM OUR BUSINESS AND REPUTATION.

31
Our laser products are technologically complex and may contain both known and undetected errors or performance problems. In addition, performance problems can also be caused by the improper installation or use of our products by a customer. These errors or performance problems could result in customer dissatisfaction, which could harm our sales or customer relationships. In addition, these problems may cause us to incur significant warranty and repair costs and divert the attention of our engineering personnel from our product development efforts.
THE LONG SALES CYCLES FOR OUR PRODUCTS MAY CAUSE US TO INCUR SIGNIFICANT EXPENSES WITHOUT OFFSETTING REVENUES. Customers often view the purchase of our products as a significant and strategic decision. As a result, customers typically expend significant effort in evaluating, testing and qualifying our products before making a decision to purchase them, resulting in a lengthy initial sales cycle. While our customers are evaluating our products and before they place an order with us, we may incur substantial sales and marketing and research and development expenses to customize our products to the customer's needs. We may also expend significant management efforts, increase manufacturing capacity and order long lead-time components or materials prior to receiving an order. Even after this evaluation process, a potential customer may not purchase our products. As a result, these long sales cycles may cause us to incur significant expenses without ever receiving revenue to offset such expenses.
OUR FAILURE TO PROTECT OUR PROPRIETARY TECHNOLOGY OR TO AVOID LITIGATION FOR INFRINGEMENT OR MISAPPROPRIATION OF PROPRIETARY RIGHTS OF THIRD PARTIES COULD RESULT IN A LOSS OF REVENUES AND PROFITS. Our future success depends in part upon our intellectual property rights, including trade secrets, know-how and continuing technological innovation. There can be no assurance that the steps taken by us to protect our intellectual property rights will be adequate to prevent misappropriation or that others will not develop competitive technologies or products. We currently hold 262 United States and foreign patents on our laser sources and laser applications, with expiration dates ranging from 2015 to 2034. We have also obtained licenses under certain patents covering lasers and related technology incorporated into our products. In addition, 204 patent applications have been filed and are under review by the relevant patent authorities. There can be no assurance that other companies are not investigating or developing other technologies that are similar to ours, that any patents will issue from any application filed by us or that, if patents do issue, the claims allowed will be sufficiently broad to deter or prohibit others from marketing similar products. In addition, there can be no assurance that any patents issued to us will not be challenged, invalidated or circumvented, or that the rights thereunder will provide a competitive advantage to us. See also “Business - Intellectual Property”. From time to time, we receive notices from third parties alleging infringement of such parties’ patent or other proprietary rights by our products. While these notices are common in the laser industry and we have in the past been able to develop non-infringing technology or license necessary patents or technology on commercially reasonable terms, there can be no assurance that we would in the future prevail in any litigation seeking damages or expenses from us or to enjoin us from selling products on the basis of such alleged infringement, or that we would be able to develop any non-infringing technology or license any valid and infringed patents on commercially reasonable terms. In the event any third party made a valid claim against us or our customers and a license was not made available to us on commercially reasonable terms, we would be adversely affected.
CHANGES IN GOVERNMENTAL REGULATION OF OUR BUSINESS OR OUR PRODUCTS COULD REDUCE DEMAND FOR OUR PRODUCTS OR INCREASE OUR EXPENSES.
We are subject to many governmental regulations, including but not limited to the laser radiation safety regulations of the Radiation Control for Health and Safety Act administered by the National Center for Devices and Radiological Health, a branch of the United States Food and Drug Administration. Among other things, these regulations require us to file annual reports, to maintain quality control and sales records, to perform product testing, to distribute appropriate operating manuals, to conduct safety reviews, to incorporate design and operating features in products sold to end users, and to certify and label our products. We are also subject to regulatory oversight, including comparable enforcement remedies, in the markets we serve.
On August 22, 2012, the SEC adopted a new rule requiring disclosures by public companies of specified minerals, known as conflict minerals, that are necessary to the functionality or production of products manufactured or contracted to be

32
manufactured. The new rule, which went into effect for calendar year 2013 and requires annual disclosure reports to be filed with the SEC, requires companies to perform due diligence, disclose and report whether or not such minerals originate from the Democratic Republic of Congo or an adjoining country. The new rule could affect sourcing at competitive prices and availability in sufficient quantities of certain minerals used in the manufacture of our products, including tin, tungsten, tantalum and/or gold. The number of suppliers who provide conflict-free minerals may be limited. In addition, there may be material costs associated with complying with the disclosure requirements, such as costs related to the due diligence process of determining the source of certain minerals used in our products, as well as costs of possible changes to products, processes or sources of supply as a consequence of such verification activities. As our supply chain is complex, we may not be able to sufficiently verify the origins of the relevant minerals used in our products through the due diligence procedures that we implement, which may harm our reputation. We may also encounter challenges to satisfy those customers who require that all of the components of our products be certified as conflict-free, which could place us at a competitive disadvantage if we are unable to do so.
Any significant change in the regulations described in the paragraphs above could reduce demand for our products or increase our expenses, which in turn could adversely affect our business, financial condition, results of operations and cash flows.
CHANGES IN TAX RATES, TAX LIABILITIES OR TAX ACCOUNTING RULES COULD AFFECT FUTURE RESULTS. As a global company, we are subject to taxation in the United States and various other countries and jurisdictions in which we do business. Significant judgment is required to determine our worldwide tax liabilities. Our future tax rates could be affected by changes in the composition of earnings in countries with differing tax rates, changes in the valuation of our deferred tax assets and liabilities or changes in the tax laws in the jurisdictions in which we do business. In addition, we are subject to regular examination of the income tax returns that we and our subsidiaries file by the Internal Revenue Service and other tax authorities. We regularly assess the likelihood of favorable or unfavorable outcomes resulting from these examinations to determine the adequacy of our provision for income taxes. Although we believe our tax estimates are reasonable, there can be no assurance that any final determination will not be materially different than the treatment reflected in our historical income tax provisions and accruals, which could materially and adversely affect our operating results and financial condition.
IF WE EXPERIENCE A SIGNIFICANT DISRUPTION IN, OR BREACH IN SECURITY OF, OUR INFORMATION TECHNOLOGY SYSTEMS, OUR BUSINESS MAY BE ADVERSELY AFFECTED.
We rely on information technology systems throughout our Company to manage orders, process shipments to customers, manage inventory levels and maintain financial information. Events could result in the disruption of our systems, including power outages, computer attacks by hackers, viruses, catastrophes, hardware and software failures, and other unforeseen events. If we were to experience a significant period of system disruption in information technology systems that involve our interactions with customers or suppliers, it could result in the loss of sales and customers and significant incremental costs, which could adversely affect our business. In addition, security breaches of our information technology systems could result in the misappropriation or unauthorized disclosure of confidential information belonging to us or to our employees, partners, customers or suppliers, which could result in our suffering significant financial or reputational damage.
ITEM 1B. UNRESOLVED STAFF COMMENTS None.
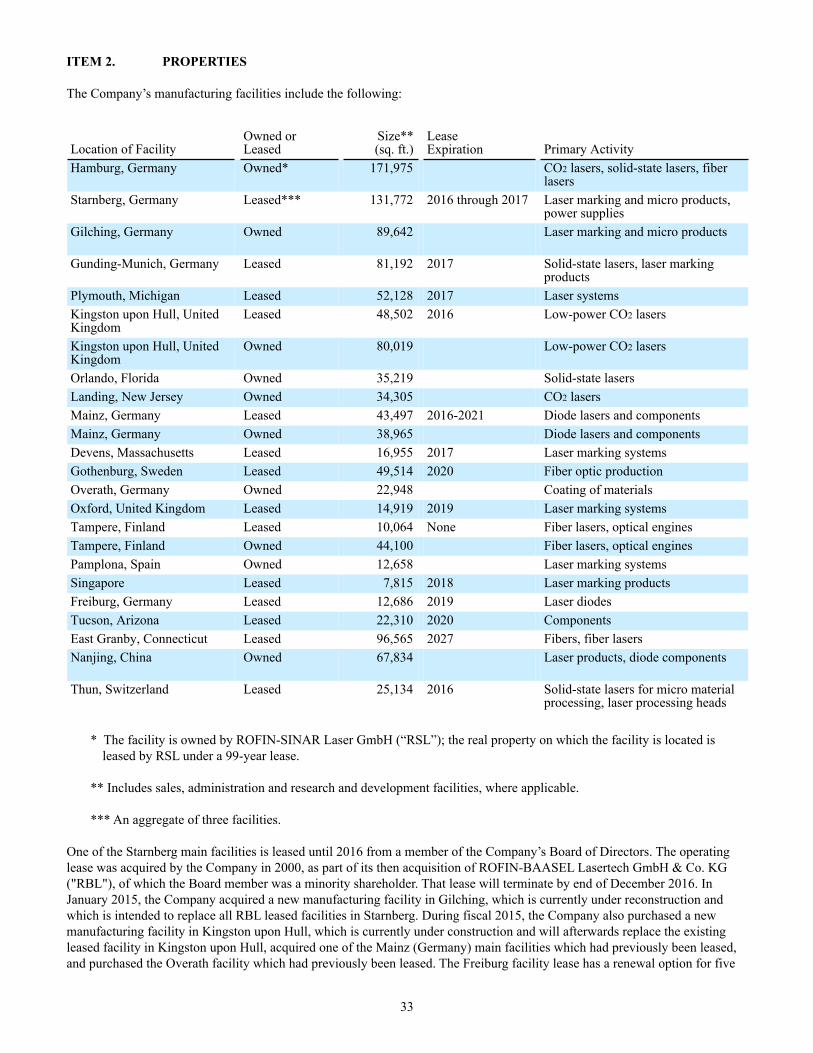
33
ITEM 2. PROPERTIES The Company’s manufacturing facilities include the following:
Location of FacilityOwned orLeased
Size**(sq. ft.)
LeaseExpiration Primary Activity
Hamburg, Germany Owned* 171,975
CO2 lasers, solid-state lasers, fiber lasers
Starnberg, Germany Leased*** 131,772 2016 through 2017 Laser marking and micro products,power supplies
Gilching, Germany Owned 89,642 Laser marking and micro products
Gunding-Munich, Germany Leased 81,192 2017 Solid-state lasers, laser markingproducts
Plymouth, Michigan Leased 52,128 2017 Laser systemsKingston upon Hull, UnitedKingdom
Leased 48,502 2016 Low-power CO2 lasers
Kingston upon Hull, UnitedKingdom
Owned 80,019 Low-power CO2 lasers
Orlando, Florida Owned 35,219 Solid-state lasersLanding, New Jersey Owned 34,305 CO2 lasersMainz, Germany Leased 43,497 2016-2021 Diode lasers and componentsMainz, Germany Owned 38,965 Diode lasers and componentsDevens, Massachusetts Leased 16,955 2017 Laser marking systemsGothenburg, Sweden Leased 49,514 2020 Fiber optic productionOverath, Germany Owned 22,948 Coating of materialsOxford, United Kingdom Leased 14,919 2019 Laser marking systemsTampere, Finland Leased 10,064 None Fiber lasers, optical enginesTampere, Finland Owned 44,100 Fiber lasers, optical enginesPamplona, Spain Owned 12,658 Laser marking systemsSingapore Leased 7,815 2018 Laser marking productsFreiburg, Germany Leased 12,686 2019 Laser diodesTucson, Arizona Leased 22,310 2020 ComponentsEast Granby, Connecticut Leased 96,565 2027 Fibers, fiber lasersNanjing, China Owned 67,834 Laser products, diode components
Thun, Switzerland Leased 25,134 2016 Solid-state lasers for micro materialprocessing, laser processing heads
* The facility is owned by ROFIN-SINAR Laser GmbH (“RSL”); the real property on which the facility is located is leased by RSL under a 99-year lease.
** Includes sales, administration and research and development facilities, where applicable.
*** An aggregate of three facilities. One of the Starnberg main facilities is leased until 2016 from a member of the Company’s Board of Directors. The operating lease was acquired by the Company in 2000, as part of its then acquisition of ROFIN-BAASEL Lasertech GmbH & Co. KG ("RBL"), of which the Board member was a minority shareholder. That lease will terminate by end of December 2016. In January 2015, the Company acquired a new manufacturing facility in Gilching, which is currently under reconstruction and which is intended to replace all RBL leased facilities in Starnberg. During fiscal 2015, the Company also purchased a new manufacturing facility in Kingston upon Hull, which is currently under construction and will afterwards replace the existing leased facility in Kingston upon Hull, acquired one of the Mainz (Germany) main facilities which had previously been leased, and purchased the Overath facility which had previously been leased. The Freiburg facility lease has a renewal option for five

34
years. The Tampere facility lease can be terminated upon six-month notice from the landlord and the lessee. The Gothenburg facility has a renewal option for three years. The Company maintains sales, administration, and research and development facilities at each of the Hamburg, Starnberg, Gunding-Munich, Mainz, Freiburg, Kingston upon Hull, Gothenburg, Tampere, East Granby, Plymouth, Landing, Orlando, Thun, and Nanjing locations. The Company also maintains sales and service offices worldwide, all of which are leased, with the exception of the Pamplona (Spain) and Seoul (South Korea) properties which are owned. The Company believes that its existing facilities are adequate to meet its currently projected needs for the next 12 months and that suitable additional or alternative space would be available, if necessary, in the future on commercially reasonable terms.
ITEM 3. LEGAL PROCEEDINGS The Company has been and is likely to be involved from time to time in litigation involving its intellectual property and ordinary routine litigation arising in the ordinary course of business. A licensor of patents that, before their expiration in 2010, covered the technology used in certain of the Company's CO2 lasers has asserted that the Company has calculated royalties due in respect of certain sales of such CO2 lasers in a manner that is not consistent with the applicable license agreement. In addition, the licensor claims that it has not been provided with copies of invoices and other documentation relating to such sales, to which it asserts it is entitled under the license agreement. The Company disputes these and related allegations and believes that it is in compliance with all of its obligations under the license agreement. The patents, and therefore the license rights, have already expired and there are no further license fees to be calculated and paid. Accordingly, management believes that the resolution of this matter will not have a material adverse impact on the Company's financial condition, results of operations or cash flows.
ITEM 4. MINE SAFETY DISCLOSURES
Not applicable.
35
PART II ITEM 5. MARKET FOR REGISTRANT'S COMMON EQUITY, RELATED STOCKHOLDER MATTERS
AND ISSUER PURCHASES OF EQUITY SECURITIES The Company’s common stock is traded on the NASDAQ Global Select Market and also on the Prime Standard Segment of the Frankfurt Stock Exchange, under the symbol RSTI and international securities identification number (ISIN) US7750431022, respectively. The table below sets forth the high and low closing sales prices of the Company’s common stock for each quarter ended during the last two fiscal years as reported by NASDAQ:
Common Stock Trade PricesQuarter ended High LowDecember 31, 2013 $ 27.02 $ 23.05March 31, 2014 $ 26.38 $ 21.28June 30, 2014 $ 24.66 $ 21.81September 30, 2014 $ 24.42 $ 21.79December 31, 2014 $ 30.16 $ 20.78March 31, 2015 $ 28.46 $ 23.39June 30, 2015 $ 29.40 $ 23.55September 30, 2015 $ 27.44 $ 23.43
At November 25, 2015, the Company had six holders of record of its common stock and 28,360,103 shares outstanding. A significantly greater number of holders of the Company’s common stock are “street name” or beneficial holders, whose shares are held of record by bankers, brokers, and other financial institutions. The Company has not paid dividends on its common stock and does not anticipate paying dividends in the foreseeable future. During fiscal year 2015, the Company did not sell any equity securities that were not registered under the Securities Act. There were no purchases of common stock of the Company made by the Company or any “affiliated purchaser” of the Company as defined in Rule 10b-18(a)(3) under the Exchange Act during the fourth fiscal quarter of fiscal year 2015.
On November 11, 2015, the Board of Directors authorized the Company to initiate another share buyback of up to $50 million of the Company's Common Stock over the next eighteen months. The Company expects the purchases to be made from time to time in the open market or in privately negotiated transactions at the Company’s discretion.
STOCK PRICE PERFORMANCE GRAPH The following Stock Price Performance Graph includes comparisons required by the SEC. The Graph does not constitute soliciting material and should not be deemed filed or incorporated by reference into any other Company filings under the Securities Act of 1933, as amended, or the Securities Exchange Act of 1934, as amended, except to the extent that the Company specifically incorporates this information by reference therein. The following graph presents the one-year total return for ROFIN-SINAR Technologies Inc. common stock compared with the NASDAQ Stock Market Index and the S&P Technology Sector Index. ROFIN-SINAR selected these comparative groups due to industry similarities and the fact that they contain several direct competitors.
The graph assumes that the value of the investment in ROFIN-SINAR Technologies Inc. common stock, the NASDAQ Stock Market Index, and the S&P Technology Sector Index each was $100 on September 30, 2010, and that all dividends were reinvested. The S&P Technology Sector Index is weighted by market capitalization.
The stock price performance shown in this graph is not necessarily indicative of, and not intended to suggest future stock price performance.

36
EDGAR REPRESENTATION OF DATA POINTS USED IN PRINTED GRAPHIC
ROFIN-SINAR
Technologies Inc.NASDAQ Stock
Market IndexS&P Technology
Sector Index9/30/2010 100 100 1009/30/2011 75.65 103.65 103.839/30/2012 77.74 136.22 137.499/30/2013 95.39 168.91 146.999/30/2014 90.86 202.57 190.019/30/2015 102.17 208.69 194.03

37
ITEM 6. SELECTED FINANCIAL DATA The following table sets forth selected consolidated financial data for the past five fiscal years. The information set forth below should be read in conjunction with the consolidated financial statements and notes and “Management’s Discussion and Analysis of Financial Condition and Results of Operations” contained elsewhere in this Annual Report on Form 10-K.
Year ended September 30, 2015 2014 2013 2012 2011
STATEMENT OF OPERATIONS DATA:Net sales $ 519,643 $ 530,117 $ 560,068 $ 540,121 $ 597,763Cost of goods sold 323,165 341,202 363,559 343,769 365,684Gross profit 196,478 188,915 196,509 196,352 232,079Selling, general & administrative expenses 97,405 106,051 101,726 101,088 107,510Research & development expenses 39,987 45,900 43,014 42,604 38,337Amortization expense 3,057 2,906 2,553 2,279 2,569Income from operations 56,029 34,058 49,216 50,381 83,663Net interest expense (income) (9) 234 54 (11) (135)Income before income taxes 56,968 36,680 49,155 52,392 87,143Income tax expense 15,747 11,528 14,139 17,180 26,070Net income attributable to RSTI 41,258 25,168 34,755 34,530 60,032Earnings per common share
attributable to RSTI– Basic $ 1.47 $ 0.90 $ 1.23 $ 1.21 $ 2.11Earnings per common share
attributable to RSTI– Diluted $ 1.46 $ 0.89 $ 1.22 $ 1.20 $ 2.06Shares used in computing earnings
per share – Basic 28,128 28,073 28,189 28,498 28,440Shares used in computing earnings
per share – Diluted 28,271 28,222 28,392 28,744 29,105
OPERATING DATA (as percentage of sales): Gross profit 37.8% 35.6% 35.1% 36.4% 38.8%Selling, general & administrative expenses 18.7% 20.0% 18.2% 18.7% 18.0%Research & development expenses 7.7% 8.7% 7.7% 7.9% 6.4%Income from operations 10.8% 6.4% 8.8% 9.3% 14.0%Income before income taxes 11.0% 6.9% 8.8% 9.7% 14.6%
BALANCE SHEET DATA: Working capital $ 378,958 $ 374,022 $ 372,778 $ 318,827 $ 333,328Total assets 706,491 688,585 699,910 652,532 653,946Line of credit and loans 23,311 14,766 18,622 22,545 22,863Long-term debt 18,085 11,511 14,913 5,662 14,742Total equity 542,609 538,709 543,418 493,919 478,617

38
ITEM 7. MANAGEMENT'S DISCUSSION AND ANALYSIS OF FINANCIAL CONDITION AND RESULTS OF OPERATIONS OVERVIEW ROFIN-SINAR Technologies is a leader in the design, development, engineering, manufacturing and marketing of laser sources and laser-based system solutions for industrial material processing applications, which include primarily cutting, welding and marking a wide range of materials. The Company's product portfolio ranges from single laser-beam sources to highly complex systems, covering all of the key laser technologies such as solid-state, fiber, ultrashort pulse, diode and CO2 lasers and the entire power spectrum, from single-digit watts up to multi-kilowatts, as well as a comprehensive spectrum of wavelengths. An extensive range of laser components completes the product portfolio. Lasers are a non-contact technology for material processing, which have several advantages compared to conventional manufacturing tools that are desirable in industrial applications. The Company's lasers all deliver a high-quality beam at guaranteed power outputs and feature compact designs, high processing speeds, flexibility, low operating and maintenance costs, and easy integration into the customer's production process thus meeting a broad range of its customers' material processing requirements.
According to the Industrial Laser Solutions magazine's 2015 industry forecast published in January 2015, worldwide laser revenues for industrial material processing applications, which are ROFIN’s primary addressed markets, are expected to reach approximately $2.8 billion. The Company has sold more than 75,000 laser sources since 1975 and currently has over 4,000 active customers (including multinational companies with multiple facilities purchasing from the Company). During fiscal 2015, 2014 and 2013, approximately 38%, 40% and 38%, respectively, of the Company’s revenues related to sales of laser products for macro applications, approximately 47%, 47% and 49% respectively, related to sales of laser products for marking and micro applications, and approximately 15%, 13% and 13%, respectively, related to sales of components.
Through its global manufacturing, distribution and service network, the Company provides a comprehensive range of laser sources and laser-based system solutions to the following principal target markets: the machine tool, automotive, semiconductor, electronics, and photovoltaic industries. The Company sells directly to end users and to original equipment manufacturers (“OEMs”) that integrate ROFIN’s laser sources with other system components. Many of ROFIN’s customers are among the largest global participants in their respective industries. During fiscal 2015, 2014, and 2013, 21%, 19% and 20%, respectively, of the Company’s sales were in North America, 45%, 49% and 45%, respectively, were in Europe, and 34%, 32% and 35%, respectively, were in Asia. The results of the fiscal year ended September 30, 2015, were characterized by traditional seasonality in the first half of the year. The second half of the fiscal year 2015 resulted in a recovery of the Asian markets, especially in China. In terms of overall business development, we had a stable business for CO2 laser technology and a far above average growing business with our high-power fiber and ultrashort pulsed laser technologies. For the latter, we experienced especially high interest for our proprietary filament cutting technology of brittle materials. During fiscal year 2015, we were able to significantly improve our profitability, mainly as a result of an optimized cost structure in the manufacture of our high-power fiber lasers, a better fixed cost absorption and positive effects of our efficiency and cost reduction programs.
Outlook
We continue to target high growth rates in our high-power fiber laser sales in fiscal year 2016. Our 3rd generation high-power fiber laser business is progressing very well as we continue our efforts to further reduce the manufacturing costs of this product. In our second growth area, the ultrashort pulse lasers, we are also gaining momentum. In this segment, we see significant future growth in the medical device, automotive, consumer electronics and photovoltaic industries. With our efficiency and cost reduction programs that we announced in the second quarter of fiscal year 2015, we continue to proactively target further cost control, while actively promoting sales and development in key areas and markets. Coupling these initiatives on the cost side with our strong product portfolio, we feel well-positioned for a successful fiscal year 2016. Acquisitions and Formation of New Entities Effective August 24, 2011, the Company formed ROFIN BAASEL Laser India Pvt. Ltd. in Mumbai (India) as a wholly-owned subsidiary through its wholly-owned subsidiaries ROFIN-SINAR Laser GmbH (99%) and ROFIN-BAASEL Lasertech GmbH & Co KG (1%). It started its operations in October 2011 and is responsible for sales and service of ROFIN laser products in India.

39
On each of October 26, 2011, and March 12, 2012, the Company purchased an additional 5% of the share capital, and on November 18, 2013, the Company purchased the remaining 10% of the share capital of m2k-laser GmbH through ROFIN-SINAR Laser GmbH under an option agreement between the Company and the minority shareholders of m2k-laser GmbH. As a result of those share purchases, the Company currently holds 100% of the share capital of m2k-laser GmbH.
Effective March 28, 2007, the Company acquired 100% of the common stock of Corelase Oy, Tampere (Finland). Corelase Oy has considerable experience in semiconductors, optics, and fiber technology. Its product lines include ultrashort pulse, mode-locked fiber laser systems, fiber laser modules, and other components. The terms of the purchase included payment of a deferred purchase price based on Corelase Oy achieving certain financial targets. On December 14, 2011, the Company finalized and paid the deferred purchase price. This payment resulted in additional goodwill of $13.4 million.
Effective September 29, 2011, the Company received the remaining 15% of the share capital of H2B Photonics GmbH (“H2B“) through a transfer of shares and now holds 100% of the share capital. In May 2012, the Company merged its wholly-owned subsidiary PMB Elektronik GmbH with H2B and named the newly formed subsidiary PMB Elektronik GmbH.
Effective December 20, 2012, the Company acquired the remaining 20% of the common stock of ROFIN-BAASEL China Co., Ltd. through its wholly-owned subsidiary RSL. The Company currently holds 100% of the share capital of ROFIN-BAASEL China Co., Ltd.
Effective January 8, 2013, the Company acquired the remaining 20% of the common stock of Nanjing Eastern Technologies Company, Ltd. The Company currently holds 100% of the share capital of Nanjing Eastern Technologies Company, Ltd.
Effective December 20, 2013, the Company acquired the remaining 12% of the common stock of ROFIN-BAASEL Japan Corp. through its wholly-owned subsidiary ROFIN-SINAR Laser GmbH. The Company currently holds 100% of the share capital of ROFIN-BAASEL Japan Corp.
On April 10, 2014, the Company completed the acquisition of certain assets of FiLaser USA LLC. ("FiLaser") and subsidiaries. The transaction contained all intellectual property including trademarks, know-how, patents and patent applications of FiLaser. FiLaser has developed advanced laser process technology used for precision cutting and drilling of brittle material including glass, sapphire and semiconductor substrates.
Effective June 12, 2014, the Company acquired the remaining 5% of the common stock of DILAS Diodenlaser GmbH through its wholly-owned subsidiary ROFIN-SINAR Technologies Europe S.L.U. The Company currently holds 100% of the share capital of DILAS Diodenlaser GmbH.
Effective December 23, 2014, the Company acquired an additional 8.8% of the common stock of Nanjing Eastern Laser Co., Ltd. The Company currently holds 88.8% of the share capital of Nanjing Eastern Laser Co., Ltd.
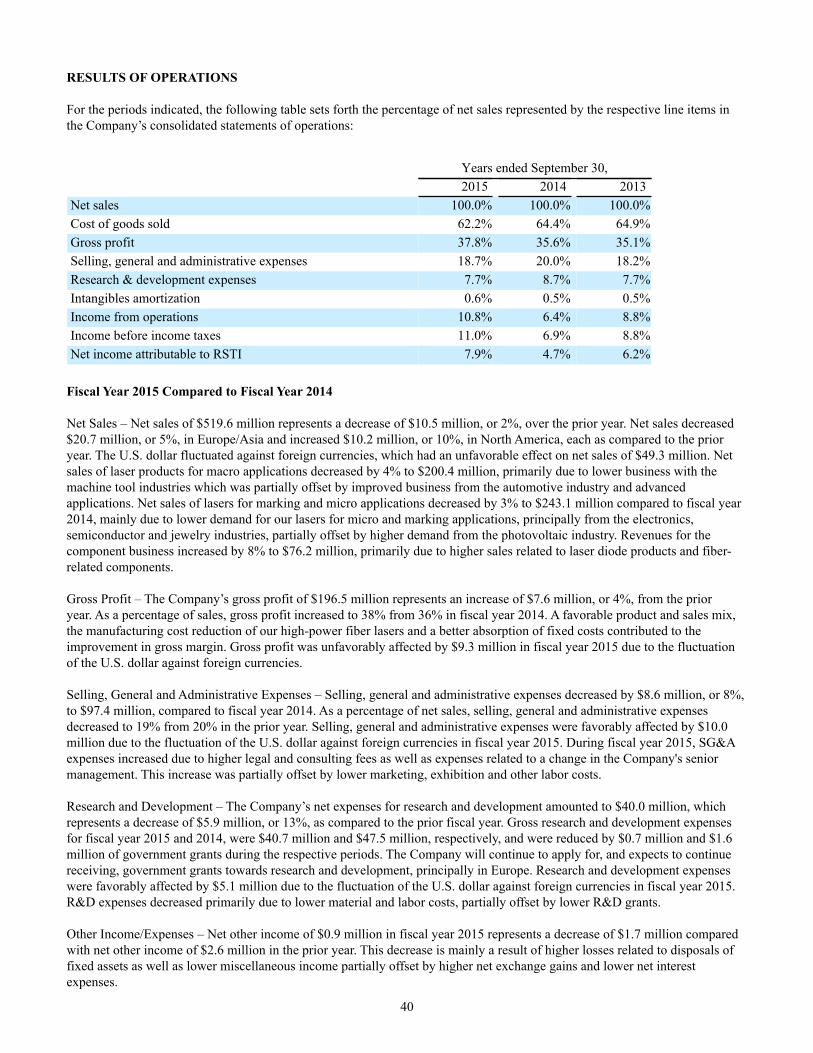
40
RESULTS OF OPERATIONS For the periods indicated, the following table sets forth the percentage of net sales represented by the respective line items in the Company’s consolidated statements of operations:
Years ended September 30, 2015 2014 2013Net sales 100.0% 100.0% 100.0%Cost of goods sold 62.2% 64.4% 64.9%Gross profit 37.8% 35.6% 35.1%Selling, general and administrative expenses 18.7% 20.0% 18.2%Research & development expenses 7.7% 8.7% 7.7%Intangibles amortization 0.6% 0.5% 0.5%Income from operations 10.8% 6.4% 8.8%Income before income taxes 11.0% 6.9% 8.8%Net income attributable to RSTI 7.9% 4.7% 6.2%
Fiscal Year 2015 Compared to Fiscal Year 2014 Net Sales – Net sales of $519.6 million represents a decrease of $10.5 million, or 2%, over the prior year. Net sales decreased $20.7 million, or 5%, in Europe/Asia and increased $10.2 million, or 10%, in North America, each as compared to the prior year. The U.S. dollar fluctuated against foreign currencies, which had an unfavorable effect on net sales of $49.3 million. Net sales of laser products for macro applications decreased by 4% to $200.4 million, primarily due to lower business with the machine tool industries which was partially offset by improved business from the automotive industry and advanced applications. Net sales of lasers for marking and micro applications decreased by 3% to $243.1 million compared to fiscal year 2014, mainly due to lower demand for our lasers for micro and marking applications, principally from the electronics, semiconductor and jewelry industries, partially offset by higher demand from the photovoltaic industry. Revenues for the component business increased by 8% to $76.2 million, primarily due to higher sales related to laser diode products and fiber-related components. Gross Profit – The Company’s gross profit of $196.5 million represents an increase of $7.6 million, or 4%, from the prior year. As a percentage of sales, gross profit increased to 38% from 36% in fiscal year 2014. A favorable product and sales mix, the manufacturing cost reduction of our high-power fiber lasers and a better absorption of fixed costs contributed to the improvement in gross margin. Gross profit was unfavorably affected by $9.3 million in fiscal year 2015 due to the fluctuation of the U.S. dollar against foreign currencies. Selling, General and Administrative Expenses – Selling, general and administrative expenses decreased by $8.6 million, or 8%, to $97.4 million, compared to fiscal year 2014. As a percentage of net sales, selling, general and administrative expenses decreased to 19% from 20% in the prior year. Selling, general and administrative expenses were favorably affected by $10.0 million due to the fluctuation of the U.S. dollar against foreign currencies in fiscal year 2015. During fiscal year 2015, SG&A expenses increased due to higher legal and consulting fees as well as expenses related to a change in the Company's senior management. This increase was partially offset by lower marketing, exhibition and other labor costs. Research and Development – The Company’s net expenses for research and development amounted to $40.0 million, which represents a decrease of $5.9 million, or 13%, as compared to the prior fiscal year. Gross research and development expenses for fiscal year 2015 and 2014, were $40.7 million and $47.5 million, respectively, and were reduced by $0.7 million and $1.6 million of government grants during the respective periods. The Company will continue to apply for, and expects to continue receiving, government grants towards research and development, principally in Europe. Research and development expenses were favorably affected by $5.1 million due to the fluctuation of the U.S. dollar against foreign currencies in fiscal year 2015. R&D expenses decreased primarily due to lower material and labor costs, partially offset by lower R&D grants.
Other Income/Expenses – Net other income of $0.9 million in fiscal year 2015 represents a decrease of $1.7 million compared with net other income of $2.6 million in the prior year. This decrease is mainly a result of higher losses related to disposals of fixed assets as well as lower miscellaneous income partially offset by higher net exchange gains and lower net interest expenses.

41
Income Tax Expense – Income tax expense of $15.7 million in fiscal year 2015 and $11.5 million in fiscal year 2014, represents effective tax rates of 27.6% and 31.4% for the respective periods. The lower effective income tax rate in fiscal year 2015 is primarily a result of the generation of taxable income in countries with lower tax rates and to a $1.9 million favorable effect of the fluctuation of the U.S. dollar against foreign currencies. Net Income Attributable to RSTI – As a result of the foregoing factors, net income attributable to RSTI of $41.3 million ($1.46 per diluted share, based on 28.3 million weighted average common shares outstanding) in fiscal year 2015 increased by $16.1 million over the prior year’s net income attributable to RSTI of $25.2 million ($0.89 per diluted share, based on 28.2 million weighted average common shares outstanding). Net income attributable to RSTI was favorably affected by $7.7 million in fiscal year 2015 due to the fluctuation of the U.S. dollar against foreign currencies.
Fiscal Year 2014 Compared to Fiscal Year 2013 Net Sales – Net sales of $530.1 million represents a decrease of $30.0 million, or 5%, over the prior year. Net sales decreased $17.0 million, or 4%, in Europe/Asia and decreased $12.9 million, or 11%, in North America, each as compared to the prior year. The U.S. dollar fluctuated against foreign currencies, which had a favorable effect on net sales of $8.6 million. Net sales of laser products for macro applications decreased by 2% to $209.6 million, primarily due to lower business with the machine tool industries and advanced application which was partially offset by improved business from the automotive industry. Net sales of lasers for marking and micro applications decreased by 8% to $250.2 million compared to fiscal year 2013. This was mainly due to lower demand for our lasers for micro and marking applications, principally from the electronics and photovoltaic industries, though this was partially offset by higher demand from the semiconductor and jewelry industries. Revenues for the component business decreased by 4% to $70.3 million, primarily due to lower sales related to laser diode products and fiber-related components. Gross Profit – The Company’s gross profit of $188.9 million represents a decrease of $7.6 million, or 4%, from the prior year. As a percentage of sales, gross profit increased to 36% from 35% in the prior year. The increased percentage margin in fiscal year 2014 was primarily a result of a favorable product mix and the continuing efforts of our manufacturing cost reduction program for high-power fiber lasers. Gross profit was favorably affected by $1.2 million in fiscal year 2014 due to the fluctuation of the U.S. dollar against foreign currencies. Selling, General and Administrative Expenses – Selling, general and administrative expenses increased by $4.3 million, or 4%, to $106.1 million, compared to fiscal year 2013, primarily as a result of one-time expenses associated with the expansion and modernization of production facilities as well as higher consulting fees and an increase in the allowance for bad debts. As a percentage of net sales, selling, general and administrative expenses increased to 20% from 18% in prior year. Selling, general and administrative expenses were unfavorably affected by $1.7 million due to the fluctuation of the U.S. dollar against foreign currencies in fiscal year 2014. Research and Development – The Company’s net expenses for research and development amounted to $45.9 million, which represents an increase of $2.9 million, or 7%, primarily due to a reduction of $0.9 million in R&D grants and higher expenses related to the intellectual property associated with the newly acquired FiLaser technology. Gross research and development expenses for fiscal year 2014 and 2013 were $47.5 million and $45.4 million, respectively, and were reduced by $1.6 million and $2.4 million of government grants during the respective periods. The Company will continue to apply for, and expects to continue receiving, government grants towards research and development, principally in Europe. Research and development expenses were unfavorably affected by $1.1 million due to the fluctuation of the U.S. dollar against foreign currencies in fiscal year 2014.
Other Income/Expense – Net other income of $2.6 million in fiscal year 2014 represents an increase of $2.7 million compared with net other expenses of $0.1 million in the prior year. This increase is a result of $1.0 million due to the partial forgiveness of a loan with the State of Connecticut related to investments and creation of new jobs and net exchange gains of $1.4 million in fiscal year 2014, compared to net exchange losses of $0.5 million in fiscal year 2013, offset by $0.2 million lower net interest income. Income Tax Expense – Income tax expense of $11.5 million in fiscal year 2014 and $14.1 million in fiscal year 2013, represents effective tax rates of 31.4% and 28.8% for the respective periods. The higher effective income tax rate in fiscal year 2014 is mainly a result of the generation of taxable income in countries with lower tax rates and because the research and development credit legislation has not been re-enacted in the U.S. Income tax expense, a significant portion of which is incurred in foreign currencies, was unfavorably affected by $0.2 million due to the fluctuation of the U.S. dollar against foreign currencies.

42
Net Income Attributable to RSTI – As a result of the foregoing factors, net income attributable to RSTI of $25.2 million ($0.89 per diluted share, based on 28.2 million weighted average common shares outstanding) in fiscal year 2014 decreased by $9.6 million over the prior year’s net income attributable to RSTI of $34.8 million ($1.22 per diluted share, based on $28.4 million weighted average common shares outstanding). Net income attributable to RSTI was unfavorably affected by $1.8 million in fiscal year 2014 due to the fluctuation of the U.S. dollar against foreign currencies.
LIQUIDITY AND CAPITAL RESOURCES Fiscal Year 2015 The Company’s primary sources of liquidity at September 30, 2015, were cash and cash equivalents of $169.7 million, short-term investments of $5.8 million and short-term credit lines of $63.7 million. As of September 30, 2015, $3.9 million was outstanding under the short-term lines of credit and $2.3 million was used for bank guarantees under these lines of credit, leaving $57.5 million available for borrowing under short-term lines of credit. In addition, the Company maintained credit lines specific to bank guarantees for $12.2 million, of which $4.7 million was used. Therefore, $65.0 million was unused and available under our short-term and bank guarantee lines of credit, in aggregate, at September 30, 2015. At September 30, 2015, the entire amount of our long-term lines of credit was fully drawn. The Company is subject to financial covenants under some of these facilities and lines of credit, which could restrict the Company from drawing money under them. At September 30, 2015, the Company was in compliance with these covenants. Cash and cash equivalents increased by $41.2 million during fiscal year 2015. Approximately $68.6 million in cash and cash equivalents were provided by operating activities, primarily as the result of the net income ($41.2 million), plus other non-cash items, principally depreciation and amortization ($16.2 million) and stock-based compensation expense ($4.2 million), as well as an increase in accrued liabilities and pension obligations ($13.0 million). Operating cash flow was negatively affected mainly by the increase in inventories ($7.4 million). Net cash used in investing activities totaled $26.9 million for the year ended September 30, 2015, and was primarily related to various additions to property and equipment ($34.0 million) and the purchase of short-term investments ($9.3 million), partly offset by the sale of short-term investments ($15.9 million). Net cash provided by financing activities totaled $11.7 million for the year ended September 30, 2015, and was primarily related to proceeds from the borrowings of debt ($34.3 million) and $2.1 million generated through issuance of new shares from the exercise of stock options, partly offset by repayments of loans ($23.4 million), payments of contingent acquisition-related obligations ($0.8 million) and payments to minority shareholders ($0.4 million).
The Company expects that its capital expenditures will be approximately $23 million in fiscal year 2016. Management believes that cash flows from operations, along with existing cash and cash equivalents and availability under the credit facilities and lines of credit, will provide adequate resources to meet the Company’s capital requirements and operational needs on both a current and a long-term basis.
As of September 30, 2015, $133.9 million of the total $175.6 million of cash, cash equivalents and short-term investments, was held by our non-US subsidiaries, with the balance of $41.7 million held by our US subsidiaries. As of that date, of the $23.3 million of the Company's indebtedness to banks, $2.8 million was owed by our US subsidiaries, and $20.5 million was owed by our non-US subsidiaries. We expect our existing domestic cash, cash equivalents and short-term investments, together with cash flows from operations to be sufficient to fund our domestic operating activities. In addition, the US Company has $20.0 million in available and unused lines of credit at September 30, 2015. Therefore, we do not intend, nor do we foresee a need, to repatriate foreign earnings that are considered to be indefinitely reinvested, and we do not believe there are any material implications for or restrictions on the liquidity of our domestic subsidiaries as a result of having a majority of our cash, cash equivalents, and short-term investments held by our foreign subsidiaries.
On November 11, 2015, the Board of Directors authorized the Company to initiate a share buyback program of up to $50 million of the Company's Common Stock over the next eighteen months. The Company expects the purchases to be made from time to time in the open market or in privately negotiated transactions at the Company’s discretion. The Company will utilize existing cash and existing available lines of credit to finance this program.

43
Fiscal Year 2014 The Company’s primary sources of liquidity at September 30, 2014, were cash and cash equivalents of $128.5 million, short-term investments of $13.1 million, and short-term credit lines of $65.0 million. As of September 30, 2014, $1.6 million was outstanding under the short-term lines of credit and $2.0 million was used for bank guarantees under these lines of credit, leaving $61.4 million available for borrowing under short-term lines of credit. In addition, the Company maintained credit lines specific to bank guarantees for $13.8 million, of which $2.7 million was used. Therefore, $72.5 million was unused and available under our short-term and bank guarantee lines of credit, in aggregate, at September 30, 2014. At September 30, 2014, the entire amount of our long-term lines of credit was fully drawn. The Company is subject to financial covenants under some of these facilities and lines of credit, which could restrict the Company from drawing money under them. At September 30, 2014, the Company was in compliance with these covenants. Cash and cash equivalents increased by $5.2 million during fiscal year 2014. Approximately $35.5 million in cash and cash equivalents were provided by operating activities, primarily as the result of the net income ($25.2 million) plus other non-cash items, principally depreciation and amortization ($17.3 million) and stock-based compensation expense ($4.3 million) and a decrease in other accounts receivable ($2.9 million). Operating cash flow was negatively affected by a decrease in accrued liabilities and pension obligations ($3.9 million) and an increase in trade accounts receivable ($3.6 million). Net cash used in investing activities totaled $24.2 million for the year ended September 30, 2014, and was primarily related to various additions to property and equipment ($10.4 million), the purchase of short-term investments ($38.7 million) and acquisitions ($5.9 million), partially offset by the sale of short-term investments ($30.5 million). Net cash used in financing activities totaled $10.7 million for the year ended September 30, 2014, and was primarily related to payments to minority shareholders ($4.9 million), the stock buyback program ($6.2 million) and repayments of loans ($41.7 million), partly offset by borrowings from banks ($39.7 million) and $2.4 million generated through issuance of new shares from the exercise of stock options. The Company expects that its capital expenditures will be approximately $44 million in fiscal year 2015. Management believes that cash flows from operations, along with existing cash and cash equivalents and availability under the credit facilities and lines of credit, will provide adequate resources to meet the Company’s capital requirements and operational needs on both a current and a long-term basis. As of September 30, 2014, $118.9 million of the total $142 million of cash, cash equivalents, and short-term investments, was held by our non-US subsidiaries, with the balance ($22.8 million) held by our US subsidiaries. As of that date, of the $14.8 million of the Group's indebtedness to banks, $3.0 million was owed by our US subsidiaries, and $11.8 million was owed by our non-US subsidiaries. We expect our existing domestic cash, cash equivalents, and short-term investments, together with cash flows from operations to be sufficient to fund our domestic operating activities. In addition, the US Company has $20.0 million in available and unused lines of credit at September 30, 2014. Therefore, we do not intend, nor do we foresee a need, to repatriate foreign earnings that are considered to be indefinitely reinvested, and we do not believe there are any material implications for or restrictions on the liquidity of our domestic subsidiaries as a result of having a majority of our cash, cash equivalents, and short-term investments held by our foreign subsidiaries.
Fiscal Year 2013 The Company’s primary sources of liquidity at September 30, 2013, were cash and cash equivalents of $133.7 million, short-term investments of $3.2 million, short-term credit lines of $67.0 million. As of September 30, 2013, $2.1 million was outstanding under the short-term lines of credit and $1.5 million was used for bank guarantees under these lines of credit, leaving $63.4 million available for borrowing under short-term lines of credit. In addition, the Company maintained credit lines specific to bank guarantees for $21.2 million, of which $7.7 million was used. Therefore, $76.9 million was unused and available under our short-term and bank guarantee lines of credit, in aggregate, at September 30, 2013. At September 30, 2013, the entire amount of our long-term lines of credit was fully drawn. The Company is subject to financial covenants under some of these facilities and lines of credit, which could restrict the Company from drawing money under them. At September 30, 2013, the Company was in compliance with these covenants. Cash and cash equivalents decreased by $35.0 million during fiscal year 2013. Approximately $57.0 million in cash and cash equivalents were provided by operating activities, primarily as the result of the net income ($35.0 million) plus other non-cash

44
items, principally depreciation and amortization ($15.3 million) and a decrease in inventories ($10.1 million). Operating cash flow was negatively affected by the increase in other accounts receivable ($2.7 million) and by a decrease in accounts payable ($2.2 million) and income tax payable ($1.3 million). Net cash used in investing activities totaled $15.5 million for the year ended September 30, 2013, and was primarily related to various additions to property and equipment ($16.2 million), and purchase of short-term investments ($6.3 million), partially offset by proceeds from the sale of short-term investments ($6.8 million). Net cash used in financing activities totaled $9.4 million for the year ended September 30, 2013, and was primarily related to payments to minority shareholders ($4.3 million), the stock buyback program ($4.1 million) and repayments on loans ($24.9 million), partly offset by borrowings from banks ($20.9 million) and $2.9 million generated through issuance of new shares from the exercise of stock options. The following table illustrates the Company’s contractual obligations as of September 30, 2015:
Payments due by period (in thousands) Less than 1-3 3-5 More thanContractual Obligations Total 1 Year Years Years 5 Years
Long and short-term debt $ 23,311 $ 5,226 $ 7,955 $ 3,547 $ 6,583Pension obligations 25,893 874 2,257 2,247 20,515Operating lease obligations 21,941 8,675 7,617 2,928 2,721Purchase obligations * 87,626 76,548 10,930 148 —Interest obligation 1,029 284 367 214 164
Other short- and long-term obligations reflected onthe registrant's Balance Sheet 6,207 2,159 1,547 142 2,359Total $ 166,007 $ 93,766 $ 30,673 $ 9,226 $ 32,342
* Purchase obligations include payments due under various types of agreements to purchase raw materials, services or other goods.
Note – Uncertain tax benefit liabilities of $0.2 million are not included in the Company’s contractual obligation table, as the Company cannot make reasonable estimates about the timing of any required payments related to these liabilities.
Off-Balance Sheet Arrangements The Company has no off-balance sheet arrangements or financing arrangements involving variable interest entities.
CURRENCY EXCHANGE RATE FLUCTUATIONS Although the Company prepares its consolidated financial statements in U.S. dollars, approximately 67% of its net sales are denominated in other currencies, primarily the Euro, Swedish krona, Swiss francs, British pound, Singapore dollar, Taiwanese dollar, Korean won, Japanese yen, Canadian dollar, Indian rupee and Chinese RMB. Net sales and costs and related assets and liabilities are generally denominated in the functional currencies of the operations, thereby serving to reduce the Company’s exposure to exchange gains and losses. Exchange differences upon translation from each operation’s functional currency to U.S. dollars are accumulated as a separate component of equity. The currency translation adjustment component of shareholders’ equity had the effect of decreasing total equity by $50.9 million at September 30, 2015, and by $7.8 million at September 30, 2014. The fluctuation of the Euro and the other relevant functional currencies against the U.S. dollar has had the effect of increasing or decreasing (as applicable), among other things, the Company's reported net sales, as well as its cost of goods sold, gross profit, selling, general and administrative expenses, research and development expenses and income tax expenses denominated in such foreign currencies when translated into U.S. dollars as compared to prior periods.
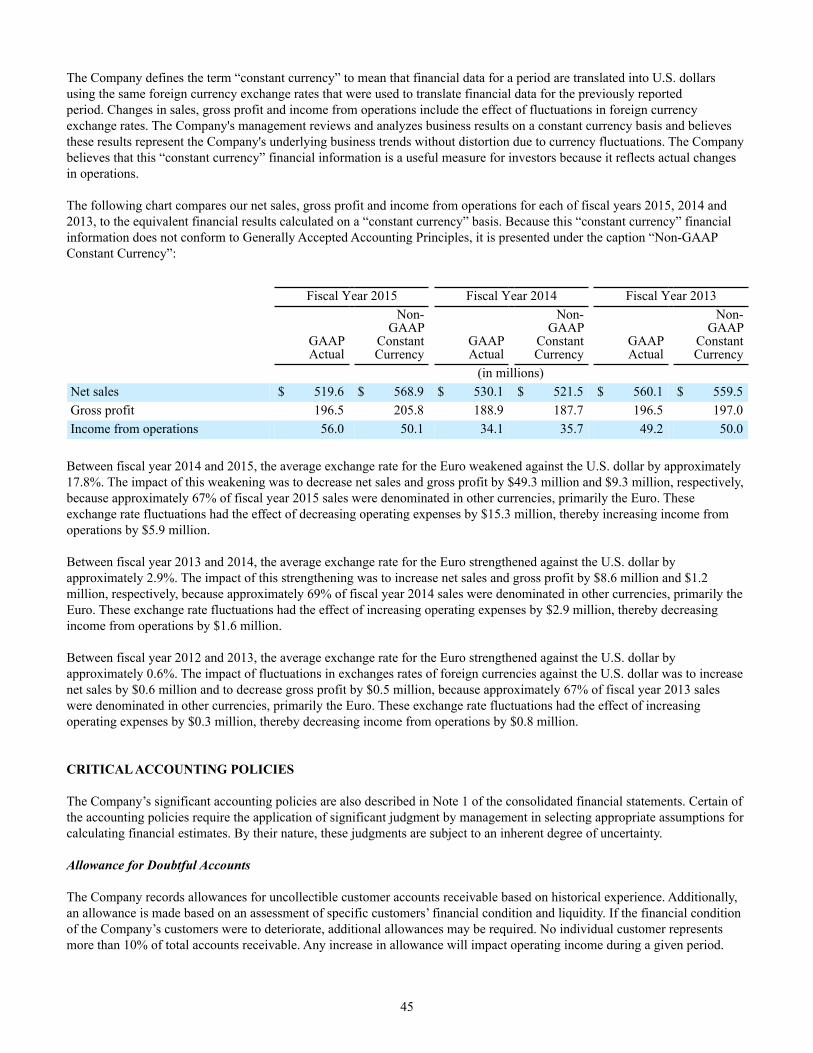
45
The Company defines the term “constant currency” to mean that financial data for a period are translated into U.S. dollars using the same foreign currency exchange rates that were used to translate financial data for the previously reported period. Changes in sales, gross profit and income from operations include the effect of fluctuations in foreign currency exchange rates. The Company's management reviews and analyzes business results on a constant currency basis and believes these results represent the Company's underlying business trends without distortion due to currency fluctuations. The Company believes that this “constant currency” financial information is a useful measure for investors because it reflects actual changes in operations. The following chart compares our net sales, gross profit and income from operations for each of fiscal years 2015, 2014 and 2013, to the equivalent financial results calculated on a “constant currency” basis. Because this “constant currency” financial information does not conform to Generally Accepted Accounting Principles, it is presented under the caption “Non-GAAP Constant Currency”:
Fiscal Year 2015 Fiscal Year 2014 Fiscal Year 2013
GAAPActual
Non-GAAP
ConstantCurrency
GAAPActual
Non-GAAP
ConstantCurrency
GAAPActual
Non-GAAP
ConstantCurrency
(in millions)Net sales $ 519.6 $ 568.9 $ 530.1 $ 521.5 $ 560.1 $ 559.5Gross profit 196.5 205.8 188.9 187.7 196.5 197.0Income from operations 56.0 50.1 34.1 35.7 49.2 50.0
Between fiscal year 2014 and 2015, the average exchange rate for the Euro weakened against the U.S. dollar by approximately 17.8%. The impact of this weakening was to decrease net sales and gross profit by $49.3 million and $9.3 million, respectively, because approximately 67% of fiscal year 2015 sales were denominated in other currencies, primarily the Euro. These exchange rate fluctuations had the effect of decreasing operating expenses by $15.3 million, thereby increasing income from operations by $5.9 million.
Between fiscal year 2013 and 2014, the average exchange rate for the Euro strengthened against the U.S. dollar by approximately 2.9%. The impact of this strengthening was to increase net sales and gross profit by $8.6 million and $1.2 million, respectively, because approximately 69% of fiscal year 2014 sales were denominated in other currencies, primarily the Euro. These exchange rate fluctuations had the effect of increasing operating expenses by $2.9 million, thereby decreasing income from operations by $1.6 million.
Between fiscal year 2012 and 2013, the average exchange rate for the Euro strengthened against the U.S. dollar by approximately 0.6%. The impact of fluctuations in exchanges rates of foreign currencies against the U.S. dollar was to increase net sales by $0.6 million and to decrease gross profit by $0.5 million, because approximately 67% of fiscal year 2013 sales were denominated in other currencies, primarily the Euro. These exchange rate fluctuations had the effect of increasing operating expenses by $0.3 million, thereby decreasing income from operations by $0.8 million.
CRITICAL ACCOUNTING POLICIES The Company’s significant accounting policies are also described in Note 1 of the consolidated financial statements. Certain of the accounting policies require the application of significant judgment by management in selecting appropriate assumptions for calculating financial estimates. By their nature, these judgments are subject to an inherent degree of uncertainty. Allowance for Doubtful Accounts The Company records allowances for uncollectible customer accounts receivable based on historical experience. Additionally, an allowance is made based on an assessment of specific customers’ financial condition and liquidity. If the financial condition of the Company’s customers were to deteriorate, additional allowances may be required. No individual customer represents more than 10% of total accounts receivable. Any increase in allowance will impact operating income during a given period.

46
Inventory Valuation Inventories are stated at the lower of cost or market, after provisions for excess and obsolete inventory salable at prices below cost. Provisions for slow moving and obsolete inventories are provided based on current assessments about historical experience and future product demand and production requirements for the next twelve months. We also write-down up to ninety percent of our total demo inventory costs over thirty six months. These factors are impacted by market conditions, technology changes and changes in strategic direction, and require estimates and management judgment that may include elements that are uncertain. The Company evaluates the adequacy of these provisions quarterly. Although the Company strives to achieve a balance between market demands and risk of inventory excess or obsolescence, it is possible that, should conditions change, additional provisions may be needed. Any changes in provisions will impact operating income during a given period.
Warranty Reserves The Company provides reserves for the estimated costs of product warranties when revenue is recognized. The Company relies upon historical experience, expectations of future conditions, and its service data to estimate its warranty reserve. The Company continuously monitors these data to ensure that the reserve is sufficient. Warranty costs have historically been within our expectations. To the extent we experience increased warranty claim activity or increased costs associated with servicing those claims (such costs may include material, labor and travel costs), revisions to the estimated warranty liability would be required. Increases in reserves will impact operating income during the period.
Pension Obligations The determination of the Company’s obligation and expense for pension is dependent on the selection of certain actuarial assumptions in calculating those amounts. Assumptions are made about interest rates, expected investment return on plan assets, total turnover rates and rates of future compensation increases. In addition, the Company provides the actuarial consultants with subjective factors such as withdrawal rates and mortality rates to develop their calculations of these amounts. The Company generally reviews these assumptions at the beginning of each fiscal year. The Company is required to consider current market conditions, including changes in interest rates, in making these assumptions. The actuarial assumptions that the Company uses may differ materially from actual results due to changing market and economic conditions, higher or lower withdrawal rates, or longer or shorter life spans of participants. These differences may result in a significant impact on the amount of pension benefits expense the Company has recorded or may record.
Another key assumption in determining the net pension expense is the assumed discount rate to be used to discount plan obligations. The Company's U.S. plan uses a cash flow matching approach, which uses projected cash flows matched to spot rates along a high-quality corporate yield curve to determine the present value of cash flows to calculate a single equivalent discount rate. A lower discount rate increases the present value of benefit obligations and increases pension expense. To determine the expected long-term rate of return on plan assets, the Company considers the current and expected asset allocations, as well as historical and expected returns on various categories of plan assets.
Income Taxes We estimate our income tax provision in each of the jurisdictions in which we operate, a process that includes estimating exposures related to examinations by taxing authorities. We must also make judgments regarding the ability to realize the deferred tax assets. The carrying value of our net deferred tax assets is based on our belief that it is more likely than not that we will generate sufficient future taxable income in certain jurisdictions to realize these deferred tax assets. A valuation allowance has been established for deferred tax assets that we do not believe meet the “more likely than not” criteria. We assess whether an uncertain tax position taken or expected to be taken in a tax return meets the threshold for recognition and measurement in the consolidated financial statements. Our judgments regarding future taxable income as well as tax positions taken or expected to be taken in a tax return may change due to changes in market conditions, changes in tax laws, or other factors. If our assumptions and consequently our estimates change in the future, the valuation allowances and/or tax reserves established may be increased or decreased, resulting in a respective increase or decrease in income tax expense.
Share-Based Payment Stock-based compensation cost is measured at grant date, based on the fair value of the award, and is recognized as expense over the employee requisite vesting period. We make judgments about the fair value of the awards, including the expected term of the award, volatility of the underlying stock and estimated forfeitures, which impact the amount of compensation expense
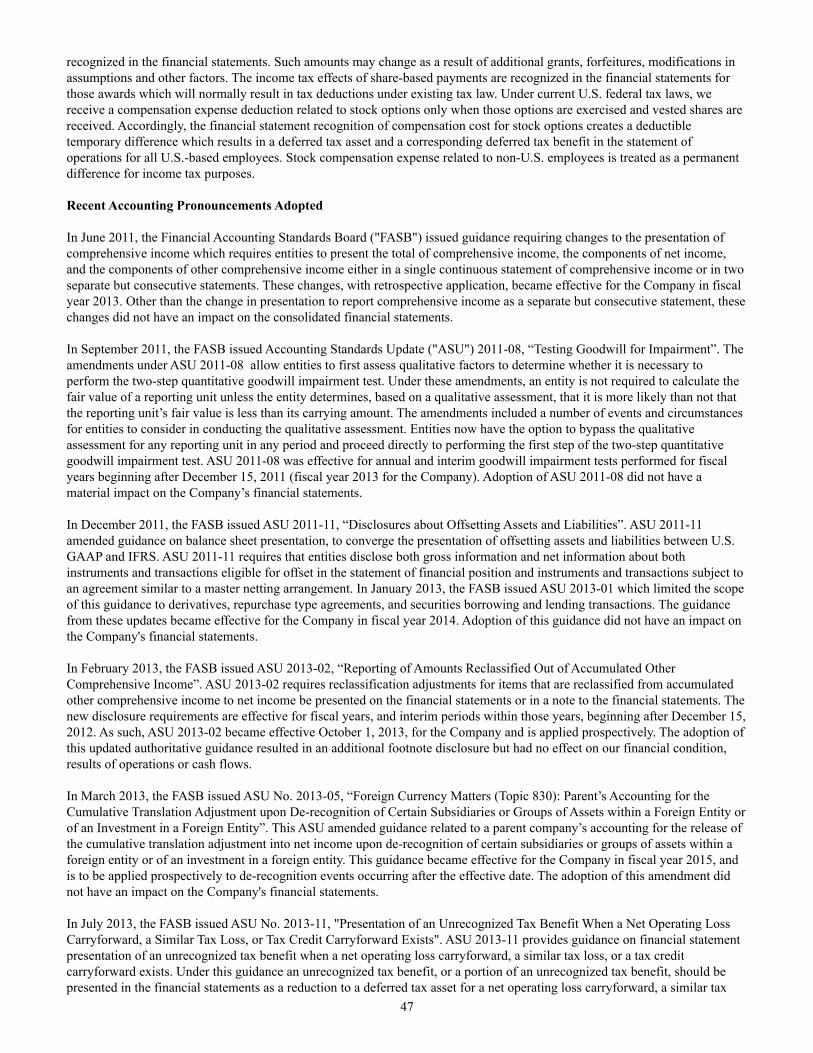
47
recognized in the financial statements. Such amounts may change as a result of additional grants, forfeitures, modifications in assumptions and other factors. The income tax effects of share-based payments are recognized in the financial statements for those awards which will normally result in tax deductions under existing tax law. Under current U.S. federal tax laws, we receive a compensation expense deduction related to stock options only when those options are exercised and vested shares are received. Accordingly, the financial statement recognition of compensation cost for stock options creates a deductible temporary difference which results in a deferred tax asset and a corresponding deferred tax benefit in the statement of operations for all U.S.-based employees. Stock compensation expense related to non-U.S. employees is treated as a permanent difference for income tax purposes.
Recent Accounting Pronouncements Adopted In June 2011, the Financial Accounting Standards Board ("FASB") issued guidance requiring changes to the presentation of comprehensive income which requires entities to present the total of comprehensive income, the components of net income, and the components of other comprehensive income either in a single continuous statement of comprehensive income or in two separate but consecutive statements. These changes, with retrospective application, became effective for the Company in fiscal year 2013. Other than the change in presentation to report comprehensive income as a separate but consecutive statement, these changes did not have an impact on the consolidated financial statements. In September 2011, the FASB issued Accounting Standards Update ("ASU") 2011-08, “Testing Goodwill for Impairment”. The amendments under ASU 2011-08 allow entities to first assess qualitative factors to determine whether it is necessary to perform the two-step quantitative goodwill impairment test. Under these amendments, an entity is not required to calculate the fair value of a reporting unit unless the entity determines, based on a qualitative assessment, that it is more likely than not that the reporting unit’s fair value is less than its carrying amount. The amendments included a number of events and circumstances for entities to consider in conducting the qualitative assessment. Entities now have the option to bypass the qualitative assessment for any reporting unit in any period and proceed directly to performing the first step of the two-step quantitative goodwill impairment test. ASU 2011-08 was effective for annual and interim goodwill impairment tests performed for fiscal years beginning after December 15, 2011 (fiscal year 2013 for the Company). Adoption of ASU 2011-08 did not have a material impact on the Company’s financial statements.
In December 2011, the FASB issued ASU 2011-11, “Disclosures about Offsetting Assets and Liabilities”. ASU 2011-11 amended guidance on balance sheet presentation, to converge the presentation of offsetting assets and liabilities between U.S. GAAP and IFRS. ASU 2011-11 requires that entities disclose both gross information and net information about both instruments and transactions eligible for offset in the statement of financial position and instruments and transactions subject to an agreement similar to a master netting arrangement. In January 2013, the FASB issued ASU 2013-01 which limited the scope of this guidance to derivatives, repurchase type agreements, and securities borrowing and lending transactions. The guidance from these updates became effective for the Company in fiscal year 2014. Adoption of this guidance did not have an impact on the Company's financial statements.
In February 2013, the FASB issued ASU 2013-02, “Reporting of Amounts Reclassified Out of Accumulated Other Comprehensive Income”. ASU 2013-02 requires reclassification adjustments for items that are reclassified from accumulated other comprehensive income to net income be presented on the financial statements or in a note to the financial statements. The new disclosure requirements are effective for fiscal years, and interim periods within those years, beginning after December 15, 2012. As such, ASU 2013-02 became effective October 1, 2013, for the Company and is applied prospectively. The adoption of this updated authoritative guidance resulted in an additional footnote disclosure but had no effect on our financial condition, results of operations or cash flows.
In March 2013, the FASB issued ASU No. 2013-05, “Foreign Currency Matters (Topic 830): Parent’s Accounting for the Cumulative Translation Adjustment upon De-recognition of Certain Subsidiaries or Groups of Assets within a Foreign Entity or of an Investment in a Foreign Entity”. This ASU amended guidance related to a parent company’s accounting for the release of the cumulative translation adjustment into net income upon de-recognition of certain subsidiaries or groups of assets within a foreign entity or of an investment in a foreign entity. This guidance became effective for the Company in fiscal year 2015, and is to be applied prospectively to de-recognition events occurring after the effective date. The adoption of this amendment did not have an impact on the Company's financial statements.
In July 2013, the FASB issued ASU No. 2013-11, "Presentation of an Unrecognized Tax Benefit When a Net Operating Loss Carryforward, a Similar Tax Loss, or Tax Credit Carryforward Exists". ASU 2013-11 provides guidance on financial statement presentation of an unrecognized tax benefit when a net operating loss carryforward, a similar tax loss, or a tax credit carryforward exists. Under this guidance an unrecognized tax benefit, or a portion of an unrecognized tax benefit, should be presented in the financial statements as a reduction to a deferred tax asset for a net operating loss carryforward, a similar tax

48
loss, or a tax credit carryforward, except as follows. To the extent a net operating loss carryforward, a similar tax loss, or a tax credit carryforward is not available at the reporting date under the tax law of the applicable jurisdiction to settle any additional income taxes that would result from the disallowance of a tax position or the tax law of the applicable jurisdiction does not require the entity to use, and the entity does not intend to use, the deferred tax asset for such purpose, the unrecognized tax benefit should be presented in the financial statements as a liability and should not be combined with deferred tax assets. These amendments were effective for fiscal years, and interim periods within those years, beginning after December 15, 2013 (fiscal year 2015 for the Company). The adoption did not have an impact on the Company's consolidated financial statements.
Recent Accounting Pronouncements Not Yet Adopted as of September 30, 2015 In May 2014, the FASB issued ASU No. 2014-09, "Revenue from Contracts with Customers (Topic 606)." ASU 2014-09 provides guidance on revenue from contracts with customers, which implements a five step process of how an entity should recognize revenue in order to depict the transfer of promised goods or services to customers in an amount that reflects the consideration to which the entity expects to be entitled in exchange for those goods or services. This standard was initially released as effective for fiscal years beginning after December 15, 2016. In August 2015, the FASB issued ASU No. 2015-14 which defers the effective date of ASU 2014-09 by one year, with a new effective date for fiscal years beginning after December 15, 2017 (fiscal year 2019 for the Company). The new guidelines can be implemented using either of the following transition methods: (i) a full retrospective approach reflecting the application of the standard in each prior reporting period with the option to elect certain practical expedients, or (ii) a retrospective approach with the cumulative effect of initially adopting ASU 2014-09 recognized at the date of adoption. The Company is currently evaluating the impact of the new guidance on its consolidated financial statements and has not yet determined the method by which it will adopt the standard.
In August 2014, the FASB issued No. ASU 2014-15, "Presentation of Financial Statements - Going Concern (Subtopic 205-40): Disclosure of Uncertainties about an Entity’s Ability to Continue as a Going Concern". ASU 2014-15 requires management to assess an entity’s ability to continue as a going concern by incorporating and expanding upon certain principles that are currently in U.S. auditing standards. Specifically, ASU 2014-15 (1) provides a definition of the term substantial doubt, (2) requires an evaluation every reporting period including interim periods, (3) provides principles for considering the mitigating effect of management’s plans, (4) requires certain disclosures when substantial doubt is alleviated as a result of consideration of management’s plans, (5) requires an express statement and other disclosures when substantial doubt is not alleviated, and (6) requires an assessment for a period of one year after the date that the financial statements are issued (or are available to be issued). The standard will be effective for the first interim period within annual reporting periods beginning after December 15, 2016. Early application is permitted. This guidance will not have a material impact on our consolidated financial statements.
In April 2015, the FASB issued ASU No. 2015-05, "Customer's Accounting for Fees Paid in a Cloud Computing Arrangement". ASU 2015-05 provides guidance to customers about whether a cloud computing arrangement includes a software license. If the arrangement includes a software license, the customer should account for the software license element in a manner consistent with the acquisition of other software licenses. If the arrangement does not include a software license, the customer should account for the arrangement as a service contract. This guidance will be effective for annual periods, including interim periods within those annual periods, beginning after December 15, 2015 (fiscal year 2017 for the Company). The Company does not believe the pronouncement will have a material impact on the Company’s consolidated financial statements.
In April 2015, the FASB issued ASU No. 2015-03, “Simplifying the Presentation of Debt Issuance Costs”. This standard amends existing guidance to require the presentation of debt issuance cost in the balance sheet as a deduction from the carrying amount of the related debt liability instead of a deferred charge. It is effective for annual reporting periods beginning after December 15, 2015, but early adoption is permitted. The Company does not believe the pronouncement will have a material impact on the Company’s financial statements and will implement the pronouncement beginning in the period after December 15, 2015.
In July 2015, the FASB issued ASU No. 2015-11, "Simplifying the Measurement of Inventory". The new guidance does not apply to inventory that is measured using last-in, first-out or the retail inventory method. The guidance applies to all other inventory, which includes inventory that is measured using first-in, first-out or average cost and requires that inventory should be measured at the lower of cost and net realizable value. These amendments are effective for fiscal years beginning after December 15, 2016 (fiscal year 2018 for the Company). The Company is currently evaluating the impact of the new guidance on its consolidated financial statements.
Other accounting standards that have been issued by the FASB or other standards-setting bodies that do not require adoption until a future date are not expected to have a material impact on the Company's financial statements upon adoption.
49
ITEM 7A. QUANTITATIVE AND QUALITATIVE DISCLOSURES ABOUT MARKET RISK The following discussion about the Company’s market risk disclosures involves forward-looking statements. Actual results could differ materially from those projected in the forward-looking statements. The Company is exposed to market risk related to changes in interest rates and foreign currency exchange rates. The Company does not use derivative financial instruments for trading purposes.
Interest Rate Sensitivity As of September 30, 2015, the Company maintained cash equivalents and short-term investments of $175.6 million, consisting mainly of non-taxable interest bearing securities and demand deposits all with maturities of less than one year. If short-term interest rates were to increase or decrease by 10%, the impact on interest income would be less than $0.1 million. As of September 30, 2015, the Company had $2.6 million of variable rate debt on which the interest rate is reset every six months and $20.7 million of fixed rate debt. Maturities of this debt are as follows: $5.2 million is due in 2016, $5.5 million is due in 2017, $2.5 million is due in 2018, $1.8 million is due annually from 2019 through 2022, $1.6 million is due in 2023 and $1.4 million is due in 2024. A 10% change in the variable interest rates of the Company’s debt would result in an increase or decrease in interest expense of less than $0.1 million. The Company has entered into one interest rate swap agreements to minimize the interest expenses on a portion of its variable debt described in the previous paragraph by shifting from variable to fixed interest rates. The swap agreement is for a total notional amount of Swiss francs 2.5 million (equivalent to $2.6 million based on the exchange rate at September 30, 2015).
Foreign Currency Exchange Risk The Company enters into foreign currency forward contracts and forward exchange options generally of less than one year duration to hedge a portion of its foreign currency risk on sales transactions. At September 30, 2015, the Company held Japanese yen forward exchange contracts with notional amounts of Euro1.8 million and of $0.3 million. The gains or losses resulting from a 10% change in currency exchange rates would be approximately $0.2 million and $0.3 million, respectively.
ITEM 8. CONSOLIDATED FINANCIAL STATEMENTS AND SUPPLEMENTARY DATA See Item 15(a) for an index to the consolidated financial statements, which are incorporated here by reference.
ITEM 9. CHANGES IN AND DISAGREEMENTS WITH ACCOUNTANTS ON ACCOUNTING AND FINANCIAL DISCLOSURE
None.
ITEM 9A. CONTROLS AND PROCEDURES Attached as exhibits to this Form 10-K are certifications of the Company’s Chief Executive Officer and Chief Financial Officer, which are required in accordance with Rule 13a-14 of the Securities Exchange Act of 1934, as amended (the “Exchange Act”). This “Controls and Procedures” section includes information concerning the controls and controls evaluation referred to in the certifications. Part IV, Item 15 of this Form 10-K, sets forth the report of Deloitte & Touche LLP, our independent registered public accounting firm, regarding its audit of the Company’s internal control over financial reporting set forth below in this section. This section should be read in conjunction with the certifications and the Deloitte & Touche LLP report for a more complete understanding of the topics presented.
Evaluation of Disclosure Controls and Procedures
The Company, under the supervision and with the participation of its management, including the Chief Executive Officer and Chief Financial Officer, evaluated the effectiveness of the design and operation of the Company’s disclosure controls and

50
procedures (as defined in Rules 13a-15(e) and 15d-15(e) of the Exchange Act). Based on the evaluation, the Chief Executive Officer and Chief Financial Officer concluded that the Company’s disclosure controls and procedures were effective as of September 30, 2015. There has been no change in the Company’s internal control over financial reporting during the fourth quarter of the fiscal year ended September 30, 2015, that has materially affected, or is reasonably likely to materially affect, the Company’s internal control over financial reporting.
Management Report on Internal Control Over Financial Reporting
The Company’s management is responsible for establishing and maintaining adequate internal control over financial reporting to provide reasonable assurance regarding the reliability of the Company’s financial reporting and the preparation of financial statements for external purposes in accordance with Generally Accepted Accounting Principles. Internal control over financial reporting includes those policies and procedures that (i) pertain to the maintenance of records, that in reasonable detail accurately and fairly reflect the transactions and dispositions of the assets of the Company; (ii) provide reasonable assurance that transactions are recorded as necessary to permit preparation of financial statements in accordance with Generally Accepted Accounting Principles, and that receipts and expenditures of the Company are being made only in accordance with authorizations of management and directors of the Company; and (iii) provide reasonable assurance regarding prevention or timely detection of unauthorized acquisition, use or disposition of the Company’s assets that could have a material effect on the financial statements.
Management assessed the Company’s internal control over financial reporting as of September 30, 2015, the end of its fiscal year. Management based its assessment on criteria established in “Internal Control - Integrated Framework” (1992) issued by the Committee of Sponsoring Organizations of the Treadway Commission. Management’s assessment included evaluation of such elements as the design and operating effectiveness of key financial reporting controls, process documentation, accounting policies and the Company’s overall control environment. This assessment is supported by testing and monitoring performed by the Company’s Internal Audit organization. Based on its assessment, management has concluded that the Company’s internal control over financial reporting was effective as of the end of the fiscal year to provide reasonable assurance regarding the reliability of financial reporting and the preparation of financial statements for external reporting purposes in accordance with Generally Accepted Accounting Principles. Management reviewed the results of its assessment with the Audit Committee of the Company’s Board of Directors.
The Company’s independent registered public accounting firm, Deloitte & Touche LLP, independently assessed the effectiveness of the Company’s internal control over financial reporting. Deloitte & Touche LLP has issued an attestation report concurring with management’s assessment, which is included at the beginning of Part IV, Item 15 of this Annual Report on Form 10-K.
The Company’s management does not expect that the internal controls over financial reporting will prevent or detect all errors and all fraud. A control system, no matter how well designed and operated, can provide only reasonable, not absolute, assurance that the objectives of the control system are met. Further, the design of a control system must reflect the fact that there are resource constraints, and the benefits of controls must be considered relative to their costs. Due to the inherent limitations in all control systems, no evaluation of controls can provide absolute assurance that all control issues, errors and instances of fraud, if any, within the Company have been or will be detected.
ITEM 9B. OTHER INFORMATION None.
51
PART III
ITEM 10. DIRECTORS, EXECUTIVE OFFICERS AND CORPORATE GOVERNANCE The information required by this item is included in the “Election of Directors”, “Directors and Executive Officers”, “Section 16(a) Beneficial Ownership Reporting Compliance”, and “Committees of the Board of Directors; Meetings and Compensation of Directors”, sections of the Company’s Proxy Statement to be filed in connection with the 2016 Annual Meeting of Stockholders expected to be held in March 2016, and is incorporated by reference herein.
ITEM 11. EXECUTIVE COMPENSATION The information required by this item is included in the “Executive Compensation and Related Information” section of the Company’s Proxy Statement to be filed in connection with the 2016 Annual Meeting of Stockholders expected to be held in March 2016, and is incorporated by reference herein.
ITEM 12. SECURITY OWNERSHIP OF CERTAIN BENEFICIAL OWNERS AND MANAGEMENT AND RELATED STOCKHOLDER MATTERS
The information required by this item is included in the “Security Ownership of Common Stock by Management and Certain Beneficial Owners” section of the Company’s Proxy Statement to be filed in connection with the 2016 Annual Meeting of Stockholders expected to be held in March 2016, and is incorporated by reference herein.
ITEM 13. CERTAIN RELATIONSHIPS AND RELATED TRANSACTIONS AND DIRECTOR INDEPENDENCE
The information required by this item is included in the “Compensation Committee”, “Compensation Committee Interlocks and Insider Participation”, and “Certain Relationships and Related Transactions” sections of the Company’s Proxy Statement to be filed in connection with the 2016 Annual Meeting of Stockholders expected to be held in March 2016, and is incorporated by reference herein. The main facility in Starnberg is rented under a 25-year operating lease from the former minority shareholder of ROFIN-BAASEL Lasertech GmbH & Co. KG (“RBL”), Mr. Baasel, who is also a member of the Board of Directors of the Company. That lease will terminate by end of December 2016. The operating lease was acquired by the Company in 2000 as part of its then acquisition of RBL. The Company paid Mr. Baasel expenses, mainly for rental expenses, of $0.7 million, $0.9 million, and $0.8 million in fiscal years 2015, 2014, and 2013, respectively. In fiscal 2015, the Company acquired a new manufacturing facility in Gilching, which is currently under reconstruction and which is intended to replace all RBL leased facilities in Starnberg. The Company believes that all transactions noted above have been executed on an arms-length basis. Except for the foregoing, no director, officer, nominee director, 5% holder of the Company’s shares, or immediate family member, associate or affiliate thereof, had any material interest, direct or indirect, in any transaction since the beginning of fiscal year 2015 or has any material interest, direct or indirect, in any proposed transaction, having a value of $60,000 or more.
Indebtedness of Officers and Directors Since the beginning of fiscal year 2004, there has been no indebtedness to the Company by any director or officer or associates of any such person, other than reimbursements for purchases, for ordinary travel and expense advances and for other transactions in the ordinary course of business.

52
ITEM 14. PRINCIPAL ACCOUNTANT FEES AND SERVICES The information set forth under “Independent Public Accountants” in the definitive form of the Company’s Proxy Statement to be filed in connection with the 2016 Annual Meeting of Stockholders to be held in March 2016, is incorporated by reference herein.

53
PART IV
ITEM 15. EXHIBITS AND FINANCIAL STATEMENT SCHEDULES
a. 1 Consolidated Financial Statements The following financial statements are filed as part of this Form 10-K: Report of Independent Registered Public Accounting Firm Consolidated Balance Sheets as of September 30, 2015, and 2014 Consolidated Statements of Operations for the years ended September 30, 2015, 2014 and 2013
Consolidated Statements of Comprehensive Income for the years endedSeptember 30, 2015, 2014 and 2013
Consolidated Statements of Stockholders’ Equity for the years ended September 30, 2015, 2014 and 2013 Consolidated Statements of Cash Flows for the years ended September 30, 2015, 2014 and 2013 Notes to Consolidated Financial Statements 2 Financial Statement Schedules Schedule II – Valuation and Qualifying Accounts Schedules not listed above have been omitted because the matter or conditions are not present or the
information required to be set forth therein is included in the Consolidated Financial Statements hereto. 3 Exhibits The exhibits listed in the accompanying index to exhibits are filed or incorporated by reference as part of
this Annual Report.
F-1F-2
F-4
F-5
F-6
F-7F-8
F-32

54
EXHIBITNUMBER DESCRIPTION
3.1 Certificate of Incorporation of the Company and Form of Certificate of Amendment thereto (Incorporatedby reference to the exhibits filed with the Company’s Registration Statement on Form S-1 (File No.333-09539) which was declared effective on September 25, 1996)
3.2 By-Laws of the Company, As Amended Through November 29, 2011 (Incorporated by reference to theexhibit filed with the Company’s Proxy Statement on Schedule 14A filed with the Securities and ExchangeCommission on March 12, 2015)
10.1 Inheritable Building Right (Erbbaurecht), dated as of March 1, 1990, between ROFIN-SINAR LaserGmbH and Lohss GmbH (in German, English summary provided) (Incorporated by reference to theexhibits filed with the Company’s Registration Statement on Form S-1 (File No. 333-09539) which wasdeclared effective on September 25, 1996)
10.2 Lease Agreement, dated August 10, 1990, between Josef and Maria Kranz and ROFIN-SINAR LaserGmbH (in German, English summary provided) (Incorporated by reference to the exhibits filed with theCompany’s Registration Statement on Form S-1 (File No. 333-09539) which was declared effective onSeptember 25, 1996)
10.3 Lease Agreement, dated March 25, 1993, between DR Group and ROFIN-SINAR, Incorporated (ConceptDrive property) (Incorporated by reference to the exhibits filed with the Company’s RegistrationStatement on Form S-1 (File No. 333-09539) which was declared effective on September 25, 1996)
10.4 ROFIN-SINAR Laser GmbH Pension Plan (in German, English summary provided) (Incorporated byreference to the exhibits filed with the Company’s Registration Statement on Form S-1 (File No.333-09539) which was declared effective on September 25, 1996) (a)
10.5 Deutsche Bank AG Commitment Letter dated August 22, 1996 (Incorporated by reference to the exhibitsfiled with the Company’s Registration Statement on Form S-1 (File No. 333-09539) which was declaredeffective on September 25, 1996)
10.6 U.S. and German Separation Agreements, dated as of June 4, 2015, among Gunther Braun, ROFIN-SINARLaser GmbH, and ROFIN-SINAR Technologies Inc. (in German, English summaryprovided) (Incorporated by reference to the exhibits filed with the Company’s Current Report on Form 8-K filed with the Securities and Exchange Commission on June 5, 2015) (a)
10.7 Lease Agreement between Carl Baasel and ROFIN-SINAR Laser GmbH (Incorporated by reference to theexhibit filed with the Company’s Current Report on Form 8-K filed with the Securities and ExchangeCommission on May 24, 2000)
10.8 2002 Equity Incentive Plan (Incorporated by reference to the exhibit filed with the Company’s AnnualReport on Form 10-K filed with the Securities and Exchange Commission on December 23, 2003) (a)
10.9 2007 Incentive Stock Plan (Incorporated by reference to the exhibit filed with the Company’s ProxyStatement on Schedule 14A filed with the Securities and Exchange Commission on January 25, 2007, andas amended by the Company's Current Report on Form 8-K filed with the Securities and ExchangeCommission on March 2, 2011) (a)
10.10 2015 Incentive Stock Plan (Incorporated by reference to the exhibit filed with the Company’s ProxyStatement on Schedule 14A filed with the Securities and Exchange Commission on March 12, 2015) (a)
10.11 Form of Non-Qualified Stock Option Agreement (Incorporated by reference in the exhibits filed with theCompany's Registration Statement on Form S-8 filed with the Securities and Exchange Commission onJune 26, 2015) (a)
10.12 Form of Incentive Stock Option Agreement (Incorporated by reference in the exhibits filed with theCompany's Registration Statement on Form S-8 filed with the Securities and Exchange Commission onJune 26, 2015) (a)
10.13 Form of Employment Agreement, dated July 1, 2015, among Thomas Merk and ROFIN-SINAR LaserGmbH, and ROFIN-SINAR Technologies, Inc. (a) (*)
10.14 Form of Employment Agreement, dated as of September 2, 1996, among Thomas Merk, CBLVerwaltungsgellschaft mbH, and ROFIN-SINAR Laser GmbH (in German, English summary provided) (a)(*)
14.1 Code of Business Ethics (Incorporated by reference to the exhibit filed with the Company’s ProxyStatement on Schedule 14A filed with the Securities and Exchange Commission on January 30, 2004)

55
EXHIBITNUMBER DESCRIPTION
21.1 List of Subsidiaries of the Registrant
23.1 Consent of Deloitte & Touche LLP Independent Registered Public Accounting Firm
31.1 Rule 13a-14(a)/15d-14(a) Certification of Chief Executive Officer
31.2 Rule 13a-14(a)/15d-14(a) Certification of Chief Financial Officer
32.1 Section 1350 Certification of Chief Executive Officer
32.2 Section 1350 Certification of Chief Financial Officer
101.INS XBRL Instance Document (*)
101.SCH XBRL Taxonomy Extension Schema Document (*)
101.CAL XBRL Taxonomy Extension Calculation Linkbase Document (*)
101.DEF XBRL Taxonomy Extension Definition Linkbase Document (*)
101.LAB XBRL Taxonomy Extension Label Linkbase Document (*)
101.PRE XBRL Taxonomy Extension Presentation Linkbase Document (*)
(a) Management contracts and compensatory plans and arrangements required to be filed as exhibits pursuantto Item 15(c) of this Report.
(*) These exhibits are filed with the SEC only

56
SIGNATURES Pursuant to the requirements of Section 13 or 15(d) of the Securities Exchange Act of 1934, the registrant has duly caused this report to be signed on its behalf by the undersigned, thereunto duly authorized.
Date: November 27, 2015 ROFIN-SINAR TECHNOLOGIES INC. By: /s/ Thomas Merk Thomas Merk President, Chief Executive Officer, and Director
Pursuant to the requirements of the Securities Act of 1934, this report has been signed below by the following persons on behalf of the registrant and in the capacities and on the dates indicated.
SIGNATURE TITLE DATE /s/ Peter Wirth Chairman of the Board November 27, 2015
Peter Wirth /s/ Thomas Merk President, Chief Executive Officer, November 27, 2015
Thomas Merk and Director /s/ Ingrid Mittelstaedt Chief Financial Officer November 27, 2015
Ingrid Mittelstaedt
/s/ Ralph Reins Director November 27, 2015Ralph Reins
/s/ Gary Willis Director November 27, 2015
Gary Willis /s/ Carl F. Baasel Director November 27, 2015
Carl F. Baasel
/s/ Daniel Smoke Director November 27, 2015Daniel Smoke
/s/ Stephen Fantone Director November 27, 2015
Stephen Fantone

F-1
REPORT OF INDEPENDENT REGISTERED PUBLIC ACCOUNTING FIRM
To the Board of Directors and Stockholders ofROFIN-SINAR Technologies Inc. and SubsidiariesPlymouth, Michigan
We have audited the accompanying consolidated balance sheets of ROFIN-SINAR Technologies Inc. and subsidiaries (the "Company") as of September 30, 2015 and 2014, and the related consolidated statements of operations, comprehensive income, stockholders' equity, and cash flows for each of the three years in the period ended September 30, 2015. Our audits also included the financial statement schedule listed in the Index at Item 15 (the “financial statement schedule”). We also have audited the Company's internal control over financial reporting as of September 30, 2015, based on criteria established in Internal Control - Integrated Framework (1992) issued by the Committee of Sponsoring Organizations of the Treadway Commission. The Company's management is responsible for these financial statements and financial statement schedule, for maintaining effective internal control over financial reporting, and for its assessment of the effectiveness of internal control over financial reporting, included in the accompanying Management Report on Internal Control Over Financial Reporting. Our responsibility is to express an opinion on these financial statements and financial statement schedule and an opinion on the Company's internal control over financial reporting based on our audits.
We conducted our audits in accordance with the standards of the Public Company Accounting Oversight Board (United States). Those standards require that we plan and perform the audit to obtain reasonable assurance about whether the financial statements are free of material misstatement and whether effective internal control over financial reporting was maintained in all material respects. Our audits of the financial statements included examining, on a test basis, evidence supporting the amounts and disclosures in the financial statements, assessing the accounting principles used and significant estimates made by management, and evaluating the overall financial statement presentation. Our audit of internal control over financial reporting included obtaining an understanding of internal control over financial reporting, assessing the risk that a material weakness exists, and testing and evaluating the design and operating effectiveness of internal control based on the assessed risk. Our audits also included performing such other procedures as we considered necessary in the circumstances. We believe that our audits provide a reasonable basis for our opinions.
A company's internal control over financial reporting is a process designed by, or under the supervision of, the company's principal executive and principal financial officers, or persons performing similar functions, and effected by the company's board of directors, management, and other personnel to provide reasonable assurance regarding the reliability of financial reporting and the preparation of financial statements for external purposes in accordance with generally accepted accounting principles. A company's internal control over financial reporting includes those policies and procedures that (1) pertain to the maintenance of records that, in reasonable detail, accurately and fairly reflect the transactions and dispositions of the assets of the company; (2) provide reasonable assurance that transactions are recorded as necessary to permit preparation of financial statements in accordance with generally accepted accounting principles and that receipts and expenditures of the company are being made only in accordance with authorizations of management and directors of the company; and (3) provide reasonable assurance regarding prevention or timely detection of unauthorized acquisition, use, or disposition of the company's assets that could have a material effect on the financial statements.
Because of the inherent limitations of internal control over financial reporting, including the possibility of collusion or improper management override of controls, material misstatements due to error or fraud may not be prevented or detected on a timely basis. Also, projections of any evaluation of the effectiveness of the internal control over financial reporting to future periods are subject to the risk that the controls may become inadequate because of changes in conditions, or that the degree of compliance with the policies or procedures may deteriorate.
In our opinion, the consolidated financial statements referred to above present fairly, in all material respects, the financial position of ROFIN-SINAR Technologies Inc. and subsidiaries as of September 30, 2015 and 2014, and the results of their operations and their cash flows for each of the three years in the period ended September 30, 2015, in conformity with accounting principles generally accepted in the United States of America. Also, in our opinion, such financial statement schedule, when considered in relation to the basic consolidated financial statements taken as a whole, presents fairly, in all material respects, the information set forth therein. Also, in our opinion, the Company maintained, in all material respects, effective internal control over financial reporting as of September 30, 2015, based on the criteria established in Internal Control - Integrated Framework (1992) issued by the Committee of Sponsoring Organizations of the Treadway Commission.
/s/ Deloitte & Touche LLP
Detroit, MINovember 30, 2015

F-2
ROFIN-SINAR TECHNOLOGIES INC. AND SUBSIDIARIESCONSOLIDATED BALANCE SHEETS(dollars in thousands, except share data)
September 30, 2015 2014ASSETS Current assets:
Cash and cash equivalents $ 169,729 $ 128,537Short-term investments 5,833 13,121Accounts receivable, trade 99,372 111,364Less allowance for doubtful accounts (3,279) (3,338)
Trade accounts receivable, net 96,093 108,026Other accounts receivable 3,258 4,885Inventories, net (note 3) 181,025 190,321Prepaid expenses 6,920 5,449Deferred income tax assets (note 10) 25,718 23,536
Total current assets 488,576 473,875
Property and equipment, at cost (note 4) 191,828 180,746Less accumulated depreciation (99,255) (101,043)
Property and equipment, net 92,573 79,703Deferred income tax assets (note 10) 15,528 16,890Goodwill (note 5) 93,541 100,355Other Intangibles, net (note 5) 14,767 15,712Other assets 1,506 2,050
Total assets $ 706,491 $ 688,585
LIABILITIES AND EQUITY Current liabilities:
Line of credit and short-term borrowings (note 7 and 8) $ 5,226 $ 3,255Accounts payable, trade 23,443 22,702Accounts payable to related party (note 15) 299 443Income taxes payable (note 10) 7,998 5,872Deferred income tax liabilities (note 10) 2,666 4,437Accrued liabilities (note 6) 69,986 63,144
Total current liabilities 109,618 99,853
Long-term debt (note 8) 18,085 11,511Pension obligations (note 11) 25,439 25,692Deferred income tax liabilities (note 10) 6,452 7,303Other long-term liabilities 4,288 5,517
Total liabilities 163,882 149,876Commitments and contingencies (note 9)

F-3
Stockholders’ equity: Preferred stock, 5,000,000 shares authorized, none issued or outstanding — —Common stock, $0.01 par value, 50,000,000 shares authorized, 33,053,687 shares issued atSeptember 30, 2015 (32,884,000 shares issued at September 30, 2014) 331 329Additional paid-in capital 239,333 232,832Retained earnings 529,234 487,976Accumulated other comprehensive income (loss) (57,517) (14,072)Treasury shares, at cost, 4,871,884 shares at September 30, 2015 and 2014 (169,262) (169,262)
Total ROFIN-SINAR Technologies Inc. stockholders’ equity 542,119 537,803Noncontrolling interest in subsidiaries 490 906
Total equity 542,609 538,709Total liabilities and equity $ 706,491 $ 688,585
See accompanying notes to consolidated financial statements
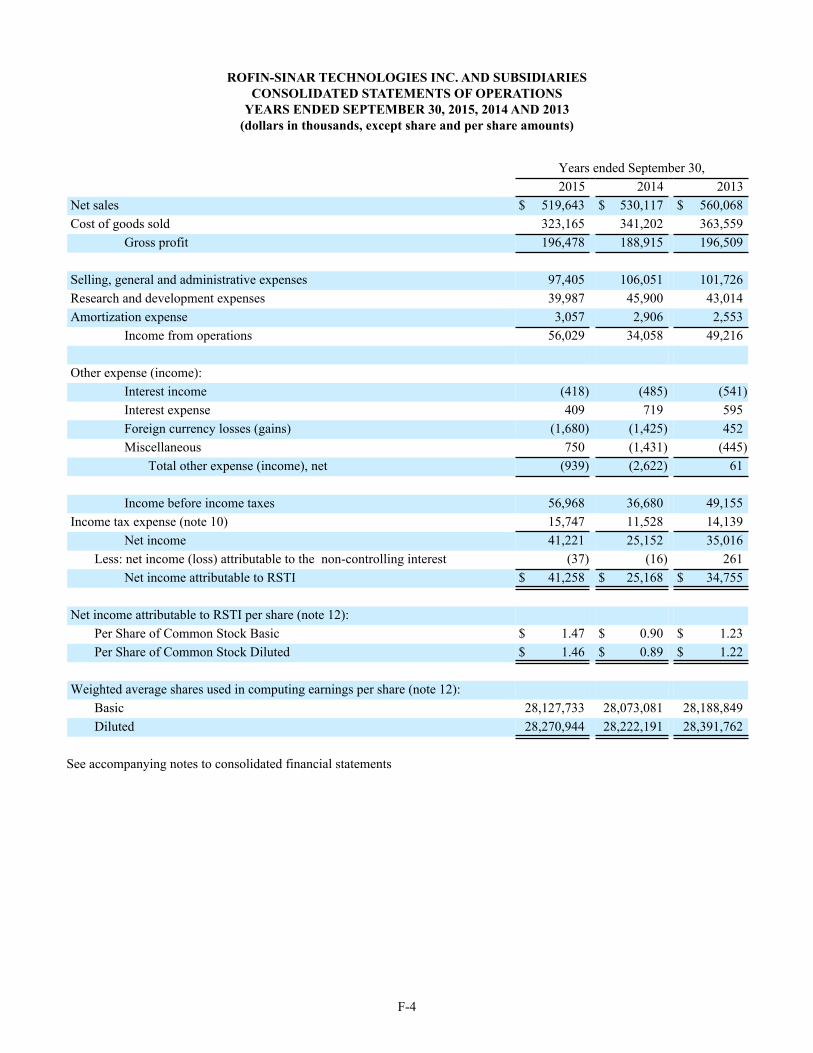
F-4
ROFIN-SINAR TECHNOLOGIES INC. AND SUBSIDIARIESCONSOLIDATED STATEMENTS OF OPERATIONS
YEARS ENDED SEPTEMBER 30, 2015, 2014 AND 2013(dollars in thousands, except share and per share amounts)
Years ended September 30, 2015 2014 2013Net sales $ 519,643 $ 530,117 $ 560,068Cost of goods sold 323,165 341,202 363,559
Gross profit 196,478 188,915 196,509
Selling, general and administrative expenses 97,405 106,051 101,726Research and development expenses 39,987 45,900 43,014Amortization expense 3,057 2,906 2,553
Income from operations 56,029 34,058 49,216
Other expense (income): Interest income (418) (485) (541)Interest expense 409 719 595Foreign currency losses (gains) (1,680) (1,425) 452Miscellaneous 750 (1,431) (445)
Total other expense (income), net (939) (2,622) 61
Income before income taxes 56,968 36,680 49,155Income tax expense (note 10) 15,747 11,528 14,139
Net income 41,221 25,152 35,016Less: net income (loss) attributable to the non-controlling interest (37) (16) 261
Net income attributable to RSTI $ 41,258 $ 25,168 $ 34,755
Net income attributable to RSTI per share (note 12): Per Share of Common Stock Basic $ 1.47 $ 0.90 $ 1.23Per Share of Common Stock Diluted $ 1.46 $ 0.89 $ 1.22
Weighted average shares used in computing earnings per share (note 12): Basic 28,127,733 28,073,081 28,188,849Diluted 28,270,944 28,222,191 28,391,762
See accompanying notes to consolidated financial statements
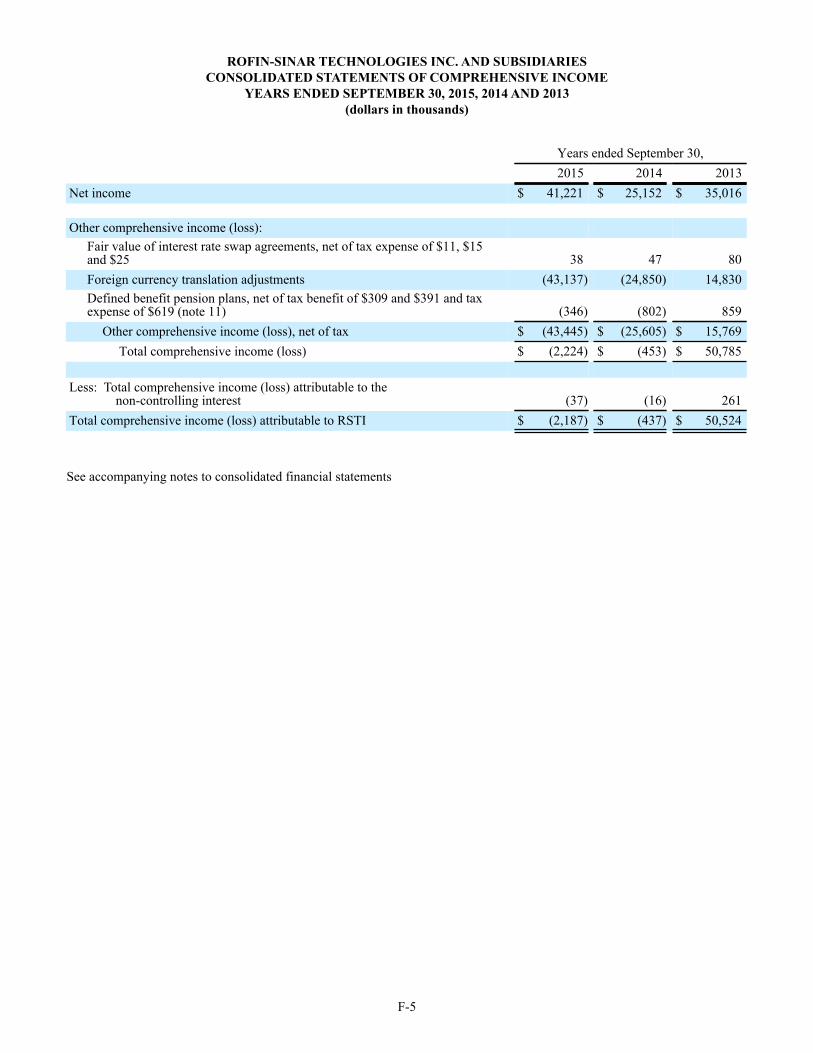
F-5
ROFIN-SINAR TECHNOLOGIES INC. AND SUBSIDIARIESCONSOLIDATED STATEMENTS OF COMPREHENSIVE INCOME
YEARS ENDED SEPTEMBER 30, 2015, 2014 AND 2013(dollars in thousands)
Years ended September 30, 2015 2014 2013Net income $ 41,221 $ 25,152 $ 35,016
Other comprehensive income (loss):Fair value of interest rate swap agreements, net of tax expense of $11, $15and $25 38 47 80Foreign currency translation adjustments (43,137) (24,850) 14,830Defined benefit pension plans, net of tax benefit of $309 and $391 and taxexpense of $619 (note 11) (346) (802) 859
Other comprehensive income (loss), net of tax $ (43,445) $ (25,605) $ 15,769 Total comprehensive income (loss) $ (2,224) $ (453) $ 50,785
Less: Total comprehensive income (loss) attributable to the non-controlling interest (37) (16) 261Total comprehensive income (loss) attributable to RSTI $ (2,187) $ (437) $ 50,524
See accompanying notes to consolidated financial statements

F-6
ROFIN-SINAR TECHNOLOGIES INC. AND SUBSIDIARIESCONSOLIDATED STATEMENTS OF STOCKHOLDERS’ EQUITY
YEARS ENDED SEPTEMBER 30, 2015, 2014 AND 2013(dollars in thousands, except share data)
Number ofCommon
SharesOutstanding
CommonStock
Par Value
AdditionalPaid-inCapital
RetainedEarnings
AccumulatedOther
ComprehensiveIncome (Loss)
TreasuryStock
ROFIN-SINAR
TechnologiesStockholders’
Equity
Non-Controlli
ngInterests
TotalEquity
BALANCES at September 30, 2012 28,072,964 $ 325 $ 223,339 $ 428,053 $ (4,236) $ (158,904) $ 488,577 $ 5,342 $ 493,919
Total comprehensive income (loss) 34,755 15,769 — 50,524 261 50,785
Purchase of non-controlling interest — — (2,332) — — — (2,332) (1,951) (4,283)
Common stock issued in connection withStock Incentive Plans 230,450 2 7,117 — — — 7,119 — 7,119
Purchases of treasury stock (179,145) — — — — (4,122) (4,122) — (4,122)
BALANCES at September 30, 2013 28,124,269 $ 327 $ 228,124 $ 462,808 $ 11,533 $ (163,026) $ 539,766 $ 3,652 $ 543,418
Total comprehensive income (loss) 25,168 (25,605) — (437) (16) (453)
Purchase of non-controlling interest — — (2,302) — — — (2,302) (2,730) (5,032)
Common stock issued in connection withStock Incentive Plans 158,050 2 7,010 — — — 7,012 — 7,012
Purchases of treasury stock (270,203) — — — — (6,236) (6,236) — (6,236)
BALANCES at September 30, 2014 28,012,116 $ 329 $ 232,832 $ 487,976 $ (14,072) $ (169,262) $ 537,803 $ 906 $ 538,709
Total comprehensive income (loss) 41,258 (43,445) — (2,187) (37) (2,224)
Purchase of non-controlling interest — — (69) — — — (69) (379) (448)
Common stock issued in connection withStock Incentive Plans 169,687 2 6,570 — — — 6,572 — 6,572
BALANCES at September 30, 2015 28,181,803 $ 331 $ 239,333 $ 529,234 $ (57,517) $ (169,262) $ 542,119 $ 490 $ 542,609
See accompanying notes to consolidated financial statements

F-7
ROFIN-SINAR TECHNOLOGIES INC. AND SUBSIDIARIESCONSOLIDATED STATEMENTS OF CASH FLOWS
YEARS ENDED SEPTEMBER 30, 2015, 2014 AND 2013(dollars in thousands)
Years ended September 30, 2015 2014 2013CASH FLOWS FROM OPERATING ACTIVITIES: Net income $ 41,221 $ 25,152 $ 35,016Adjustments to reconcile net income to net cash provided by operating activities:
Depreciation and amortization 16,190 17,312 15,318Issuance of restricted stock 275 292 245Provision for doubtful accounts 552 889 156Exchange rate (gains) losses (1,062) (837) 540Loss (gains) on disposal of property and equipment 566 (55) 398Stock-based compensation expenses 4,189 4,282 3,929Deferred income taxes (3,396) (2,178) (2,542)Other non-cash income — (1,000) —Change in operating assets and liabilities:
Accounts receivable, trade 2,701 (3,560) (469)Other accounts receivable 1,394 2,866 (2,698)Inventories (7,421) (1,972) 10,068Prepaid expenses and other (3,970) (2,316) 1,582Accounts payable 2,509 (653) (2,247)Income taxes payable 1,865 1,221 (1,320)Accrued liabilities and pension obligations 12,966 (3,899) (952)
Net cash provided by operating activities 68,579 35,544 57,024CASH FLOWS FROM INVESTING ACTIVITIES:
Additions to property and equipment (33,998) (10,389) (16,168)Proceeds from the sale of property and equipment 527 231 128Purchases of short-term investments (9,327) (38,671) (6,253)Proceeds from the sale of short-term and long-term investments 15,860 30,499 6,771Acquisitions — (5,891) —
Net cash used in investing activities (26,938) (24,221) (15,522)CASH FLOWS FROM FINANCING ACTIVITIES:
Proceeds from the issuance of debt 34,260 39,726 20,878Repayments to bank (23,436) (41,677) (24,869)Purchase of treasury stock — (6,236) (4,122)Issuance of common stock 2,109 2,389 2,945Excess tax benefit from stock options — 48 2Payment of contingent acquisition-related obligations (800) — —Payments to subsidiary’s minority shareholders (410) (4,911) (4,262)
Net cash provided by (used in) financing activities 11,723 (10,661) (9,428)Effect of foreign currency translation on cash (12,172) (5,858) 2,924Net increase (decrease) in cash and cash equivalents 41,192 (5,196) 34,998Cash and cash equivalents at beginning of year 128,537 133,733 98,735Cash and cash equivalents at end of year $ 169,729 $ 128,537 $ 133,733Cash paid during the year for interest $ 277 $ 355 $ 614Cash paid during the year for income taxes $ 16,082 $ 10,716 $ 21,560
See accompanying notes to consolidated financial statements
F-8
ROFIN-SINAR TECHNOLOGIES INC. AND SUBSIDIARIESNOTES TO CONSOLIDATED FINANCIAL STATEMENTS
September 30, 2015, 2014, and 2013(dollars in thousands, except per share amounts)
1. SUMMARY OF ACCOUNTING POLICIES Description of the Company and Business The primary business of ROFIN-SINAR Technologies Inc. (“ROFIN” or “RSTI” or “the Company”) is to develop, manufacture, and market industrial lasers and supplies used for material processing applications. The majority of the Company’s customers are in the machine tool, automotive, semiconductor, and electronics industries and are located in the United States, Europe, and Asia/Pacific. For the years ended September 30, 2015, 2014 and 2013, ROFIN generated approximately 58% , 58% and 61% , respectively, of its revenues from the sale of lasers and laser systems. For the years ended September 30, 2015, 2014 and 2013, approximately 42% , 42% and 39%, respectively, of its revenues were generated from sales of after-sales services, replacement parts and components for laser products.
Principles of Consolidation and Basis of Presentation
The accompanying consolidated financial statements of RSTI and its subsidiaries were prepared in accordance with accounting principles generally accepted in the United State of America ("U.S. GAAP") and include the assets, liabilities, revenues and expenses of all majority-owned subsidiaries over which the Company exercises control and, when applicable, for which the Company has a controlling financial interest or is the primary beneficiary. All intercompany balances and transactions have been eliminated in consolidation.
Acquisitions and Formation of New Entities The Company uses the acquisition method of accounting for its acquisitions with the respective results of operations included in the consolidated results from the date of acquisition.
• Effective December 20, 2012, the Company acquired the remaining 20% of the common stock of ROFIN-BAASEL China Co., Ltd. through its wholly-owned subsidiary RSL. The Company currently holds 100% of the share capital of ROFIN-BAASEL China Co., Ltd.
• Effective January 8, 2013, the Company acquired the remaining 20% of the common stock of Nanjing Eastern Technologies Company, Ltd. (“NETC”). The Company currently holds 100% of the share capital of NETC.
• On November 18, 2013, the Company purchased the remaining 10% of the share capital of m2k-laser GmbH (“m2k“) through ROFIN-SINAR Laser GmbH ("RSL") under an option agreement between the Company and the minority shareholders of m2k. As a result of those share purchases, the Company currently holds 100% of the share capital of m2k.
• Effective December 20, 2013, the Company acquired the remaining 12% of the common stock of ROFIN-BAASEL Japan Corp. through its wholly-owned subsidiary RSL. The Company currently holds 100% of the share capital of ROFIN-BAASEL Japan Corp.
• Effective June 12, 2014, the Company acquired the remaining 5% of the common stock of DILAS Diodenlaser GmbH (“DILAS”) through its wholly-owned subsidiary ROFIN-SINAR Technologies Europe S.L.U. (“RSTE”). The Company currently holds 100% of the share capital of DILAS.
• Effective December 23, 2014, the Company acquired an additional 8.8% of the common stock of Nanjing Eastern Laser Company, Ltd. (“NELC”). The company currently holds 88.8% of the share capital of NELC.

F-9
The Company also completed the following acquisition of certain assets.
• On April 10, 2014, the Company completed the acquisition of certain assets of FiLaser USA LLC. ("FiLaser") and subsidiaries. The transaction contains all intellectual property including know-how, patents, and patent applications of FiLaser. FiLaser has developed advanced laser process technology used for precision cutting and drilling of brittle material including glass, sapphire and semiconductor substrates. The Company has held back approximately 18% of the purchase price as security for various claims. In addition, the purchase agreement also provides for potential future earn-out payments from revenues generated from certain of these intangible assets.
Fair Value The Company’s cash, short-term investments, accounts receivable and accrued liabilities are carried at amounts that reasonably approximate their fair value due to their short-term nature. The Company’s notes payable are at variable interest rates that approximate market. Fair value is defined as the price that would be received to sell an asset or paid to transfer a liability in an orderly transaction between market participants at the measurement date. Where available, fair value is based on observable market prices or parameters or derived from such prices or parameters. Where observable prices or inputs are not available, valuation models may be applied.
Assets and liabilities recorded at fair value in our balance sheet are categorized based upon the level of judgment associated with the inputs used to measure their fair values. Hierarchical levels are directly related to the amount of subjectivity associated with the inputs to fair valuation of these assets and liabilities and are as follows:
• Level 1 - Unadjusted observable quoted prices for identical instruments in active markets.
• Level 2 - Observable inputs other than those included in Level 1. For example, quoted prices for similar assets or liabilities in active markets or quoted prices for identical assets or liabilities in inactive markets.
• Level 3 - Unobservable inputs reflecting management's own assumptions about the inputs used in pricing the asset or liability.
Cash Equivalents Cash equivalents consist of financial instruments that are readily convertible into cash and have original maturities of three months or less at the time of acquisition.
Inventories Inventories are stated at the lower of cost or market, after provisions for excess and obsolete inventory salable at prices below cost. Costs are determined using the first-in, first-out and weighted average cost methods. The Company writes down inventory for estimated obsolescence or unmarketable inventory equal to the difference between the cost of inventory and the estimated market value based upon assumptions about future demand and market conditions. If actual market conditions are less favorable than those projected by management, additional inventory write-downs may be required. We also write-down up to ninety percent of our total demo inventory costs over thirty six months.
Property and Equipment Property and equipment are recorded at cost and depreciated over their estimated useful lives, except for leasehold improvements, which are amortized over the lesser of their estimated useful lives or the term of the lease. The methods of depreciation are straight line for financial reporting purposes and accelerated for income tax purposes.

F-10
Depreciable lives for financial reporting purposes are as follows:
Useful LivesBuildings 40 YearsTechnical machinery and equipment 3-10 YearsFurniture and fixtures 3-10 YearsComputers and software 3-4 YearsLeasehold improvements Term of lease
Total depreciation expense for the years ended September 30, 2015, 2014 and 2013, amounted to $13,133, $14,406, and $12,765, respectively.
The Company reviews long-lived assets for impairment whenever events or changes in circumstances indicate that the carrying amount of an asset may not be recoverable. Recoverability of assets to be held and used is measured by a comparison of the carrying amount of an asset to future undiscounted net cash flows expected to be generated by the asset. If such assets are considered to be impaired, the impairment to be recognized is measured by the amount by which the carrying amount of the assets exceeds the fair value of the assets. Assets to be disposed of are reported at the lower of the carrying amount or fair value less costs to sell.
Goodwill and Other Intangible Assets Goodwill represents the excess purchase price over the fair value of the assets acquired in connection with the Company’s acquisitions. Goodwill is required to be tested on an annual basis for potential impairment at the reporting unit level. A reporting unit is defined as the lowest level of an entity that is a business and that can be distinguished, physically and operationally and for internal reporting purposes, from other activities, operations and assets of the entity. A reporting unit can be no higher than an operating segment and would generally be lower than that level of reporting. The Company manages its business under one operating and reportable segment, and has one reporting unit. In testing for impairment, the fair value of the reporting unit, that is determined based on market data, is compared to its carrying amount. If the carrying value is below the fair value assessment, there will be no impairment loss. If the fair value is below the carrying value, then the Company is required to perform an additional test to determine the implied fair value of the goodwill. The Company performed its annual goodwill impairment testing as of September 30th and determined that the fair value of its reporting unit exceeds its carrying value and accordingly, the second step of the impairment test was not required to be performed.
Revenue Recognition and Accounts Receivable Valuation Revenue is recognized when persuasive evidence of an arrangement exists, the product has been delivered, the price is fixed or determinable and collection is probable. Terms under these arrangements are generally free on board (“FOB”) shipping point, or ex works factory (“EXW”), at which time legal title passes from the Company to the customer. Therefore, delivery is generally considered to have occurred upon shipment. In certain circumstances customers may negotiate different terms. In these situations, delivery is considered to have occurred once legal title has passed from the Company to the customer. This may be at delivery to the customer’s destination or acceptance by the Company’s customer. Sales to end-user customers and resellers typically do not have customer acceptance provisions and only certain of the original equipment manufacturer (“OEM”) customer sales have customer acceptance provisions. Customer acceptance is generally limited to performance under published product specifications. For the few product sales that have customer acceptance provisions because of higher than published specifications, (1) the products are tested and accepted by the customer at a company site or by the customer’s acceptance of the results of a testing program prior to shipment to the customer, or (2) the revenue is deferred until customer acceptance occurs. The Company records revenues net of volume discount rebates that are earned by certain OEM customers, based on sales levels, pursuant to contractual agreements.
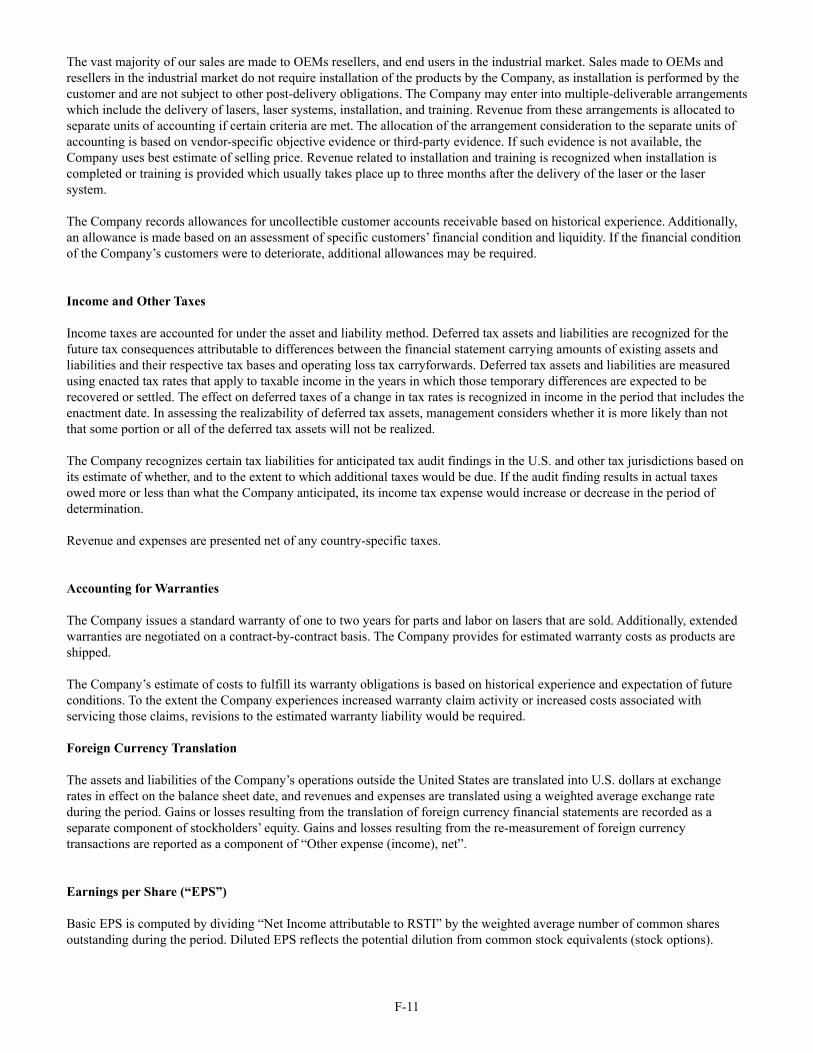
F-11
The vast majority of our sales are made to OEMs resellers, and end users in the industrial market. Sales made to OEMs and resellers in the industrial market do not require installation of the products by the Company, as installation is performed by the customer and are not subject to other post-delivery obligations. The Company may enter into multiple-deliverable arrangements which include the delivery of lasers, laser systems, installation, and training. Revenue from these arrangements is allocated to separate units of accounting if certain criteria are met. The allocation of the arrangement consideration to the separate units of accounting is based on vendor-specific objective evidence or third-party evidence. If such evidence is not available, the Company uses best estimate of selling price. Revenue related to installation and training is recognized when installation is completed or training is provided which usually takes place up to three months after the delivery of the laser or the laser system. The Company records allowances for uncollectible customer accounts receivable based on historical experience. Additionally, an allowance is made based on an assessment of specific customers’ financial condition and liquidity. If the financial condition of the Company’s customers were to deteriorate, additional allowances may be required.
Income and Other Taxes Income taxes are accounted for under the asset and liability method. Deferred tax assets and liabilities are recognized for the future tax consequences attributable to differences between the financial statement carrying amounts of existing assets and liabilities and their respective tax bases and operating loss tax carryforwards. Deferred tax assets and liabilities are measured using enacted tax rates that apply to taxable income in the years in which those temporary differences are expected to be recovered or settled. The effect on deferred taxes of a change in tax rates is recognized in income in the period that includes the enactment date. In assessing the realizability of deferred tax assets, management considers whether it is more likely than not that some portion or all of the deferred tax assets will not be realized. The Company recognizes certain tax liabilities for anticipated tax audit findings in the U.S. and other tax jurisdictions based on its estimate of whether, and to the extent to which additional taxes would be due. If the audit finding results in actual taxes owed more or less than what the Company anticipated, its income tax expense would increase or decrease in the period of determination. Revenue and expenses are presented net of any country-specific taxes.
Accounting for Warranties The Company issues a standard warranty of one to two years for parts and labor on lasers that are sold. Additionally, extended warranties are negotiated on a contract-by-contract basis. The Company provides for estimated warranty costs as products are shipped.
The Company’s estimate of costs to fulfill its warranty obligations is based on historical experience and expectation of future conditions. To the extent the Company experiences increased warranty claim activity or increased costs associated with servicing those claims, revisions to the estimated warranty liability would be required.
Foreign Currency Translation The assets and liabilities of the Company’s operations outside the United States are translated into U.S. dollars at exchange rates in effect on the balance sheet date, and revenues and expenses are translated using a weighted average exchange rate during the period. Gains or losses resulting from the translation of foreign currency financial statements are recorded as a separate component of stockholders’ equity. Gains and losses resulting from the re-measurement of foreign currency transactions are reported as a component of “Other expense (income), net”.
Earnings per Share (“EPS”) Basic EPS is computed by dividing “Net Income attributable to RSTI” by the weighted average number of common shares outstanding during the period. Diluted EPS reflects the potential dilution from common stock equivalents (stock options).

F-12
Comprehensive Income Comprehensive income consists of net income, foreign currency translation adjustments, pension liability adjustments and changes in the fair value of interest rate swap agreements, and is presented in the consolidated statements of stockholders’ equity and comprehensive income.
Research and Development Expenses Research and development costs are expensed when incurred and are net of primarily German and other European governments and European Union grants of $691, $1,555 and $2,437, received for the years ended September 30, 2015, 2014 and 2013, respectively. The Company has no future obligations under such grants.
Derivative Financial Instruments The Company uses derivative financial instruments to manage funding costs and exposures arising from fluctuations in interest rates. These derivative financial instruments consist primarily of interest rate swaps. The Company does not use derivative financial instruments for trading purposes. On the date the derivative contract is entered into, the Company designates the derivative as a hedge of the variability of cash flows to be paid related to a recognized liability (“cash flow” hedge). Changes in the fair value of a derivative that is highly effective and that is designated and qualifies as a cash flow hedge are recorded in other comprehensive income, until earnings are affected by the variability in cash flows of the designated hedged item. Interest rate swap agreements designated as hedges of the Company’s financial liabilities are recorded in the consolidated balance sheet at fair value. Adjustments to the fair value of the derivative asset or liability are recorded as an adjustment to other comprehensive income. The swap agreement is for a total notional amount of Swiss francs 2.5 million.
From time to time, the Company enters into foreign currency forward contracts and forward exchange options generally of less than one year duration to hedge a portion of its sales transactions denominated in foreign currencies. The gains and losses from these foreign currency forward contracts and forward exchange options are reflected in the consolidated statement of operations. At September 30, 2015, the Company held Japanese yen forward exchange contracts with notional amounts of Euro 1.8 million and of $0.3 million, respectively.
Operating Leases The Company leases facilities under operating leases. Building lease agreements generally include rent escalation clauses. Most of the Company’s lease agreements include renewal periods at the Company’s option. The Company recognizes scheduled rent increases on a straight-line basis over the lease term beginning with the date the Company takes possession of the leased space.
Use of Estimates Management of the Company makes a number of estimates and assumptions relating to the reporting of assets and liabilities, the disclosure of contingent assets and liabilities and the reporting of revenues and expenses, to prepare these financial statements in conformity with generally accepted U.S. accounting principles. Significant items subject to such estimates and assumptions include the valuation allowance for receivables, inventory valuation, warranty liabilities, the valuation allowance for deferred tax assets, assets and obligations related to employee benefits, and share-based payment awards. Actual results could differ from these estimates.
Stock Incentive Plans The Company measures share-based payments to employees, including grants of employee stock options, at fair value and expenses them in the consolidated statement of operations over the service period (generally the vesting period) of the grant.

F-13
Shipping and Handling Costs The Company accounts for shipping and handling fees and costs by recording revenue from shipping and handling fees in net sales and shipping and handling costs in cost of sales.
Recent Accounting Pronouncements Adopted In June 2011, the Financial Accounting Standards Board ("FASB") issued guidance requiring changes to the presentation of comprehensive income which requires entities to present the total of comprehensive income, the components of net income and the components of other comprehensive income either in a single continuous statement of comprehensive income or in two separate but consecutive statements. These changes, with retrospective application, became effective for the Company in fiscal year 2013. Other than the change in presentation to report comprehensive income as a separate but consecutive statement, these changes did not have an impact on the consolidated financial statements. In September 2011, the FASB issued Accounting Standards Update ("ASU") 2011-08, “Testing Goodwill for Impairment”. The amendments under ASU 2011-08 allow entities to first assess qualitative factors to determine whether it is necessary to perform the two-step quantitative goodwill impairment test. Under these amendments, an entity is not required to calculate the fair value of a reporting unit unless the entity determines, based on a qualitative assessment, that it is more likely than not that the reporting unit’s fair value is less than its carrying amount. The amendments included a number of events and circumstances for entities to consider in conducting the qualitative assessment. Entities now have the option to bypass the qualitative assessment for any reporting unit in any period and proceed directly to performing the first step of the two-step quantitative goodwill impairment test. ASU 2011-08 was effective for annual and interim goodwill impairment tests performed for fiscal years beginning after December 15, 2011 (fiscal year 2013 for the Company). Adoption of ASU 2011-08 did not have a material impact on the Company’s financial statements.
In December 2011, the FASB issued ASU 2011-11, “Disclosures about Offsetting Assets and Liabilities”. ASU 2011-11 amended guidance on balance sheet presentation, to converge the presentation of offsetting assets and liabilities between U.S. GAAP and IFRS. ASU 2011-11 requires that entities disclose both gross information and net information about both instruments and transactions eligible for offset in the statement of financial position and instruments and transactions subject to an agreement similar to a master netting arrangement. In January 2013, the FASB issued ASU 2013-01 which limited the scope of this guidance to derivatives, repurchase type agreements, and securities borrowing and lending transactions. The guidance from these updates became effective for the Company in fiscal year 2014. Adoption of this guidance did not have an impact on the Company's financial statements.
In February 2013, the FASB issued ASU 2013-02, “Reporting of Amounts Reclassified Out of Accumulated Other Comprehensive Income”. ASU 2013-02 requires reclassification adjustments for items that are reclassified from accumulated other comprehensive income to net income be presented on the financial statements or in a note to the financial statements. The new disclosure requirements are effective for fiscal years, and interim periods within those years, beginning after December 15, 2012. As such, ASU 2013-02 became effective October 1, 2013, for the Company and is applied prospectively. The adoption of this updated authoritative guidance resulted in an additional footnote disclosure but had no effect on our financial condition, results of operations or cash flows.
In March 2013, the FASB issued ASU No. 2013-05, “Foreign Currency Matters (Topic 830): Parent’s Accounting for the Cumulative Translation Adjustment upon De-recognition of Certain Subsidiaries or Groups of Assets within a Foreign Entity or of an Investment in a Foreign Entity”. This ASU amended guidance related to a parent company’s accounting for the release of the cumulative translation adjustment into net income upon de-recognition of certain subsidiaries or groups of assets within a foreign entity or of an investment in a foreign entity. This guidance became effective for the Company in fiscal year 2015, and is to be applied prospectively to de-recognition events occurring after the effective date. The adoption of this amendment did not have an impact on the Company's financial statements.
In July 2013, the FASB issued ASU No. 2013-11, "Presentation of an Unrecognized Tax Benefit When a Net Operating Loss Carryforward, a Similar Tax Loss, or Tax Credit Carryforward Exists". ASU 2013-11 provides guidance on financial statement presentation of an unrecognized tax benefit when a net operating loss carryforward, a similar tax loss or a tax credit carryforward exists. Under this guidance an unrecognized tax benefit, or a portion of an unrecognized tax benefit, should be presented in the financial statements as a reduction to a deferred tax asset for a net operating loss carryforward, a similar tax loss or a tax credit carryforward, except as follows. To the extent a net operating loss carryforward, a similar tax loss or a tax credit carryforward is not available at the reporting date under the tax law of the applicable jurisdiction to settle any additional income taxes that would result from the disallowance of a tax position or the tax law of the applicable jurisdiction does not

F-14
require the entity to use, and the entity does not intend to use, the deferred tax asset for such purpose, the unrecognized tax benefit should be presented in the financial statements as a liability and should not be combined with deferred tax assets. These amendments were effective for fiscal years, and interim periods within those years, beginning after December 15, 2013 (fiscal year 2015 for the Company). The adoption did not have an impact on the Company's consolidated financial statements.
Recent Accounting Pronouncements Not Yet Adopted as of September 30, 2015 In May 2014, the FASB issued ASU No. 2014-09, "Revenue from Contracts with Customers (Topic 606)." ASU 2014-09 provides guidance on revenue from contracts with customers, which implements a five step process of how an entity should recognize revenue in order to depict the transfer of promised goods or services to customers in an amount that reflects the consideration to which the entity expects to be entitled in exchange for those goods or services. This standard was initially released as effective for fiscal years beginning after December 15, 2016. In August 2015, the FASB issued ASU No. 2015-14 which defers the effective date of ASU 2014-09 by one year, with a new effective date for fiscal years beginning after December 15, 2017 (fiscal year 2019 for the Company). The new guidelines can be implemented using either of the following transition methods: (i) a full retrospective approach reflecting the application of the standard in each prior reporting period with the option to elect certain practical expedients, or (ii) a retrospective approach with the cumulative effect of initially adopting ASU 2014-09 recognized at the date of adoption. The Company is currently evaluating the impact of the new guidance on its consolidated financial statements and has not yet determined the method by which it will adopt the standard.
In August 2014, the FASB issued No. ASU 2014-15, "Presentation of Financial Statements - Going Concern (Subtopic 205-40): Disclosure of Uncertainties about an Entity’s Ability to Continue as a Going Concern". ASU 2014-15 requires management to assess an entity’s ability to continue as a going concern by incorporating and expanding upon certain principles that are currently in U.S. auditing standards. Specifically, ASU 2014-15 (1) provides a definition of the term substantial doubt, (2) requires an evaluation every reporting period including interim periods, (3) provides principles for considering the mitigating effect of management’s plans, (4) requires certain disclosures when substantial doubt is alleviated as a result of consideration of management’s plans, (5) requires an express statement and other disclosures when substantial doubt is not alleviated, and (6) requires an assessment for a period of one year after the date that the financial statements are issued (or are available to be issued). The standard will be effective for the first interim period within annual reporting periods beginning after December 15, 2016. Early application is permitted. This guidance will not have a material impact on our consolidated financial statements.
In April 2015, the FASB issued ASU No. 2015-05, "Customer's Accounting for Fees Paid in a Cloud Computing Arrangement". ASU 2015-05 provides guidance to customers about whether a cloud computing arrangement includes a software license. If the arrangement includes a software license, the customer should account for the software license element in a manner consistent with the acquisition of other software licenses. If the arrangement does not include a software license, the customer should account for the arrangement as a service contract. This guidance will be effective for annual periods, including interim periods within those annual periods, beginning after December 15, 2015 (fiscal year 2017 for the Company). The Company does not believe the pronouncement will have a material impact on the Company’s consolidated financial statements.
In April 2015, the FASB issued ASU No. 2015-03, “Simplifying the Presentation of Debt Issuance Costs”. This standard amends existing guidance to require the presentation of debt issuance cost in the balance sheet as a deduction from the carrying amount of the related debt liability instead of a deferred charge. It is effective for annual reporting periods beginning after December 15, 2015, but early adoption is permitted. The Company does not believe the pronouncement will have a material impact on the Company’s financial statements and will implement the pronouncement beginning in the period after December 15, 2015.
In July 2015, the FASB issued ASU No. 2015-11, "Simplifying the Measurement of Inventory". The new guidance does not apply to inventory that is measured using last-in, first-out or the retail inventory method. The guidance applies to all other inventory, which includes inventory that is measured using first-in, first-out or average cost and requires that inventory should be measured at the lower of cost and net realizable value. These amendments are effective for fiscal years beginning after December 15, 2016 (fiscal year 2018 for the Company). The Company is currently evaluating the impact of the new guidance on its consolidated financial statements.
Other accounting standards that have been issued by the FASB or other standards-setting bodies that do not require adoption until a future date are not expected to have a material impact on the Company's financial statements upon adoption.
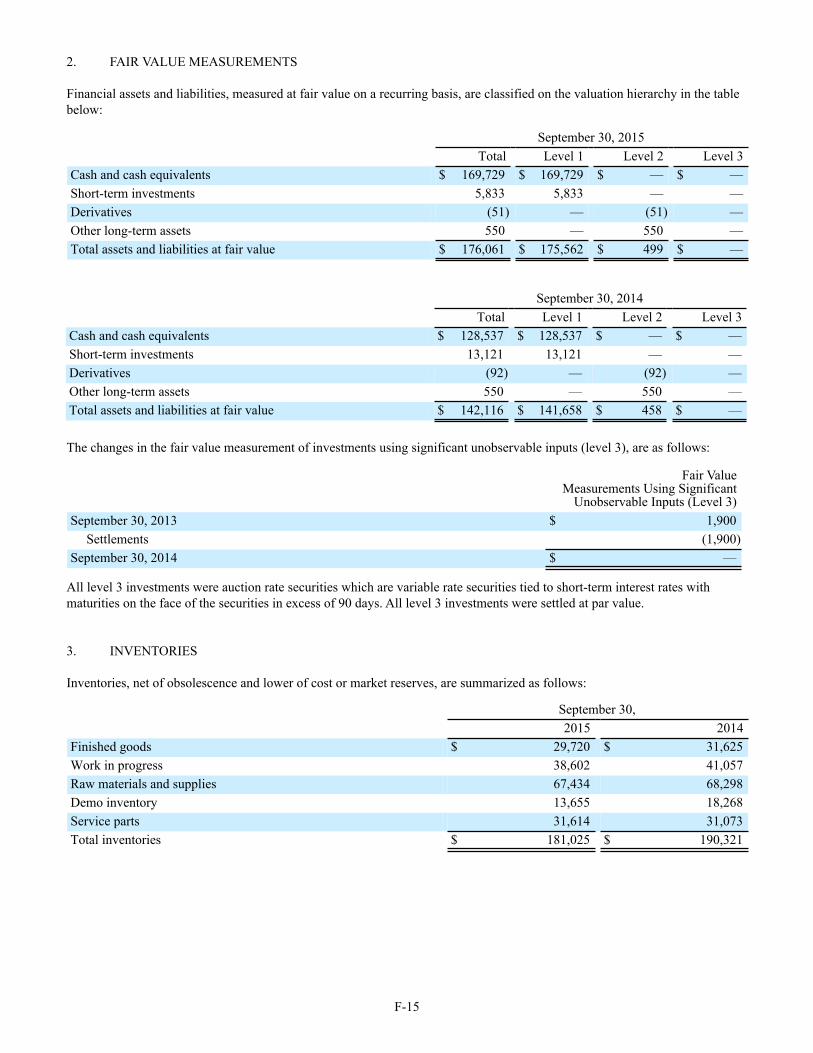
F-15
2. FAIR VALUE MEASUREMENTS Financial assets and liabilities, measured at fair value on a recurring basis, are classified on the valuation hierarchy in the table below:
September 30, 2015Total Level 1 Level 2 Level 3
Cash and cash equivalents $ 169,729 $ 169,729 $ — $ —Short-term investments 5,833 5,833 — —Derivatives (51) — (51) —Other long-term assets 550 — 550 —Total assets and liabilities at fair value $ 176,061 $ 175,562 $ 499 $ —
September 30, 2014Total Level 1 Level 2 Level 3
Cash and cash equivalents $ 128,537 $ 128,537 $ — $ —Short-term investments 13,121 13,121 — —Derivatives (92) — (92) —Other long-term assets 550 — 550 —Total assets and liabilities at fair value $ 142,116 $ 141,658 $ 458 $ —
The changes in the fair value measurement of investments using significant unobservable inputs (level 3), are as follows:
Fair ValueMeasurements Using Significant
Unobservable Inputs (Level 3)September 30, 2013 $ 1,900
Settlements (1,900)September 30, 2014 $ —
All level 3 investments were auction rate securities which are variable rate securities tied to short-term interest rates with maturities on the face of the securities in excess of 90 days. All level 3 investments were settled at par value.
3. INVENTORIES Inventories, net of obsolescence and lower of cost or market reserves, are summarized as follows:
September 30, 2015 2014Finished goods $ 29,720 $ 31,625Work in progress 38,602 41,057Raw materials and supplies 67,434 68,298Demo inventory 13,655 18,268Service parts 31,614 31,073Total inventories $ 181,025 $ 190,321

F-16
4. PROPERTY AND EQUIPMENT Property and equipment include the following:
September 30, 2015 2014Land and Buildings $ 63,302 $ 44,290Technical machinery and equipment 63,764 67,241Construction in progress 1,461 2,064Furniture and fixtures 28,461 30,385Computers and software 8,022 8,777Leasehold improvements 26,818 27,989Total property and equipment, at cost $ 191,828 $ 180,746
5. GOODWILL AND OTHER INTANGIBLE ASSETS The changes in the carrying amount of goodwill for the years ended September 30, 2015 and 2014, are as follows:
GermanyUnitedStates
Rest ofWorld Total
Balance as of September 30, 2013 $ 43,683 $ 13,297 $ 47,424 $ 104,404Additional goodwill from acquisitions — — — —Currency exchange differences (2,745) (206) (1,098) (4,049)
Balance as of September 30, 2014 $ 40,938 $ 13,091 $ 46,326 $ 100,355Additional goodwill from acquisitions — — — —Currency exchange differences (4,326) (325) (2,163) (6,814)
Balance as of September 30, 2015 $ 36,612 $ 12,766 $ 44,163 $ 93,541
The carrying values of other intangible assets are as follows:
September 30, 2015 September 30, 2014
GrossCarryingAmount
AccumulatedAmortization
GrossCarryingAmount
AccumulatedAmortization
Amortized intangible assets: Patents $ 16,985 $ 9,151 $ 17,947 $ 8,721Customer base 17,220 16,451 18,404 16,883Other 23,527 17,363 22,101 17,136Total $ 57,732 $ 42,965 $ 58,452 $ 42,740
Patents are amortized on a straight-line basis over the life of the patent which ranges from 1 to 20 years. Customer base is amortized on a straight-line basis over seven years. Other intangible assets, mainly comprised of software and unpatented technology, are amortized on a straight-line basis between 1 and 16 years. Amortization expense for the years ended September 30, 2015, 2014 and 2013, was $3,057, $2,906 and $2,553, respectively.

F-17
At September 30, 2015, estimated amortization expense of existing intangible assets for the next five fiscal years based on the average exchange rates as of September 30, 2015, is as follows:
AmortizationExpense
2016 $ 2,7002017 2,3002018 1,9002019 1,2002020 1,000
6. ACCRUED LIABILITIES Accrued liabilities are comprised of the following:
September 30, 2015 2014Employee compensation $ 24,314 $ 21,822Warranty reserves 10,913 10,778Invoices to be received 4,343 4,991Customer deposits 16,188 12,379Other 14,228 13,174Total accrued liabilities $ 69,986 $ 63,144
The Company provides for the estimated costs of product warranties when revenue is recognized. The estimate of costs to fulfill warranty obligations is based on historical experience and expectation of future conditions.
The change in warranty reserves for the years ended September 30, 2015 and 2014, are as follows:
Balance as of September 30, 2013 $ 12,301Additional accruals for warranties during the period 5,105Usage during the period (6,074)Currency translation (554)
Balance as of September 30, 2014 $ 10,778Additional accruals for warranties during the period 3,365Usage during the period (2,351)Currency translation (879)
Balance as of September 30, 2015 $ 10,913
7. LINES OF CREDIT The Company maintains $20,000 in short-term lines of credit in the U.S. As of September 30, 2015 and 2014, $20,000 remained unused and available for future use. In addition, the Company’s non-U.S. subsidiaries have short-term credit lines amounting to $43,670, which allow them to borrow in the applicable local currency. At September 30, 2015 and 2014, direct borrowings under these agreements totaled $3,932 and $1,555, respectively. Additionally, $2,244 and $2,030 were used for bank guarantees under those lines of credit as of September 30, 2015 and 2014, respectively. The remaining unused portion of the lines of credit at September 30, 2015, was $37,494, in aggregate. Interest rates vary from 0.54% to 2.60%, depending upon the country and the usage made of the available credit.

F-18
Furthermore, the Company also maintains credit lines specific to bank guarantees amounting to $12,180 and $13,764 as of September 30, 2015 and 2014, respectively, of which $4,656 and $2,696 was used as of September 30, 2015 and 2014, respectively.
The Company is subject to financial covenants under some of these lines of credit, which could restrict the Company from drawing money under them.
8. LONG-TERM DEBT Long-term debt included in the Consolidated Balance Sheets is comprised of the following:
September 30,Description 2015 20142.53% Term loan due 2015 $ — $ 7581.85% Term loan due 2018 2,561 3,1571.7% Term loan due 2017 2,794 3,1572.6% Term loan due 2016 — 3,1391.0% State of Connecticut Term loan due 2023 2,850 3,0001.3% Term loan due 2024 11,174 — Total long-term debt facilities 19,379 13,211Current portion of long-term debt included in line of credit and shortterm borrowings 1,294 1,700 Total long-term debt $ 18,085 $ 11,511
Principal payments of long-term debt as of September 30, 2015, are as follows:
Fiscal year ending September 30, Total2017 $ 5,4892018 2,4672019 1,7712020 1,7752021 and thereafter 6,583
$ 18,085
9. COMMITMENTS The Company leases operating facilities and equipment under various operating leases. The lease agreements require payment of real estate taxes, insurance, and maintenance expenses by the Company. Minimum lease payments for future fiscal years under non-cancellable operating leases as of September 30, 2015, are:
Fiscal year ending September 30, Total2016 $ 8,6752017 5,1712018 2,4462019 1,6202020 1,3082021 and thereafter 2,721
Rent expense charged to operations for the years ended September 30, 2015, 2014 and 2013, approximated $10,728, $10,786 and $10,733, respectively.

F-19
Purchase obligations for payments due under various types of agreements to purchase raw materials, services and other goods as of September 30, 2015, are:
Less than 1 Year $ 76,5481 - 3 Years 10,9303 - 5 Years 148More than 5 years —
10. INCOME TAXES Significant components of the income tax provision are as follows:
Years ended September 30, 2015 2014 2013Current:
United States - federal $ 3,533 $ 3,872 $ 3,985United States - state 458 478 408Foreign 15,152 9,356 12,288 Total current 19,143 13,706 16,681
Deferred: United States - federal (1,194) (1,139) (1,056)United States - state $ (82) $ (63) $ (51)Foreign (2,120) (976) (1,435)
Total deferred (3,396) (2,178) (2,542)Total income tax expense $ 15,747 $ 11,528 $ 14,139
Income before income taxes is attributable to the following geographic regions:
Years ended September 30, 2015 2014 2013United States $ 7,501 $ 5,383 $ 10,131Foreign 49,467 31,297 39,024
Total income before income taxes $ 56,968 $ 36,680 $ 49,155
The difference between actual income tax expense and the amount computed by applying the U.S. federal income tax rate is as follows:
Years ended September 30, 2015 2014 2013U.S. federal statutory tax rate 35% 35% 35%Computed “expected” tax expense $ 19,939 $ 12,838 $ 17,154Difference between U.S. and foreign statutory rates (4,320) (3,087) (3,617)Research & development credits (806) (276) (935)Adjustment of valuation allowance (225) (401) (3)Change in statutory tax rates 2 774 37Stock-based compensation 1,186 1,212 1,106Other (29) 468 397
Actual tax expense $ 15,747 $ 11,528 $ 14,139

F-20
Total income taxes for the years ended September 30, 2015, 2014 and 2013, were allocated as follows:
Years ended September 30, 2015 2014 2013Income taxes from operations $ 15,747 $ 11,528 $ 14,139Stockholders’ equity: Tax benefit applicable to the exercise of stock options — (48) (2) Tax (benefit) expense applicable to defined benefit pension plan (309) (391) 619
Tax (benefit) expense applicable to the fair value of interest swapagreements 11 15 25
Total income tax $ 15,449 $ 11,104 $ 14,781

F-21
Deferred income taxes result from temporary differences between the amount of assets and liabilities recognized for financial reporting and tax purposes. The components of net deferred income taxes are as follows:
September 30, 2015 2014Deferred income tax assets:
Foreign Net operating loss carryforwards $ 5,122 $ 5,231Inventories 6,912 5,809Pension obligations 2,676 2,984Accounts payable 85 105Accounts receivable — 100Other 627 871
Total Foreign 15,422 15,100United States:
Net operating loss carryforwards 6,425 6,970Tax credits 576 122Warranty reserve 858 918Inventories 8,121 7,312Allowance for doubtful accounts 297 272Accrued liabilities 783 911Pension obligations 2,109 1,476Property & equipment 278 —Accounts receivables 355 236Stock-based compensation expense 2,682 2,356Other 216 144
Total United States 22,700 20,717Gross deferred income tax assets 38,122 35,817Less: Valuation allowance (2,463) (2,687)
Net deferred income tax assets $ 35,659 $ 33,130Deferred income tax liabilities:
Foreign: Property & equipment (174) (400)Intangibles (2,784) (2,800)Accounts receivable (244) —Other (259) (1,084)
Total Foreign (3,461) (4,284)United States:
Other non-current assets (70) —Property & equipment — (2)Other intangibles — (158)
Total United States (70) (160)Gross deferred income tax liabilities (3,531) (4,444)Net deferred income tax assets $ 32,128 $ 28,686
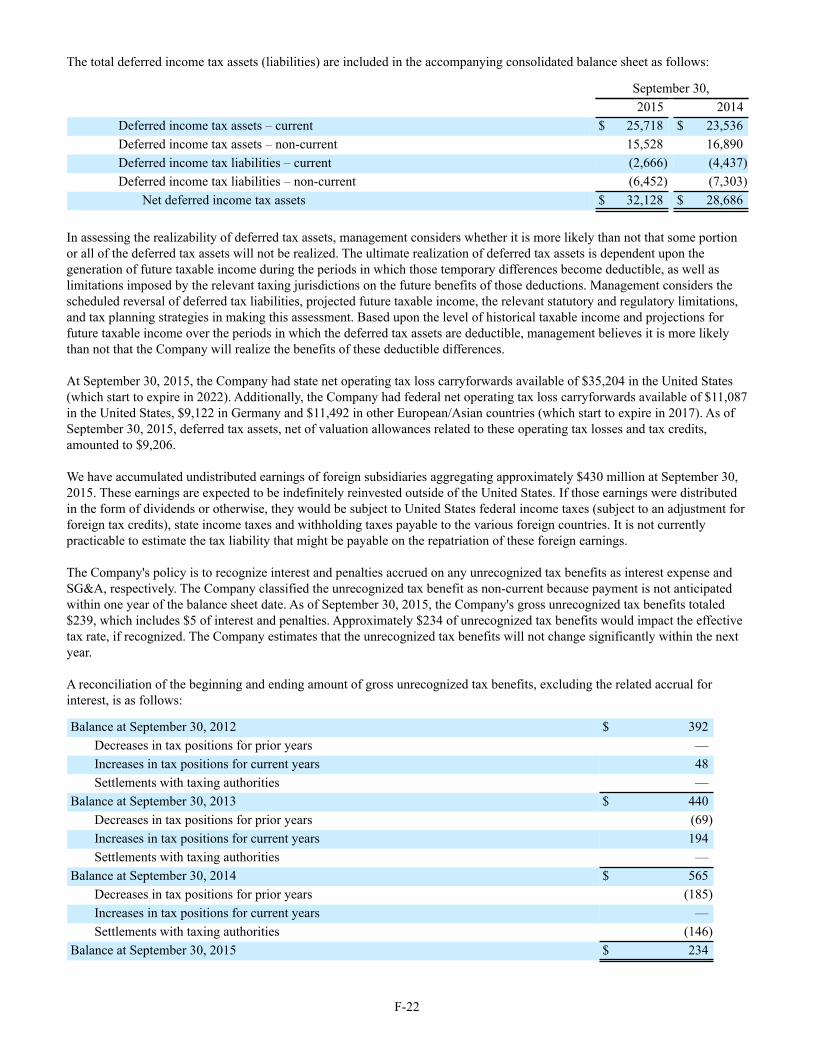
F-22
The total deferred income tax assets (liabilities) are included in the accompanying consolidated balance sheet as follows:
September 30, 2015 2014
Deferred income tax assets – current $ 25,718 $ 23,536Deferred income tax assets – non-current 15,528 16,890Deferred income tax liabilities – current (2,666) (4,437)Deferred income tax liabilities – non-current (6,452) (7,303)
Net deferred income tax assets $ 32,128 $ 28,686
In assessing the realizability of deferred tax assets, management considers whether it is more likely than not that some portion or all of the deferred tax assets will not be realized. The ultimate realization of deferred tax assets is dependent upon the generation of future taxable income during the periods in which those temporary differences become deductible, as well as limitations imposed by the relevant taxing jurisdictions on the future benefits of those deductions. Management considers the scheduled reversal of deferred tax liabilities, projected future taxable income, the relevant statutory and regulatory limitations, and tax planning strategies in making this assessment. Based upon the level of historical taxable income and projections for future taxable income over the periods in which the deferred tax assets are deductible, management believes it is more likely than not that the Company will realize the benefits of these deductible differences. At September 30, 2015, the Company had state net operating tax loss carryforwards available of $35,204 in the United States (which start to expire in 2022). Additionally, the Company had federal net operating tax loss carryforwards available of $11,087 in the United States, $9,122 in Germany and $11,492 in other European/Asian countries (which start to expire in 2017). As of September 30, 2015, deferred tax assets, net of valuation allowances related to these operating tax losses and tax credits, amounted to $9,206.
We have accumulated undistributed earnings of foreign subsidiaries aggregating approximately $430 million at September 30, 2015. These earnings are expected to be indefinitely reinvested outside of the United States. If those earnings were distributed in the form of dividends or otherwise, they would be subject to United States federal income taxes (subject to an adjustment for foreign tax credits), state income taxes and withholding taxes payable to the various foreign countries. It is not currently practicable to estimate the tax liability that might be payable on the repatriation of these foreign earnings.
The Company's policy is to recognize interest and penalties accrued on any unrecognized tax benefits as interest expense and SG&A, respectively. The Company classified the unrecognized tax benefit as non-current because payment is not anticipated within one year of the balance sheet date. As of September 30, 2015, the Company's gross unrecognized tax benefits totaled $239, which includes $5 of interest and penalties. Approximately $234 of unrecognized tax benefits would impact the effective tax rate, if recognized. The Company estimates that the unrecognized tax benefits will not change significantly within the next year. A reconciliation of the beginning and ending amount of gross unrecognized tax benefits, excluding the related accrual for interest, is as follows:
Balance at September 30, 2012 $ 392Decreases in tax positions for prior years —Increases in tax positions for current years 48Settlements with taxing authorities —
Balance at September 30, 2013 $ 440Decreases in tax positions for prior years (69)Increases in tax positions for current years 194Settlements with taxing authorities —
Balance at September 30, 2014 $ 565Decreases in tax positions for prior years (185)Increases in tax positions for current years —Settlements with taxing authorities (146)
Balance at September 30, 2015 $ 234

F-23
The Company files federal and state income tax returns in several domestic and foreign jurisdictions. In most tax jurisdictions, returns are subject to examination by the relevant tax authorities for a number of years after the returns have been filed. With limited exceptions, the Company is no longer subject to examination by the United States Internal Revenue Service for years through 2009. With respect to state and local tax jurisdictions and countries outside the United States, with limited exceptions, the Company is no longer subject to income tax audits for years before 2009.
11. EMPLOYEE BENEFIT PLANS The Company has defined benefit pension plans for the RSL and RS Inc. employees. The Company’s U.S. plan began in fiscal year 1995 and is funded. Any new employees hired after January 1, 2007, are not eligible for the RS Inc. pension plan. As is the normal practice with German companies, the German pension plan is unfunded. Any new employees, hired after the acquisition of RBL in 2000, are not eligible for the RSL pension plan. The measurement date of the Company’s pension plans is September 30.
Effective January 1, 2012, the RS Inc. defined benefit pension plan was amended to exclude highly compensated employees, as defined by the Internal Revenue Service, from receiving future years of service under the RS Inc. pension plan. A non-qualified defined benefit pension plan was created to replace the benefits lost by the employees that were otherwise excluded from the qualified pension plan. The determination of the Company’s obligation and expense for pension is dependent on the selection of certain actuarial assumptions in calculating those amounts. Assumptions are made about interest rates, expected investment return on plan assets, total turnover rates, and rates of future compensation increases. In addition, the Company’s actuarial consultants use subjective factors such as withdrawal rates and mortality rates to develop their calculations of these amounts. The Company generally reviews these assumptions at the beginning of each fiscal year. The Company is required to consider current market conditions, including changes in interest rates, in making these assumptions. The actuarial assumptions that the Company uses may differ materially from actual results due to changing market and economic conditions, higher or lower withdrawal rates or longer or shorter life spans of participants. These differences may result in a significant impact on the amount of pension benefits expense the Company has recorded or may record. Another key assumption in determining the net pension expense is the assumed discount rate to be used to discount plan obligations. The Company's U.S. plan uses a cash flow matching approach, which uses projected cash flows matched to spot rates along a high-quality corporate yield curve to determine the present value of cash flows to calculate a single equivalent discount rate. A lower discount rate increases the present value of benefit obligations and increases pension expense.
To determine the expected long-term rate of return on plan assets, the Company considers the current and expected asset allocations, as well as historical and expected returns on various categories of plan assets.

F-24
The following table sets forth the funded status of the plans at the balance sheet dates:
September 30, 2015 2014Change in benefit obligation:
Projected benefit obligation at beginning of year $ 36,441 $ 34,261Service cost 928 943Interest cost 1,062 1,282Actuarial losses (gains) 259 1,673Foreign exchange rate impacts (1,898) (1,128)Benefits paid – total (804) (590)
Projected benefit obligation at end of year 35,988 36,441Projected benefit obligation at end of year:
U.S. plans 15,810 14,275Foreign plans 20,178 22,166Projected benefit obligation at end of year 35,988 36,441
Change in plan assets: Fair value of plan assets at beginning of year 10,276 9,803Actual return on plan assets (163) 732Employer contributions 422 —Benefits paid – funded plans (440) (259)
Fair value of plan assets at end of year 10,095 10,276Fair value of plan assets at end of year:
U.S. plans 10,095 10,276Foreign plans — —Fair value of plan assets at end of year 10,095 10,276Funded status at end of year $ (25,893) * $ (26,165) *
Amounts recognized in the consolidated balance sheet Accrued benefit liability $ (25,893) $ (26,165)Accumulated other comprehensive loss (pre-tax) 9,911 9,257
Net amount recognized $ (15,982) $ (16,908) *$454 and $473 relate to expected payments in the following twelve months for the Company’s unfunded non-US plans and are therefore classified in current “Accrued liabilities” in the consolidated balance sheets as of September 30, 2015 and 2014, respectively. The following table sets forth information for pension plans with an accumulated benefit obligation in excess of plan assets:
September 30, 2015 2014Projected benefit obligation $ 35,988 $ 36,441Accumulated benefit obligation 33,383 33,716Fair value of plan assets 10,095 10,276

F-25
The components of net periodic benefit cost and other changes recognized in other comprehensive income:
September 30,2015 2014
Net periodic benefit cost Service Cost $ 928 $ 943Interest Cost 1,062 1,282Expected return on plan assets (700) (667)Amortization of net loss 405 341Amortization of prior service cost 75 75Effect of settlement (13) —
Net periodic benefit cost $ 1,757 $ 1,974
Other changes recognized in other comprehensive incomeNet loss (gain) 730 1,268Amortization of prior service cost (75) (75)
Total recognized in other comprehensive income $ 655 $ 1,193Total recognized in net periodic benefit cost and other comprehensive income $ 2,412 $ 3,167
The weighted average assumptions used in the valuation of the plan are as follows:
September 30, 2015 2014Discount rate to determine benefit obligations:
United States 4.33% 4.22%Foreign 2.42% 2.40%
Discount rate to determine net periodic benefit cost: United States 4.22% 4.66%Foreign 2.40% 3.50%
Expected return on plan assets United States 7.00% 7.00%Foreign —% —%
Rate of compensation increase United States 3.0% 3.0%Foreign 3.0% 3.0%
The Company recognizes the over (under) funded status of the defined benefit plans in the statement of financial position. The Company also recognizes, in other comprehensive income, certain gains and losses that arise during the period but are deferred under current pension accounting rules. A one percent change in the discount rate or the rate of return on plan assets would have a de minimis impact on the projected benefit obligation and the net periodic benefit cost. Expected benefit payments for each of the next five fiscal years and for the five years aggregated thereafter is as follows: $873 in 2016, $888 in 2017, $1,369 in 2018, $1,085 in 2019, $1,162 in 2020 and $8,356 thereafter.
The Company’s pension plan asset allocations at September 30, 2015 and 2014, by asset category are as follows:
2015 2014
Target
Allocation Percentage PercentageEquity Securities 50% 49% 51%Debt Securities 50% 51% 49%
Total Plan Assets 100% 100% 100%

F-26
The Company employs a total return investment approach whereby a mix of equity, debt securities and government securities are used to maximize the long-term return of plan assets for a prudent level of risk. The intent of this strategy is to minimize plan expenses by maximizing investment returns within that prudent level of risk. Furthermore, equity investments are diversified across U.S. and non-U.S. stocks as well as growth, value and small and large capitalizations. Additionally, cash balances are maintained at levels adequate to meet near-term plan expenses and benefit payments. Investment risk is measured and monitored on an ongoing basis through semi-annual investment portfolio reviews. Investments in our defined benefit plan are stated at fair value. Level 1 assets are valued using quoted market prices that represent the asset value of the shares held by the trusts. The level 2 assets are investments in pooled funds, which are valued using a model to reflect the valuation of their underlying assets that are publicly traded with observable values. The fair value of our level 3 pension plan assets are measured by compiling the portfolio holdings and independently valuing the securities in those portfolios. The fair values of our pension plan assets, by level within the fair value hierarchy, are as follows:
September 30, 2015Asset Categories Level 1 Level 2 Level 3 TotalEquity Securities
Small Cap $ — $ 217 $ — $ 217Mid Cap — 474 — 474Large Cap — 1,770 — 1,770Total Market Stock — 808 — 808International — 1,444 — 1,444Emerging Markets — 230 — 230
Debt Securities Bonds & Mortgages — 4,082 — 4,082Inflation Protected — 520 — 520High Yield — 510 — 510Money Market — 40 — 40
Total Plan Assets $ — $ 10,095 $ — $ 10,095
September 30, 2014Asset Categories Level 1 Level 2 Level 3 TotalEquity Securities
Small Cap $ — $ 209 $ — $ 209Mid Cap — 494 — 494Large Cap — 1,853 — 1,853Total Market Stock — 867 — 867International — 1,441 — 1,441Emerging Markets — 344 — 344
Debt Securities Bonds & Mortgages — 3,866 — 3,866Inflation Protected — 519 — 519High Yield — 514 — 514Money Market — 169 — 169
Total Plan Assets $ — $ 10,276 $ — $ 10,276 RS Inc., RB Inc., PRC, Lee Laser, ROFIN-BAASEL Canada Ltd., DILAS Diode Laser, Inc. and Nufern have 401(k) plans for the benefit of all eligible U.S. employees, as defined by the plan. Participating employees may contribute up to 16% of their qualified annual compensation. Those subsidiaries match 50% of the first 5 to 6% of the employees’ compensation contributed as a salary deferral. Company contributions for the years ended September 30, 2015, 2014 and 2013, were $736, $701 and $719, respectively.

F-27
12. EARNINGS PER COMMON SHARE The calculation of the weighted average number of common shares outstanding for each period is as follows:
Years ended September 30, 2015 2014 2013Weighted number of shares for basic earnings per common share 28,127,733 28,073,081 28,188,849Potential additional shares due to outstanding dilutive stock options 143,211 149,110 202,913Weighted number of shares for diluted earnings per common share 28,270,944 28,222,191 28,391,762
The weighted-average diluted shares outstanding for the years ended September 30, 2015, 2014 and 2013, excludes the dilutive effect of approximately 2,414 thousand, 2,927 thousand and 2,557 thousand stock options, respectively, since the impact of including these options in diluted earnings per share for these years was antidilutive.
13. ACCUMULATED OTHER COMPREHENSIVE INCOME (LOSS)
Accumulated other comprehensive income is comprised of the following:
September 30, 2015 2014 2013Foreign currency translation adjustment $ (50,896) $ (7,759) $ 17,091Defined benefit pension plans (net of taxes of $3,315 in 2015, $3,006 in 2014
and $2,615 in 2013) (6,597) (6,251) (5,449)Fair value of interest swap agreements (net of taxes of $7 in 2015, $18 in 2014
and $33 in 2013) (24) (62) (109)Total accumulated other comprehensive income (loss) $ (57,517) $ (14,072) $ 11,533
The changes in Accumulated Other Comprehensive Income by component, net of tax, during the years ended September 30, 2015 and 2014, are as follows:
DefinedBenefit Plans
ForeignCurrency
TranslationAdjustments
Fair Value ofInterest Swap
Agreements TotalBalance at September 30, 2014 $ (6,251) $ (7,759) $ (62) $ (14,072)
Other comprehensive income beforereclassifications — (43,137) 38 (43,099)Amounts reclassified from accumulated othercomprehensive income (346) — — (346)
Balance at September 30, 2015 $ (6,597) $ (50,896) $ (24) $ (57,517)
DefinedBenefit Plans
ForeignCurrency
TranslationAdjustments
Fair Value ofInterest Swap
Agreements TotalBalance at September 30, 2013 $ (5,449) $ 17,091 $ (109) $ 11,533
Other comprehensive income beforereclassifications — (24,850) 47 (24,803)Amounts reclassified from accumulated othercomprehensive income (802) — — (802)
Balance at September 30, 2014 $ (6,251) $ (7,759) $ (62) $ (14,072)

F-28
F-28
The reclassifications out of Accumulated Other Comprehensive Income for the years ended September 30, 2015 and 2014, are as follows:
September 30, 2015 September 30, 2014
Unamortized loss on defined benefit pension plans Amortization $ (655) $ (1,193) Tax effects 309 391Total reclassification for the period $ (346) $ (802)
14. TREASURY STOCK On February 5, 2014, the Board of Directors authorized the Company to initiate a share buyback of up to $25 million of the Company’s Common Stock over the next twelve months ending February 10, 2015, subject to market conditions. The shares were to be repurchased from time to time in open market transactions or privately negotiated transactions at the Company’s discretion. During the year ended September 30, 2015, the Company did not repurchase any shares of common stock.
15. RELATED PARTY TRANSACTIONS The Company had sales to its former minority shareholder in Japan amounting to $4, and $458, only in fiscal years 2014 and 2013, respectively, and purchases from the former minority shareholder only in fiscal year 2013 amounting to $29. As of September 30, 2013, the accounts receivable with the minority shareholder in Japan amounted to $5. Effective December 20, 2013, the Company acquired the remaining 12% of the common stock of ROFIN-BAASEL Japan Corp. from the minority shareholder in Japan.
The Company maintains other accounts payable to a related party in China amounting to $299 and $317 and as of September 30, 2015 and 2014, respectively. Effective December 23, 2014, the Company acquired an additional 8.8% of the common stock of NELC. The Company currently holds 88.8% of the share capital of NELC.
In fiscal year 2014, the Company had expenses of $57 mainly for purchases of materials and services, from the former minority shareholder of m2k. Effective November 18, 2013, the Company purchased the remaining 10% of the share capital of m2k through its wholly-owned subsidiary RSL under the option agreement between the Company and the minority shareholders of m2k.
Effective June 12, 2014, the Company acquired the remaining 5% of the common stock of DILAS through its wholly-owned subsidiary RSTE from the minority shareholder of DILAS.
The main facility in Starnberg is rented under a 25-year operating lease from the former minority shareholder of RBL, Mr. Baasel, who is also a member of the Board of Directors of the Company. That lease will terminate by end of December 2016. The Company paid expenses, mainly for rental expense of $735, $883 and $846 to Mr. Baasel during fiscal years 2015, 2014 and 2013, respectively.

F-29
16. GEOGRAPHIC INFORMATION Assets, revenues and income before taxes, by geographic region attributed based on the geographic location of the RSTI entities are summarized below:
ASSETS September 30, 2015 2014
North America $ 258,424 $ 246,370Germany 433,435 430,123Other 343,072 347,992Intercompany eliminations (328,440) (335,900)
Total assets $ 706,491 $ 688,585
PROPERTY AND EQUIPMENT, NET September 30, 2015 2014
North America $ 16,128 $ 16,319Germany 51,124 41,828Other 25,560 21,822Intercompany eliminations (239) (266)
Total long-lived assets $ 92,573 $ 79,703
REVENUES - TOTAL BUSINESS Years ended September 30, 2015 2014 2013
North America $ 151,835 $ 146,053 $ 157,936Germany 320,557 330,485 358,701Other 274,431 276,832 262,197Intercompany eliminations (227,180) (223,253) (218,766)
$ 519,643 $ 530,117 $ 560,068
INTERCOMPANY REVENUES Years ended September 30, 2015 2014 2013
North America $ 14,191 $ 12,602 $ 13,859Germany 159,601 148,441 147,470Other 53,388 62,210 57,437Intercompany eliminations (227,180) (223,253) (218,766)
$ — $ — $ —
EXTERNAL REVENUES Years ended September 30, 2015 2014 2013
North America $ 137,643 $ 133,450 $ 144,078Germany 160,957 182,045 211,231Other 221,043 214,622 204,759
$ 519,643 $ 530,117 $ 560,068
INCOME BEFORE INCOME TAXES Years ended September 30, 2015 2014 2013
North America $ 7,809 $ 5,490 $ 10,275Germany 22,780 5,000 19,215Other 26,379 26,190 19,665
$ 56,968 $ 36,680 $ 49,155
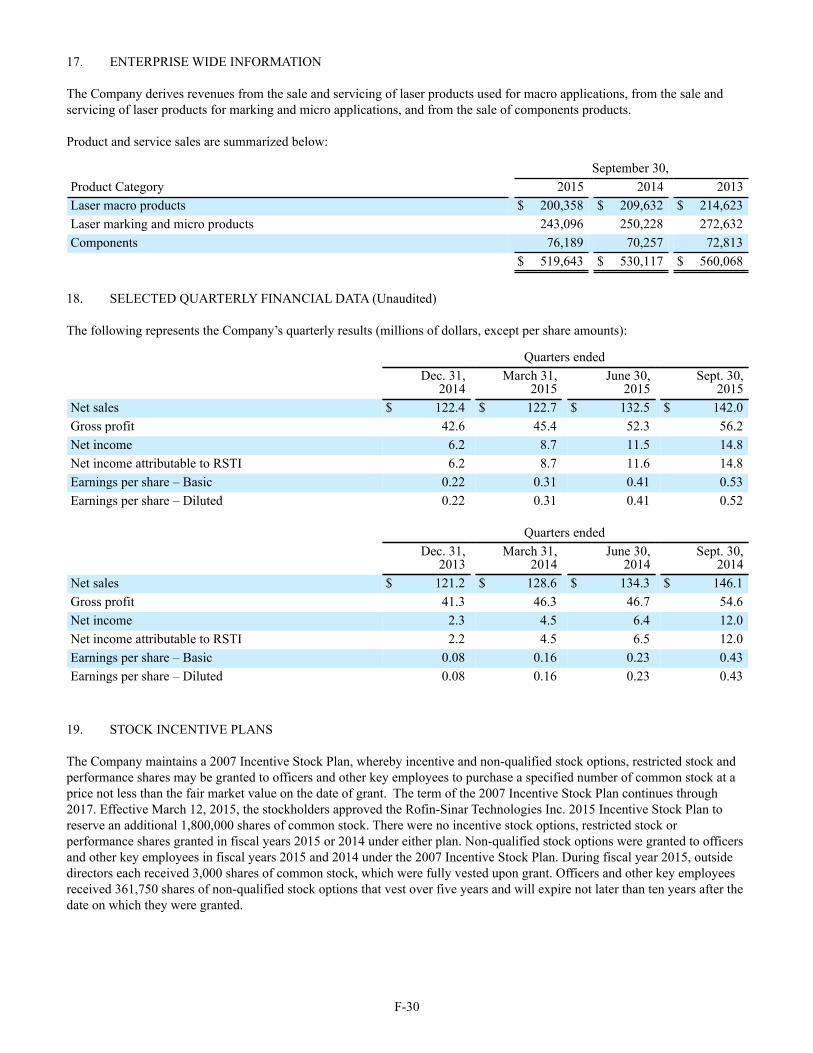
F-30
17. ENTERPRISE WIDE INFORMATION The Company derives revenues from the sale and servicing of laser products used for macro applications, from the sale and servicing of laser products for marking and micro applications, and from the sale of components products.
Product and service sales are summarized below:
September 30,Product Category 2015 2014 2013Laser macro products $ 200,358 $ 209,632 $ 214,623Laser marking and micro products 243,096 250,228 272,632Components 76,189 70,257 72,813 $ 519,643 $ 530,117 $ 560,068
18. SELECTED QUARTERLY FINANCIAL DATA (Unaudited) The following represents the Company’s quarterly results (millions of dollars, except per share amounts):
Quarters ended
Dec. 31,
2014March 31,
2015June 30,
2015Sept. 30,
2015Net sales $ 122.4 $ 122.7 $ 132.5 $ 142.0Gross profit 42.6 45.4 52.3 56.2Net income 6.2 8.7 11.5 14.8Net income attributable to RSTI 6.2 8.7 11.6 14.8Earnings per share – Basic 0.22 0.31 0.41 0.53Earnings per share – Diluted 0.22 0.31 0.41 0.52
Quarters ended
Dec. 31,
2013March 31,
2014June 30,
2014Sept. 30,
2014Net sales $ 121.2 $ 128.6 $ 134.3 $ 146.1Gross profit 41.3 46.3 46.7 54.6Net income 2.3 4.5 6.4 12.0Net income attributable to RSTI 2.2 4.5 6.5 12.0Earnings per share – Basic 0.08 0.16 0.23 0.43Earnings per share – Diluted 0.08 0.16 0.23 0.43
19. STOCK INCENTIVE PLANS The Company maintains a 2007 Incentive Stock Plan, whereby incentive and non-qualified stock options, restricted stock and performance shares may be granted to officers and other key employees to purchase a specified number of common stock at a price not less than the fair market value on the date of grant. The term of the 2007 Incentive Stock Plan continues through 2017. Effective March 12, 2015, the stockholders approved the Rofin-Sinar Technologies Inc. 2015 Incentive Stock Plan to reserve an additional 1,800,000 shares of common stock. There were no incentive stock options, restricted stock or performance shares granted in fiscal years 2015 or 2014 under either plan. Non-qualified stock options were granted to officers and other key employees in fiscal years 2015 and 2014 under the 2007 Incentive Stock Plan. During fiscal year 2015, outside directors each received 3,000 shares of common stock, which were fully vested upon grant. Officers and other key employees received 361,750 shares of non-qualified stock options that vest over five years and will expire not later than ten years after the date on which they were granted.
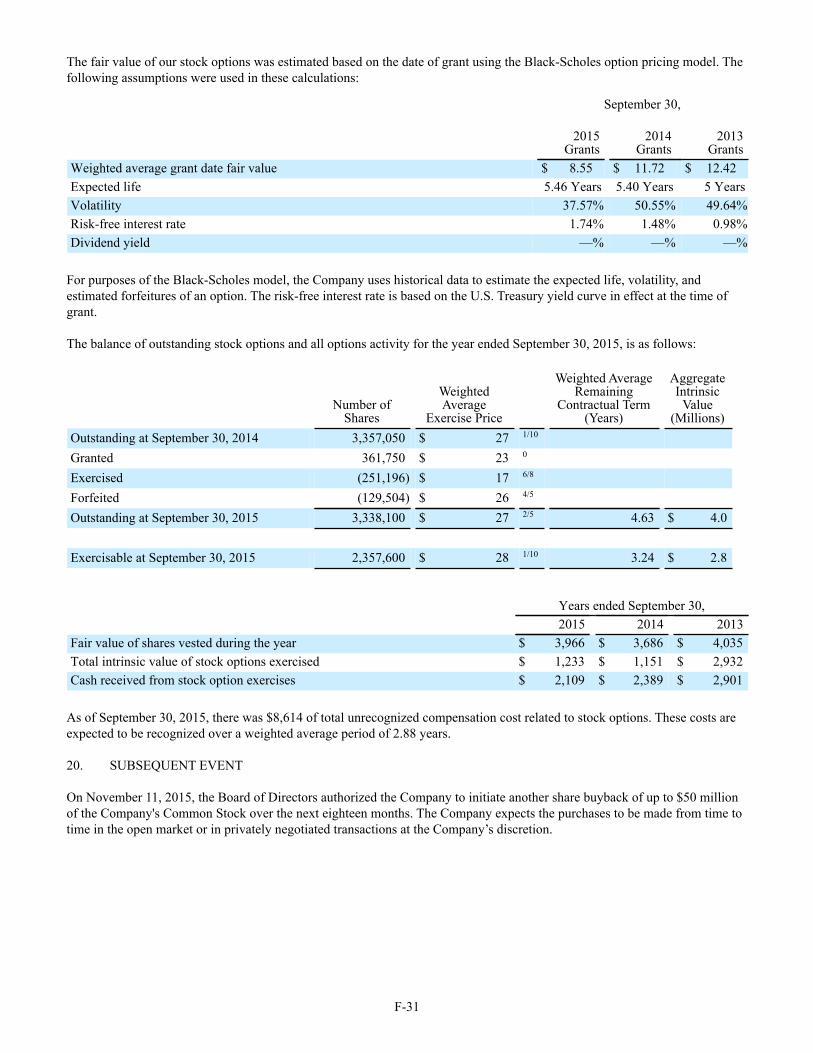
F-31
The fair value of our stock options was estimated based on the date of grant using the Black-Scholes option pricing model. The following assumptions were used in these calculations:
September 30,
2015
Grants2014
Grants2013
GrantsWeighted average grant date fair value $ 8.55 $ 11.72 $ 12.42Expected life 5.46 Years 5.40 Years 5 YearsVolatility 37.57% 50.55% 49.64%Risk-free interest rate 1.74% 1.48% 0.98%Dividend yield —% —% —%
For purposes of the Black-Scholes model, the Company uses historical data to estimate the expected life, volatility, and estimated forfeitures of an option. The risk-free interest rate is based on the U.S. Treasury yield curve in effect at the time of grant. The balance of outstanding stock options and all options activity for the year ended September 30, 2015, is as follows:
Number of
Shares
WeightedAverage
Exercise Price
Weighted AverageRemaining
Contractual Term(Years)
AggregateIntrinsic
Value(Millions)
Outstanding at September 30, 2014 3,357,050 $ 27 1/10
Granted 361,750 $ 23 0
Exercised (251,196) $ 17 6/8 Forfeited (129,504) $ 26 4/5 Outstanding at September 30, 2015 3,338,100 $ 27 2/5 4.63 $ 4.0
Exercisable at September 30, 2015 2,357,600 $ 28 1/10 3.24 $ 2.8
Years ended September 30, 2015 2014 2013Fair value of shares vested during the year $ 3,966 $ 3,686 $ 4,035Total intrinsic value of stock options exercised $ 1,233 $ 1,151 $ 2,932Cash received from stock option exercises $ 2,109 $ 2,389 $ 2,901
As of September 30, 2015, there was $8,614 of total unrecognized compensation cost related to stock options. These costs are expected to be recognized over a weighted average period of 2.88 years.
20. SUBSEQUENT EVENT
On November 11, 2015, the Board of Directors authorized the Company to initiate another share buyback of up to $50 million of the Company's Common Stock over the next eighteen months. The Company expects the purchases to be made from time to time in the open market or in privately negotiated transactions at the Company’s discretion.

F-32
SCHEDULE II
ROFIN-SINAR TECHNOLOGIES INC. AND SUBSIDIARIESValuation and Qualifying Accounts - Allowance for Doubtful Accounts
Years ended September 30, 2015, 2014 and 2013(dollars in thousands)
Balance atBeginning of
Period
Additions -Charged toCosts andExpenses (Deductions)
Balance at End ofPeriod
September 30, 2013 $ 3,915 $ 156 $ (648) $ 3,423September 30, 2014 $ 3,423 $ 889 $ (974) $ 3,338September 30, 2015 $ 3,338 $ 534 $ (593) $ 3,279
Allowance for Inventory Reserve
Years ended September 30, 2015, 2014 and 2013(dollars in thousands)
Balance atBeginning of
Period Additions
Usage forDisposalsand Scrap
Balance at End ofPeriod
September 30, 2013 $ 27,157 $ 8,890 $ (7,455) $ 28,592September 30, 2014 $ 28,592 $ 7,133 $ (5,751) $ 29,974September 30, 2015 $ 29,974 $ 3,972 $ (4,837) $ 29,109

F-33
INDEX TO EXHIBITS
Exhibit No. Exhibit3.1 Certificate of Incorporation of the Company and Form of Certificate of Amendment thereto (Incorporated
by reference to the exhibits filed with the Company’s Registration Statement on Form S-1 (File No.333-09539) which was declared effective on September 25, 1996)
3.2 By-Laws of the Company, As Amended Through November 29, 2011 (Incorporated by reference to theexhibit filed with the Company’s Annual Report on Form 10-K filed with the Securities and ExchangeCommission on November 29, 2011)
10.1 Inheritable Building Right (Erbbaurecht), dated as of March 1, 1990, between ROFIN-SINAR LaserGmbH and Lohss GmbH (in German, English summary provided) (Incorporated by reference to theexhibits filed with the Company’s Registration Statement on Form S-1 (File No. 333-09539) which wasdeclared effective on September 25, 1996)
10.2 Lease Agreement, dated August 10, 1990, between Josef and Maria Kranz and ROFIN-SINAR LaserGmbH (in German, English summary provided) (Incorporated by reference to the exhibits filed with theCompany’s Registration Statement on Form S-1 (File No. 333-09539) which was declared effective onSeptember 25, 1996)
10.3 Lease Agreement, dated March 25, 1993, between DR Group and ROFIN-SINAR, Incorporated (ConceptDrive property) (Incorporated by reference to the exhibits filed with the Company’s RegistrationStatement on Form S-1 (File No. 333-09539) which was declared effective on September 25, 1996)
10.4 ROFIN-SINAR Laser GmbH Pension Plan (in German, English summary provided) (Incorporated byreference to the exhibits filed with the Company’s Registration Statement on Form S-1 (File No.333-09539) which was declared effective on September 25, 1996) (a)
10.5 Deutsche Bank AG Commitment Letter dated August 22, 1996 (Incorporated by reference to the exhibitsfiled with the Company’s Registration Statement on Form S-1 (File No. 333-09539) which was declaredeffective on September 25, 1996)
10.6 U.S. and German Separation Agreements, dated as of June 4, 2015, among Gunther Braun, ROFIN-SINARLaser GmbH, and ROFIN-SINAR Technologies Inc. (in German, English summaryprovided) (Incorporated by reference to the exhibits filed with the Company’s Current Report on Form 8-K filed with the Securities and Exchange Commission on June 5, 2015) (a)
10.7 Lease Agreement between Carl Baasel and ROFIN-SINAR Laser GmbH (Incorporated by reference to theexhibit filed with the Company’s Current Report on Form 8-K filed with the Securities and ExchangeCommission on May 24, 2000)
10.8 2002 Equity Incentive Plan (Incorporated by reference to the exhibit filed with the Company’s AnnualReport on Form 10-K filed with the Securities and Exchange Commission on December 23, 2003) (a)
10.9 2007 Incentive Stock Plan (Incorporated by reference to the exhibit filed with the Company’s ProxyStatement on Schedule 14A filed with the Securities and Exchange Commission on January 25, 2007, andas amended by the Company's Current Report on Form 8-K filed with the Securities and ExchangeCommission on March 2, 2011) (a)
10.10 2015 Incentive Stock Plan (Incorporated by reference to the exhibit filed with the Company’s ProxyStatement on Schedule 14A filed with the Securities and Exchange Commission on March 12, 2015) (a)
10.11 Form of Non-Qualified Stock Option Agreement (Incorporated by reference in the exhibits filed with theCompany's Registration Statement on Form S-8 filed with the Securities and Exchange Commission onJune 26, 2015) (a)
10.12 Form of Incentive Stock Option Agreement (Incorporated by reference in the exhibits filed with theCompany's Registration Statement on Form S-8 filed with the Securities and Exchange Commission onJune 26, 2015) (a)
10.13 Form of Employment Agreement, dated July 1, 2015, among Thomas Merk and ROFIN-SINAR LaserGmbH, and ROFIN-SINAR Technologies, Inc. (a) (*)
10.14 Form of Employment Agreement, dated as of September 2, 1996, among Thomas Merk, CBLVerwaltungsgellschaft mbH, and ROFIN-SINAR Laser GmbH (in German, English summary provided) (a)(*)
14.1 Code of Business Ethics (Incorporated by reference to the exhibit filed with the Company’s ProxyStatement on Schedule 14A filed with the Securities and Exchange Commission on January 30, 2004)
21.1 List of Subsidiaries of the Registrant23.1 Consent of Deloitte & Touche LLP Independent Registered Public Accounting Firm

F-34
31.1 Rule 13a-14(a)/15d-14(a) Certification of Chief Executive Officer31.2 Rule 13a-14(a)/15d-14(a) Certification of Chief Financial Officer32.1 Section 1350 Certification of Chief Executive Officer32.2 Section 1356 Certification of Chief Financial Officer
101.INS XBRL Instance Document (*)101.SCH XBRL Taxonomy Extension Schema Document (*)101.CAL XBRL Taxonomy Extension Calculation Linkbase Document (*)101.DEF XBRL Taxonomy Extension Definition Linkbase Document (*)101.LAB XBRL Taxonomy Extension Label Linkbase Document (*)101.PRE XBRL Taxonomy Extension Presentation Linkbase Document (*)
(a) Management contracts and compensatory plans and arrangements required to be filed as exhibits pursuantto Item 15(c) of this Report.
(*) These exhibits are filed with the SEC only

EXHIBIT 21.1
LIST OF SUBSIDIARIES AND INVESTMENTS OF ROFIN-SINAR TECHNOLOGIES INC.
State or OtherName Jurisdiction of Incorporation
ROFIN-SINAR, Inc. Delaware, USAPRC LASER Corporation Delaware, USAPRC Laser Europe N.V. BelgiumLee Laser, Inc. Delaware, USANufern East Granby, USAROFIN-SINAR Technologies Europe S.L.U. SpainROFIN-SINAR Laser GmbH GermanyROFIN-BAASEL Japan Corp. JapanRasant-Alcotec Beschichtungstechnik GmbH GermanyBaasel Lasermed GmbH GermanyCBL Verwaltungsgesellschaft mbH GermanyROFIN-BAASEL Lasertech GmbH & Co. KG GermanyROFIN-BAASEL, Inc. Massachusetts, USAWB-PRC Laser Service GmbH GermanyOptoskand AB SwedenPMB Elektronik GmbH GermanyROFIN-BAASEL Italiana S.r.l. ItalyROFIN-BAASEL France SAS FranceROFIN-SINAR UK Ltd. United KingdomROFIN-BAASEL UK Ltd. United KingdomROFIN-BAASEL Benelux B.V. The NetherlandsROFIN-BAASEL Singapore Pte., Ltd. SingaporeROFIN-BAASEL Espana S.L.U. SpainDILAS Diodenlaser GmbH GermanyROFIN-BAASEL Taiwan Ltd. TaiwanROFIN-BAASEL Korea Co., Ltd. KoreaROFIN-BAASEL China Co., Ltd. ChinaROFIN-BAASEL Canada Ltd. CanadaDILAS Diode Laser, Inc. Delaware, USAm2k-laser GmbH GermanyCorelase Oy FinlandES Technology Ltd. United KingdomDILAS Diodelaser China Co., Ltd. ChinaNanjing Eastern Technologies Company, Ltd. ChinaNanjing Eastern Laser Co., Ltd. ChinaROFIN-LASAG AG SwitzerlandROFIN BAASEL Laser India Pvt. Ltd. India

EXHIBIT 23.1
CONSENT OF INDEPENDENT REGISTERED PUBLIC ACCOUNTING FIRM
We consent to the incorporation by reference in Registration Statement Nos. 333-205244, 333-103145, 333-157973, and 333-174082 on Form S-8 of our report dated November 30, 2015, relating to the consolidated financial statements and financial statement schedule of ROFIN-SINAR Technologies Inc. and subsidiaries, and the effectiveness of ROFIN-SINAR Technologies Inc. and subsidiaries internal control over financial reporting, appearing in this Annual Report on Form 10-K of ROFIN-SINAR Technologies Inc. for the year ended September 30, 2015.
/s/ Deloitte & Touche LLP
Detroit, MI
November 30, 2015

EXHIBIT 31.1 Rule 13a-14(a)/15d-14(a) Certification of the Chief Executive Officer
I, Thomas Merk, certify that:
1. I have reviewed this Annual Report on Form 10-K of ROFIN-SINAR Technologies Inc.
2. Based on my knowledge, this Annual Report does not contain any untrue statement of a material fact or omit to state amaterial fact necessary to make the statements made, in light of the circumstances under which such statements weremade, not misleading with respect to the period covered by this report.
3. Based on my knowledge, the financial statements, and other financial information included in this Annual Report,fairly present in all material respects the financial condition, results of operations and cash flows of the registrant asof, and for, the periods presented in this Annual Report.
4. The registrant’s other certifying officer(s) and I are responsible for establishing and maintaining disclosure controlsand procedures (as defined in Exchange Act Rules 13a-15(e) and 15d-15(e)) and internal control over financialreporting (as defined in Exchange Act Rules 13a-15(f) and 15d-15(f) for the registrant and have:
a) designed such disclosure controls and procedures, or caused such disclosure controls and procedures to bedesigned under our supervision, to ensure that material information relating to the registrant, including itsconsolidated subsidiaries, is made known to us by others within those entities, particularly during the periodin which this report is being prepared;
b) designed such internal control over financial reporting, or caused such internal control over financialreporting to be designed under our supervision, to provide reasonable assurance regarding the reliability offinancial reporting and the preparation of financial statements for external purposes in accordance withGenerally Accepted Accounting Principles;
c) evaluated the effectiveness of the registrant’s disclosure controls and procedures and presented in this reportour conclusions about the effectiveness of the disclosure controls and procedures, as of the end of the periodcovered by this report, based on such evaluation; and
d) disclosed in this report any change in the registrant’s internal control over financial reporting that occurredduring the registrant’s most recent fiscal quarter (the registrant’s fourth fiscal quarter in the case of an annualreport) that has materially affected, or is reasonably likely to materially affect, the registrant’s internal controlover financial reporting; and
5. The registrant’s other certifying officer and I have disclosed, based on our most recent evaluation of internal controlover financial reporting, to the registrant’s auditors and the audit committee of registrant’s board of directors (orpersons performing the equivalent functions):
a. all significant deficiencies and material weaknesses in the design or operation of internal control overfinancial reporting which are reasonably likely to adversely affect the registrant’s ability to record, process,summarize and report financial information; and
b. any fraud, whether or not material, that involves management or other employees who have a significantrole in the registrant’s internal control over financial reporting.
Date: November 30, 2015
/s/ Thomas MerkThomas MerkChief Executive Officer

EXHIBIT 31.2
Rule 13a-14(a)/15d-14(a) Certification of the Chief Financial Officer I, Ingrid Mittelstaedt, certify that: 1. I have reviewed this Annual Report on Form 10-K of ROFIN-SINAR Technologies Inc.
2. Based on my knowledge, this Annual Report does not contain any untrue statement of a material fact or omit to state amaterial fact necessary to make the statements made, in light of the circumstances under which such statements weremade, not misleading with respect to the period covered by this report.
3. Based on my knowledge, the financial statements, and other financial information included in this Annual Report,fairly present in all material respects the financial condition, results of operations and cash flows of the registrant asof, and for, the periods presented in this Annual Report.
4. The registrant’s other certifying officer(s) and I are responsible for establishing and maintaining disclosure controlsand procedures (as defined in Exchange Act Rules 13a-15(e) and 15d-15(e)) and internal control over financialreporting (as defined in Exchange Act Rules 13a-15(f) and 15d-15(f) for the registrant and have:
a) designed such disclosure controls and procedures, or caused such disclosure controls and procedures to bedesigned under our supervision, to ensure that material information relating to the registrant, including itsconsolidated subsidiaries, is made known to us by others within those entities, particularly during the periodin which this report is being prepared;
b) designed such internal control over financial reporting, or caused such internal control over financialreporting to be designed under our supervision, to provide reasonable assurance regarding the reliability offinancial reporting and the preparation of financial statements for external purposes in accordance withGenerally Accepted Accounting Principles;
c) evaluated the effectiveness of the registrant’s disclosure controls and procedures and presented in this reportour conclusions about the effectiveness of the disclosure controls and procedures, as of the end of the periodcovered by this report, based on such evaluation; and
d) disclosed in this report any change in the registrant’s internal control over financial reporting that occurredduring the registrant’s most recent fiscal quarter (the registrant’s fourth fiscal quarter in the case of an annualreport) that has materially affected, or is reasonably likely to materially affect, the registrant’s internal controlover financial reporting; and
5. The registrant’s other certifying officer and I have disclosed, based on our most recent evaluation of internal controlover financial reporting, to the registrant’s auditors and the audit committee of registrant’s board of directors (orpersons performing the equivalent functions):
a) all significant deficiencies and material weaknesses in the design or operation of internal control overfinancial reporting which are reasonably likely to adversely affect the registrant’s ability to record, process,summarize and report financial information; and
b) any fraud, whether or not material, that involves management or other employees who have a significant rolein the registrant’s internal control over financial reporting.
Date: November 30, 2015
/s/ Ingrid MittelstaedtIngrid MittelstaedtChief Financial Officer

EXHIBIT 32.1
Section 1350 Certification of the Chief Executive Officer In connection with the Annual Report of ROFIN-SINAR Technologies Inc. (the “Company”) on Form 10-K for the year endedSeptember 30, 2015, as filed with the Securities and Exchange Commission on the date hereof (the “Report”), I, Thomas Merk,Chief Executive Officer of the Company, certify, pursuant to 18 U.S.C. § 1350, as adopted pursuant to § 906 of the Sarbanes-Oxley Act of 2002, that:
(1) The Report fully complies with the requirements of section 13(a) or 15(d) of the Securities Exchange Act of 1934; and
(2) The information contained in the Report fairly presents, in all material respects, the financial condition and results ofoperations of the Company.
Date: November 30, 2015
/s/ Thomas MerkThomas MerkChief Executive Officer

EXHIBIT 32.2
Section 1350 Certification of the Chief Financial Officer In connection with the Annual Report of ROFIN-SINAR Technologies Inc. (the “Company”) on Form 10-K for the year endedSeptember 30, 2015, as filed with the Securities and Exchange Commission on the date hereof (the “Report”), I, IngridMittelstaedt, Chief Financial Officer of the Company, certify, pursuant to 18 U.S.C. § 1350, as adopted pursuant to § 906 of theSarbanes-Oxley Act of 2002, that:
(1) The Report fully complies with the requirements of section 13(a) or 15(d) of the Securities Exchange Act of 1934; and(2) The information contained in the Report fairly presents, in all material respects, the financial condition and results of
operations of the Company.
Date: November 30, 2015
/s/ Ingrid MittelstaedtIngrid MittelstaedtChief Financial Officer

UNITED STATES
SECURITIES AND EXCHANGE COMMISSION Washington, D.C. 20549
FORM 10-K/A (Amendment No.1)
For the fiscal year ended September 30, 2015
For the transition period from to Commission file number: 000-21377
ROFIN-SINAR TECHNOLOGIES INC. (Exact name of Registrant as specified in its charter)
Registrant’s telephone number, including area code: (734) 455-5400 Securities registered pursuant to Section 12(b) of the Act:
Securities registered pursuant to Section 12(g) of the Act: NONE Indicate by check mark if the registrant is a well-known seasoned issuer, as defined in Rule 405 of the Securities Act. Yes No Indicate by check mark if the registrant is not required to file reports pursuant to Section 13 or Section 15(d) of the Act. Yes No Indicate by check mark whether the registrant: (1) has filed all reports required to be filed by Section 13 or 15(d) of the Securities Exchange Act of 1934 during the preceding 12 months (or for such shorter period that the registrant was required to file such reports) and (2) has been subject to such filing requirements for the past 90 days. Yes No Indicate by check mark whether the registrant has submitted electronically and posted on its corporate Website, if any, every Interactive Data File required to be submitted and posted pursuant to Rule 405 of Regulation S-T during the preceding 12 months (or for such shorter period that the registrant was required to submit and post such files). Yes No Indicate by check mark if disclosure of delinquent filers pursuant to Item 405 of Regulation S-K is not contained herein, and will not be contained, to the best of registrant’s knowledge, in definitive proxy or information statements incorporated by reference in Part III of this Form 10-K or any amendment to this Form 10-K. Indicate by check mark whether the registrant is a large accelerated filer, an accelerated filer, a non-accelerated filer, or a smaller reporting company. See the definitions of “large accelerated filer,” “accelerated filer” and “smaller reporting company” in Rule 12b-2 of the Exchange Act
Large accelerated filer Accelerated filer Non-accelerated filer Smaller reporting company Indicate by check mark whether the registrant is a shell company (as defined in Rule 12b-2 of the Exchange Act). Yes No The aggregate market value of the voting and non-voting common equity held by non-affiliates of the registrant based upon the closing price of the common stock on March 31, 2015 (the last business day of the most recently completed second fiscal quarter) as reported by the NASDAQ Global Select Market was approximately $673,519,517. For the purposes hereof, “affiliates” include all executive officers and directors of the registrant. 28,360,103 shares of the registrant’s common stock, par value $0.01 per share, were outstanding as of November 25, 2015.
ANNUAL REPORT PURSUANT TO SECTION 13 OR 15(d) OF THE SECURITIES EXCHANGE ACT OF 1934
TRANSITION REPORT PURSUANT TO SECTION 13 OR 15(d) OF THE SECURITIES EXCHANGE ACT OF 1934
Delaware 38-3306461(State or other jurisdiction of incorporation or organization)
(I.R.S. Employer Identification No.)
40984 Concept Drive, Plymouth, MI 48170
(Address of principal executive offices) (Zip Code)
Title of each class Name of each exchange on which registered
Common stock, par value $0.01 per Share= The NASDAQ Global Select Market
EXPLANATORY NOTE
This Amendment No. 1 on Form 10-K/A (this “Amendment”) amends the Annual Report on Form 10-K of Rofin-Sinar Technologies, Inc.
(the “Company”) for the fiscal year ended September 30, 2015 that was filed with the Securities and Exchange Commission (“SEC”) on November 30, 2015 (the “Original Filing”; and as amended by this Amendment, “this Annual Report”). Because the Company has determined that it will not file its definitive proxy statement within 120 days of the end of its fiscal year ended September 30, 2015, the Company is filing this Amendment to include the information required by Part III and not included in the Original Filing.
In addition, pursuant to the rules of the SEC, Item 15 of Part IV of the Original Filing has been amended to contain currently dated
certifications from our Chief Executive Officer and Chief Financial Officer, as required by Sections 302 and 906 of the Sarbanes-Oxley Act of 2002 with respect to this Form 10-K/A. The currently dated certifications of our Chief Executive Officer and Chief Financial Officer are attached to this Form 10-K/A as Exhibits 31.1, 31.2, 32.1 and 32.2. Except with regard to the currently dated certifications included under said Item 15 and as set forth in Part III below, no other changes are made to the Original Filing other than the deletion of the reference on the cover of the Original Filing to the incorporation by reference of the Company’s definitive proxy statement into Part III of the Original Filing. Unless expressly stated, this Amendment does not reflect events occurring after the filing of the Original Filing, nor does it modify or update in any way the disclosures contained in the Original Filing.
- 1 -

PART III
Item 10. DIRECTORS, EXECUTIVE OFFICERS AND CORPORATE GOVERNANCE Following is a list of our current directors, together with certain information concerning each such individual.
Director Principal Occupation During Past Five Years and Certain Other Directorships Age
Class I Directors Whose Terms Expire in 2018 Jenifer Bunis Ms. Bunis has been a member of the Board of Directors since December 2015. Ms. Bunis spent 20 years at
Synrad, Inc., a well-known designer and manufacturer of laser technology, where she held a variety of positions covering many facets of the business, including sales and marketing, operations and business development. For over 14 years, she served as Executive Vice President overseeing the production, purchasing and materials management, as well as managing major OEM accounts. Most recently, Ms. Bunis served as Vice President of Business Development for Laser Mechanisms, Inc., where she was responsible for identifying and developing new strategic partners to increase the company’s brand recognition. Ms. Bunis graduated Phi Beta Kappa from the University of Rochester with a Bachelor of Science in Optics.
50
Thomas Merk Thomas Merk has been Chief Executive Officer and President of the Company since July 1, 2015 and a member
of the Board of Directors since July 1, 2015. Mr. Merk was previously the Chief Operating Officer of the Rofin Micro Business since December 2005, the Rofin Marking Business since July 2006, and a Managing Director of Carl Baasel Lasertechnik GmbH & Co. KG. since May 2000. He started his career in 1989 at Boehringer Werkzeugmaschinen Vertriebs GmbH, a machine tool company, and remained there until 2000, most recently serving as managing director. Mr. Merk holds a Master's Degree in mechanical engineering from the Technical University of Stuttgart, Germany.
53
Ralph E. Reins Mr. Reins has been a member of the Board of Directors since September 1996. Mr. Reins was a Director of
Group Dekko until June 2009 and of Weirton Steel until December 12, 2002. He was Chief Executive Officer of Qualitor Inc. from May 1999 until July 2002 and remained as Chairman of Qualitor Inc. until it was sold in December 2004. Mr. Reins has served in a multitude of executive and operational capacities including President and Chief Executive Officer of AP Parts International, Inc. from 1995 to 1997; President and Chief Executive Officer of Envirotest Systems Corp. in 1995; President of Allied Signal Automotive from 1991 through 1994; and President of United Technologies Automotive from 1990 to 1991. He was Chairman, Chief Executive Officer, President and Chief Operating Officer of Mack Truck from 1989 to 1990 and President and Chief Executive Officer of ITT Automotive from 1985 to 1989. Mr. Reins received a Bachelor of Science in Industrial/Operations Engineering from the University of Michigan. Mr. Reins is a member of the Company's Audit, Compensation, and Nominating Committees. In 2013, Mr. Reins was elected as our Lead Independent Director.
75
Class II Directors Whose Terms Expire in 2016 (up for re-election at the next annual meeting) Carl F. Baasel Mr. Baasel became a member of the Board of Directors in October 2000, following the Company's acquisition
of a majority stake in Carl Baasel Lasertechnik GmbH, a company that Mr. Baasel founded in 1975. Mr. Baasel served as that company's Managing Director until September 2001, when it was transformed into a limited partnership under the name "Carl Baasel Lasertechnik GmbH & Co. KG". From September 2001 until June 2008, Mr. Baasel has served as Managing Director of this limited partnership, which is a fully owned subsidiary of the Company. Mr. Baasel holds a Master's Degree in Physics from the Technical University of Munich.
74
- 2 -
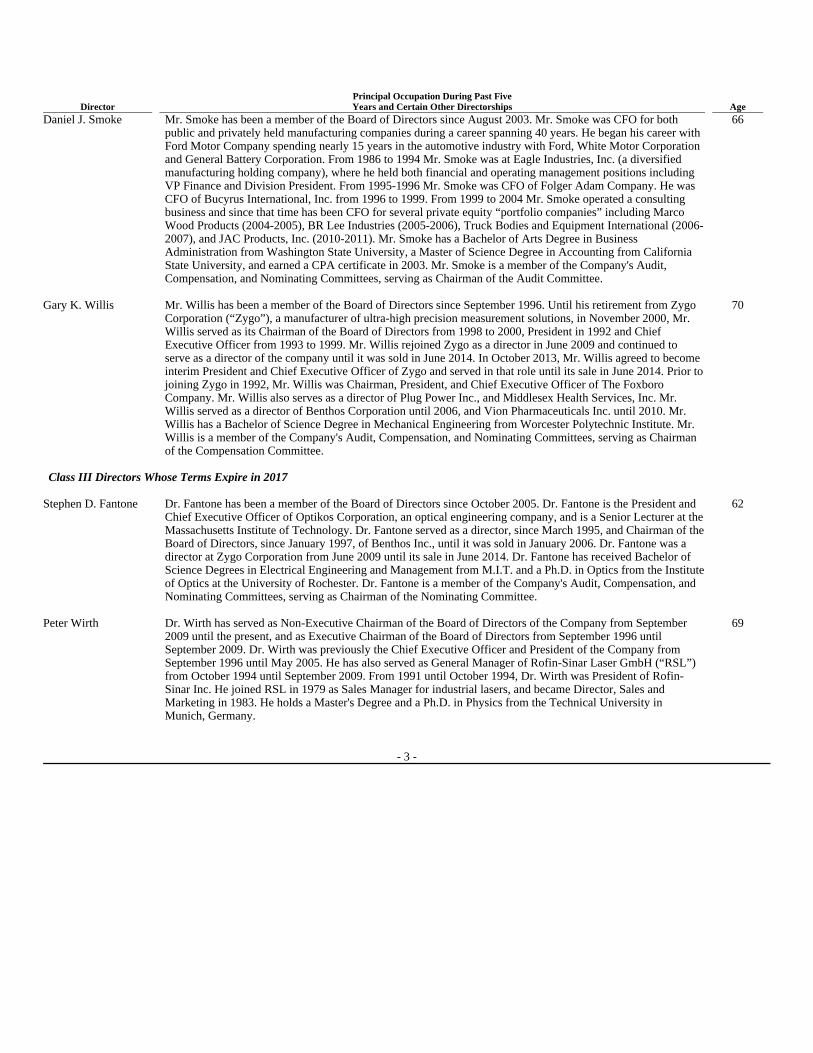
Director Principal Occupation During Past Five Years and Certain Other Directorships Age
Daniel J. Smoke Mr. Smoke has been a member of the Board of Directors since August 2003. Mr. Smoke was CFO for both public and privately held manufacturing companies during a career spanning 40 years. He began his career with Ford Motor Company spending nearly 15 years in the automotive industry with Ford, White Motor Corporation and General Battery Corporation. From 1986 to 1994 Mr. Smoke was at Eagle Industries, Inc. (a diversified manufacturing holding company), where he held both financial and operating management positions including VP Finance and Division President. From 1995-1996 Mr. Smoke was CFO of Folger Adam Company. He was CFO of Bucyrus International, Inc. from 1996 to 1999. From 1999 to 2004 Mr. Smoke operated a consulting business and since that time has been CFO for several private equity “portfolio companies” including Marco Wood Products (2004-2005), BR Lee Industries (2005-2006), Truck Bodies and Equipment International (2006-2007), and JAC Products, Inc. (2010-2011). Mr. Smoke has a Bachelor of Arts Degree in Business Administration from Washington State University, a Master of Science Degree in Accounting from California State University, and earned a CPA certificate in 2003. Mr. Smoke is a member of the Company's Audit, Compensation, and Nominating Committees, serving as Chairman of the Audit Committee.
66
Gary K. Willis Mr. Willis has been a member of the Board of Directors since September 1996. Until his retirement from Zygo
Corporation (“Zygo”), a manufacturer of ultra-high precision measurement solutions, in November 2000, Mr. Willis served as its Chairman of the Board of Directors from 1998 to 2000, President in 1992 and Chief Executive Officer from 1993 to 1999. Mr. Willis rejoined Zygo as a director in June 2009 and continued to serve as a director of the company until it was sold in June 2014. In October 2013, Mr. Willis agreed to become interim President and Chief Executive Officer of Zygo and served in that role until its sale in June 2014. Prior to joining Zygo in 1992, Mr. Willis was Chairman, President, and Chief Executive Officer of The Foxboro Company. Mr. Willis also serves as a director of Plug Power Inc., and Middlesex Health Services, Inc. Mr. Willis served as a director of Benthos Corporation until 2006, and Vion Pharmaceuticals Inc. until 2010. Mr. Willis has a Bachelor of Science Degree in Mechanical Engineering from Worcester Polytechnic Institute. Mr. Willis is a member of the Company's Audit, Compensation, and Nominating Committees, serving as Chairman of the Compensation Committee.
70
Class III Directors Whose Terms Expire in 2017
Stephen D. Fantone Dr. Fantone has been a member of the Board of Directors since October 2005. Dr. Fantone is the President and
Chief Executive Officer of Optikos Corporation, an optical engineering company, and is a Senior Lecturer at the Massachusetts Institute of Technology. Dr. Fantone served as a director, since March 1995, and Chairman of the Board of Directors, since January 1997, of Benthos Inc., until it was sold in January 2006. Dr. Fantone was a director at Zygo Corporation from June 2009 until its sale in June 2014. Dr. Fantone has received Bachelor of Science Degrees in Electrical Engineering and Management from M.I.T. and a Ph.D. in Optics from the Institute of Optics at the University of Rochester. Dr. Fantone is a member of the Company's Audit, Compensation, and Nominating Committees, serving as Chairman of the Nominating Committee.
62
Peter Wirth Dr. Wirth has served as Non-Executive Chairman of the Board of Directors of the Company from September
2009 until the present, and as Executive Chairman of the Board of Directors from September 1996 until September 2009. Dr. Wirth was previously the Chief Executive Officer and President of the Company from September 1996 until May 2005. He has also served as General Manager of Rofin-Sinar Laser GmbH (“RSL”) from October 1994 until September 2009. From 1991 until October 1994, Dr. Wirth was President of Rofin-Sinar Inc. He joined RSL in 1979 as Sales Manager for industrial lasers, and became Director, Sales and Marketing in 1983. He holds a Master's Degree and a Ph.D. in Physics from the Technical University in Munich, Germany.
69
- 3 -

Our executive officers and their respective positions as of the date of this Annual Report are listed below. Biographical information regarding each executive officer (other than Mr. Merk who is also a director and whose biographical information is set forth above) is set forth below.
Ingrid Mittelstaedt, age 51 Chief Financial Officer, Executive Vice President, Finance and Administration, and Treasurer
Ingrid Mittelstaedt has been Chief Financial Officer, Executive Vice President, Finance and Administration, and Treasurer since December 2005. From 1997 until December 2005, she was Head of Corporate Controlling for the Company and Head of Finance and Administration of RSL. Before joining the Company, Ms. Mittelstaedt was a Supervising Senior with KPMG in Germany. She holds a Master's Degree in Economic Sciences from the University of Buenos Aires and is an Argentinean certified public accountant.
Louis Molnar, age 62 Chief Operating Officer - North America
Louis Molnar has been Chief Operating Officer of the Rofin North American Business since July 2015. Previously, Mr. Molnar had been Chief Operating Officer of the Rofin Macro Business since December 2005. He also serves as President of Rofin-Sinar Inc., a wholly-owned subsidiary of the Company, located in Plymouth, Michigan, since August 2000 and President of Rofin-Baasel Inc., a wholly-owned subsidiary of the Company in Devens, Massachusetts since July 2003. Mr. Molnar served as President and Chief Operational Officer of GALCO Industrial Electronics, a company offering electrical and electronic control products, from July 1997 until August 2000. Prior to that date, Mr. Molnar served as Director for FANUC Robotics, where he was responsible for the entire business infrastructure and operations, as well as all engineering functions, for the automotive components and general industries markets. Mr. Molnar holds a Bachelor of Science Degree in Electrical Engineering from Oakland University and a Master's Degree in Business Administration from Michigan State University.
Ulrich Hefter, age 63 Chief Technical Officer
Ulrich Hefter has been Chief Technical Officer of the Company since March 2006. He has been Chief Technical Director of RSL since April 2001. Dr. Hefter graduated in Physics at the University of Kaiserslautern in 1981, where he worked as a Junior Scientist from 1983 onwards, after a two year stay at the University of Colorado. In 1984 he started his career as Research Manager for Laser-Optronic, a company which developed, manufactured and sold laser marking systems. In 1987 he also became responsible for the Engineering Department at Laser-Optronic. Laser-Optronic has been part of the Marking Division of RSL since 1989.
Martin Seifert, age 56 Chief Operating Officer Defense
Martin Seifert has been Chief Operating Officer of the Company's Defense Business since April 2015. He also serves as President of Nufern, a wholly-owned subsidiary of the Company, located in Hartford, Connecticut. Prior to Nufern, Mr. Seifert was President and GM of Lucent Specialty Fibers, after his successful involvement in the turnaround of the SpecTran specialty optical fiber manufacturing company and its subsequent sale to Lucent. In the early 90s Mr. Seifert started and managed a successful combined hardware and software business at Rockwell where he was also involved with merger, acquisition, and divestiture activities. Prior to that, Mr. Seifert was Chief Operating Officer of Schweitzer Engineering Labs, and manager of the specialized global high tech drives and control system service provider organization within Bucyrus-Erie. Mr. Seifert holds a B.S. degree from the University of British Columbia. Relationships Among Directors or Executive Officers
There are no family relationships among any of the directors or executive officers of the Company.
- 4 -

DIRECTOR INDEPENDENCE AND CORPORATE GOVERNANCE
Director Independence
We believe that the Company benefits from having a strong and independent Board of Directors. For a director to be considered independent, the Board must determine that the director does not have any direct or indirect material relationship with the Company that would affect his or her exercise of independent judgment. On an annual basis, the Board reviews the independence of all directors under guidelines established by NASDAQ and in light of each director's affiliations with the Company and members of management. This review considers all known relevant facts and circumstances in making an independence determination. Based on this review, the Board has made an affirmative determination that all directors, other than Dr. Wirth, and Messrs. Merk and Baasel, are independent. Mr. Merk was determined to lack independence due to his status as the Company's President and Chief Executive Officer ("CEO"). Dr. Wirth and Mr. Baasel lack independence due to their previously held positions within the Company as noted above in this Item 10 and, in the case of Mr. Baasel due to certain rental payments he receives from the Company as noted below in Item 13 "Certain Relationships and Related Transactions."
Audit Committee Financial Expert
The Board of Directors has determined that Daniel J. Smoke, Chairman of the Audit Committee, qualifies as an "audit committee financial expert" as such term is defined in the applicable Securities and Exchange Commission Audit Committee rules and that he has the requisite level of financial sophistication required under the listing standards of NASDAQ.
Code of Business Conduct and Ethics
The Board of Directors and the Company are committed to good corporate governance practices. The Company's Code of Business Conduct and Ethics requires management, including the Company's CEO, Chief Financial Officer and Controller, and employees to abide by high standards of business conduct and ethics. The Code of Business Conduct and Ethics is available in the Investors Relations section of the Company's web site at www.rofin.com
Executive Sessions of Non-Management Directors
Executive sessions of non-management directors (consisting of all independent directors) are regularly scheduled and held at each meeting of the Board of Directors.
Stockholder Communications with the Board
Any stockholder who wishes to send any communications to the Board, a particular committee of the Board or a particular director should also deliver such communications to the Secretary of the Company at 40984 Concept Drive, Plymouth, MI 48170. The Secretary is responsible for determining, in consultation with other officers of the Company, counsel, and other advisers as appropriate, which stockholder communications will be relayed to the Board.
Risk Oversight Process
Our Board of Directors has the primary responsibility for risk oversight of the Company as a whole. However, the Board has delegated primary oversight responsibility to the Audit Committee. The Audit Committee is responsible for overseeing risks associated with financial and accounting matters, including compliance with all legal and regulatory requirements and internal control over financial reporting. In addition, the Audit Committee has oversight responsibility for the Company's overall business risk management process, which includes the identification, assessment, mitigation and monitoring of key business risks on a company-wide basis. On at least an annual basis the Audit Committee reviews the key business process risks and controls of the Company, and approves the internal audit control testing plan. On a quarterly basis, the internal audit department reports the progress of the annual control testing to the Audit Committee. At the year-end meeting, the Company's internal audit department and the external auditors report their respective findings to the Audit Committee. Any significant findings are followed up on and corrected under the direction of the Audit Committee or Executive Management. The Board believes that the current leadership structure of the Board supports effective oversight of the Company's risk management processes described above by providing independent leadership at the Board committee level, with ultimate oversight by the full Board as led by the Chairman, and the President and CEO.
- 5 -
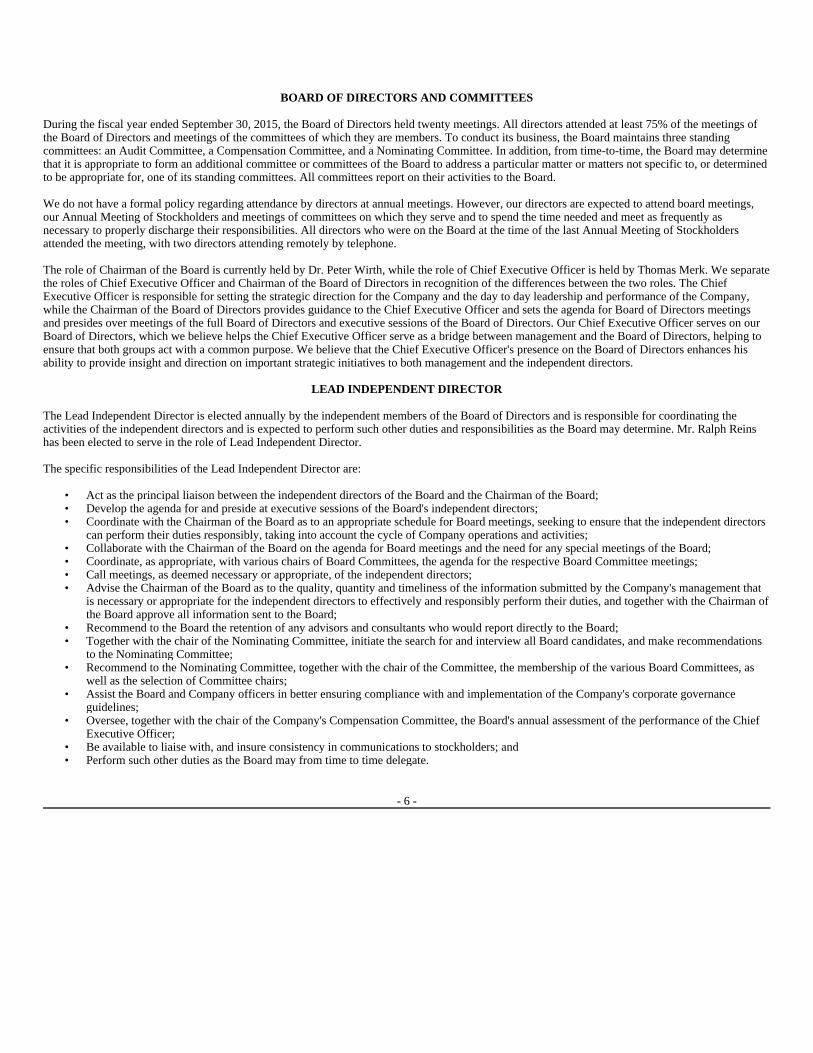
BOARD OF DIRECTORS AND COMMITTEES
During the fiscal year ended September 30, 2015, the Board of Directors held twenty meetings. All directors attended at least 75% of the meetings of the Board of Directors and meetings of the committees of which they are members. To conduct its business, the Board maintains three standing committees: an Audit Committee, a Compensation Committee, and a Nominating Committee. In addition, from time-to-time, the Board may determine that it is appropriate to form an additional committee or committees of the Board to address a particular matter or matters not specific to, or determined to be appropriate for, one of its standing committees. All committees report on their activities to the Board.
We do not have a formal policy regarding attendance by directors at annual meetings. However, our directors are expected to attend board meetings, our Annual Meeting of Stockholders and meetings of committees on which they serve and to spend the time needed and meet as frequently as necessary to properly discharge their responsibilities. All directors who were on the Board at the time of the last Annual Meeting of Stockholders attended the meeting, with two directors attending remotely by telephone.
The role of Chairman of the Board is currently held by Dr. Peter Wirth, while the role of Chief Executive Officer is held by Thomas Merk. We separate the roles of Chief Executive Officer and Chairman of the Board of Directors in recognition of the differences between the two roles. The Chief Executive Officer is responsible for setting the strategic direction for the Company and the day to day leadership and performance of the Company, while the Chairman of the Board of Directors provides guidance to the Chief Executive Officer and sets the agenda for Board of Directors meetings and presides over meetings of the full Board of Directors and executive sessions of the Board of Directors. Our Chief Executive Officer serves on our Board of Directors, which we believe helps the Chief Executive Officer serve as a bridge between management and the Board of Directors, helping to ensure that both groups act with a common purpose. We believe that the Chief Executive Officer's presence on the Board of Directors enhances his ability to provide insight and direction on important strategic initiatives to both management and the independent directors.
LEAD INDEPENDENT DIRECTOR
The Lead Independent Director is elected annually by the independent members of the Board of Directors and is responsible for coordinating the activities of the independent directors and is expected to perform such other duties and responsibilities as the Board may determine. Mr. Ralph Reins has been elected to serve in the role of Lead Independent Director.
The specific responsibilities of the Lead Independent Director are:
• Act as the principal liaison between the independent directors of the Board and the Chairman of the Board;• Develop the agenda for and preside at executive sessions of the Board's independent directors;• Coordinate with the Chairman of the Board as to an appropriate schedule for Board meetings, seeking to ensure that the independent directors
can perform their duties responsibly, taking into account the cycle of Company operations and activities;• Collaborate with the Chairman of the Board on the agenda for Board meetings and the need for any special meetings of the Board;• Coordinate, as appropriate, with various chairs of Board Committees, the agenda for the respective Board Committee meetings;• Call meetings, as deemed necessary or appropriate, of the independent directors;• Advise the Chairman of the Board as to the quality, quantity and timeliness of the information submitted by the Company's management that
is necessary or appropriate for the independent directors to effectively and responsibly perform their duties, and together with the Chairman of the Board approve all information sent to the Board;
• Recommend to the Board the retention of any advisors and consultants who would report directly to the Board;• Together with the chair of the Nominating Committee, initiate the search for and interview all Board candidates, and make recommendations
to the Nominating Committee;• Recommend to the Nominating Committee, together with the chair of the Committee, the membership of the various Board Committees, as
well as the selection of Committee chairs;• Assist the Board and Company officers in better ensuring compliance with and implementation of the Company's corporate governance
guidelines;• Oversee, together with the chair of the Company's Compensation Committee, the Board's annual assessment of the performance of the Chief
Executive Officer;• Be available to liaise with, and insure consistency in communications to stockholders; and• Perform such other duties as the Board may from time to time delegate.
- 6 -

BOARD COMMITTEES
Audit Committee
The Audit Committee's responsibilities include recommending an independent registered public accounting firm to the Board of Directors, reviewing the proposed scope of such audit, approving the audit fees, overseeing and evaluating the performance of the independent registered public accounting firm, overseeing the accounting and financial reporting policies and internal control systems of the Company, reviewing and approving transactions between the Company and its directors, officers and affiliates, considering whether the provision by the external auditors of services related to the annual audit and quarterly reviews is consistent with maintaining the auditors' independence, and reviewing annually the adequacy of the Audit Committee Charter. The Board of Directors has adopted a written Charter for the Audit Committee. A copy of the Audit Committee Charter is available in the Investor Relations section of the Company's website at www.rofin.com.
During fiscal year 2015, the members of the Audit Committee were Messrs. Reins, Smoke and Willis and Dr. Fantone. Mr. Smoke has been identified as an "audit committee financial expert" under applicable Securities and Exchange Commission ("SEC") audit committee rules. All members of the Audit Committee are independent directors within the meaning of Rule 5605(a)(2)of the NASDAQ Marketplace Rules. During fiscal year 2015, Mr. Smoke was Chairman of the Audit Committee. In fiscal year 2015, the Audit Committee held four meetings.
The Nominating Committee
The Nominating Committee is responsible for assisting the Board by actively identifying individuals qualified to become Board members and recommending to the Board of Directors nominees for election at the next annual meeting of stockholders. The Nominating Committee has two primary methods for identifying candidates (other than those proposed by the Company's stockholders, as discussed below). First, on a periodic basis, the Nominating Committee solicits ideas for possible candidates from a number of sources including members of the Board; senior level Company executives; individuals personally known to the members of the Board; and research. Second, the Nominating Committee may from time to time use its authority under its charter to retain, at the Company's expense, one or more search firms to identify candidates (and to approve such firms' fees and other retention terms). The Nominating Committee will also consider nominees recommended by stockholders. Stockholders wishing to submit nominations should notify the Company at its principal offices (Attention: Cindy Denis, Secretary, 40984 Concept Drive, Plymouth, MI 48170) of their intent to do so. To be considered by the Nominating Committee, nominations must be received on or before the deadline for receipt of stockholder proposals. Any candidate submitted by a stockholder must meet the definition of an "independent director" under NASDAQ rules.
The Nominating Committee will consider all candidates identified through the processes described above, and will evaluate each of them, including incumbents, based on the same criteria. Once the nominee has been contacted and accepts to be considered as a nominee, the Nominating Committee reviews and analyzes the nominee's resume, credentials, qualifications and characteristics to serve on the Board, and the expertise the nominee would offer the Board of Directors and the Company. While the Nominating Committee does not have a formal policy with respect to diversity, the Board and the Committee believe that it is essential that Board members represent diverse business backgrounds, experience, talents, and perspectives. In considering candidates for the Board, the Nominating Committee considers the entirety of each candidate's credentials. Director nominees are selected based on, among other things, their ability to represent the best interests of the Company's stockholders and not just one particular constituency; demonstrated sound business judgment and an inquiring mind; expertise that adds to the composition of the Board; professional experience, education, and their interest in, and capacity for understanding the complexities of, the operation of the Company; personal and professional character and actions appropriate for a Board member and the reputation of the Company; and their being prepared to participate fully in Board activities, including active membership on at least one Board committee and attendance at, and active participation in, meetings of the Board and the committee of which he or she is a member. These individuals can bring considerable experience to the impartial oversight of the Company's operations. The Board of Directors has adopted a written Charter for the Nominating Committee. A copy of the Nominating Committee Charter is available in the Investor Relations section of the Company's website at www.rofin.com.
The members of the Nominating Committee, during fiscal year 2015, were Dr. Fantone and Messrs. Reins, Smoke and Willis, each of whom is an independent director within the meaning of Rule 5605(a)(2) of the NASDAQ Marketplace Rules. Messrs. Reins, Willis, and Smoke and Dr. Fantone are not employees of the Company. During fiscal year 2015, Dr. Fantone was Chairman of the Nominating Committee. In fiscal year 2015, the Nominating Committee held nine meetings.
- 7 -
The Compensation Committee
The Compensation Committee is responsible for providing a general review of the Company's compensation and benefit plans and ensuring that they meet financial and strategic objectives.
The responsibilities of the Compensation Committee also include administering the Annual Incentive Plan and the 2007 Incentive Stock Plan and 2015 Incentive Stock Plan (all of which are described below), including selecting the officers and salaried employees to whom awards will be granted and making such awards. The Board of Directors has adopted a written charter for the Compensation Committee. A copy of the Compensation Committee Charter is available in the Investor Relations section of the Company's website at www.rofin.com. The members of the Compensation Committee are Messrs. Reins, Willis, and Smoke and Dr. Fantone, each of whom is an independent director within the meaning of Exchange Act Rule 10C-1(b)(1) and Rules 5605(a)(2) and 5605(d)(2) of the NASDAQ Marketplace Rules. During fiscal year 2015, Mr. Willis was Chairman of the Compensation Committee. In fiscal year 2015, the Compensation Committee held ten meetings.
Compensation Committee Matters
Scope of Authority
The Compensation Committee acts on behalf of the Board of Directors of the Company and, by extension, the stockholders to establish the compensation of executive officers of the Company and provides oversight of the Company's global compensation philosophy. The Compensation Committee also acts as the oversight committee with respect to our 2015 Incentive Stock Plan (including all amendments to the Plan) discussed below covering Named Executive Officers ("NEOs") and other employees. In general, the Committee may rely on recommendations from the Chief Executive Officer regarding participant selection and award determination. However, the Compensation Committee makes final determinations regarding any compensation decisions.
The Compensation Committee has the sole discretion to retain or obtain the advice of a compensation consultant, legal counsel or other adviser (each a "Compensation Adviser"), and the direct responsibility for the appointment, compensation and oversight of the work of any Compensation Adviser it retains. Additionally, the Compensation Committee's charter requires the Committee to take into account the following six factors before hiring any Compensation Adviser:
The Committee's Processes
The Compensation Committee has established a number of processes to assist it in ensuring that the Company's executive compensation program is achieving its objectives. Among those are:
• the provision of other services to the Company or its subsidiaries by the person that employs the Compensation Adviser;• the amount of fees received from the Company or its subsidiaries by the person that employs the Compensation Adviser, as a percentage of
the total revenue of the person that employs the Compensation Adviser;• the policies and procedures of the person that employs the Compensation Adviser that are designed to prevent conflicts of interest;• any business or personal relationship of the Compensation Adviser with a member of the Committee;• any stock of the Company owned by the Compensation Adviser; and• any business or personal relationship of the Compensation Adviser or the person employing the Compensation Adviser with an executive
officer of the Company.
• Meetings. The Compensation Committee meets several times each year. Compensation Committee agendas are established in consultation with the Committee Chair. The Compensation Committee also meets in executive session following regular meetings, as deemed appropriate.
• Assessment of Company Performance. The Compensation Committee uses Company performance measures in establishing total compensation ranges. The Compensation Committee considers various measures of Company performance, including revenues or net income.
• Assessment of Individual Performance. Individual performance has a strong impact on the compensation of employees, including the NEOs. During the course of each year, the Compensation Committee meets with the Chief Executive Officer to review recommendations on changes, if any, in base salary of each NEO (other than the Chief Executive Officer).
- 8 -

Compensation Committee Interlocks And Insider Participation
Messrs. Willis, Reins and Smoke and Dr. Fantone are the members of the Compensation Committee of the Board of Directors of the Company. None of such individuals is an officer of the Company. There are no compensation committee interlocks involving executive officers of the Company.
Section 16(a) Beneficial Ownership Reporting Compliance
Section 16(a) of the Securities Exchange Act of 1934, as amended, requires the Company's officers and directors, and persons who own more
than ten percent of a registered class of the Company's equity securities, to file reports of securities ownership and changes in such ownership with the Securities and Exchange Commission (the "SEC"). Officers, directors and greater than ten percent stockholders are also required by rules promulgated by the SEC to furnish the Company with copies of all Section 16(a) forms they file.
Based solely upon a review of the copies of such forms, the absence of a Form 3, Form 4 or Form 5 or written representations that no Form 4's
or 5's were required, the Company believes that, with respect to the fiscal year ended September 30, 2015, its officers, directors and greater than ten percent beneficial owners complied with all applicable Section 16(a) filing requirements.
Item 11. EXECUTIVE COMPENSATION
COMPENSATION DISCUSSION AND ANALYSIS
For the fiscal year ended September 30, 2015, which we refer to as "fiscal year 2015", our NEOs were:
Following this "Compensation Discussion and Analysis", you will find a series of tables containing specific information about the compensation earned, awarded or paid during fiscal year 2015. Please refer to those tables when considering the discussion below.
Executive Summary
In determining fiscal year 2015 compensation for our senior executives, the Compensation Committee of the Board, comprised solely of independent directors, considered the operating plans and targets established by management for the fiscal year, the actual performance of the Company during that period, and the external market conditions of the Company's served markets. The Compensation Committee seeks to compensate our NEOs (and other key employees) in a way that would enable us to retain them as our senior management team through the challenges and appropriately recognize their individual contributions to the Company performance, consistent with our overall business objectives and our stockholders' best interests.
• Stockholder Advisory Votes. The Committee considers the results of the most recent advisory vote of the stockholders on executive compensation in making compensation determinations and recommendations. However, the Committee is not bound by the results of an advisory vote.
• Consideration of Compensation Arrangements and their Relationship to the Encouragement of Risk-Taking Behavior. The Committee reviews the Company's incentive compensation arrangements to determine whether they encourage excessive risk-taking. The Committees reviews and discusses at least annually the relationships between risk management policies and practices and compensation, and evaluates compensation policies and practices that could mitigate any such risk.
• Mr. Thomas Merk, our President and Chief Executive Officer, effective July 1, 2015
• Mr. Gunther Braun, our former President and Chief Executive Officer, who was succeeded by Mr. Merk effective July 1, 2015
• Ms. Ingrid Mittelstaedt, our Chief Financial Officer and Executive Vice President of Finance and Administration
• Mr. Louis Molnar, our Chief Operating Officer - North America Business
• Dr. Ulrich Hefter, our Chief Technical Officer
• Mr. Martin Seifert, our Chief Operating Officer - Defense Business
- 9 -

In March 2015, we held a stockholder advisory vote on the compensation of our named executive officers, commonly referred to as a say-on-pay vote. Our stockholders approved the compensation of our named executive officers, with approximately 94% of stockholder votes cast in favor of our 2015 say-on-pay resolution. As we evaluated our compensation practices and talent needs throughout 2015, we were mindful of the strong support our stockholders expressed for our pay for performance compensation philosophy. As a result, the Committee decided to retain our general approach to executive compensation, with an emphasis on short- and long-term incentive compensation that rewards our most senior executives when they deliver value for our stockholders. In addition, when determining how often to hold a stockholder advisory vote on executive compensation, the Board took into account the strong preference for an annual vote expressed by our stockholders at our 2011 Annual Meeting. Accordingly, the Board determined that we will hold an annual advisory stockholder vote on the compensation of our named executive officers until the next say-on-pay frequency vote.
In making its compensation decisions for fiscal year 2015, the Compensation Committee paid particular attention to the following areas of achievement:
The Compensation Committee also took into account the following threshold, target, and maximum level metrics and the performance of the Company as compared to these metrics:
Consistent with our historical compensation practices, our fiscal year 2015 compensation program featured the following attributes:
Compensation Philosophy and Objectives
Our philosophy is to align NEO compensation with our strategic objectives, while providing competitive compensation that enables us to attract and retain top quality executive talent. To that end, the primary objectives of our NEO compensation policy are to:
• Market share gains in the fiber and ultra-short pulse laser markets;• Cost reduction achievement in fiber lasers; and• Company-wide initiatives to increase productivity and reduce expenses.
• Sales: Sales targets were weighted at 30% for the Incentive Plan with the sales target threshold being set at $540 million and maximum set at $600 million. If the Company achieved its target (set at $560 million), the potential payout would be 100%, if the Company achieved its stretch goal (set at $580 million), the potential payout would be 110%, and if the Company achieved its maximum (set at $600 million), the potential payout would be up to 150% of the incentive sales target. The actual net sales for fiscal year 2015 were approximately $519.6 million, a decrease of approximately 2% over fiscal year 2014.
• Net Income Improvement: Net income targets were weighted at 70% for the Incentive Plan. The 2015 net income threshold was set at $40 million, and the net income maximum was set at $57 million. If the Company achieved its target (set at $44.9 million), the potential payout would be 100%, if the Company achieved its stretch goal (set at $50 million), the potential payout would be 110%, and if the Company achieved its maximum (set at $57 million), the potential payout would be up to 150% of the incentive sales target. The actual net income for fiscal year 2015 was $41.3 million, an increase of approximately 64% over fiscal year 2015.
• A balanced mix of annual cash and long-term equity incentives that reward our NEOs for current performance and align their compensation with longer term performance and shareholder value creation.
• No NEO severance plans or agreements, and no "golden parachute" agreements with cash payouts for the NEOs conditioned upon a change of control.
• A structure for NEO compensation that attempts to comply with Internal Revenue Code requirements to tax deductibility.
• Option plan awards were also allocated, pursuant to our option plan, by the Compensation Committee. These awards were principally based on the performance of the NEO and certain other key employees since the Compensation Committee determined that these individuals were instrumental in achieving the Company's performance in fiscal year 2015.
• Provide compensation in a manner that allows for management to share in the risks and potential rewards of our enterprise growth.
• Maintain the common interest of NEOs and our stockholders in our long-term growth through a focus on stock options.
- 10 -

Principal Components of Executive Compensation
The principal components of our executive compensation program are:
Mix of Compensation Components
NEO compensation is based on our pay-for-performance philosophy, which rewards executive performance that correlates closely with the achievement of both shorter-term performance objectives and longer-term shareholder value. To this end, a substantial portion of our executives' annual and long-term compensation is at-risk, meaning that the ultimate value of their compensation is largely or entirely dependent on our overall growth and success, thereby aligning their interests with those of our stockholders. We believe that this benefits our Company and stockholders by ensuring that our management team has strong commitment to the health of our entire Company.
Target Pay Philosophy - How We Use Our "Comparator Group"
Our NEO compensation is reviewed against executive compensation at a designated set of publicly-traded companies (which we call our "Comparator Group"). Historically, our Comparator Group was constructed using companies that are reasonably similar to us in terms of their total revenues, manufacturing focus and profitability and for which executive officer positions were comparable to ours in terms of breadth, complexity and scope of responsibilities.
Historically, our Comparator Group included manufacturing companies with an optical, electronics and/or engineering focus having revenues ranging from $400 million to approximately $1.0 billion with return on sales of approximately 10% or higher over a three-year period. The latest NEO compensation comparative analysis was completed in December 2011. Consistent with the approximate historical practice, it is expected that the next NEO compensation comparative analysis will occur in 2016.
In December 2011, the Company hired Radford, an independent third party compensation consulting firm, to assist with the NEO compensation analysis. Radford provided an analysis of data from peer companies' proxy filings with respect to similarly situated individuals at a Comparator Group of companies and compensation survey sources. The Comparator Group in this analysis included manufacturing companies with a semiconductor and/or capital equipment background having revenues ranging from approximately $200 million to approximately $1.6 billion. The Comparator Group consisted of the following companies: Coherent Inc., Newport Corp., GSI Group, FLIR Systems, Inc., Aeroflex Inc., MTS Systems, Inc., Littlefuse Inc., Altra Holdings Inc., Blount International, Cymer, Electro Scientific Industries, FEI Company, Finisar, II-VI Inc., IPG Photonics, Measurement Specialties, MKS Instruments, NN Inc., and Veeco Instruments. This Comparator Group is consistent with the Comparator Group used in the 2007 NEO compensation analysis. The results of this third party study have shown that the Company's NEO total compensation is positioned at the 50th percentile of the Comparator Group. This report supports the Company's NEO compensation packages in comparison to the Comparator Group.
The Compensation Committee retained Radford in November 2012 to provide an update to the executive compensation review conducted in December 2011. This update was intended to present the Compensation Committee with the appropriate facts and data to make decisions regarding executive compensation.
The Compensation Committee retained Radford in fiscal year 2015 to advise the Committee on the appropriate compensation as the Company transitioned to a new Chief Executive Officer, including change of control benefits for Mr. Merk and other NEOs.
The Compensation Committee evaluates the total compensation package of our NEOs against the total compensation package of NEOs in the Comparator Group. The individual components of the total package and the relative size of each component to the total compensation package are used in this consideration, although the Committee does not seek to match any particular percentile among the Comparator Group. Instead, the Committee considers information on our Comparator Group in order to get a general sense of
• Provide incentives for short-term success-oriented operation through our annual cash incentive program.
• Attract and retain individuals with the leadership and technical skills to carry the Company into the future and to grow the business and create long-term shareholder value for our stockholders.
• Base salary
• Annual cash incentive plan; and
• Long-term, equity-based incentives
- 11 -
compensation trends in our industry and the appropriateness of our NEO compensation packages. The Compensation Committee relies on proxy statements, executive compensation surveys and other published information for data on current market pay practices and trends.
Components of Executive Compensation for fiscal year 2015
As is our general philosophy, for fiscal year 2015, the Compensation Committee used a three-pronged approach to our executive compensation program: 1) base salary; 2) annual cash incentive plans; and 3) long-term equity-based compensation. We believe that this program balances the mix of cash and equity compensation, and leaves an appropriate portion of each NEOs compensation package "at-risk". Historically, executive compensation for a particular fiscal year is reviewed and finalized by the Compensation Committee during its first meeting in the then current fiscal year.
Base Salary
The Compensation Committee considers relevant market pay practices when setting executive compensation to ensure our ability to recruit and retain high caliber talent. The Compensation Committee sets base salary levels for executive officers each year based on a number of factors, including the status of the competitive marketplace for such positions, the responsibilities of the position, the experience of the individual, the individual's performance and contributions to the Company during the past year, and our desire to maintain internal equity in pay structure in relationship to other executives within the Company and against the executive compensation of our Comparator Group. Base salary is the one fixed component of our executives' total direct compensation, in contrast to incentive compensation, which is based on our performance. The Compensation Committee reviews the base salaries of executive officers annually and whenever an executive is promoted. The Compensation Committee meets with the Chief Executive Officer to review recommendations on changes, if any, in base salary of each NEO (other than the Chief Executive Officer).
The Compensation Committee reviews and approves changes in the base salary of the Chief Executive Officer. Our NEOs' base salaries trend towards the low end of the range of base salaries in our Comparator Group for that position.
For more information regarding our NEOs' base salaries for fiscal year 2015, see the "Summary Compensation Table" appearing below in this Annual Report.
Cash Incentive Plan
The Compensation Committee has established a Cash Incentive Plan for our NEOs in order to align executive compensation with the Company's revenue, operating profit and net income objectives.
Under the Cash Incentive Plan, actual bonus payouts are determined by the Compensation Committee based upon the actual performance of the NEO against the targeted goals. The Chief Executive Officer approves all individual awards under the Cash Incentive Plan except his own and the NEOs', which are approved by the Compensation Committee in its sole discretion. The Cash Incentive Plan is available to all NEOs and selected other members of the Company's senior management. Awards to the NEOs under the Cash Incentive Plan paid for fiscal year 2015 appear in the Summary Compensation Table under the "Non-Equity Incentive Plan Compensation" column. The selected participants receive incentive awards designed to focus management's attention and effort on the attainment of pre-established annual performance goals.
Target Opportunities. Each participant in the Cash Incentive Plan is assigned a target award opportunity, expressed as a percentage of the annual base salary. For fiscal years 2015 and 2014, the target award opportunity for Mr. Braun was 70% of his base salary, the target award opportunities for Messrs. Hefter, Merk, Molnar and Ms. Mittelstaedt were 50% of their base salaries, and the target award opportunity for Mr. Seifert was 40% of his base salary. After becoming the Company's Chief Executive Officer effective July 1, 2015, Mr. Merk's target award opportunity was raised to 70% of his base salary for the proportionate remaining three months of fiscal year 2015.
Pre-Established Performance Goals. For Messrs. Merk, Hefter, Molnar and Seifert, and Ms. Mittelstaedt, the performance goals are based upon consolidated revenues and consolidated net income for the fiscal year. In addition, Messrs. Molnar's and Seifert's performance goals include pre-established individual goals which are determined to be important in relationship to the position they maintain within the Company.
For each metric, a specific target performance goal and a defined performance range around the target are established. The performance range consists of a threshold, minimum performance level, and a maximum performance level for each NEO. The cash incentive award is guaranteed if the applicable targets are reached. Details of these metrics are included in the Executive Summary appearing earlier in this Compensation Discussion and Analysis.
- 12 -

For fiscal year 2015, if we reached our threshold targets, Mr. Braun would have been entitled to 35% of his base salary; Messrs. Hefter, Merk and Molnar, Ms. Mittelstaedt would have been entitled to 25% of their base salaries, and Mr. Seifert would have been entitled to 20% of his base salary. If we reached our target goals, Mr. Braun would have been entitled to 70% of his base salary; Messrs. Hefter, Merk and Molnar, and Ms. Mittelstaedt would have been entitled to 50% of their base salaries, and Mr. Seifert would have been entitled to 40% of his base salary. If we reached the stretch performance target, Mr. Braun would have been entitled to 77% of his base salary; Messrs. Hefter, Merk and Molnar and Ms. Mittelstaedt would have been entitled to 55% of their base salary, and Mr. Seifert would have been entitled to 44% of his base salary. If we reached the maximum performance target, Mr. Braun would have been entitled to 105% of his base salary; Messrs. Hefter, Merk and Molnar and Ms. Mittelstaedt would have been entitled to 75% of their base salaries. Subsequent to becoming the Company's Chief Executive Officer, the percentages for Mr. Merk were increased to those previously assigned for Mr. Braun, for the proportionate part of the 2015 fiscal year during which Mr. Merk was CEO.
In fiscal year 2015, the Compensation Committee also included six-month performance goals, that if achieved, could add an additional 20% to the above targets.
The Compensation Committee does have "negative" discretion to reduce the size of any award if the relevant targets are met. Additionally, the Compensation Committee has the discretion to provide an award given the overall performance of the Company if specific target goals are not met.
Our target goals are intended to be attainable yet challenging. However, they are set high enough that significantly exceeding them would require performance in excess of our expectations. We believe that if financial targets are not attainable, the Cash Incentive Plan will lose the motivational effect it was designed to achieve and payouts will lag behind competitive market levels.
Long-Term Incentive Compensation - Stock Options
We believe that long-term equity incentive compensation is an integral component of our compensation program because it has the effect of recruiting, retaining and motivating high-quality employees. In addition, we believe that long-term incentive compensation aligns executives' interests with the interests of stockholders, and rewards the achievement of the Company's long-term strategic goals. Grants of long-term incentive awards are based on Company performance, and targeted at levels that approximate market value of equity incentive compensation for executives holding comparable positions at companies in the Comparator Group, utilizing the same compensation data used for setting total annual compensation. In November of each fiscal year, the Compensation Committee reviews and approves the long-term incentive compensation to be granted to executives and other eligible employees who participate in the Company's long-term incentive programs. Generally, in recent years, stock options have been granted to executive officers as a compensation component over the vesting period of the options, generally five years.
All equity awards granted in fiscal year 2015 were granted from our 2007 Incentive Stock Plan and 2015 Incentive Stock Plan. Some features of our stock option program include:
For additional information concerning the timing of grants of stock options, see "Equity Grant Practices" below.
In November 2014, the Committee awarded stock options from our 2007 Incentive Stock Plan to each of the NEOs as follows: Mr. Braun 40,000 shares; Mr. Merk and Ms. Mittelstaedt 30,000 shares; Mr. Molnar 25,000 shares; Mr. Hefter 20,000 shares; and Mr. Seifert 5,000 shares. In July 2015, the Committee awarded Mr. Merk an additional 20,000 shares from our 2015 Incentive Stock Plan upon being named as President and Chief Executive Officer of the Company. We determined the size of each NEO's grant based on our previous year's performance and the relative performance of each NEO and his or her seniority and responsibilities. In addition, the Committee considered the historical equity compensation awards by companies in our Comparator Group.
Although the Compensation Committee has the authority under our 2007 Incentive Stock Plan and our 2015 Incentive Stock Plan to grant stock appreciation rights, stock grants, and stock units in addition to stock options, in recent years we have used only stock options because we believe that options provide NEOs the best opportunity to purchase and maintain an equity position in the Company and to share in the appreciation of the value of our Common Stock. However, we may grant other forms of equity
• Options vest ratably over 5 years, which means that twenty percent (20%) of the options will become exercisable one year from the date of grant, and an additional 20% of the option will become exercisable each year thereafter;
• The term of each grant does not exceed ten (10) years; and
• The exercise price is equal to the closing market price on the date of grant.
- 13 -

compensation in the future. We do not currently have any stock ownership guidelines or requirements in place for our executive officers; however, we have designed our equity incentive compensation to encourage stock ownership by management.
Equity Grant Practices
Historically, the Company has issued stock options primarily in one of three situations: (1) to employees periodically as an incentive for continued, productive employment and retention; (2) to new employees as a component of an offer of employment and an incentive to attract them to the Company and (3) to new employees in connection with an acquisition as an incentive for continued productive employment with the Company after theacquisition is complete. All stock options are issued with an exercise price equal to the closing market value of a share of our Common Stock on the date of grant.
Stock options are granted, at the discretion of the Compensation Committee, to groups of employees from time to time at a regularly scheduled meeting of the Compensation Committee. The exact amount of these grants to NEOs in 2015 is shown in the "Grants of Plan Based Awards" table appearing below in this Annual Report. The Compensation Committee approves all grants to employees and no authority to make grants has been delegated to management. Stock options may be granted to new employees as a component of their overall compensation package. These option grants are approved by the Compensation Committee.
The Company may also issue options as a component of an acquisition. When this occurs, the options are approved by the Compensation Committee at a special meeting or as part of a regular meeting. No such options were issued during fiscal year 2015.
Long-Term Incentive Compensation-Pension Plans
RSL Pension Plan
Mr. Hefter and Ms. Mittelstaedt participate in the Rofin-Sinar Laser GmbH Pension Plan (the "RSL Pension Plan") for RSL executives, an unfunded plan in accordance with the typical practices of German companies. The RSL Pension Plan provides pensions to participants who (i) retire on or after age 60 or terminate employment due to a permanent disability and (ii) have served at least 10 years with RSL at the time of separation.
The annual benefits payable under the RSL Pension Plan, which commence at the statutory retirement age of 65 for Mr. Hefter and 67 for Ms. Mittelstaedt (according to German law), are based upon the age at which the participant leaves RSL.
Book reserves are kept to record benefits accruals under the RSL Pension Plan. Mr. Hefter and Ms. Mittelstaedt joined or were deemed to have joined (as applicable) the RSL Pension Plan on October 1, 1984 and January 1, 1997, respectively. Assuming retirement at or after age 60, Mr. Hefter and Ms. Mittelstaedt would receive a monthly pension benefit of $997 and $666, respectively (at the weighted average Euro/U.S. dollar exchange rate in effect during the fiscal year ended September 30, 2015).
Rofin-Sinar Inc. Pension Plan
In 1996 we adopted a defined benefit plan for employees of Rofin-Sinar Inc. known as the Rofin-Sinar Inc. Pension Plan (the "RSI Plan"). Under the RSI Plan, employees receive annual pension benefits equal to the product of (i) the sum of 1.125% of the first $12,000 of "average final compensation" and 1.5% of "average final compensation" in excess of that amount, and (ii) the number of years of service in which the employee was employed by a participating employer. Average final compensation is based upon the period of four consecutive plan years out of the last ten full plan years preceding the employee's retirement which produces the highest amount. Mr. Molnar is currently the only NEO participating in the RSI Plan. The RSI plan was frozen and a nonqualified benefit plan was created to ensure employees who were in the RSI plan would receive the same level of benefits. The only difference in the new plan is that it requires a lump sum payment upon termination.
Assuming retirement at or after age 62, Mr. Molnar would receive an estimated monthly benefit of $4,454.
Perquisites and Other Benefits
During fiscal year 2015, we did not provide perquisites or personal benefits to executive officers, except those required under the separation agreement with Mr. Braun, other than leased automobiles, as disclosed in the Summary Compensation Table. As part of the separation agreement with Mr. Braun, the Company purchased Mr. Braun's former leased car and transferred ownership of that car to Mr. Braun. The value of the car has been disclosed in the Summary Compensation Table.
- 14 -
Employment Agreements with Named Executive Officers
Messrs. Merk and Hefter, and Ms. Mittelstaedt have employment agreements with us, under which they are entitled to specified base salaries, adjusted by the Compensation Committee, plus the opportunity to participate in the Cash Incentive Plan. Each employment agreement has an indefinite term, subject to termination by either the Company and RSL or the executive upon two years' prior written notice, in the case of Mr. Merk; upon two years' prior written notice to the end of the year, in the case of Mr. Hefter; and one year's written notice to the end of the fiscal year in the case of Ms. Mittelstaedt. In accordance with the employment agreements, each executive has agreed (i) not to disclose or exploit any of the Company's Confidential Information (as defined therein), and (ii) to assign to the Company all inventions or improvements made by the executive in the course of his or her employment with the Company, and not to compete with the Company for a six month period after the completion of his or her applicable term of employment. During the six month non-competition period, the executive is generally entitled under German law to receive half of his or her monthly salary. The employment agreements do not provide for severance. Mr. Molnar is subject to a written offer letter specifying his base salary plus the opportunity to participate in the Cash Incentive Plan. Mr. Seifert has an employment agreement with Nufern, a wholly-owned subsidiary of the Company, which provides for severance payments equal to one year’s salary in the event he is terminated without cause or resigns for good cause.
Change-In-Control Arrangements and Agreements
The Company does not have any change-in-control agreements or arrangements in place for any of its NEOs, other than the general change in control provision as described in our 2007 Incentive Stock Plan and our 2015 Incentive Plan as described later in this Annual Report.
Tax and Accounting Considerations
Tax Deductibility of Compensation Expense. Section 162(m) of the Internal Revenue Code of 1986, as amended (the "Internal Revenue Code"), places a limit of $1,000,000 on the amount of compensation to certain officers that may be deducted by the Company as a business expense in any tax year unless, among other things, the compensation is performance-based and has been approved by the stockholders. To qualify as performance-based compensation, the amount of compensation must depend on the officer's performance against pre-determined performance goals established by a committee that consists solely of at least two "outside" directors who have never been employed by the Company or its subsidiaries. It is the policy of the Compensation Committee to periodically evaluate the qualification of compensation for exclusion from the $1 million deduction limit under Section 162(m) of the Internal Revenue Code while maintaining flexibility to take actions with respect to compensation that it deems to be in the interest of the Company and its stockholders which may not qualify for tax deductibility.
So that the Compensation Committee may retain maximum flexibility to structure performance targets based on corporate and individual metrics designed to achieve our various corporate goals, our Cash Incentive Plan does not conform to the requirements of Section 162(m). However, stock option awards granted to our executive officers have been structured so that the compensation realized when the stock options are exercised should be treated as performance-based compensation exempt from the deduction limitation of Section 162(m). The Compensation Committee does not believe that any loss of deductibility under Section 162(m) would have a material impact on the financial condition of the Company.
Tax Implications for Officers. Section 409A of the Internal Revenue Code imposes additional income taxes on executive officers for certain types of deferred compensation that do not comply with Section 409A. Because the Company does not provide deferred compensation to the NEOs, this limitation should not have an impact on the structure of the compensation program for the officers. Section 280G of the Internal Revenue Code imposes an excise tax on payments to executives of severance or change of control compensation that exceed the levels specified in Section 280G. The NEOs could receive the amounts as explained in the section entitled "Potential Payments Upon Termination or Change in Control" appearing later in this Annual Report as severance or change of control payments, but the Compensation Committee does not consider their potential impact in compensation program design.
Accounting Considerations. The Compensation Committee also considers the accounting and cash flow implications of various forms of executive compensation. In its financial statements, the Company records salaries and performance-based compensation incentives as expenses in the amount paid, or to be paid, to the NEOs. Accounting rules also require the Company to record an expense in its financial statements for equity awards, even though equity awards are not paid as cash to employees. The accounting expense of equity awards to employees is calculated in accordance with Financial Accounting Standards ("FASB") ASC Topic 718 (formerly known as SFAS 123(R)). The Compensation Committee believes, however, that the many advantages of equity compensation, as discussed above, more than compensate for the non-cash accounting expense associated with them.
Consideration of Compensation Programs and their Relationship to the Encouragement of Risk-Taking
The Compensation Committee has reviewed all of the plans described above, and does not believe that any of them encourage our NEOs to take unnecessary or excessive risks that threaten our value. The features of these plans do not make it likely that taking
- 15 -

unnecessary or excessive risks that threaten our value will provide greater compensation than actions that involve a prudent level of risk. The equity-based plans encourage our NEOs and other employees to focus on increasing shareholder value over a period of years. The pension plans provide helpful ways for our employees to save for retirement. The Compensation Committee believes that the plans described above do not pose any unnecessary risks, and do not encourage employees to manipulate reported earnings to enhance the compensation of any employee.
COMPENSATION COMMITTEE REPORT
The Compensation Committee has reviewed and discussed the Compensation Discussion and Analysis included in this Annual Report on Form 10-K with management.
Based on such review and discussions, the Compensation Committee recommended to the Board of Directors that the Compensation Discussion and Analysis be included in this Annual Report on Form 10-K.
Compensation Committee Gary K. Willis, Chairman Stephen D. Fantone Ralph E. Reins Daniel J. Smoke
- 16 -
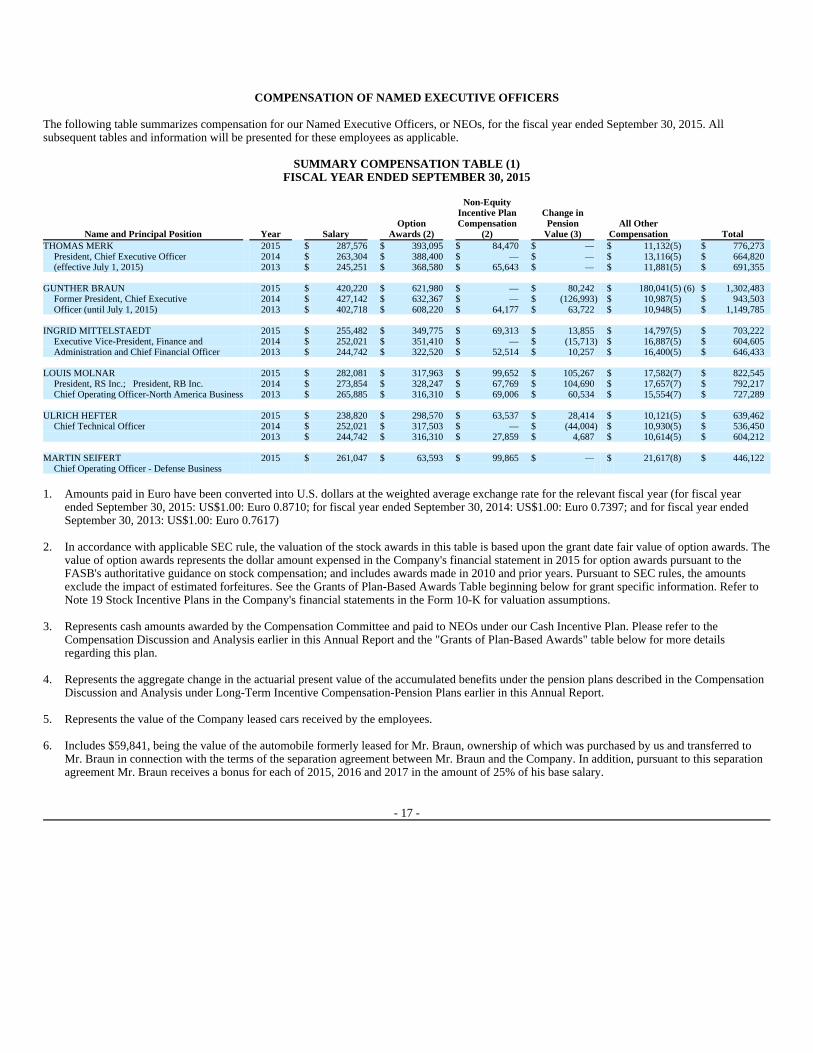
COMPENSATION OF NAMED EXECUTIVE OFFICERS
The following table summarizes compensation for our Named Executive Officers, or NEOs, for the fiscal year ended September 30, 2015. All subsequent tables and information will be presented for these employees as applicable.
SUMMARY COMPENSATION TABLE (1)
FISCAL YEAR ENDED SEPTEMBER 30, 2015
Name and Principal Position Year SalaryOption
Awards (2)
Non-EquityIncentive PlanCompensation
(2)
Change in Pension
Value (3) All Other
Compensation TotalTHOMAS MERK 2015 $ 287,576 $ 393,095 $ 84,470 $ — $ 11,132 (5) $ 776,273
President, Chief Executive Officer 2014 $ 263,304 $ 388,400 $ — $ — $ 13,116 (5) $ 664,820(effective July 1, 2015) 2013 $ 245,251 $ 368,580 $ 65,643 $ — $ 11,881 (5) $ 691,355
GUNTHER BRAUN 2015 $ 420,220 $ 621,980 $ — $ 80,242 $ 180,041 (5) (6) $ 1,302,483
Former President, Chief Executive 2014 $ 427,142 $ 632,367 $ — $ (126,993) $ 10,987 (5) $ 943,503Officer (until July 1, 2015) 2013 $ 402,718 $ 608,220 $ 64,177 $ 63,722 $ 10,948 (5) $ 1,149,785
INGRID MITTELSTAEDT 2015 $ 255,482 $ 349,775 $ 69,313 $ 13,855 $ 14,797 (5) $ 703,222
Executive Vice-President, Finance and 2014 $ 252,021 $ 351,410 $ — $ (15,713) $ 16,887 (5) $ 604,605Administration and Chief Financial Officer 2013 $ 244,742 $ 322,520 $ 52,514 $ 10,257 $ 16,400 (5) $ 646,433
LOUIS MOLNAR 2015 $ 282,081 $ 317,963 $ 99,652 $ 105,267 $ 17,582 (7) $ 822,545
President, RS Inc.; President, RB Inc. 2014 $ 273,854 $ 328,247 $ 67,769 $ 104,690 $ 17,657 (7) $ 792,217Chief Operating Officer-North America Business 2013 $ 265,885 $ 316,310 $ 69,006 $ 60,534 $ 15,554 (7) $ 727,289
ULRICH HEFTER 2015 $ 238,820 $ 298,570 $ 63,537 $ 28,414 $ 10,121 (5) $ 639,462
Chief Technical Officer 2014 $ 252,021 $ 317,503 $ — $ (44,004) $ 10,930 (5) $ 536,450 2013 $ 244,742 $ 316,310 $ 27,859 $ 4,687 $ 10,614 (5) $ 604,212 MARTIN SEIFERT 2015 $ 261,047 $ 63,593 $ 99,865 $ — $ 21,617 (8) $ 446,122
Chief Operating Officer - Defense Business
1. Amounts paid in Euro have been converted into U.S. dollars at the weighted average exchange rate for the relevant fiscal year (for fiscal year ended September 30, 2015: US$1.00: Euro 0.8710; for fiscal year ended September 30, 2014: US$1.00: Euro 0.7397; and for fiscal year ended September 30, 2013: US$1.00: Euro 0.7617)
2. In accordance with applicable SEC rule, the valuation of the stock awards in this table is based upon the grant date fair value of option awards. The value of option awards represents the dollar amount expensed in the Company's financial statement in 2015 for option awards pursuant to the FASB's authoritative guidance on stock compensation; and includes awards made in 2010 and prior years. Pursuant to SEC rules, the amounts exclude the impact of estimated forfeitures. See the Grants of Plan-Based Awards Table beginning below for grant specific information. Refer to Note 19 Stock Incentive Plans in the Company's financial statements in the Form 10-K for valuation assumptions.
3. Represents cash amounts awarded by the Compensation Committee and paid to NEOs under our Cash Incentive Plan. Please refer to the Compensation Discussion and Analysis earlier in this Annual Report and the "Grants of Plan-Based Awards" table below for more details regarding this plan.
4. Represents the aggregate change in the actuarial present value of the accumulated benefits under the pension plans described in the Compensation Discussion and Analysis under Long-Term Incentive Compensation-Pension Plans earlier in this Annual Report.
5. Represents the value of the Company leased cars received by the employees.
6. Includes $59,841, being the value of the automobile formerly leased for Mr. Braun, ownership of which was purchased by us and transferred to Mr. Braun in connection with the terms of the separation agreement between Mr. Braun and the Company. In addition, pursuant to this separation agreement Mr. Braun receives a bonus for each of 2015, 2016 and 2017 in the amount of 25% of his base salary.
- 17 -

The following table provides additional information about grants of our plan-based awards to our NEOs in the fiscal year ended September 30, 2015.
GRANTS OF PLAN-BASED AWARDS
FISCAL YEAR ENDED SEPTEMBER 30, 2015
7. $7,982, $8,057, and $5,954 of matching contributions were made by RSI on behalf of Mr. Molnar in accordance with the Rofin-Sinar Inc. 401(k) Plan for the fiscal years ended September 30, 2015, 2014, and 2013 respectively.
8. $7,811 of matching contributions were made by Nufern on behalf of Mr. Seifert in accordance with the Nufern 401(k) Plan for the fiscal year ended September 30, 2015. Additionally, $9,600 was paid in auto allowance to Mr. Seifert.
Estimated Possible Payouts Under Non-Equity Incentive
Plan Awards (1)
Name Grant Date
(2) Threshold $ Target $ Stretch $ Maximum $
Number of Securities
Underlying Options
Exercise Priceof Option
Awards ($/Sh)
Grant DateFair Value of
Option Awards (5)
Thomas Merk $ 71,894 $ 143,788 $ 158,167 $ 215,682 11/11/2014 30,000(3) $ 22.75 $ 251,100 7/1/2015 20,000(4) $ 27.44 $ 230,800 Gunther Braun $ 147,077 $ 294,154 $ 323,570 $ 441,231 11/11/2014 40,000(3) $ 22.75 $ 334,800 Ingrid Mittelstaedt $ 63,871 $ 127,741 $ 140,515 $ 191,612 11/11/2014 30,000(3) $ 22.75 $ 251,100 Louis Molnar $ 71,079 $ 142,158 $ 156,373 $ 213,236 11/11/2014 25,000(3) $ 22.75 $ 209,250 Ulrich Hefter $ 59,705 $ 119,410 $ 131,351 $ 179,115 11/11/2014 20,000(3) $ 22.75 $ 167,400 Martin Seifert $ 52,209 $ 104,419 $ — $ 114,861 11/11/2014 5,000(3) $ 22.75 $ 41,850
1. These columns consist of potential awards under our Cash Incentive Plan for fiscal year 2015. The Threshold column represents the minimum amount payable when threshold performance goals are met. The Target column represents the amount payable if specified performance targets are met. The Stretch column represents the amount payable if specified stretch performance goals are met. The Maximum column represents the maximum amount payable under the Plan for 2015 based on the highest target levels. Amounts are based on the executives' current salary as of the end of the Company's fiscal year. See the Summary Compensation Table for actual amounts earned under the Cash Incentive Plan in fiscal year 2015 and the information provided earlier under the Compensation Discussion and Analysis for a discussion of our Cash Incentive Plan. The Compensation Committee also included six-month performance goals, that if achieved, could add an additional 20% to the above targets.
2. Grant date coincides with the date the Compensation Committee approved the granting of shares. Additionally, the exercise price is equal to the closing market price for a share of our Common Stock on the date of grant.
3. The amounts listed reflect stock options granted under our 2007 Incentive Stock Plan and are described in the Outstanding Equity Awards at Fiscal Year End Table below.
4. The amount listed reflects a stock option granted under our 2015 Incentive Stock Plan and is described in the Outstanding Equity Awards at Fiscal Year End Table below.
5. The grant date fair value of the option awards has been computed in accordance with FASB ASC Topic 718 (formerly known as SFAS No. 123(R)), which requires that we recognize as compensation expense the value of all stock-based awards, including stock options, granted to employees in exchange for services over the requisite service period, which is typically the vesting period, but excluding forfeiture assumptions that are used in calculating equity award expense in the Company's financial statements. Refer to Note 19 to the Company's Consolidated Financial Statements on Form 10-K for the fiscal year ended September 30, 2015 for the relevant weighted-average assumptions underlying the valuation of the option awards.
- 18 -
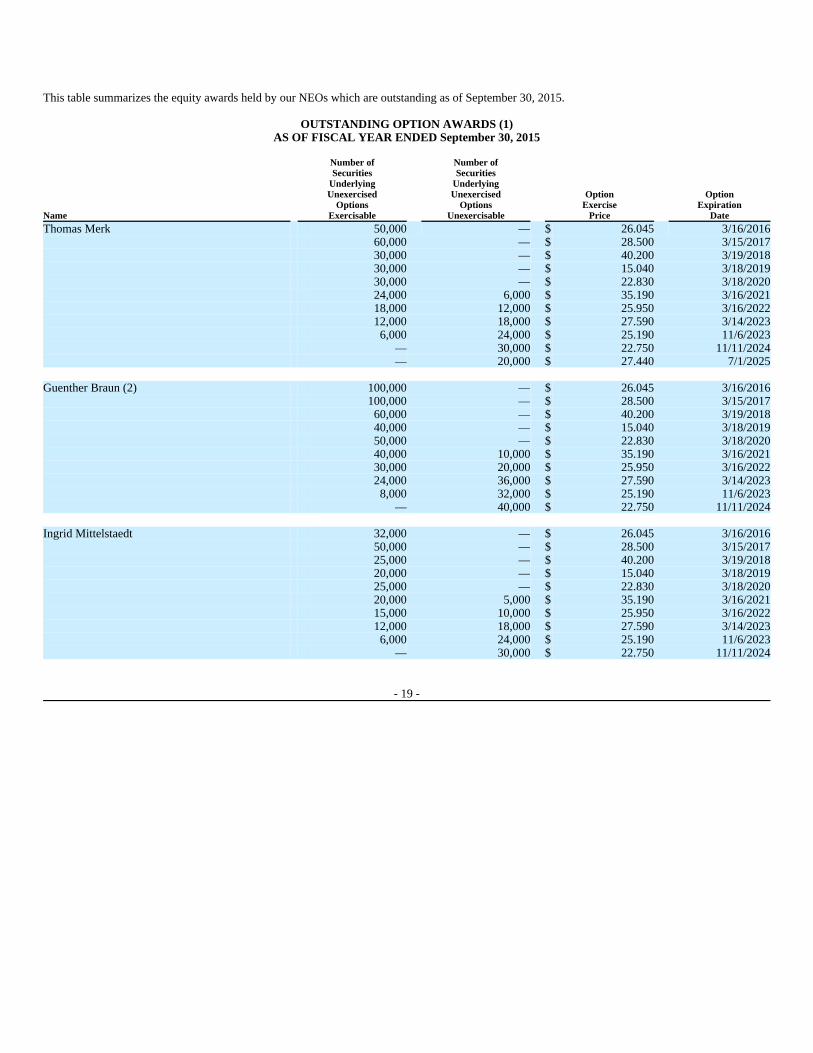
This table summarizes the equity awards held by our NEOs which are outstanding as of September 30, 2015.
OUTSTANDING OPTION AWARDS (1)
AS OF FISCAL YEAR ENDED September 30, 2015
Name
Number ofSecurities
Underlying Unexercised
Options Exercisable
Number ofSecurities
Underlying Unexercised
Options Unexercisable
Option Exercise
Price
OptionExpiration
Date
Thomas Merk 50,000 — $ 26.045 3/16/2016 60,000 — $ 28.500 3/15/2017 30,000 — $ 40.200 3/19/2018 30,000 — $ 15.040 3/18/2019 30,000 — $ 22.830 3/18/2020 24,000 6,000 $ 35.190 3/16/2021 18,000 12,000 $ 25.950 3/16/2022 12,000 18,000 $ 27.590 3/14/2023 6,000 24,000 $ 25.190 11/6/2023 — 30,000 $ 22.750 11/11/2024 — 20,000 $ 27.440 7/1/2025 Guenther Braun (2) 100,000 — $ 26.045 3/16/2016 100,000 — $ 28.500 3/15/2017 60,000 — $ 40.200 3/19/2018 40,000 — $ 15.040 3/18/2019 50,000 — $ 22.830 3/18/2020 40,000 10,000 $ 35.190 3/16/2021 30,000 20,000 $ 25.950 3/16/2022 24,000 36,000 $ 27.590 3/14/2023 8,000 32,000 $ 25.190 11/6/2023 — 40,000 $ 22.750 11/11/2024 Ingrid Mittelstaedt 32,000 — $ 26.045 3/16/2016 50,000 — $ 28.500 3/15/2017 25,000 — $ 40.200 3/19/2018 20,000 — $ 15.040 3/18/2019 25,000 — $ 22.830 3/18/2020 20,000 5,000 $ 35.190 3/16/2021 15,000 10,000 $ 25.950 3/16/2022 12,000 18,000 $ 27.590 3/14/2023 6,000 24,000 $ 25.190 11/6/2023 — 30,000 $ 22.750 11/11/2024
- 19 -
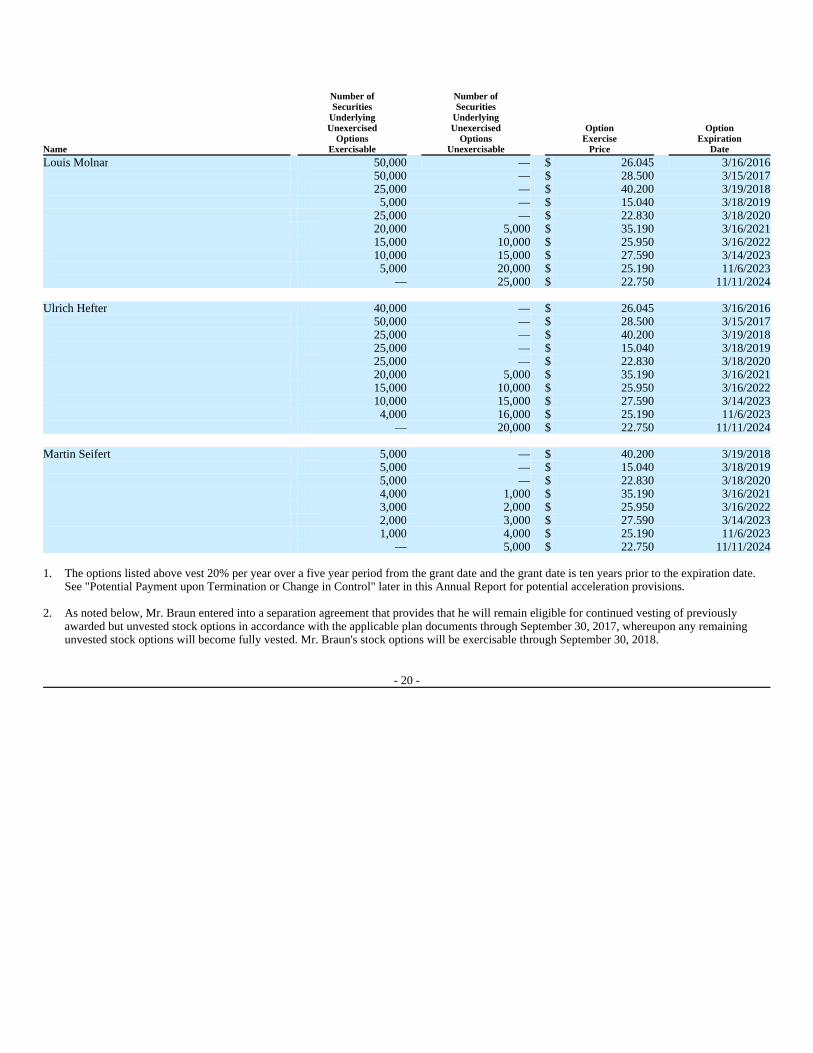
Name
Number ofSecurities
Underlying Unexercised
Options Exercisable
Number ofSecurities
Underlying Unexercised
Options Unexercisable
Option Exercise
Price
OptionExpiration
Date
Louis Molnar 50,000 — $ 26.045 3/16/2016 50,000 — $ 28.500 3/15/2017 25,000 — $ 40.200 3/19/2018 5,000 — $ 15.040 3/18/2019 25,000 — $ 22.830 3/18/2020 20,000 5,000 $ 35.190 3/16/2021 15,000 10,000 $ 25.950 3/16/2022 10,000 15,000 $ 27.590 3/14/2023 5,000 20,000 $ 25.190 11/6/2023 — 25,000 $ 22.750 11/11/2024 Ulrich Hefter 40,000 — $ 26.045 3/16/2016 50,000 — $ 28.500 3/15/2017 25,000 — $ 40.200 3/19/2018 25,000 — $ 15.040 3/18/2019 25,000 — $ 22.830 3/18/2020 20,000 5,000 $ 35.190 3/16/2021 15,000 10,000 $ 25.950 3/16/2022 10,000 15,000 $ 27.590 3/14/2023 4,000 16,000 $ 25.190 11/6/2023 — 20,000 $ 22.750 11/11/2024 Martin Seifert 5,000 — $ 40.200 3/19/2018 5,000 — $ 15.040 3/18/2019 5,000 — $ 22.830 3/18/2020 4,000 1,000 $ 35.190 3/16/2021 3,000 2,000 $ 25.950 3/16/2022 2,000 3,000 $ 27.590 3/14/2023 1,000 4,000 $ 25.190 11/6/2023 — 5,000 $ 22.750 11/11/2024
1. The options listed above vest 20% per year over a five year period from the grant date and the grant date is ten years prior to the expiration date. See "Potential Payment upon Termination or Change in Control" later in this Annual Report for potential acceleration provisions.
2. As noted below, Mr. Braun entered into a separation agreement that provides that he will remain eligible for continued vesting of previously awarded but unvested stock options in accordance with the applicable plan documents through September 30, 2017, whereupon any remaining unvested stock options will become fully vested. Mr. Braun's stock options will be exercisable through September 30, 2018.
- 20 -

The following table provides information about the value realized by the NEOs upon the exercise of options which occurred during the fiscal year ended September 30, 2015. During fiscal year 2015, none of the NEOs acquired shares upon vesting of stock awards.
OPTION EXERCISES
FISCAL YEAR ENDED SEPTEMBER 30, 2015
Potential Payments upon Termination or Change in Control
Effective March 12, 2015, our stockholders approved the Rofin-Sinar Technologies Inc. 2015 Incentive Stock Plan ("the 2015 Incentive Plan"). The 2015 Incentive Plan supersedes the Rofin-Technologies Inc. 1996 Non-Employee Directors' Stock Plan, the Rofin-Sinar Technologies Inc. 2002 Equity Incentive Plan and the Rofin-Sinar Technologies Inc. 2007 Equity Incentive Plan. Under the above stock option plans, unless the Compensation Committee determines otherwise in its sole discretion, if an employee's employment with the Company terminates by any reason other than death, disability, or retirement, an employee has up to sixty days from the date of such termination or until the expiration of the stated term of stock award, whichever period is shorter, to exercise any options that were exercisable on the date of such termination. If an employee's employment with the Company terminates by reason of death, disability, or retirement, an employee has up to one year from the date of such termination or, if earlier, until the expiration of the stated term of stock award, to exercise any options that were exercisable on the date of such termination.
Upon any Change in Control, the Board shall have the right to cancel all outstanding Options, Stock Appreciation Rights, Stock Grants and Stock Unit Grants after providing each Eligible Employee and Director a reasonable period to exercise his or her Options and Stock Appreciation Rights and to take such other action as necessary or appropriate to receive the stock subject to any stock grants or stock unit grants and the cash payable under any stock unit grants.
Except as otherwise provided in the applicable award agreement, and to the extent permitted under Section 409A of the Code, if an award granted under this Plan is assumed, continued, or replaced by the Company or successor after the Change in Control, and if the holder's service with the Company or its successor is terminated coincident with or within one year following the Change in Control either by the Company or its successor without Cause or by the holder for Good Reason (as such terms are defined in the plan), then all conditions to the exercise of such holder's outstanding Options and Stock Appreciation Rights on the date of termination and any and all outstanding issuance and forfeiture conditions on any Stock Grants and Stock Unit Grants held by the holder on such date automatically shall be deemed 100% satisfied as of the date of such termination of service.
The following constitute a change of control under the stock plans:
Option Awards
Name
Number of Shares Acquired on Exercise
(1)
Value Realized onExercise
(2)
Thomas Merk 4,293 $ 29,450Guenther Braun 29,691 $ 212,413Ingrid Mittelstaedt — $ —Louis Molnar — $ —Ulrich Hefter 30,000 $ 58,900Martin Seifert — $ —
1. Includes the shares of Common Stock received upon the exercise of stock options which were immediately tendered for withholding tax purposes, as reflected in the report on Form 4 filed with the Securities and Exchange Commission.
2. The value realized on exercise represents the difference between the exercise price of the stock options and the market price of the Common Stock at exercise multiplied by the number of shares underlying the Option exercised.
• any acquiring person becomes the beneficial owner of twenty percent (20%) or more of the then outstanding shares of Common Stock;
• the stockholders of the Company approve a merger or consolidation; or
• the stockholders approve a plan of reorganization or complete liquidation of the Company
- 21 -
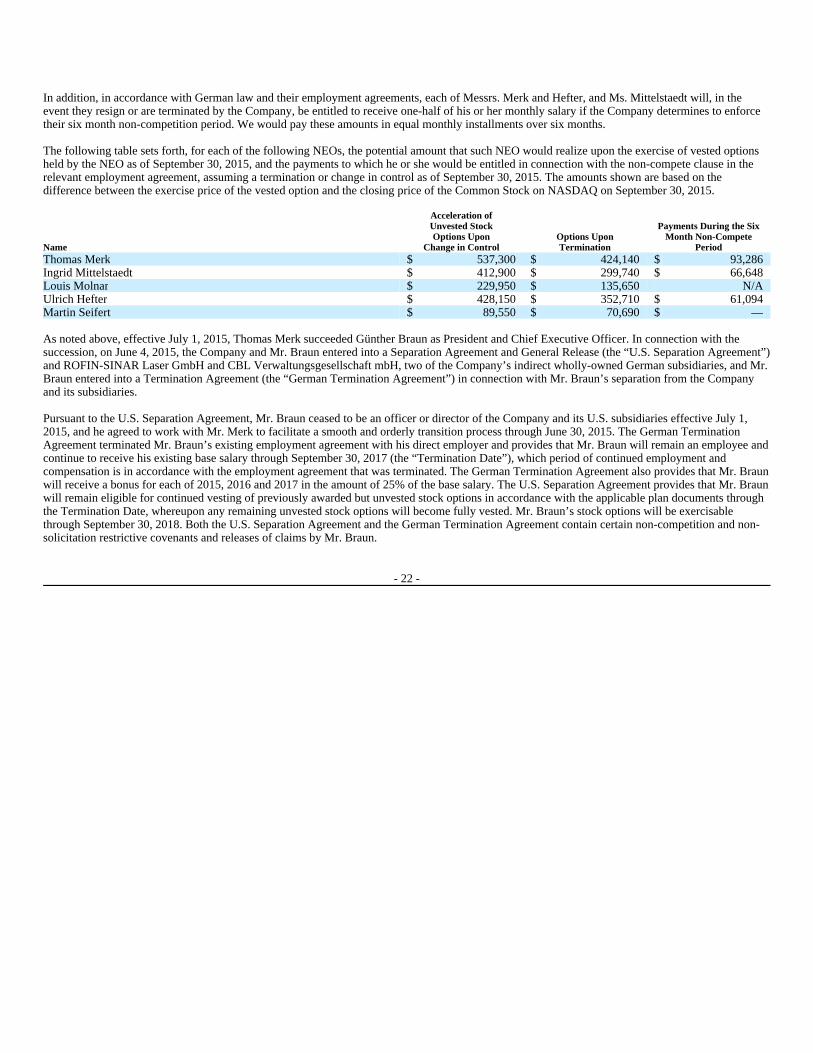
In addition, in accordance with German law and their employment agreements, each of Messrs. Merk and Hefter, and Ms. Mittelstaedt will, in the event they resign or are terminated by the Company, be entitled to receive one-half of his or her monthly salary if the Company determines to enforce their six month non-competition period. We would pay these amounts in equal monthly installments over six months.
The following table sets forth, for each of the following NEOs, the potential amount that such NEO would realize upon the exercise of vested options held by the NEO as of September 30, 2015, and the payments to which he or she would be entitled in connection with the non-compete clause in the relevant employment agreement, assuming a termination or change in control as of September 30, 2015. The amounts shown are based on the difference between the exercise price of the vested option and the closing price of the Common Stock on NASDAQ on September 30, 2015.
As noted above, effective July 1, 2015, Thomas Merk succeeded Günther Braun as President and Chief Executive Officer. In connection with the succession, on June 4, 2015, the Company and Mr. Braun entered into a Separation Agreement and General Release (the “U.S. Separation Agreement”) and ROFIN-SINAR Laser GmbH and CBL Verwaltungsgesellschaft mbH, two of the Company’s indirect wholly-owned German subsidiaries, and Mr. Braun entered into a Termination Agreement (the “German Termination Agreement”) in connection with Mr. Braun’s separation from the Company and its subsidiaries.
Pursuant to the U.S. Separation Agreement, Mr. Braun ceased to be an officer or director of the Company and its U.S. subsidiaries effective July 1, 2015, and he agreed to work with Mr. Merk to facilitate a smooth and orderly transition process through June 30, 2015. The German Termination Agreement terminated Mr. Braun’s existing employment agreement with his direct employer and provides that Mr. Braun will remain an employee and continue to receive his existing base salary through September 30, 2017 (the “Termination Date”), which period of continued employment and compensation is in accordance with the employment agreement that was terminated. The German Termination Agreement also provides that Mr. Braun will receive a bonus for each of 2015, 2016 and 2017 in the amount of 25% of the base salary. The U.S. Separation Agreement provides that Mr. Braun will remain eligible for continued vesting of previously awarded but unvested stock options in accordance with the applicable plan documents through the Termination Date, whereupon any remaining unvested stock options will become fully vested. Mr. Braun’s stock options will be exercisable through September 30, 2018. Both the U.S. Separation Agreement and the German Termination Agreement contain certain non-competition and non-solicitation restrictive covenants and releases of claims by Mr. Braun.
Name
Acceleration ofUnvested Stock Options Upon
Change in ControlOptions Upon Termination
Payments During the SixMonth Non-Compete
PeriodThomas Merk $ 537,300 $ 424,140 $ 93,286Ingrid Mittelstaedt $ 412,900 $ 299,740 $ 66,648Louis Molnar $ 229,950 $ 135,650 N/AUlrich Hefter $ 428,150 $ 352,710 $ 61,094Martin Seifert $ 89,550 $ 70,690 $ —
- 22 -

NON-EMPLOYEE DIRECTOR COMPENSATION
The Compensation program for non-employee directors is reviewed annually by our Compensation Committee to ensure the program remains competitive. As part of the Compensation Committee's review, the types and levels of compensation offered to our non-employee directors are compared with those provided by a select group of comparable companies. Additionally, in January 2012, the Company hired Radford, a third party compensation consulting firm, to assist with the analysis of the non-employee directors' compensation. The report has shown that the Company's average total non-employee director compensation approximates the market's 25th percentile. The Compensation Committee strives to set compensation levels that are competitive. The result of the report supports this goal.
Cash Compensation Paid to Board Members
Non-employee directors are entitled to receive an annual cash retainer in the amount of $35,000 for service on the Board and attendance fees of $2,000 for each Board meeting ($1,000 for telephonic meetings). Directors are also reimbursed for reasonable travel expenses incurred in connection with their duties as directors of the Company.
In addition to the annual retainer, each non-employee director who chairs the Audit, Compensation and Nominating Committees are entitled to an additional cash retainer in the amount of $10,000, $7,000 and $4,000, respectively, for such service. The Lead Independent Director is also entitled to an additional cash retainer in the amount of $12,000 for such service. Attendance fees are paid for Committee meetings as follows: $1,500 for each Audit Committee meeting ($750 for telephonic meetings), $1,000 for each Compensation and Nominating Committee meeting ($500 for telephonic meetings); and $1,500 for each other committee meeting ($750 for telephonic meetings), subject to review by the Board. Directors are also reimbursed for reasonable travel expenses incurred in connection with their duties as members of the Committees.
Non-cash Compensation
The Company has reserved an additional 1,800,000 shares of Common Stock under the 2015 Incentive Stock Plan approved at the Annual Meeting of Stockholders held on March 12, 2015, to provide for the grant of options to purchase Common Stock ("options"), grants of shares of Common Stock ("stock grants"), stock units, and stock appreciation rights ("SARs") to certain eligible employees and to non-employee directors. During fiscal year 2015, outside directors each received 3,000 shares of Common Stock that were fully vested upon grant.
The following table shows the compensation paid in fiscal year 2015 to our non-employee directors. Directors who are also officers do not receive separate directors' fees and have been omitted from this table if they appear in the Summary Compensation Table provided earlier in this Annual Report.
DIRECTOR COMPENSATION TABLE
FISCAL YEAR ENDED SEPTEMBER 30, 2015
Non-Employee DirectorFees PaidIn Cash
CommonStock
Value (1)
All Other Compensation
($) Total
Carl F. Baasel $ — $ — $ 734,829(2), (3) $ 734,829Stephen D. Fantone $ 117,500 $ 68,730 $ — $ 186,230Ralph E. Reins $ 129,250 $ 68,730 $ — $ 197,980Daniel J. Smoke $ 136,750 $ 68,730 $ — $ 205,480Gary K. Willis $ 117,000 $ 68,730 $ — $ 185,730Peter Wirth $ 45,905(3) $ — $ 39,299(4), (5) $ 85,204
1. The value of the stock awards has been calculated as the total number of shares granted (3,000 annually) times the closing price of the Common Stock on the NASDAQ on the date of grant and as reported on a Form 4 filed with the Securities and Exchange Commission. Shares granted to non-employee directors vest immediately and therefore the fair value is equal to the closing market value on the date the shares were granted.
2. Mr. Baasel received $704,514 as rental payments for the building he owns in Starnberg, Germany (see note 14 of the Form 10-K Annual Report). Mr. Baasel also received $30,315 from the Company as management consulting fees.
3. Amounts paid in Euro have been converted into U.S. dollars at the weighted average exchange rate for the fiscal year: US$1.00: Euro 0.8710.4. In October 2009, Dr. Wirth retired as an executive of the Company. As Chairman of the Board, Dr. Wirth receives 40,000 Euros per year, payable
in four installments, one after each Board of Directors meeting.5. Dr. Wirth retired from the Company in October 2009; amount represents payments from the RSL Pension plan.
- 23 -

Item 12. SECURITY OWNERSHIP OF CERTAIN BENEFICIAL OWNERS AND MANAGEMENT AND RELATED STOCKHOLDER
MATTERS
The following table presents information regarding the beneficial ownership of our Common Stock, as of January 15, 2016, by each of our current directors, each nominee for election as a director, our executive officers named in the Summary Compensation Table, and all of our directors and executive officers as a group.
* Less than one percent of class.
Name and Address of Beneficial Owner
Number of Shares ofCommon Stock
Beneficially Owned Percentage of Class
Peter Wirth 44,100 (1), (2) *Thomas Merk 226,293 (1) *Guenther Braun 503,691 (1) 1.8%Ulrich Hefter 190,586 (1) *Ingrid Mittelstaedt 185,000 (1) *Louis Molnar 155,000 (1) *Martin Seifert 27,000 (1) *Carl F. Baasel 117,000 *Jenifer Bunis 3,000 *Stephen D. Fantone 17,000 *Ralph E. Reins 39,000 (3) *Daniel J. Smoke 47,000 (4) *Gary K Willis 51,000 * All directors and executive officers as a group (13 persons) 1,605,670 5.6%
1. Beneficial ownership and percentage ownership are determined in accordance with the rules of the SEC and include voting or investment power with respect to shares of stock. This information does not necessarily indicate beneficial ownership for any other purpose. Under these rules, shares of Common Stock issuable under stock options that are exercisable within 60 days of January 15, 2016 are deemed outstanding for the purpose of computing the percentage ownership of the person holding the options, but are not deemed outstanding for the purpose of computing the percentage ownership of any other person. The amounts listed include the following shares of Common Stock that may be acquired within 60 days of January 15, 2016 through the exercise of stock options: Dr. Wirth, 25,000; Mr. Braun, 468,000; Mr. Merk, 222,000; Ms. Mittelstaedt, 185,000; Dr. Hefter, 182,000; Mr. Molnar, 155,000; and Mr. Seifert 27,000.
2. 6,500 of these shares are held by Dr. Wirth's spouse and are therefore indirectly held by Dr. Wirth.
3. 5,890 of these shares are held in a trust by Mr. Reins' spouse and 30,110 of these shares are held in a family trust and are therefore indirectly held by Mr. Reins.
4. 400 of these shares are held by Mr. Smoke's spouse and are therefore indirectly held by Mr. Smoke.
- 24 -
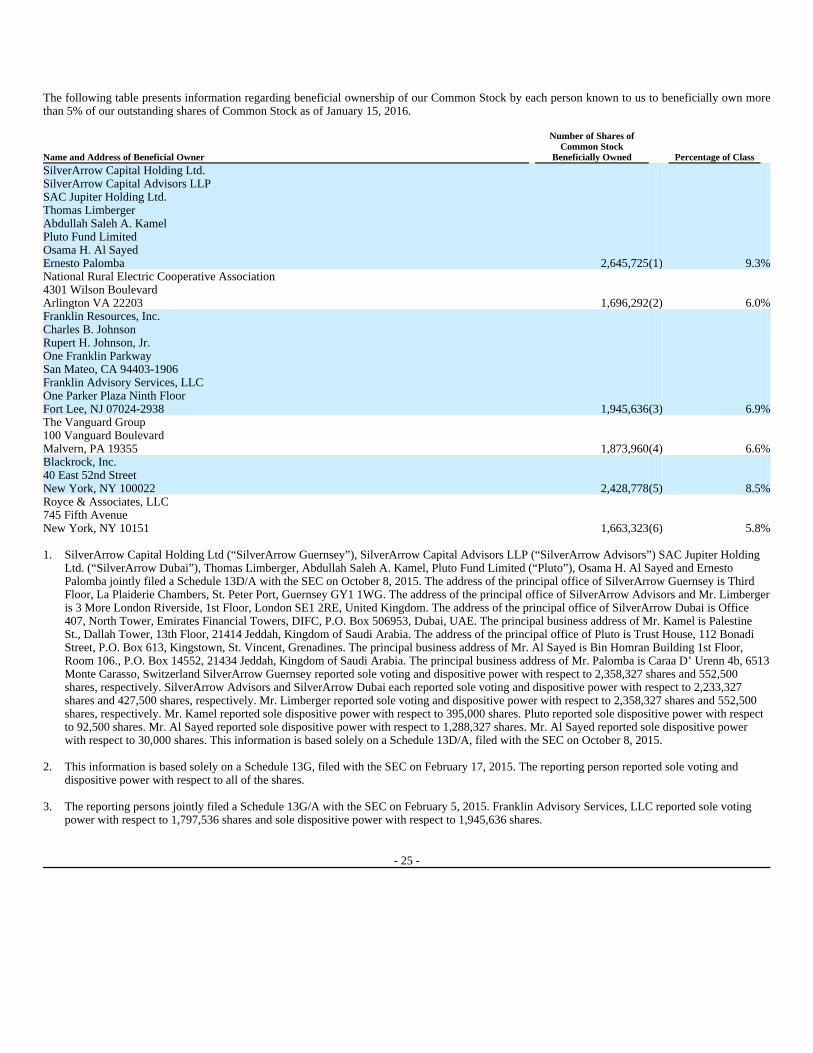
The following table presents information regarding beneficial ownership of our Common Stock by each person known to us to beneficially own morethan 5% of our outstanding shares of Common Stock as of January 15, 2016.
Name and Address of Beneficial Owner
Number of Shares of Common Stock
Beneficially Owned Percentage of Class
SilverArrow Capital Holding Ltd. SilverArrow Capital Advisors LLP SAC Jupiter Holding Ltd. Thomas Limberger Abdullah Saleh A. Kamel Pluto Fund Limited Osama H. Al Sayed Ernesto Palomba 2,645,725(1) 9.3%National Rural Electric Cooperative Association 4301 Wilson Boulevard Arlington VA 22203 1,696,292(2) 6.0%Franklin Resources, Inc. Charles B. Johnson Rupert H. Johnson, Jr. One Franklin Parkway San Mateo, CA 94403-1906 Franklin Advisory Services, LLC One Parker Plaza Ninth Floor Fort Lee, NJ 07024-2938 1,945,636(3) 6.9%The Vanguard Group 100 Vanguard Boulevard Malvern, PA 19355 1,873,960(4) 6.6%Blackrock, Inc. 40 East 52nd Street New York, NY 100022 2,428,778(5) 8.5%Royce & Associates, LLC 745 Fifth Avenue New York, NY 10151 1,663,323(6) 5.8%
1. SilverArrow Capital Holding Ltd (“SilverArrow Guernsey”), SilverArrow Capital Advisors LLP (“SilverArrow Advisors”) SAC Jupiter Holding Ltd. (“SilverArrow Dubai”), Thomas Limberger, Abdullah Saleh A. Kamel, Pluto Fund Limited (“Pluto”), Osama H. Al Sayed and Ernesto Palomba jointly filed a Schedule 13D/A with the SEC on October 8, 2015. The address of the principal office of SilverArrow Guernsey is Third Floor, La Plaiderie Chambers, St. Peter Port, Guernsey GY1 1WG. The address of the principal office of SilverArrow Advisors and Mr. Limberger is 3 More London Riverside, 1st Floor, London SE1 2RE, United Kingdom. The address of the principal office of SilverArrow Dubai is Office 407, North Tower, Emirates Financial Towers, DIFC, P.O. Box 506953, Dubai, UAE. The principal business address of Mr. Kamel is Palestine St., Dallah Tower, 13th Floor, 21414 Jeddah, Kingdom of Saudi Arabia. The address of the principal office of Pluto is Trust House, 112 Bonadi Street, P.O. Box 613, Kingstown, St. Vincent, Grenadines. The principal business address of Mr. Al Sayed is Bin Homran Building 1st Floor, Room 106., P.O. Box 14552, 21434 Jeddah, Kingdom of Saudi Arabia. The principal business address of Mr. Palomba is Caraa D’ Urenn 4b, 6513 Monte Carasso, Switzerland SilverArrow Guernsey reported sole voting and dispositive power with respect to 2,358,327 shares and 552,500 shares, respectively. SilverArrow Advisors and SilverArrow Dubai each reported sole voting and dispositive power with respect to 2,233,327 shares and 427,500 shares, respectively. Mr. Limberger reported sole voting and dispositive power with respect to 2,358,327 shares and 552,500 shares, respectively. Mr. Kamel reported sole dispositive power with respect to 395,000 shares. Pluto reported sole dispositive power with respect to 92,500 shares. Mr. Al Sayed reported sole dispositive power with respect to 1,288,327 shares. Mr. Al Sayed reported sole dispositive power with respect to 30,000 shares. This information is based solely on a Schedule 13D/A, filed with the SEC on October 8, 2015.
2. This information is based solely on a Schedule 13G, filed with the SEC on February 17, 2015. The reporting person reported sole voting and dispositive power with respect to all of the shares.
3. The reporting persons jointly filed a Schedule 13G/A with the SEC on February 5, 2015. Franklin Advisory Services, LLC reported sole voting power with respect to 1,797,536 shares and sole dispositive power with respect to 1,945,636 shares.
- 25 -
STOCK EQUITY COMPENSATION PLAN INFORMATION The following table sets forth information regarding shares issued under the stock compensation plans as of September 30, 2015:
The main facility in Starnberg is rented under a 25-year operating lease from the former minority shareholder of ROFIN-BAASEL Lasertech
GmbH & Co. KG (“RBL”), Mr. Baasel, who is also a member of the Board of Directors of the Company. That lease will terminate by end of December 2016. The operating lease was acquired by the Company in 2000 as part of its then acquisition of RBL. The Company paid expenses, mainly for rental expense of approximately $735,000, $883,000 and $846,000 to Mr. Baasel during fiscal years 2015, 2014, and 2013, respectively. In fiscal year 2015, the Company acquired a new manufacturing facility in Gilching, which is currently under reconstruction and which is intended to replace all RBL leased facilities in Starnberg. As a result of the Company’s consolidation of operations into a single facility, the required two-year notice of lease termination was given to Mr. Baasel in December 2014.
The Company believes that all transactions noted above, have been executed on an arms-length basis. Except for the foregoing, no director,
officer, nominee director, 5% holder of the Company’s shares, or immediate family member, associate or affiliate thereof, had any material interest, direct or indirect, in any transaction since the beginning of fiscal year 2015 or has any material interest, direct or indirect, in any proposed transaction, having a value of $120,000 or more. Director Independence
The information required by Item 407(a) of Regulation S-K is incorporated herein by reference to Item 10 of this Annual Report “Directors,
Executive Officers and Corporate Governance— Director Independence and Corporate Governance—Director Independence.”
4. This information is based solely on a Schedule 13G/A, filed with the SEC on February 10, 2015. The Vanguard Group reported aggregate beneficial ownership of 1,873,960 shares; sole voting power of 41,960 shares; sole dispositive power of 1,833,600 shares; and shared dispositive power of 40,360 shares.
5. This information is based solely on a Schedule 13G/A, filed with the SEC on January 22, 2015. Blackrock, Inc. reported aggregate beneficial ownership of 2,428,778 shares; sole voting power of 2,354,233 shares; and sole dispositive power of 2,428,778 shares.
6. The information as to share ownership is based solely on a Schedule 13G/A, filed with the SEC on January 4, 2016. The reporting person reportedsole voting and dispositive power with respect to all of the shares.
Number ofSecurities to Be
Issued Upon Exercise of
Outstanding Options
Weighted Average Exercise Price of
Outstanding Options
Number ofSecurities Remaining
Available for Future Issuance
Equity Compensation Plans Approved by Security Holders: 2002 Equity Incentive Plan 470,200 $ 26 1/10 —2007 Incentive Stock Plan 2,847,900 27 5/8 —2015 Equity Incentive Plan 20,000 — 4/9 1,780,000
Total equity compensation plans approved by security holders 3,338,100 $ 28 2/5 1,780,000 Equity Compensation Plans not approved by Security Holders — — — Total 3,338,100 $ 27 2/5 1,780,000
Item 13. CERTAIN RELATIONSHIPS AND RELATED TRANSACTIONS, AND DIRECTOR INDEPENDENCE
- 26 -
Item 14. PRINCIPAL ACCOUNTING FEES AND SERVICES The following table presents fees for professional audit services rendered by Deloitte & Touche LLP (D&T), on an accrual basis, for the audit of the Company's annual financial statements for 2015 and 2014, respectively, and fees billed during fiscal years 2015 and 2014 for other services rendered by D&T.
The Audit Committee pre-approves all audit and permitted non-audit services provided by the independent auditors. Mr. Smoke, the Audit Committee Chairman, has the delegated authority to pre-approve such services and these pre-approval decisions are presented to the full Audit Committee at its next scheduled meeting. During fiscal year 2015 and 2014, the Audit Committee pre-approved 100% of the total fees to D&T.
During the two most recent fiscal years ended September 30, 2015 and 2014, and through December 1, 2015, there have been no reportable events (as defined in Regulation S-K, Item 304(a)(1)(v)).
The Company has not consulted D&T on any of the matters referenced in Regulation S-K Item 304(a)(2) prior to D&T's appointment as the Company's independent registered public accounting firm.
PART IV
The financial statements, financial statement schedules and exhibits listed in the exhibit index of the Original Filing and the exhibits listed in the exhibit index of this Form 10-K/A are filed with, or incorporated by reference in, this Form 10-K/A.
2015 2014
Audit fees $ 1,375,296 $ 1,276,807Audit related fees (1) $ 24,087 $ —
Audit and audit related fees $ 1,399,383 $ 1,276,807Tax fees (2) $ 3,615 $ —All other fees $ 5,819
Total fees $ 1,408,817 $ 1,276,807
1. Audit related fees consisted primarily of fees for services performed in connection with research and development grant awards and registration of option awards.
2. Tax fees consisted of fees for tax consultation and tax compliance services.
Item 15. EXHIBITS, FINANCIAL STATEMENT SCHEDULES
- 27 -

SIGNATURES
Pursuant to the requirements of Section 13 or 15(d) of the Securities Exchange Act of 1934, the registrant has duly caused this report to be
signed on its behalf by the undersigned, thereunto duly authorized.
Date: January 28, 2016 ROFIN-SINAR TECHNOLOGIES INC. By: /s/ Thomas Merk Thomas Merk President, Chief Executive Officer, and Director
(Principal Executive Officer)
Date: January 28, 2016 By: /s/ Ingrid Mittelstaedt Ingrid Mittelstaedt Chief Financial Officer
(Principal Financial Officer and Principal Accounting Officer)
- 28 -

INDEX TO EXHIBITS
Exhibit No. Exhibit
31.1 Rule 13a-14(a)/15d-14(a) Certification of Chief Executive Officer31.2 Rule 13a-14(a)/15d-14(a) Certification of Chief Financial Officer32.1 Section 1350 Certification of Chief Executive Officer32.2 Section 1356 Certification of Chief Financial Officer

EXHIBIT 31.1
Rule 13a-14(a)/15d-14(a) Certification of the Chief Executive Officer I, Thomas Merk, certify that:
Date: January 28, 2016
1. I have reviewed this Annual Report on Form 10-K of ROFIN-SINAR Technologies Inc.
2. Based on my knowledge, this Annual Report does not contain any untrue statement of a material fact or omit to state a material fact necessary to make the statements made, in light of the circumstances under which such statements were made, not misleading with respect to the period covered by this report.
3. Based on my knowledge, the financial statements, and other financial information included in this Annual Report, fairly present in all material respects the financial condition, results of operations and cash flows of the registrant as of, and for, the periods presented in this Annual Report.
4. The registrant’s other certifying officer(s) and I are responsible for establishing and maintaining disclosure controls and procedures (as defined in Exchange Act Rules 13a-15(e) and 15d-15(e)) and internal control over financial reporting (as defined in Exchange Act Rules 13a-15(f) and 15d-15(f) for the registrant and have:
a) designed such disclosure controls and procedures, or caused such disclosure controls and procedures to be designed under our supervision, to ensure that material information relating to the registrant, including its consolidated subsidiaries, is made known to us by others within those entities, particularly during the period in which this report is being prepared;
b) designed such internal control over financial reporting, or caused such internal control over financial reporting to be designed under our supervision, to provide reasonable assurance regarding the reliability of financial reporting and the preparation of financial statements for external purposes in accordance with Generally Accepted Accounting Principles;
c) evaluated the effectiveness of the registrant’s disclosure controls and procedures and presented in this report our conclusions about the effectiveness of the disclosure controls and procedures, as of the end of the period covered by this report, based on such evaluation; and
d) disclosed in this report any change in the registrant’s internal control over financial reporting that occurred during the registrant’s most recent fiscal quarter (the registrant’s fourth fiscal quarter in the case of an annual report) that has materially affected, or is reasonably likely to materially affect, the registrant’s internal control over financial reporting; and
5. The registrant’s other certifying officer and I have disclosed, based on our most recent evaluation of internal control over financial reporting, to the registrant’s auditors and the audit committee of registrant’s board of directors (or persons performing the equivalent functions):
a. all significant deficiencies and material weaknesses in the design or operation of internal control over financial reporting which are reasonably likely to adversely affect the registrant’s ability to record, process, summarize and report financial information; and
b. any fraud, whether or not material, that involves management or other employees who have a significant role in the registrant’s internal control over financial reporting.
/s/ Thomas Merk Thomas Merk Chief Executive Officer

EXHIBIT 31.2
Rule 13a-14(a)/15d-14(a) Certification of the Chief Financial Officer I, Ingrid Mittelstaedt, certify that:
Date: January 28, 2016
1. I have reviewed this Annual Report on Form 10-K of ROFIN-SINAR Technologies Inc.
2. Based on my knowledge, this Annual Report does not contain any untrue statement of a material fact or omit to state a material fact necessary to make the statements made, in light of the circumstances under which such statements were made, not misleading with respect to the period covered by this report.
3. Based on my knowledge, the financial statements, and other financial information included in this Annual Report, fairly present in all material respects the financial condition, results of operations and cash flows of the registrant as of, and for, the periods presented in this Annual Report.
4. The registrant’s other certifying officer(s) and I are responsible for establishing and maintaining disclosure controls and procedures (as defined in Exchange Act Rules 13a-15(e) and 15d-15(e)) and internal control over financial reporting (as defined in Exchange Act Rules 13a-15(f) and 15d-15(f) for the registrant and have:
a) designed such disclosure controls and procedures, or caused such disclosure controls and procedures to be designed under our supervision, to ensure that material information relating to the registrant, including its consolidated subsidiaries, is made known to us by others within those entities, particularly during the period in which this report is being prepared;
b) designed such internal control over financial reporting, or caused such internal control over financial reporting to be designed under our supervision, to provide reasonable assurance regarding the reliability of financial reporting and the preparation of financial statements for external purposes in accordance with Generally Accepted Accounting Principles;
c) evaluated the effectiveness of the registrant’s disclosure controls and procedures and presented in this report our conclusions about the effectiveness of the disclosure controls and procedures, as of the end of the period covered by this report, based on such evaluation; and
d) disclosed in this report any change in the registrant’s internal control over financial reporting that occurred during the registrant’s most recent fiscal quarter (the registrant’s fourth fiscal quarter in the case of an annual report) that has materially affected, or is reasonably likely to materially affect, the registrant’s internal control over financial reporting; and
5. The registrant’s other certifying officer and I have disclosed, based on our most recent evaluation of internal control over financial reporting, to the registrant’s auditors and the audit committee of registrant’s board of directors (or persons performing the equivalent functions):
a) all significant deficiencies and material weaknesses in the design or operation of internal control over financial reporting which are reasonably likely to adversely affect the registrant’s ability to record, process, summarize and report financial information; and
b) any fraud, whether or not material, that involves management or other employees who have a significant role in the registrant’s internal control over financial reporting.
/s/ Ingrid Mittelstaedt Ingrid Mittelstaedt Chief Financial Officer

EXHIBIT 32.1
Section 1350 Certification of the Chief Executive Officer In connection with the Annual Report of ROFIN-SINAR Technologies Inc. (the “Company”) on Form 10-K for the year ended September 30, 2015, as filed with the Securities and Exchange Commission on the date hereof (the “Report”), I, Thomas Merk, Chief Executive Officer of the Company, certify, pursuant to 18 U.S.C. § 1350, as adopted pursuant to § 906 of the Sarbanes-Oxley Act of 2002, that:
Date: January 28, 2016
(1) The Report fully complies with the requirements of section 13(a) or 15(d) of the Securities Exchange Act of 1934; and
(2) The information contained in the Report fairly presents, in all material respects, the financial condition and results of operations of the Company.
/s/ Thomas Merk Thomas Merk Chief Executive Officer
EXHIBIT 32.2
Section 1350 Certification of the Chief Financial Officer In connection with the Annual Report of ROFIN-SINAR Technologies Inc. (the “Company”) on Form 10-K for the year ended September 30, 2015, as filed with the Securities and Exchange Commission on the date hereof (the “Report”), I, Ingrid Mittelstaedt, Chief Financial Officer of the Company, certify, pursuant to 18 U.S.C. § 1350, as adopted pursuant to § 906 of the Sarbanes-Oxley Act of 2002, that:
Date: January 28, 2016
(1) The Report fully complies with the requirements of section 13(a) or 15(d) of the Securities Exchange Act of 1934; and(2) The information contained in the Report fairly presents, in all material respects, the financial condition and results of operations of the
Company.
/s/ Ingrid Mittelstaedt Ingrid Mittelstaedt Chief Financial Officer


