16
RTC Board Workshop Regional Road Impact Fee Program September 7, 2012
| Date post: | 01-Jan-2016 |
| Category: |
Documents |
| Upload: | melvin-lyons |
| View: | 223 times |
| Download: | 4 times |

RTC Board Workshop Regional Road
Impact Fee ProgramSeptember 7, 2012

RRIF Program Overview History
RTC Board Workshop May 2011Open Discussion with Stakeholders
RFP Process Jun-Sep 2011Intent to Award Aug 2011
Execute PSA Sep 2011
RRIF TAC Meetings Oct – May 2012
RTC Board Workshop Apr 2012Presentation by TischlerBise
Draft Final Report to RRIF TAC Jun 2012
Draft Final Report to RTC Board Jul 2012
2

RRIF Program Overview ReportTischlerBise - Scope of Work
Land use assumptions Methodology Geographic service area and benefit districts Development potential Economic analysis Credit program Options for transit oriented development Ordinances, agreements and General
Administrative Manual3
RRIF Program Overview ReportTischlerBise – General Findings
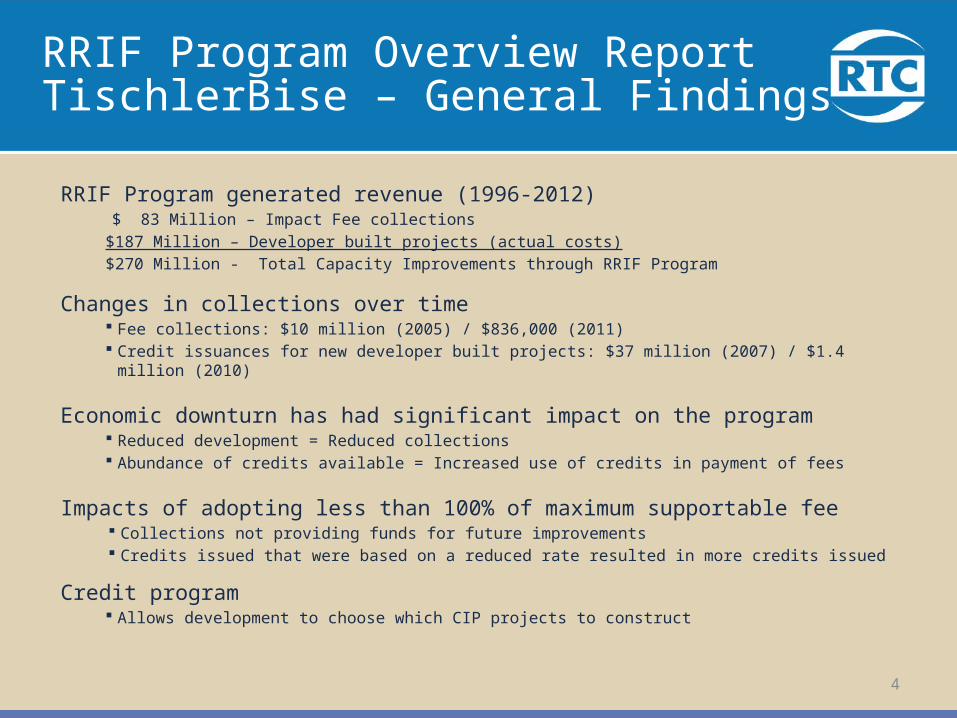
RRIF Program generated revenue (1996-2012) $ 83 Million – Impact Fee collections$187 Million – Developer built projects (actual costs)$270 Million - Total Capacity Improvements through RRIF Program
Changes in collections over time Fee collections: $10 million (2005) / $836,000 (2011) Credit issuances for new developer built projects: $37 million (2007) / $1.4 million (2010)
Economic downturn has had significant impact on the program Reduced development = Reduced collections Abundance of credits available = Increased use of credits in payment of fees
Impacts of adopting less than 100% of maximum supportable fee Collections not providing funds for future improvements Credits issued that were based on a reduced rate resulted in more credits issued
Credit program Allows development to choose which CIP projects to construct
4

Roadway Improvements 1996-2012
Roadway Improvements1996-2012
$ 155 M RTC Fuel Tax/Federally Funded Projects$ 83 M RRIF Funded projects $ 187 M Developer Funded projects$ 425 M Total RTC Capacity Projects
$ 65 M Local Match for State built Projects
$ 342 M Pavement Preservation Projects $ 832 M Total
5

RRIF Program Overview ReportTischlerBise - Recommendations
At the April 20th Workshop, TischlerBise identified a series of recommended improvements:
Update Demographic Data (underway with RTP process) Consolidate land uses in the current fee structure Index the impact fees annually between updates Recommended changes to the CIP:
Prioritize the list of projects in the CIP Re-define what are eligible improvements, ie, consider 1st two lanes of
a new road as development level improvements Add cost recovery component
Develop a tiered urban/suburban service areas Change how the impact fee program assesses credits
6
Why an Impact Fee Credit Program
NRS 278B.240 - Improvements required as a condition of approval for which impact fees were collected must be credited against those impact fees
7

Existing RRIF Credit Program
Used to pay impact fees in lieu of cash Represent dollar value of developer built projects
Actual cost/impact fee rate = credits Measured in Vehicle Miles Traveled (VMT) Life span of 20 Years Can be traded on the open market Must be used in the Benefit District they were
earned May be limited to 50% use on projects outside the
Original Development of Record8

RRIF Program Overview ReportTischlerBise – Recommendations (cont)
Modify Future Credit Program Eliminate the use of credits outside the
development of record Value credits in dollars in lieu of VMT’s Issue credits based on a prioritized CIP, ie, less
credits for improvements projected in the outer years
Issue credits based on the impact fees due or on the value of improvements listed in the CIP
9

Existing Credit Program Issues
Large amount of existing credits Credits being traded on the open market for
less than full value Existing credits being used for payment of
impact fees and little cash coming into the program
Credits approaching expiration dates Economy is still struggling
10

Impact Fee Payment History
11
19961997
19981999
20002001
20022003
20042005
20062007
20082009
20102011
$0
$5,000,000
$10,000,000
$15,000,000
$20,000,000
$25,000,000
Credits Redeemed
Cash Payments
Impa
ct F
ee P
aym
ents
(C
redi
ts a
nd C
ash)
Calendar Year

Credits by Expiring Year
12
Year Issued Total Credits Year
ExpiringAutomated
CreditsMissing Books (1)
Total Credits Remaining
% Remaining of Total
1996 32,717.84 2016 5,529.18 1,671.10 7,200.28 0.80%
1997 25,443.75 2017 0.00 3,913.46 3,170.19 0.35%
1998 98,747.14 2018 28,224.34 14,610.87 29,035.98 3.22%
1999 59,589.29 2019 3,191.28 12,887.93 14,689.55 1.63%
2000 65,264.67 2020 19,359.98 6,109.13 19,502.46 2.16%
2001 111,841.08 2021 19,945.89 3,563.29 26,977.94 2.99%
2002 41,618.11 2022 21,688.24 3,633.47 21,688.24 2.40%
2003 187,695.36 2023 83,158.42 206.40 104,764.89 11.61%
2004 186,972.70 2024 136,680.00 13,634.06 141,460.74 15.67%
2005 117,778.05 2025 90,879.12 20,190.81 101,783.74 11.28%
2006 248,426.44 2026 116,192.94 28,451.28 152,460.83 16.89%
2007 284,552.50 2027 228,726.60 0.00 237,773.78 26.34%
2008 27,436.23 2028 11,362.43 0.00 13,301.60 1.47%
2009 36,659.67 2029 27,259.07 0.00 27,259.07 3.02%
2010 6,981.81 2030 1,598.77 0.00 1,598.77 0.18%
Totals 1,531,724.64 793,796.26 108,871.80 902,668.06 100.00%
(1) Credits estimated in Missing Books may include credits already redeemed and/or lost books

Major Impact Fee Credit Holders
13
Major Credit Holders Current Credit Balance
% of Total Outstanding
CreditsCurrent Value($217/Credit)
Nevada Tri-Partners 155,338.72 17% $33,708,502.24
Sparks Galleria/Reno Corp Center/Tanamera 78,355.56 9% $17,003,156.52
South Meadows Properties 62,047.99 7% $13,464,413.83
Centex Homes 49,489.46 5% $10,739,212.82
NN Development Corp/Lewis Land Corp 39,362.81 4% $8,541,729.77
Spanish Springs Associates 36,057.18 4% $7,824,408.06
CAV Investments 26,730.87 3% $5,800,598.79
Corona Cyan, LLC 21,815.50 2% $4,733,963.50
SOMERSETT 30,152.92 3% $6,543,183.64
PROLOGIS DEVELOPMENT SERVICES 11,584.63 1% $2,513,864.71
Subtotal 510,935.64 57% $110,873,033.88
Other Credit Holders (300 Various Holders) 391,752.42 43% $85,010,275.14
Total 902,688.06 $195,883,309.02

BANN Buy Back Survey
Certificate HolderCurrent
Balance (Credits)
Dollar ValueCurrent Balance
Number of Credits Available
for RTC Redemption (Estimate)
Dollar Value of Redeemed Credits
($217/VMT)
BARKER COLEMAN CONSTRUCTION
1,393 $302,283.17
Barker Homes, Inc. 9,259 $2,009,220.36 9,259 $2,009,220
CENTEX HOMES 48,179 $10,454,843.00
CENTEX HOMES OF NEVADA 1,310 $284,270.00
Community Development Group 2,452 $532,094.85 2,452 $532,095
CQ Investment Co. 1,590 $345,053.87 1,590 $345,030
Damonte Ranch Commerce Center, L 22,751 $4,937,014.74
DBSI Wingfield Village, LLC 3,489 $757,099.98 1,488 $322,896
Development Solutionz, LLC 485 $105,245.00 485 $105,245
Di Loreto Homes 196 $42,629.65
Di Loreto Homes of Nevada 457 $99,210.23
Donahue Schriber Reality Group, 3,471 $753,150.58 3,471 $753,151
DOUBLE DIAMOND RANCH L.L.C.* 24,334 $5,280,478.00
Heritage Bank of Nevada 4,209 $913,353.00 3,490 $757,436
LIFE STYLE HOMES, INC 7,754 $1,682,618.00
Magnolia South Meadows II, LLC 91 $19,816.44 91 $19,816
Metro Phoenix Bank 7,590 $1,647,030.00 7,590 $1,647,030
Mono County Resorts Inc. 1,781 $386,548.61 1,781 $386,549
Nell J. Redfield Foundation 5,386 $1,168,762.00 5,342 $1,159,244
Nevada Spectrum, LLC 1,064 $230,950.93 532 $115,444
NEVADA TRI PARTNERS, LLC 132,573 $28,768,341.00 20,000 $4,340,000
NN Develop. Corp. & Lewis Land C 25,880 $5,616,033.78 5,000 $1,085,000
RBK Investments LLC 482 $104,672.12 482 $104,594
Reno Corporate Center, LLC 24,163 $5,243,371.00 18,000 $3,906,000
RRW Stonebrook, LLC 464 $100,731.40
Service 1st Bank of Nevada 16,680 $3,619,560.00 16,680 $3,619,560
Spanish Springs Assoc. LP 36,056 $7,824,152.00 36,056 $7,824,152
Sparks Galleria Investors, LLC 50,688 $10,999,296.00 44,000 $9,548,000
Sparks McCarran, LLC (Wall Stree 84 $18,256.21 84 $18,256
TICO Construction Company, Inc 841 $182,540.40 841 $182,540
Toll Brothers 1,210 $262,520.09
Toll North Reno, LLC 6,844 $1,485,148.00
Toll South Reno, LLC 12,980 $2,816,660.00 3,000 $651,000
Washoe County School District 17,067 $3,703,539.00 6,095 $1,322,615
Subtotal 473,256 $102,696,493.41 187,810 $40,754,874
Other Credit Holders
Total Outstanding Credits 902,668 $195,878,969.02
BANN contacted various credits holders who may be interested in a redemption program
Approximately 188,000 credits were identified to be returned to RTC, representing 21% of the outstanding credits
14
Represents $40 million at today’s rate

Discussions to address Existing Credit Program
Leave Program as is – use or lose Extend existing credit expiration dates (IE,
through 2 for 1 exchange program) Allow credits to be used throughout the
Service Area and not limited to the Benefit District
Institute a Buy-Back program (Proposed by the development community)
15

Next Steps
Open Public discussion Continued analysis by TMRPA to develop
projected growth by Land Use within various timeframes
Financial analysis by TischlerBise on impacts of a Buy Back program
Further discussion at the September 21st RTC Board Meeting
16


