74
Aimee R. Holt, PhD Middle Tennessee State University RTI: Meeting the Needs of Students with Dyslexia

Aimee R. Holt, PhD
Middle Tennessee State University
RTI: Meeting the Needs of Students with Dyslexia
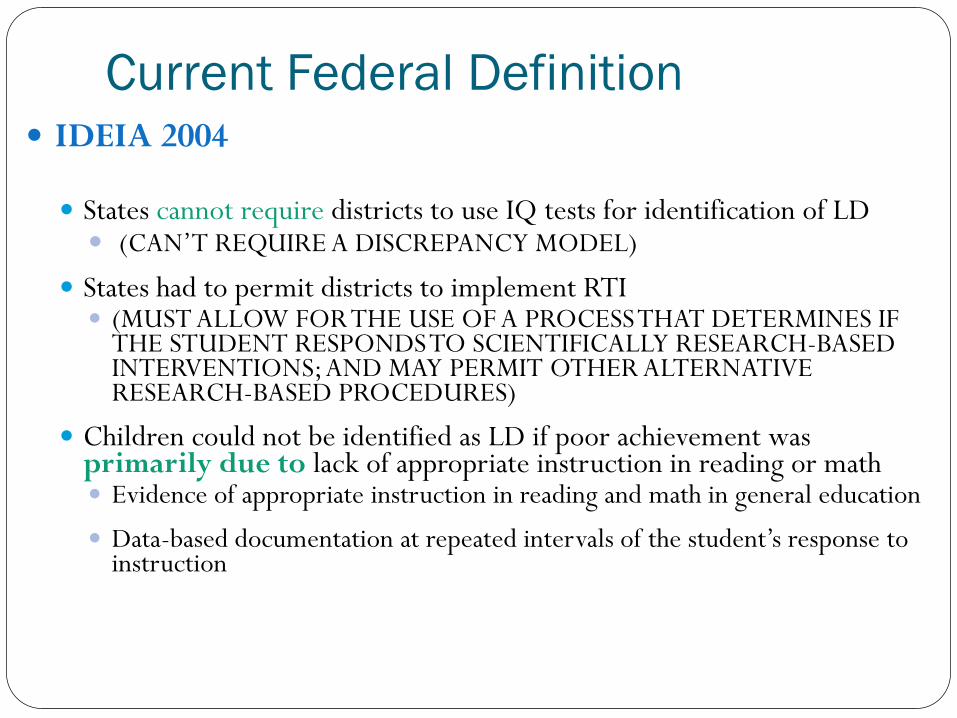
Current Federal Definition IDEIA 2004 States cannot require districts to use IQ tests for identification of LD (CAN’T REQUIRE A DISCREPANCY MODEL)
States had to permit districts to implement RTI (MUST ALLOW FOR THE USE OF A PROCESS THAT DETERMINES IF
THE STUDENT RESPONDS TO SCIENTIFICALLY RESEARCH-BASED INTERVENTIONS; AND MAY PERMIT OTHER ALTERNATIVE RESEARCH-BASED PROCEDURES)
Children could not be identified as LD if poor achievement was primarily due to lack of appropriate instruction in reading or math Evidence of appropriate instruction in reading and math in general education
Data-based documentation at repeated intervals of the student’s response to instruction
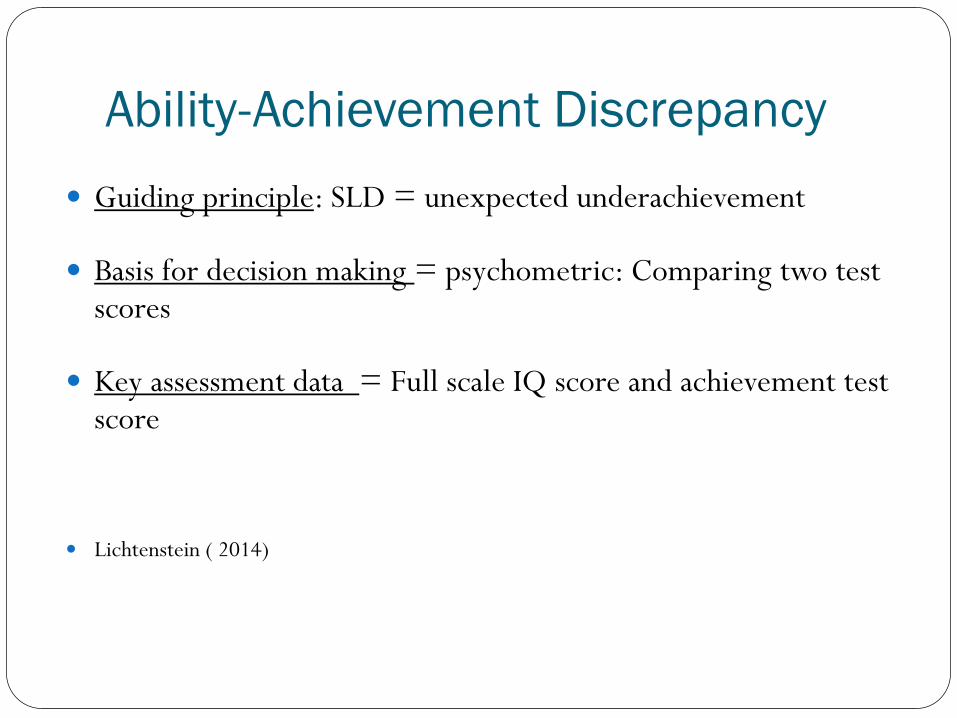
Ability-Achievement Discrepancy Guiding principle: SLD = unexpected underachievement
Basis for decision making = psychometric: Comparing two test scores
Key assessment data = Full scale IQ score and achievement test score
Lichtenstein ( 2014)
What is RTI
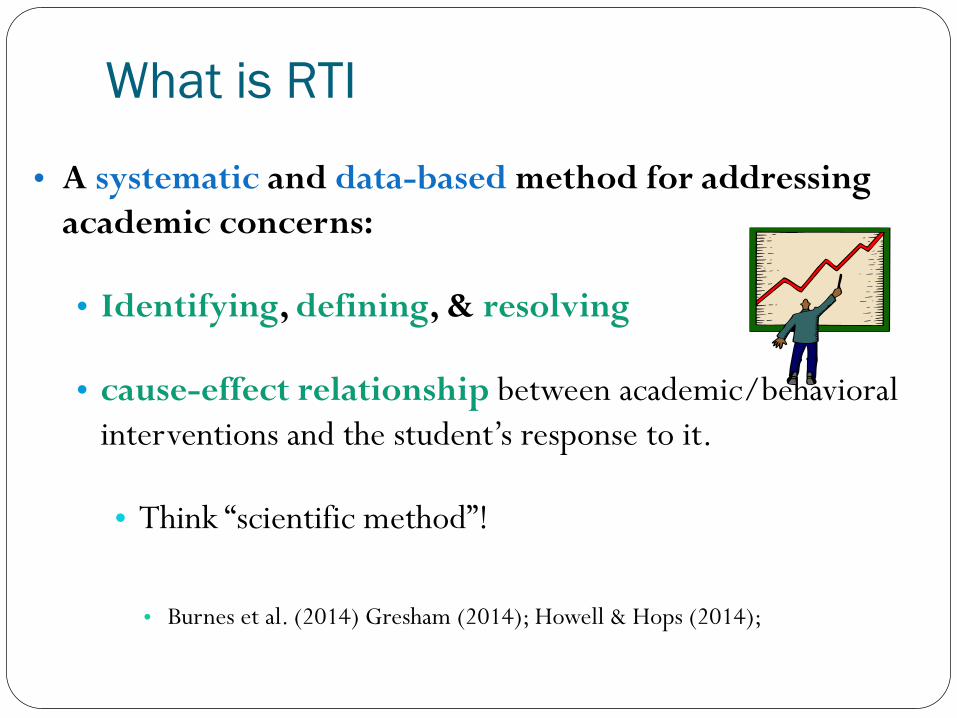
• A systematic and data-based method for addressing academic concerns:
• Identifying, defining, & resolving
• cause-effect relationship between academic/behavioral interventions and the student’s response to it.
• Think “scientific method”!
• Burnes et al. (2014) Gresham (2014); Howell & Hops (2014);
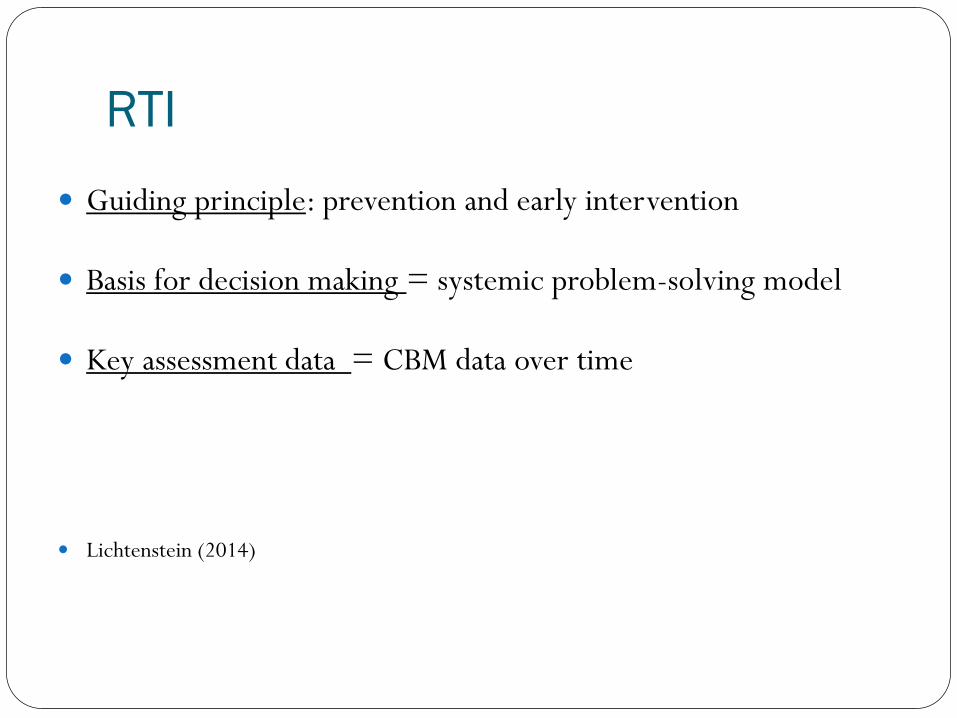
RTI Guiding principle: prevention and early intervention
Basis for decision making = systemic problem-solving model
Key assessment data = CBM data over time
Lichtenstein (2014)
Three Main Components of RTI High quality core instruction
All children deserve effective instruction that leads to achieving functional skills
Frequent, systematic data collection
Continuous assessment leads to skill improvement
Data-based decision making Adjustment to instruction must be based on student performance data
Burnes et al. (2014); Gresham (2014); Lichtenstein (2014)

• At each tier within RTI2, a problem solving model is employed to make decisions
Problem Solving
•Analyze the results of
implementation •Determine next
steps
•Analyze the assessment plan
results •Develop an
intervention plan
•Define the problem •Develop an assessment plan
Implement Plan Progress monitor
Problem Identification
Problem Analysis Plan Evaluation

RTI Instead of Discrepancy Models • RTI is a general education based method for monitoring
student progress
• Why change?
• Lack of evidence to support the discrepancy method
• Evidence that other methods (RTI) work just as well or better
• A desire to do away with “wait to fail” • When interventions are delayed until age 9, approximately 75% will
continue to have difficulties throughout high school (National Reading Panel)
• Burnes et al. (2014); Gresham (2014); Howell & Hops (2014); Lichtenstein ( 2014)
Essential Conditions and Support for RTI State-level infrastructure to support RTI
District and school level leadership support High quality, evidenced-based instruction in general education
Preservice and inservice professional development Maximized use of research based, scientifically validated interventions
appropriately matched to student needs and implemented with fidelity
Use of data to systematically monitor and make decisions about RTI
Sufficient time and resources for staff to collaborate Documentation procedures for tracking

What are the measures we used for data collection in an RTI model?
Three types of CBM’s

3 Types of CBM’s
Sub-skill Mastery Measures Skill Based Measures General Outcome Measures (GOM’s)
Subskill Mastery Measures
SMMs are very narrow in focus
Sensitive to short term change
Can be administered frequently (weekly)
Ex.
Letter naming fluency Letter sound fluency Phoneme segmentation fluency
Skills-Based Measures SBM require multiple subskills to be combined Can be used when capstone tasks are not available Require more time to see change (growth) Ex. Word Reading Fluency (every other week)
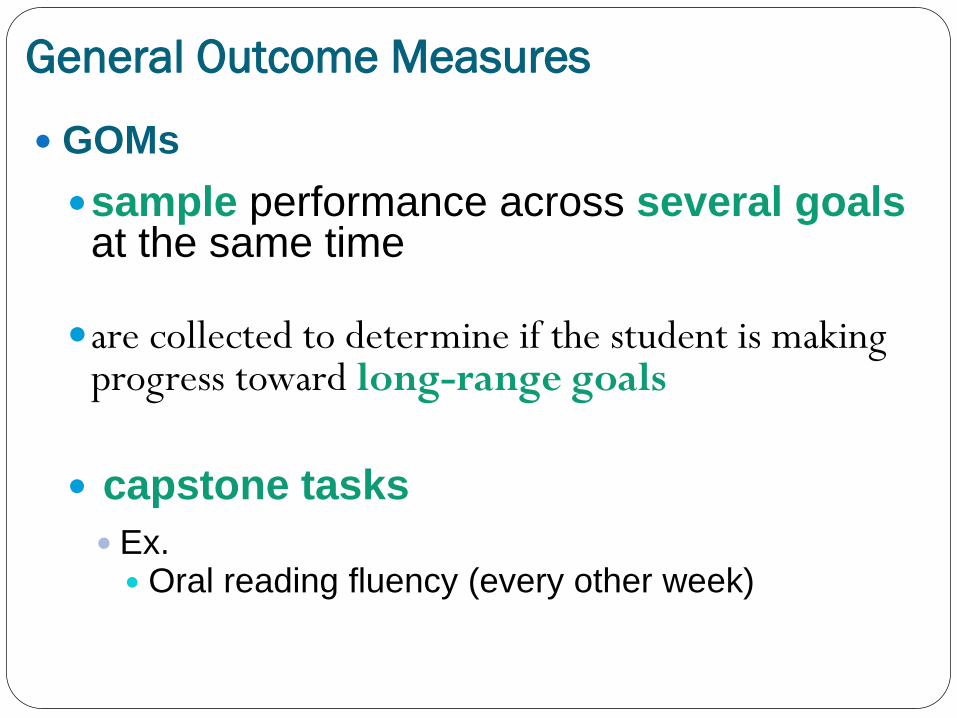
General Outcome Measures
GOMs
sample performance across several goals at the same time
are collected to determine if the student is making
progress toward long-range goals
capstone tasks
Ex. Oral reading fluency (every other week)

CBM use at each tier
Tier 1 Universal screener
Tier 2 Survey level assessment Progress monitoring
Tier 3 Specific level assessment Progress monitoring

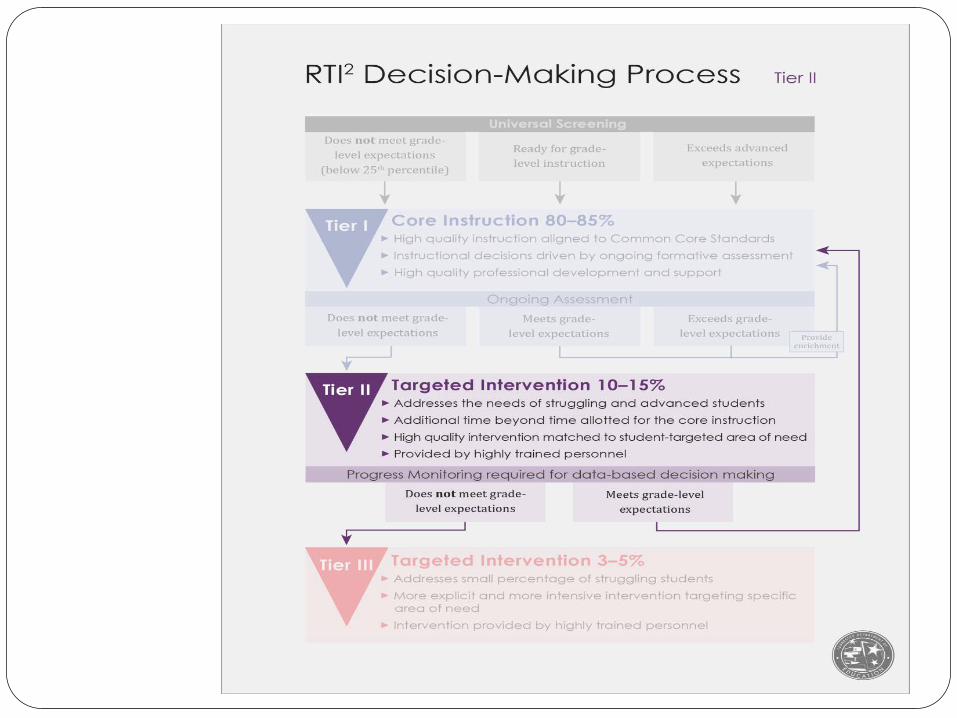
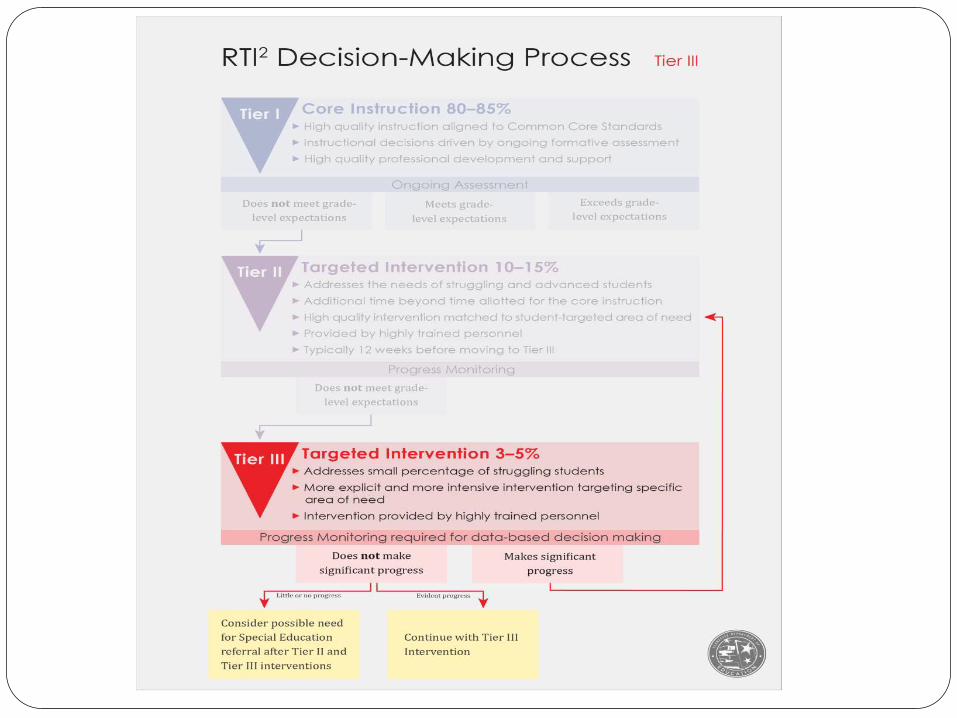
Let’s take a closer look at Tennessee’s RTI2 model

TN’s RTI2 • What is Tier I?
• Scientifically based CORE instruction
• Nationally normed skill based universal screening administered 3X a year • grade level
• Decisions about students’ academic needs are data-driven
RTI2 manual pg 21-33
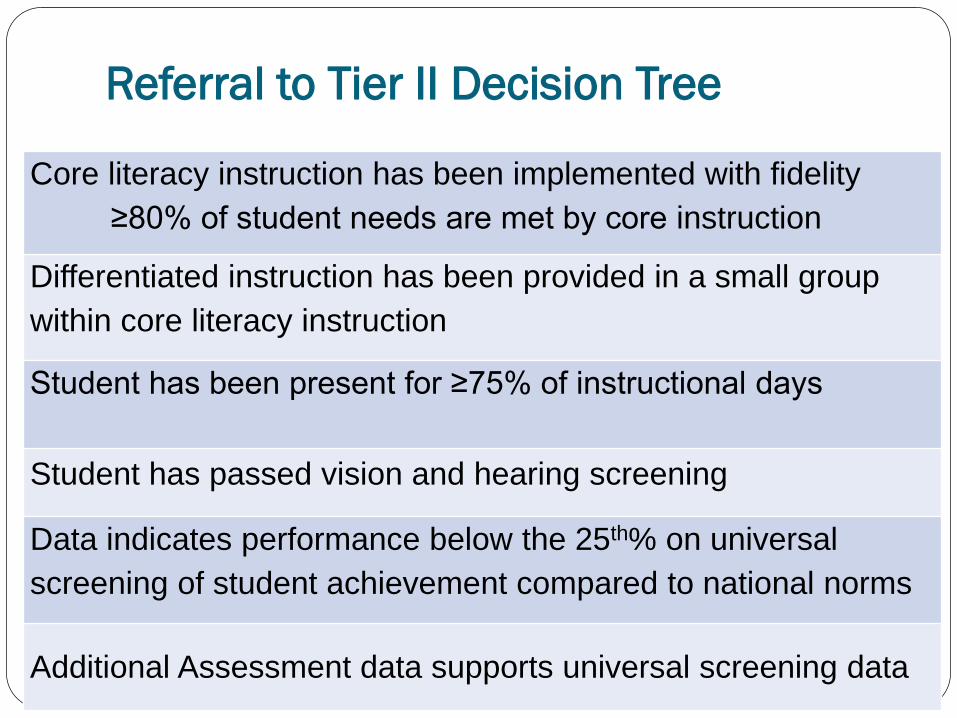
Referral to Tier II Decision Tree
Core literacy instruction has been implemented with fidelity ≥80% of student needs are met by core instruction
Differentiated instruction has been provided in a small group within core literacy instruction
Student has been present for ≥75% of instructional days Student has passed vision and hearing screening
Data indicates performance below the 25th% on universal screening of student achievement compared to national norms
Additional Assessment data supports universal screening data
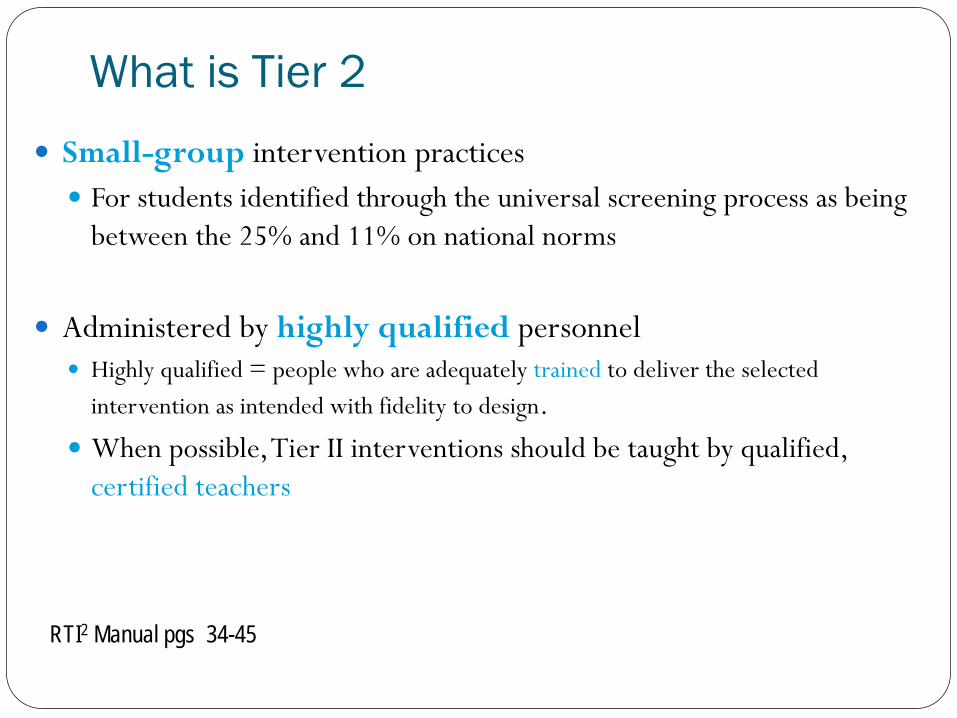
What is Tier 2 Small-group intervention practices For students identified through the universal screening process as being
between the 25% and 11% on national norms
Administered by highly qualified personnel Highly qualified = people who are adequately trained to deliver the selected
intervention as intended with fidelity to design. When possible, Tier II interventions should be taught by qualified,
certified teachers
RTI2 Manual pgs 34-45
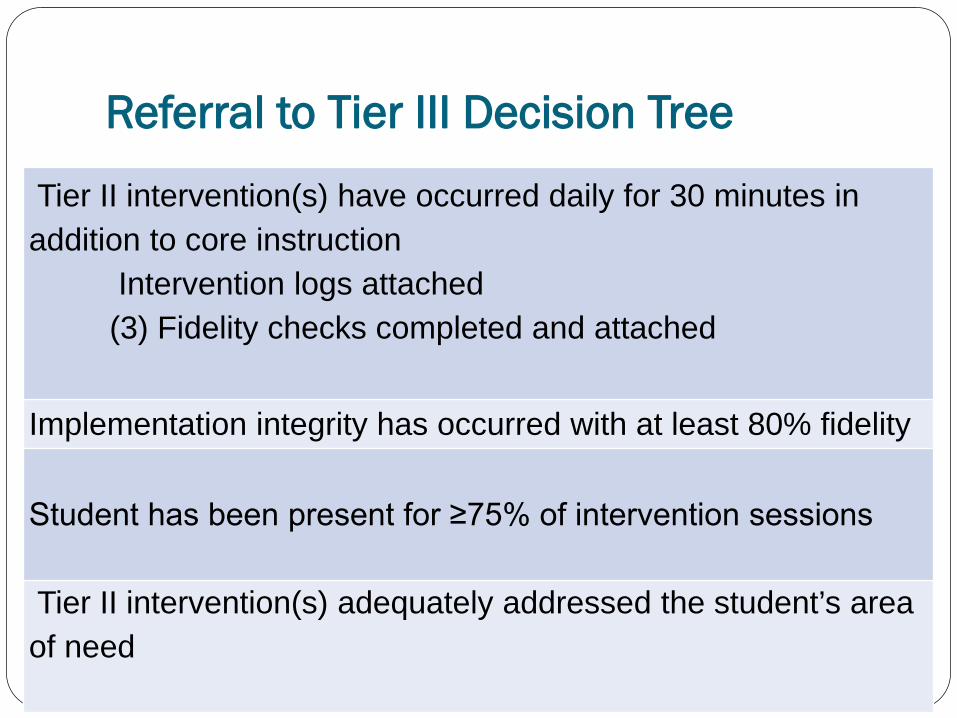
Referral to Tier III Decision Tree
Tier II intervention(s) have occurred daily for 30 minutes in addition to core instruction
Intervention logs attached (3) Fidelity checks completed and attached
Implementation integrity has occurred with at least 80% fidelity Student has been present for ≥75% of intervention sessions Tier II intervention(s) adequately addressed the student’s area of need
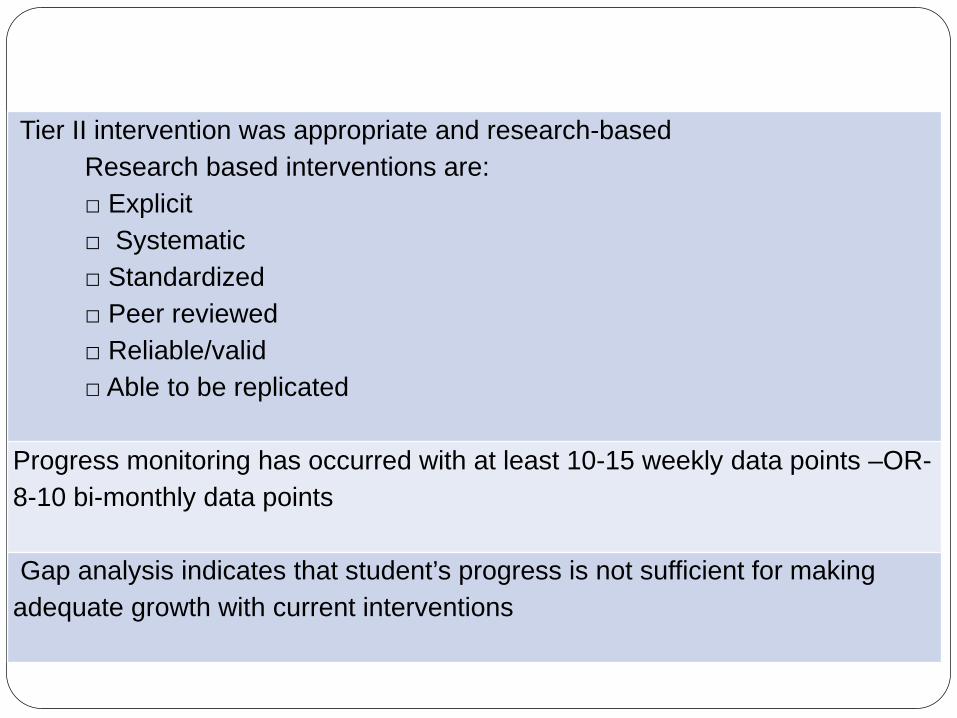
Tier II intervention was appropriate and research-based Research based interventions are: □ Explicit □ Systematic □ Standardized □ Peer reviewed □ Reliable/valid □ Able to be replicated
Progress monitoring has occurred with at least 10-15 weekly data points –OR- 8-10 bi-monthly data points Gap analysis indicates that student’s progress is not sufficient for making adequate growth with current interventions
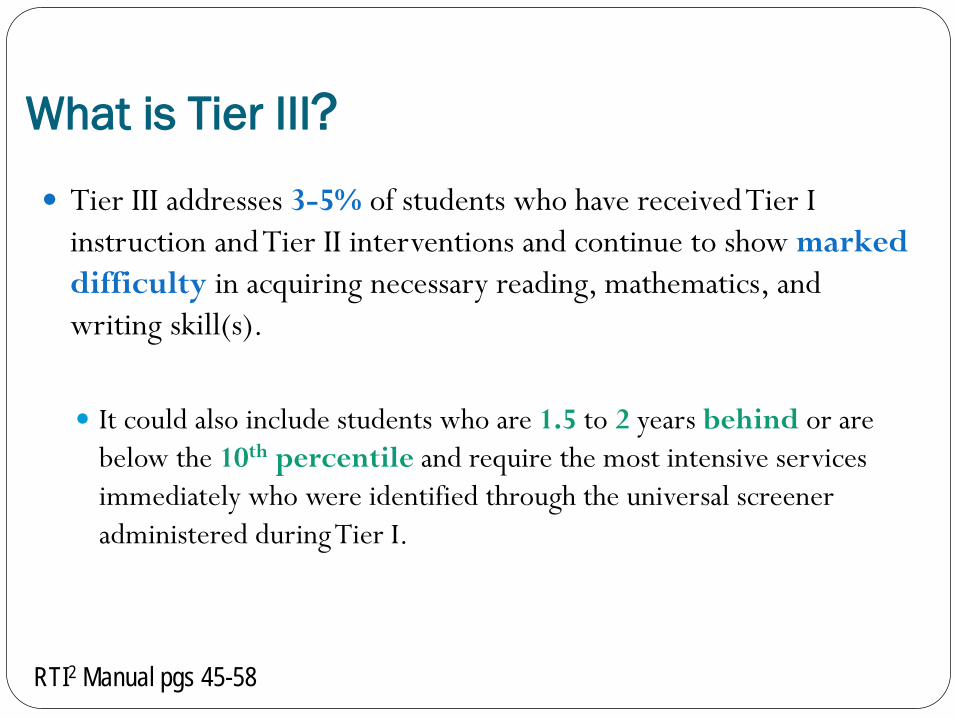
What is Tier III? Tier III addresses 3-5% of students who have received Tier I
instruction and Tier II interventions and continue to show marked difficulty in acquiring necessary reading, mathematics, and writing skill(s).
It could also include students who are 1.5 to 2 years behind or are
below the 10th percentile and require the most intensive services immediately who were identified through the universal screener administered during Tier I.
RTI2 Manual pgs 45-58
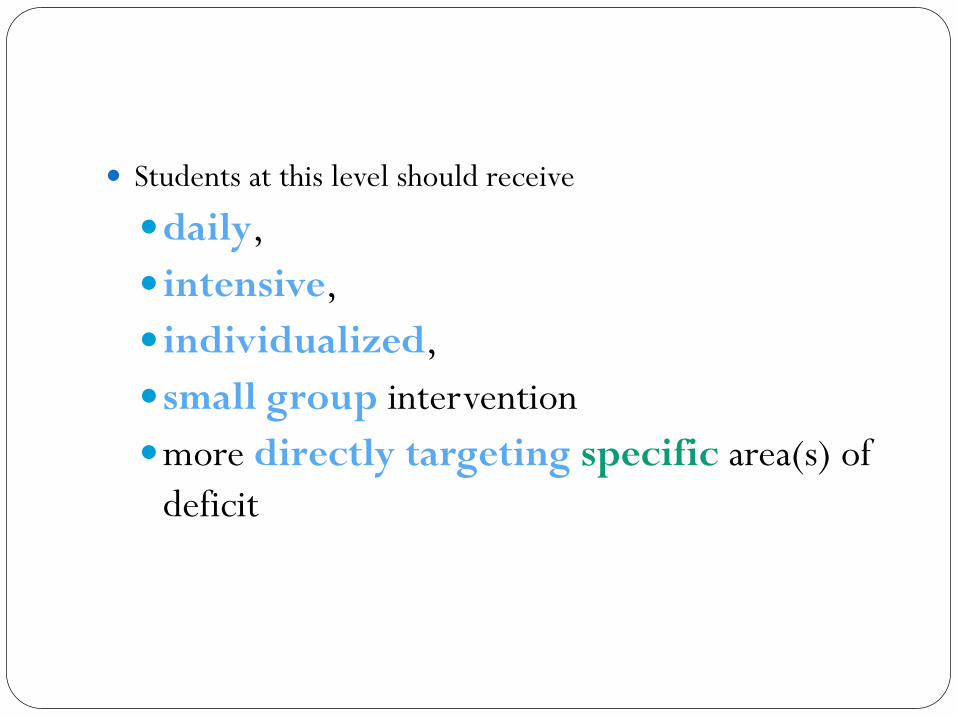
Students at this level should receive
daily, intensive, individualized, small group intervention more directly targeting specific area(s) of
deficit
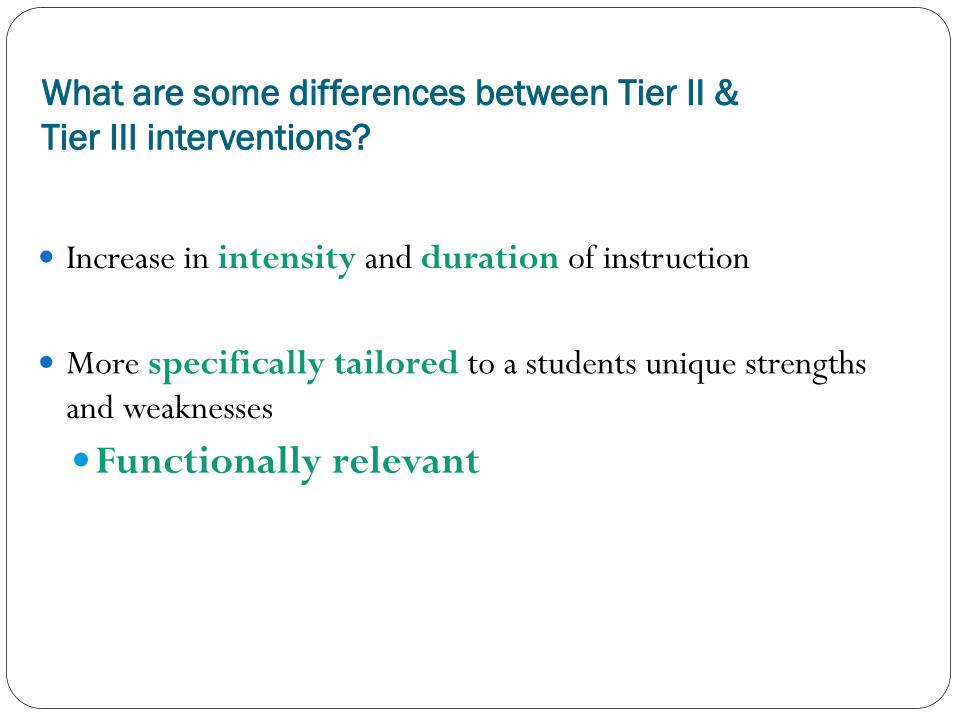
What are some differences between Tier II & Tier III interventions?
Increase in intensity and duration of instruction More specifically tailored to a students unique strengths
and weaknesses
Functionally relevant
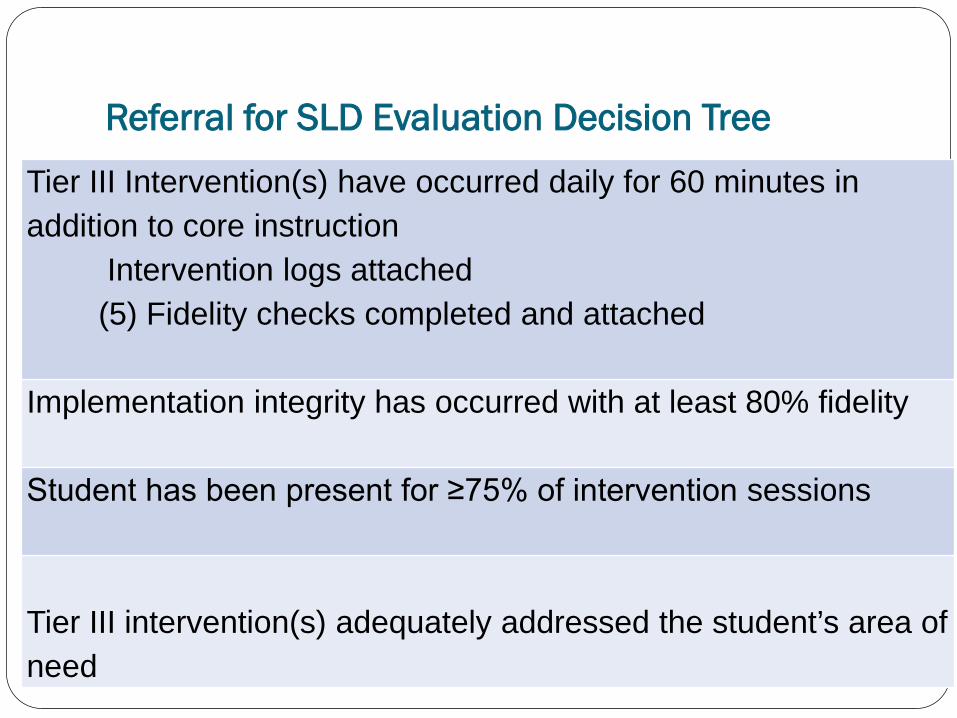
Referral for SLD Evaluation Decision Tree
Tier III Intervention(s) have occurred daily for 60 minutes in addition to core instruction
Intervention logs attached (5) Fidelity checks completed and attached
Implementation integrity has occurred with at least 80% fidelity Student has been present for ≥75% of intervention sessions Tier III intervention(s) adequately addressed the student’s area of need
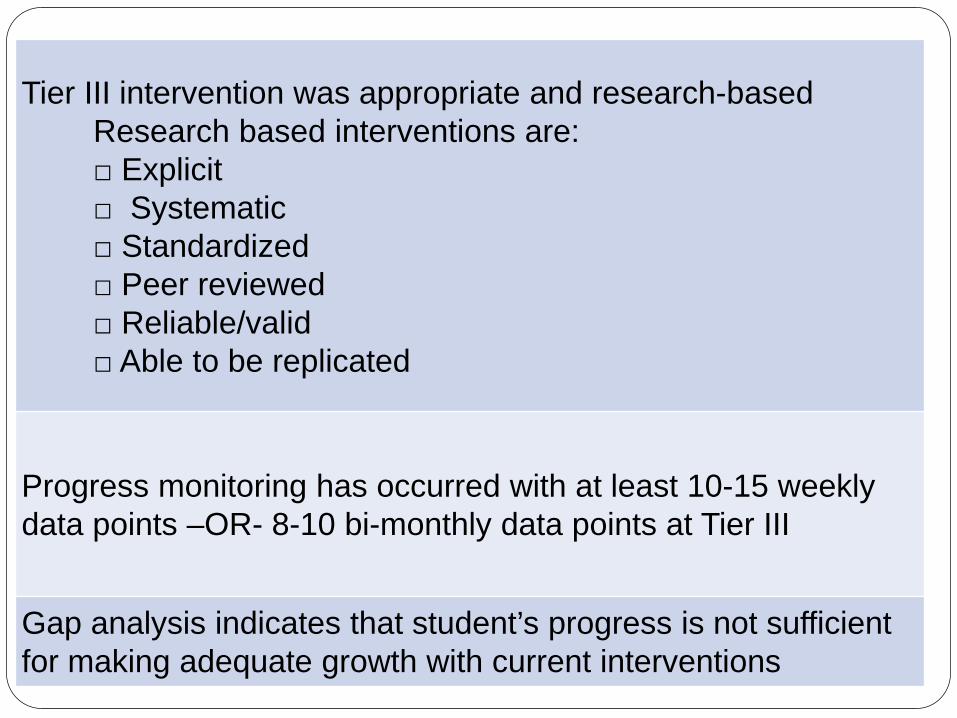
Tier III intervention was appropriate and research-based Research based interventions are: □ Explicit □ Systematic □ Standardized □ Peer reviewed □ Reliable/valid □ Able to be replicated
Progress monitoring has occurred with at least 10-15 weekly data points –OR- 8-10 bi-monthly data points at Tier III
Gap analysis indicates that student’s progress is not sufficient for making adequate growth with current interventions
Let’s Look at some commonly used Universal Screeners
and how they relate to the new TN Dyslexia law
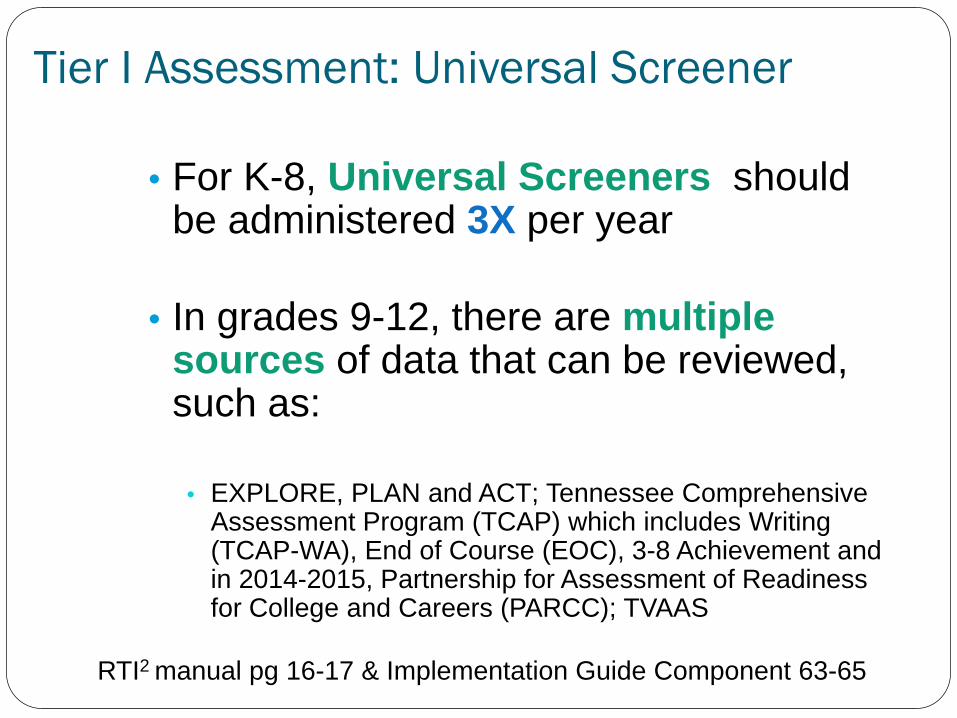
Tier I Assessment: Universal Screener
• For K-8, Universal Screeners should be administered 3X per year
• In grades 9-12, there are multiple
sources of data that can be reviewed, such as:
• EXPLORE, PLAN and ACT; Tennessee Comprehensive
Assessment Program (TCAP) which includes Writing (TCAP-WA), End of Course (EOC), 3-8 Achievement and in 2014-2015, Partnership for Assessment of Readiness for College and Careers (PARCC); TVAAS
RTI2 manual pg 16-17 & Implementation Guide Component 63-65

Dyslexia Screening Phonological Awareness
Alphabet knowledge
Sound-symbol recognition
Decoding Skills
Rapid Naming
Encoding (Spelling) Skills
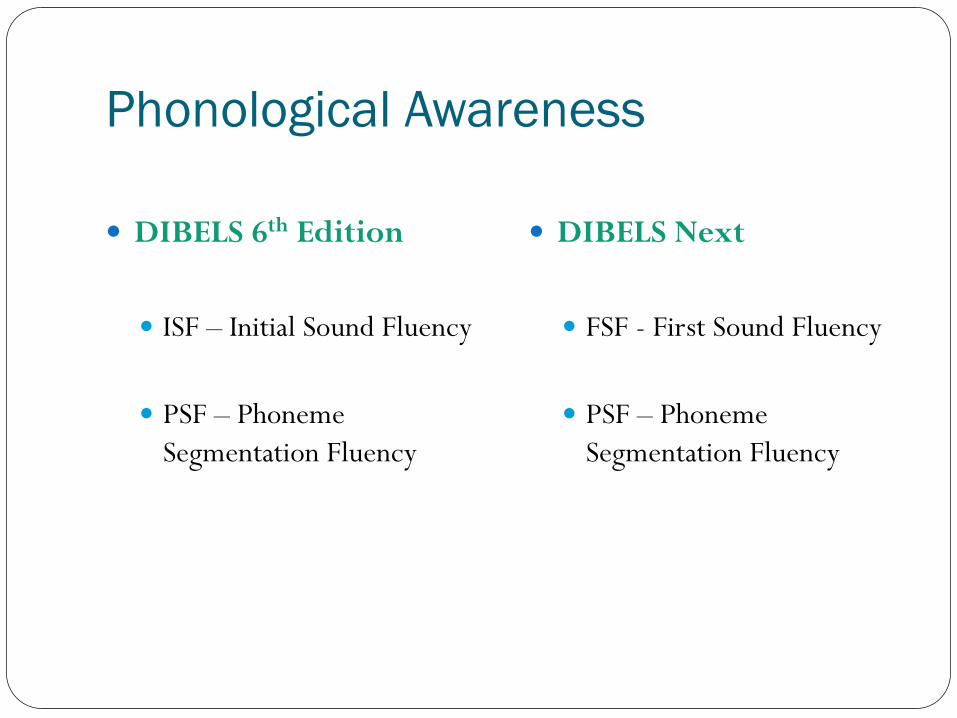
Phonological Awareness
DIBELS 6th Edition ISF – Initial Sound Fluency PSF – Phoneme
Segmentation Fluency
DIBELS Next FSF - First Sound Fluency PSF – Phoneme
Segmentation Fluency
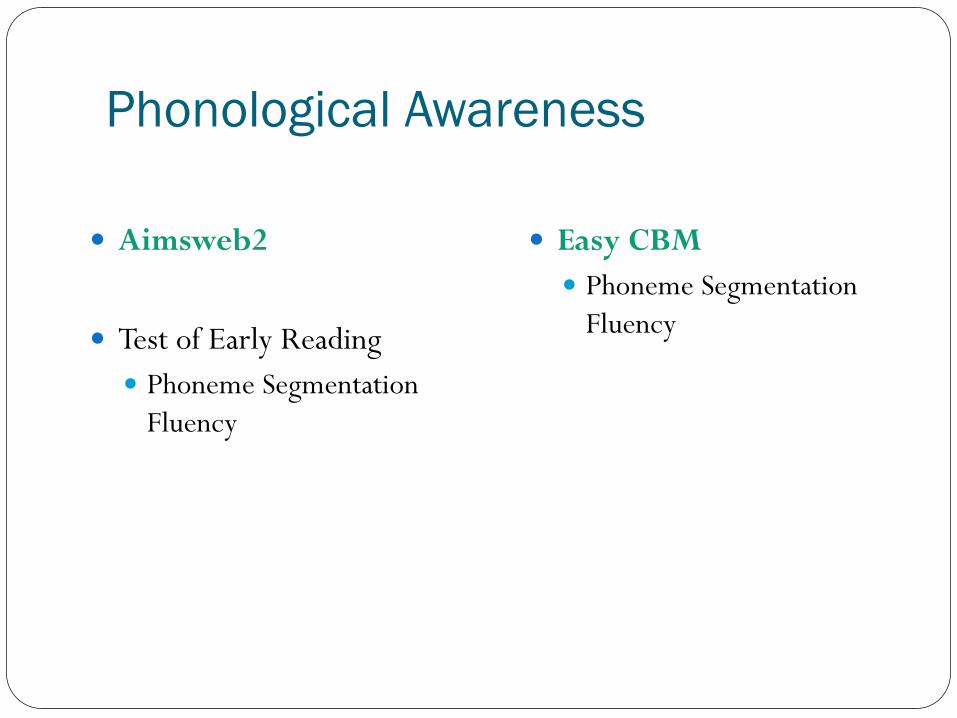
Phonological Awareness
Aimsweb2
Test of Early Reading Phoneme Segmentation
Fluency
Easy CBM Phoneme Segmentation
Fluency
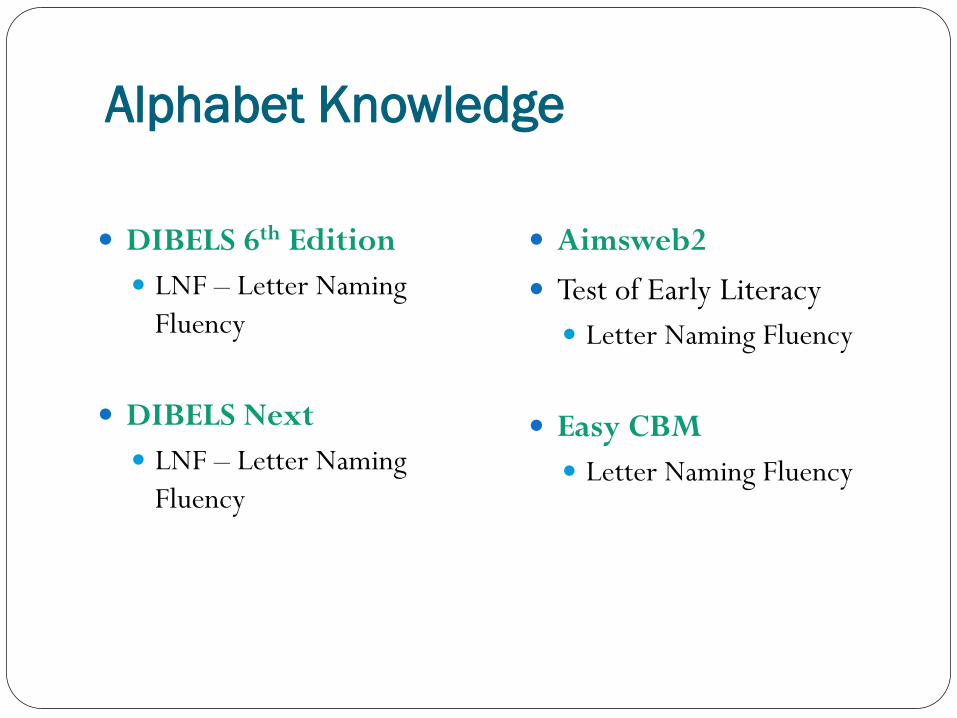
Alphabet Knowledge
DIBELS 6th Edition LNF – Letter Naming
Fluency
DIBELS Next LNF – Letter Naming
Fluency
Aimsweb2 Test of Early Literacy Letter Naming Fluency
Easy CBM Letter Naming Fluency
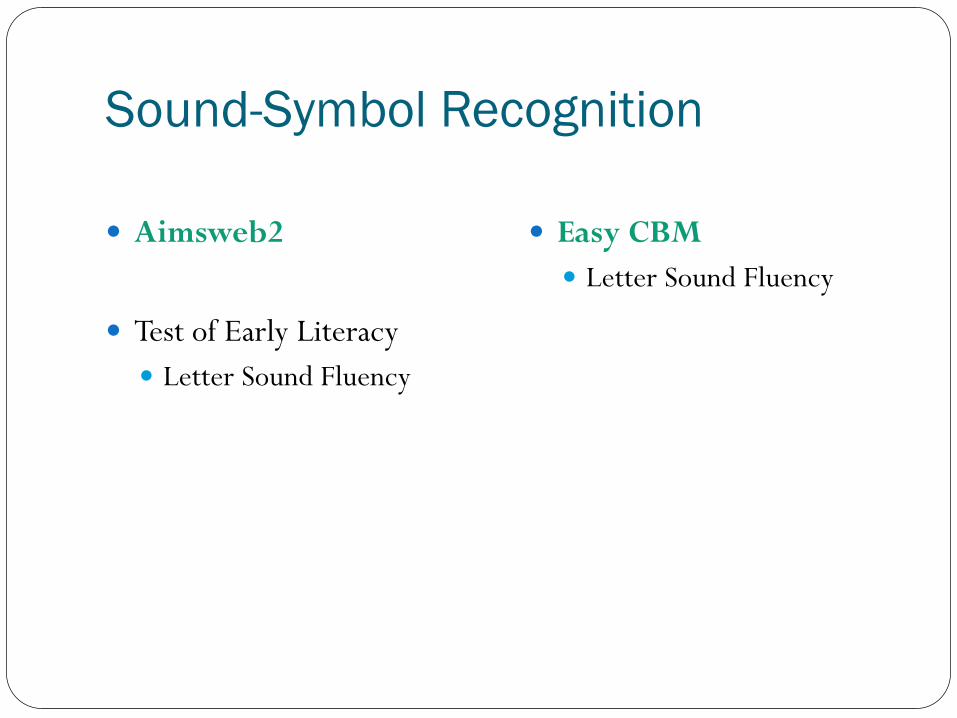
Sound-Symbol Recognition
Aimsweb2 Test of Early Literacy Letter Sound Fluency
Easy CBM Letter Sound Fluency

Decoding Skills DIBELS 6th Edition NWF – Nonsense Word
Fluency
ORF – Oral Reading Fluency (% accuracy)
– 93-97% correct
DIBELS Next NWF – Nonsense Word
Fluency
ORF – Oral Reading Fluency
Aimsweb2
Test of Early Literacy Nonsense Word Fluency
Oral Reading (R-CBM) Easy CBM Word Reading Fluency (K-2)
Passage Reading Fluency (1-8)
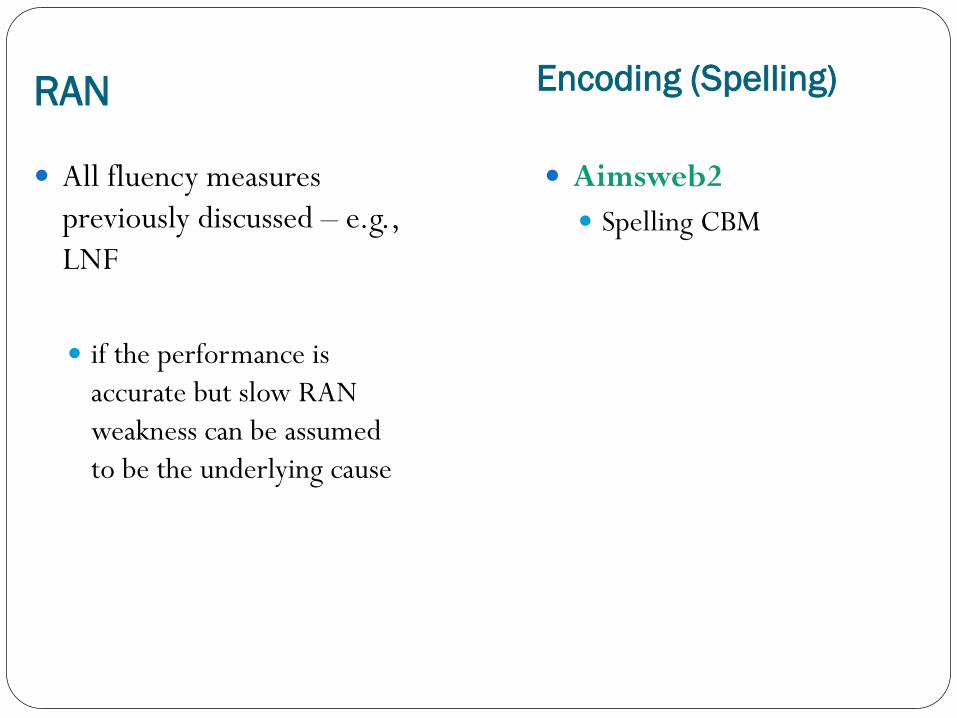
RAN Encoding (Spelling)
All fluency measures previously discussed – e.g., LNF
if the performance is
accurate but slow RAN weakness can be assumed to be the underlying cause
Aimsweb2 Spelling CBM
What Next?
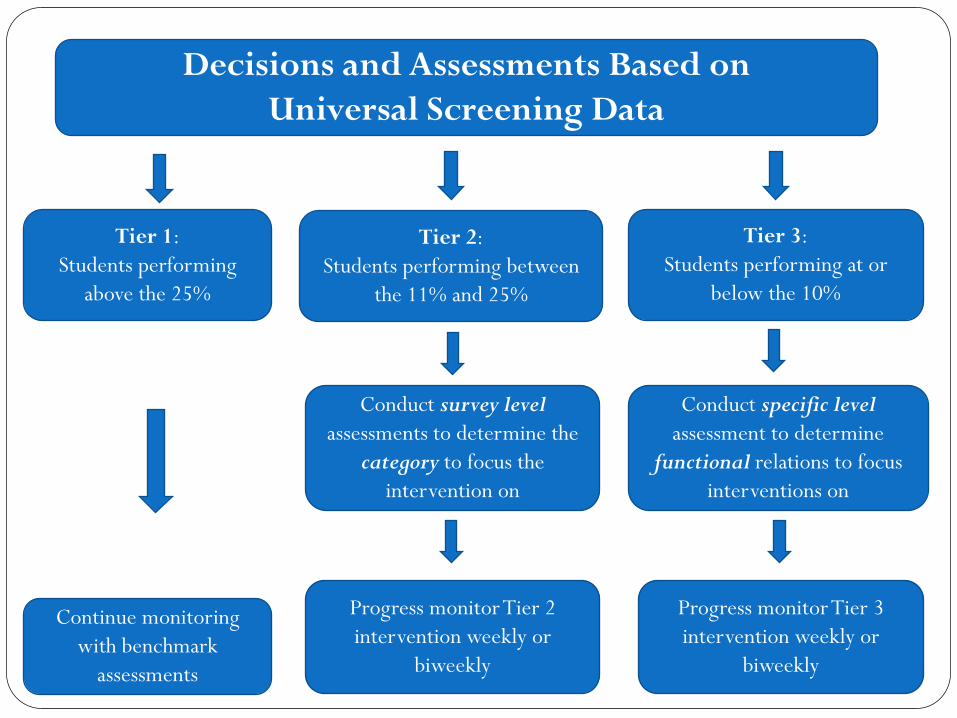
Decisions and Assessments Based on Universal Screening Data
Tier 1: Students performing
above the 25%
Tier 2: Students performing between
the 11% and 25%
Tier 3: Students performing at or
below the 10%
Continue monitoring with benchmark
assessments
Conduct survey level assessments to determine the
category to focus the intervention on
Conduct specific level assessment to determine
functional relations to focus interventions on
Progress monitor Tier 2 intervention weekly or
biweekly
Progress monitor Tier 3 intervention weekly or
biweekly

Linking Assessment to Interventions….
Research has shown that effective interventions have certain features in common: Correctly targeted to the student’s deficit
Appropriate level of challenge (instructional range)
Explicit instruction in the skill
Frequent opportunities to practice (respond)
Provide immediate corrective feedback
(e.g., Brown-Chidsey & Steege, 2010; Burns, Riley-Tillman, & VanDerHeyden, 2013; Burns, VanDerHeyden, & Boice, 2008;)
What Would Assessment at
Tier II Look Like?
So you have identified your “at risk students”- now what?
You will need to conduct Survey Level Assessment (SLA) for these students
Survey Level Assessment (SLA) Can be used to: (a) provide information on the difference between prior
knowledge and skills deficits to be used to plan instructional interventions &
(b) serve as baseline for progress monitoring
Why is it important to conduct Survey Level Assessments before beginning Tier II interventions?
The primary question being addressed by the survey level assessment at Tier II is
“What is the CATEGORY of the problem” What is the specific area of academic deficit? (e.g., Riley-
Tillman, Burns, Gibbons, 2013)
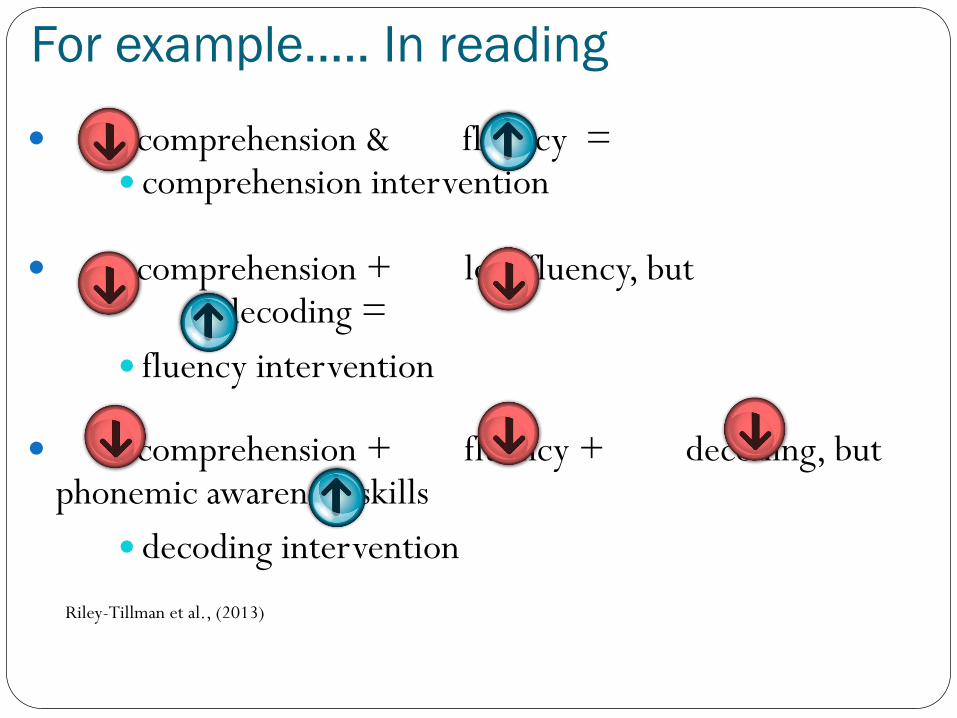
For example….. In reading
comprehension & fluency = comprehension intervention
comprehension + low fluency, but
decoding =
fluency intervention
comprehension + fluency + decoding, but phonemic awareness skills
decoding intervention Riley-Tillman et al., (2013)
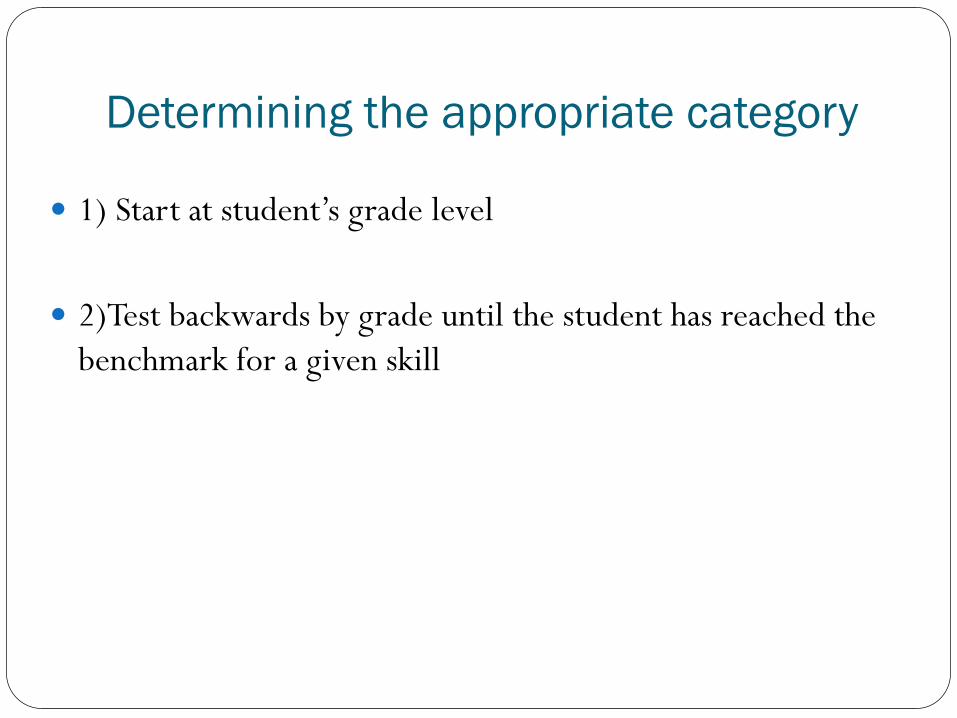
Determining the appropriate category
1) Start at student’s grade level
2)Test backwards by grade until the student has reached the benchmark for a given skill

Let’s look at Mitch a 2nd grade student
At the fall benchmark, he was identified on PRF as being below the 25th%.
His score was 30 wcpm with 86% accuracy 64 wcpm = 50th % 41 wcpm = 25th % 26 wcpm = 10th %
Survey level assessment were conducted using:
PRF 1st grade – (fluency) WRF 1st grade – (phonics) LSF 1st grade – (phonics) PS 1st grade – (phonemic awareness)
Problem Identification
Problem Analysis

Mitch’s Scores
EasyCBM Scores Representing 1st grade
Benchmark
PRF – 33 wcpm; 87% WRF – 28 wic; 90% LSF – 48 lsc; 98% PS – 40 psc; 97%
Fall Winter Spring PRF 32 60
WRF 15 28 49
LSF 31 41 45
PS 37 --- ---

What next…. You link your assessment data to an intervention that
targets the category of skill deficit that was identified You select progress monitoring probe(s) that assess
that skill You set the student’s goal for improvement You can use ROI & Gap Analysis worksheets to help
with this
What Would Assessment at
Tier III Look Like?

Specific Level Assessment
Functional analysis of skills Are used to: (a) identify specific skills deficits; (b) students prior knowledge; & (c) serve as baseline for progress monitoring
Specific level assessments rely primarily on subskill mastery measures “drill down” to specific deficits
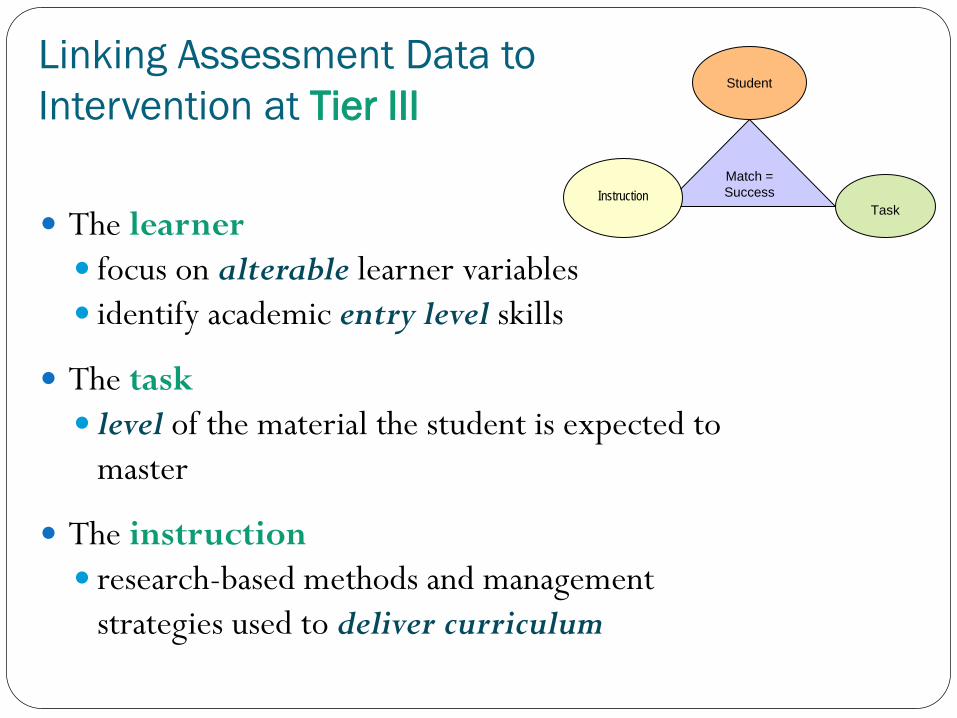
Linking Assessment Data to Intervention at Tier III
The learner focus on alterable learner variables identify academic entry level skills
The task level of the material the student is expected to
master
The instruction research-based methods and management
strategies used to deliver curriculum
Match = Success
Instruction
Student
Task
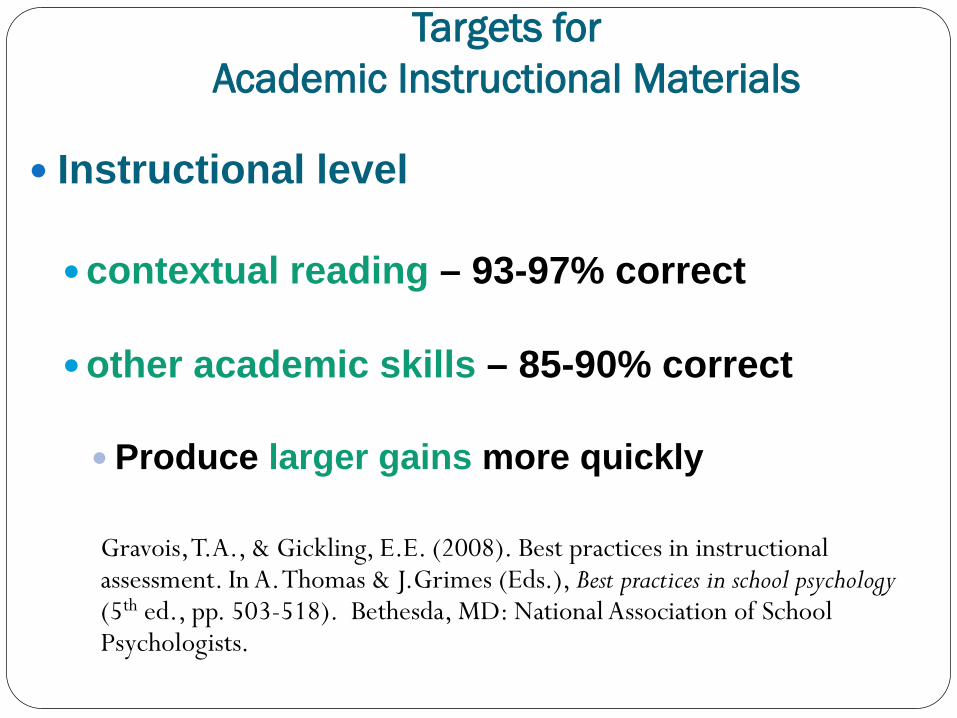
Targets for Academic Instructional Materials
Instructional level contextual reading – 93-97% correct other academic skills – 85-90% correct Produce larger gains more quickly
Gravois, T.A., & Gickling, E.E. (2008). Best practices in instructional assessment. In A. Thomas & J.Grimes (Eds.), Best practices in school psychology (5th ed., pp. 503-518). Bethesda, MD: National Association of School Psychologists.

Let’s look at Mitch again….. Specific Level Assessment –
Phonemic Awareness: Normative LAC 3 or CTOPP
Decoding Skills: CBM Decoding Skills test Reading inventory such as QRI
or IRI Placement measures from
programs such Wilson
Normative WIST WIAT WJ
Spelling: CBM Developmental Spelling Analysis ABC’s of CMB Spelling CBM
Normative
WIST WIAT WJ
Problem Analysis
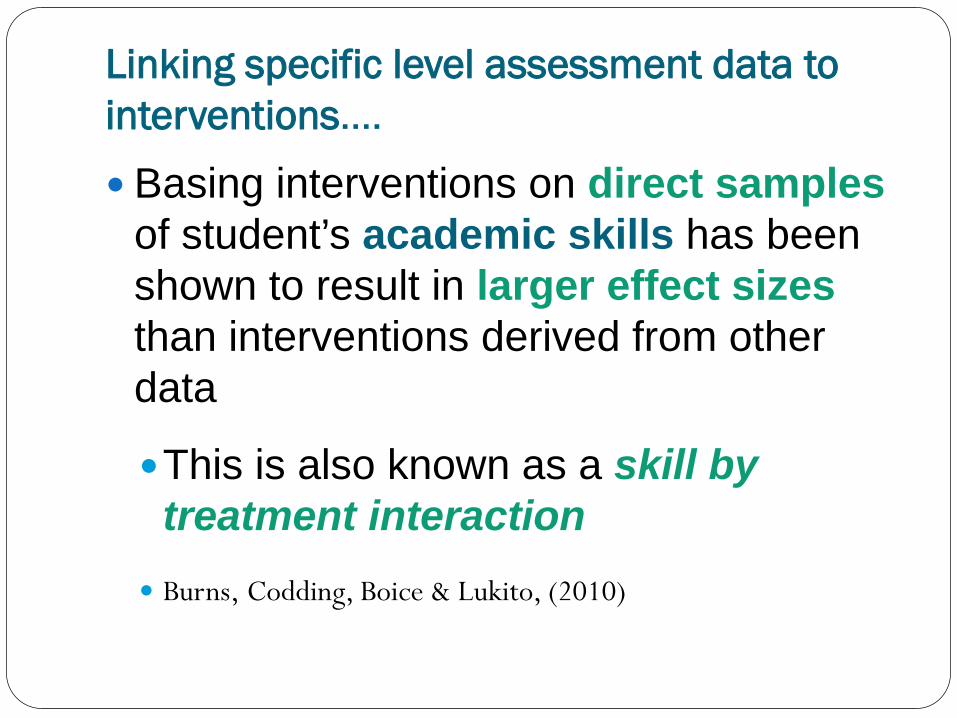
Linking specific level assessment data to interventions….
Basing interventions on direct samples of student’s academic skills has been shown to result in larger effect sizes than interventions derived from other data
This is also known as a skill by treatment interaction
Burns, Codding, Boice & Lukito, (2010)

What Would Data Analysis at Tier III Look Like?
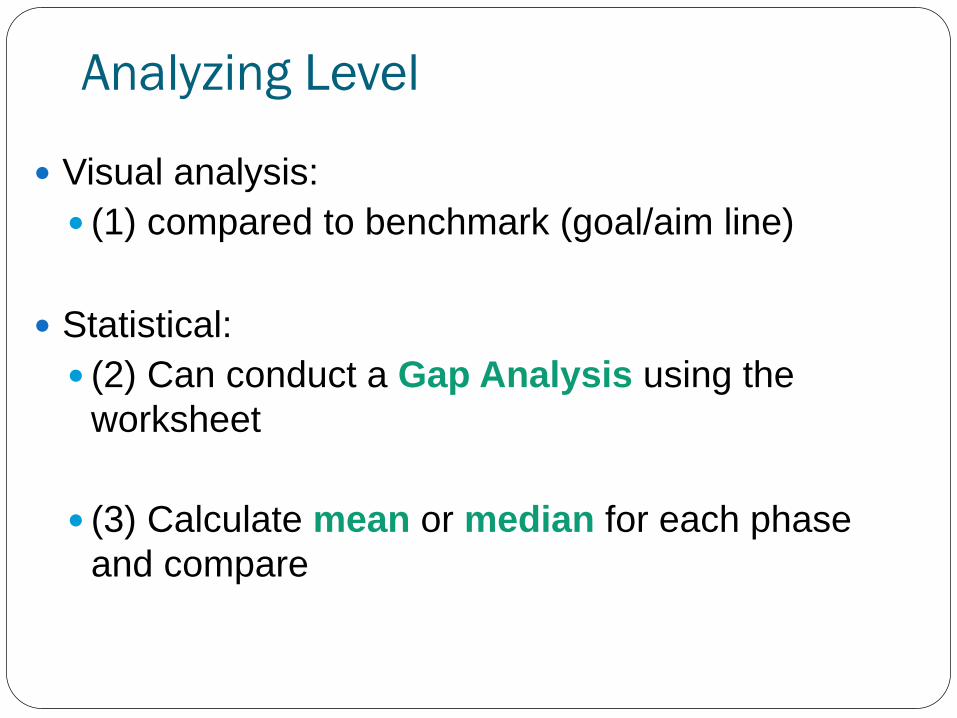
Analyzing Level
Visual analysis: (1) compared to benchmark (goal/aim line)
Statistical: (2) Can conduct a Gap Analysis using the
worksheet (3) Calculate mean or median for each phase
and compare

Compare level
10
12
14
16
18
20
22
24
26
1 2 3 4 5 6 7 8 9 10 11 12
Dig
its
Cor
rect
Per
Min
Matt
Baseline
aim line
trend line
Baseline mean = 13.5 Intervention mean = 14.3
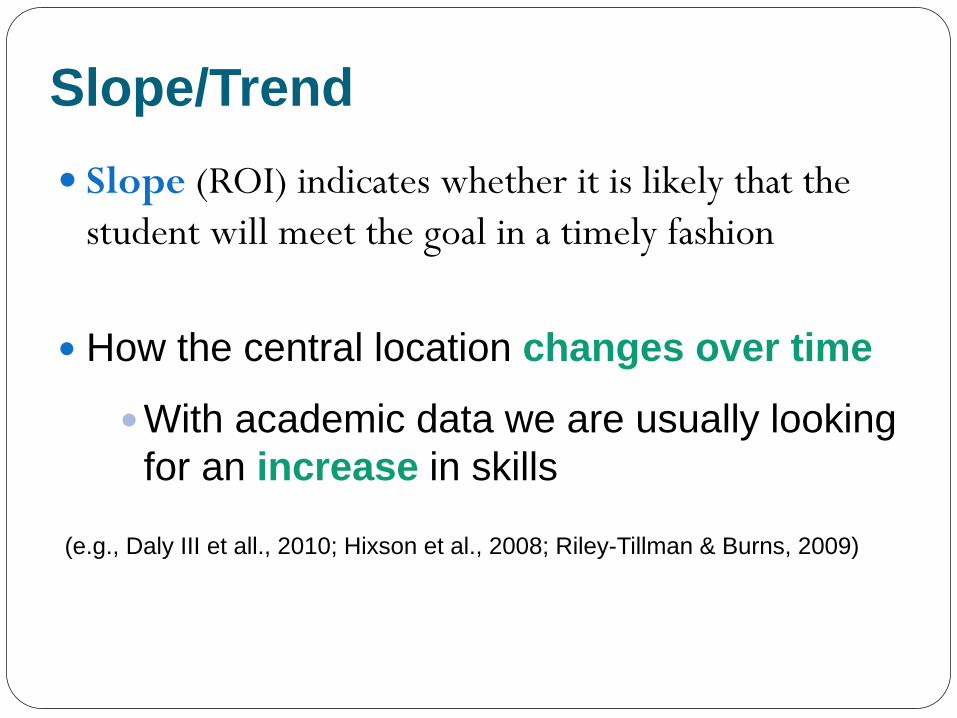
Slope/Trend
Slope (ROI) indicates whether it is likely that the student will meet the goal in a timely fashion
How the central location changes over time
With academic data we are usually looking for an increase in skills
(e.g., Daly III et all., 2010; Hixson et al., 2008; Riley-Tillman & Burns, 2009)
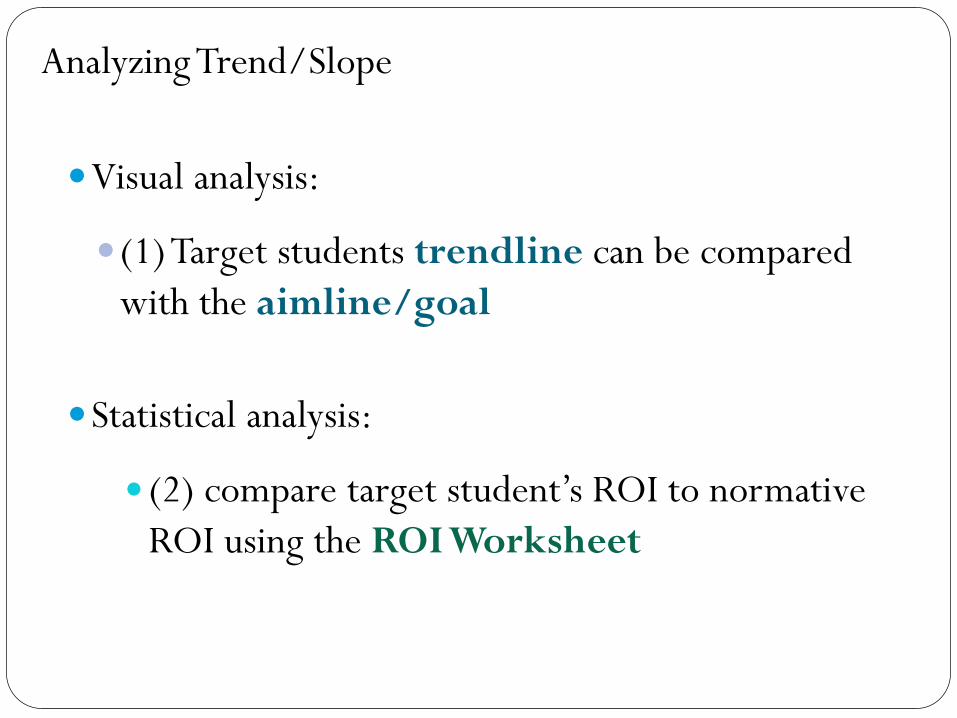
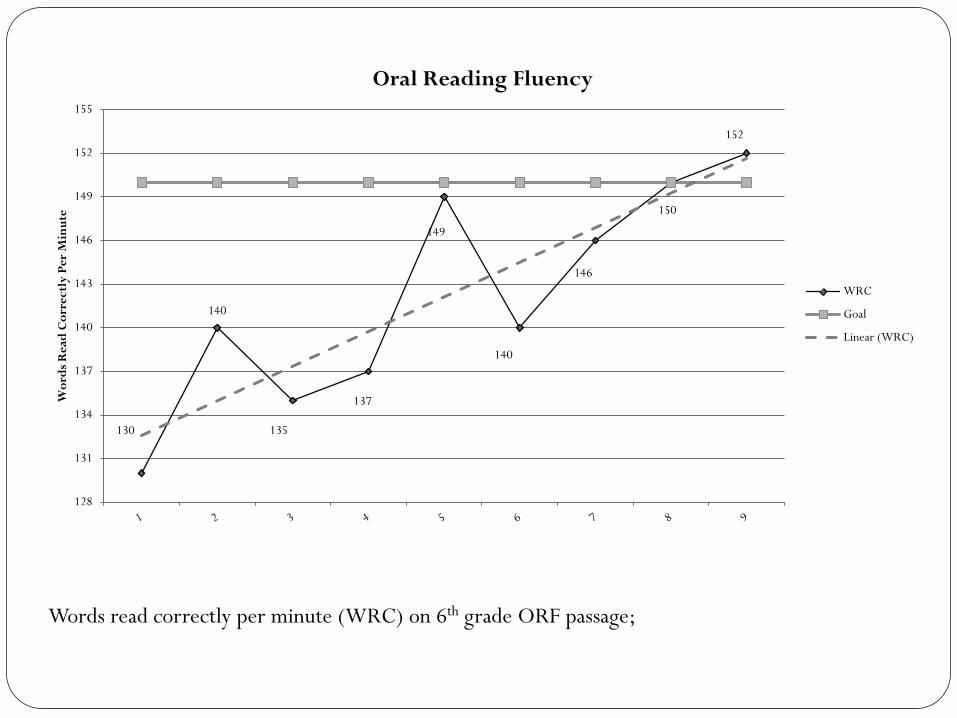
Analyzing Trend/Slope Visual analysis:
(1) Target students trendline can be compared with the aimline/goal
Statistical analysis:
(2) compare target student’s ROI to normative ROI using the ROI Worksheet
130
140
135
137
149
140
146
150
152
128
131
134
137
140
143
146
149
152
155
Wor
ds R
ead
Cor
rect
ly P
er M
inut
e Oral Reading Fluency
WRC
Goal
Linear (WRC)
Words read correctly per minute (WRC) on 6th grade ORF passage;

102
83
86
73
100
93
73
87
110
72
75
78
81
84
87
90
93
96
99
102
105
108
111
114
117
120
123
126
129
1 2 3 4 5 6 7 8 9
Wor
ds R
ead
Cor
rect
ly p
er M
in
WRCM
Goal
Linear (WRCM)
Words read correctly per minute (WRCM) on 5th grade ORF passage; g-index = +0.67

Deciding to refer for SLD evaluation
As part of the teams decision to refer for an SLD evaluation, a Gap Analysis should be conducted
Let’s look at how to complete the Gap
Analysis worksheet with Mitch

Gap Analysis Assessment Used: 2nd PRF Student’s current benchmark performance: 66 Student’s current rate of improvement (ROI): 1.3 Current benchmark expectation: 102 End of year benchmark expectation: 102 Number of weeks left in the school year: 5
Is Gap Significant?
________
/ ________
= _________ □ Yes □ No Current
benchmark expectation
Current performance
Current gap
102 1.5 66
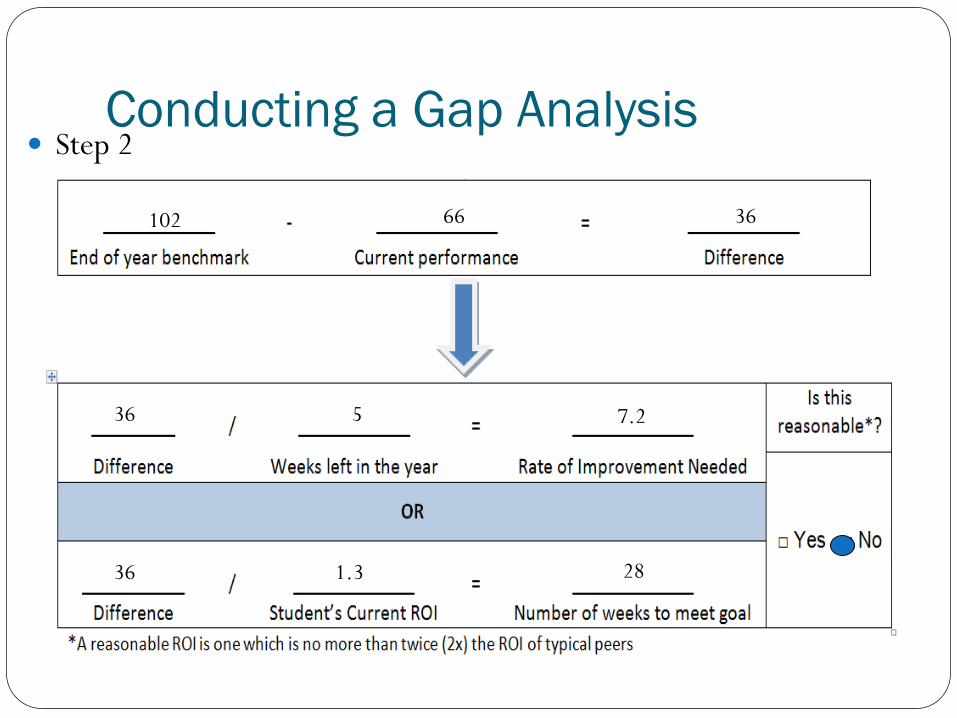
Conducting a Gap Analysis Step 2
102 66 36
36
5 7.2 36
1.3 28

Referral for SLD Special Education Evaluation
RTI2 and the Process for Referral for a Special Education Evaluation
•Progress Monitoring data indicating a lack of responsiveness to intervention; and
A lack of sufficient progress to meet age or State-approved grade-level standards will be established by examining the student’s Rate of Improvement (ROI) including a gap analysis and will be based on the following criteria:
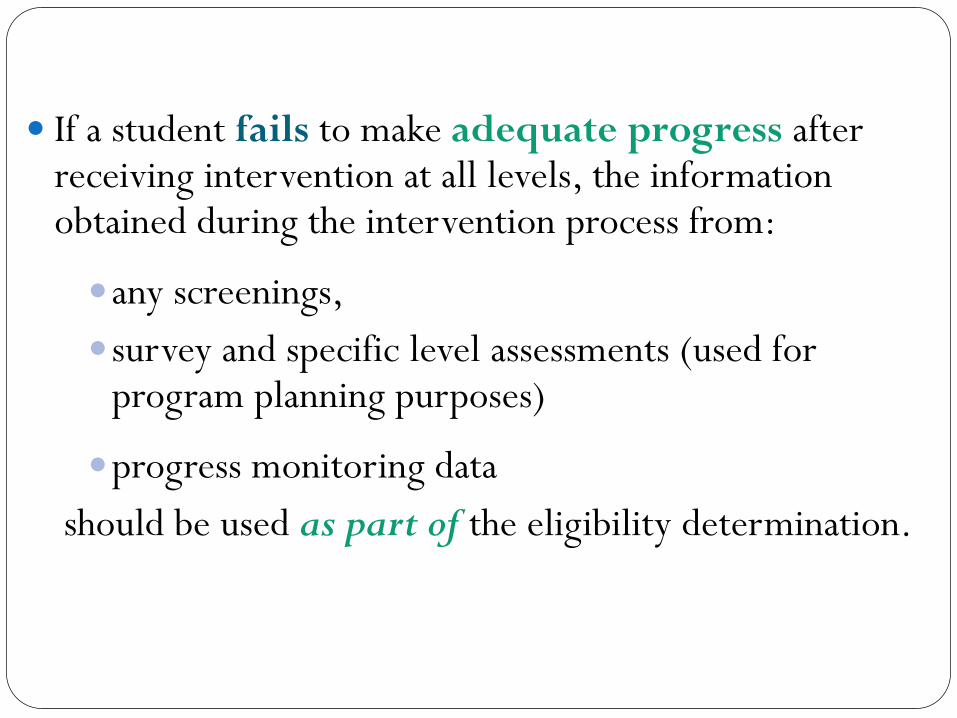
If a student fails to make adequate progress after receiving intervention at all levels, the information obtained during the intervention process from:
any screenings, survey and specific level assessments (used for
program planning purposes)
progress monitoring data should be used as part of the eligibility determination.
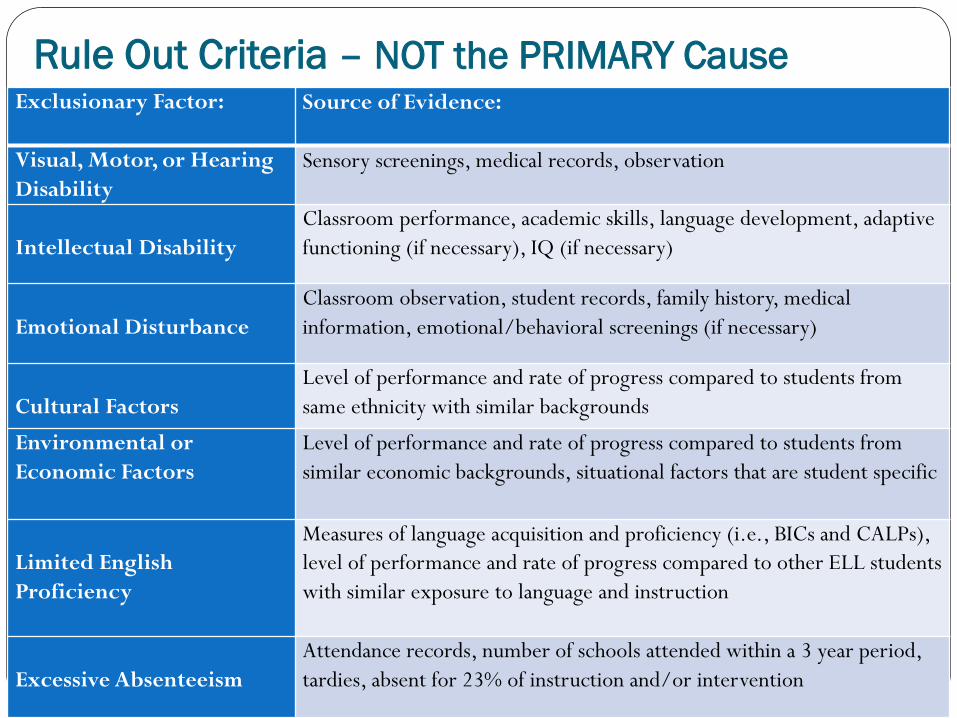
Rule Out Criteria – NOT the PRIMARY Cause Exclusionary Factor:
Source of Evidence:
Visual, Motor, or Hearing Disability
Sensory screenings, medical records, observation
Intellectual Disability
Classroom performance, academic skills, language development, adaptive functioning (if necessary), IQ (if necessary)
Emotional Disturbance
Classroom observation, student records, family history, medical information, emotional/behavioral screenings (if necessary)
Cultural Factors
Level of performance and rate of progress compared to students from same ethnicity with similar backgrounds
Environmental or Economic Factors
Level of performance and rate of progress compared to students from similar economic backgrounds, situational factors that are student specific
Limited English Proficiency
Measures of language acquisition and proficiency (i.e., BICs and CALPs), level of performance and rate of progress compared to other ELL students with similar exposure to language and instruction
Excessive Absenteeism
Attendance records, number of schools attended within a 3 year period, tardies, absent for 23% of instruction and/or intervention
Helpful Resources
Helpful Resources from NASP

Additional Helpful Resources Guilford Press


![Response to Intervention (RtI) Handbook and RtI Resources · 2016-12-09 · OASD RtI Handbook [2] Response to Intervention (RtI) Overview Core Principles of RtI RtI is grounded in](https://static.documents.pub/doc/80x56/5f04175d7e708231d40c46b9/response-to-intervention-rti-handbook-and-rti-resources-2016-12-09-oasd-rti.jpg)

