Steer Davies Gleave68 George StreetEdinburghEH2 2LR
+44 (0)131 226 9500www.steerdaviesgleave.com
Strategic Option Development, Testing and Appraisal
Contents
Contents Page
1. INTRODUCTION 1
Background 1
Structure of Report 2
2. ABERDEEN SUB-AREA MODEL (ASAM) 3
Introduction 3
How model outputs have been used 3
3. THE NESTRANS DYNAMIC MODEL 5
Introduction 5
Scope of the Dynamic Model 5
Scope of the Nestrans Dynamic Model 6
4. STRATEGIC TESTING WITH DYNAMIC MODEL AND ASAM 9
Introduction 9
RTS Objectives 9
Strategic Optioneering with the Dynamic Model 10
Specified Runs 11
Key Scenarios 15
Economic Indicators 16
Environmental Indicators 18
Social Inclusion Indicators 22
Model Conclusions 24
5. MODELLING OF THE PREFERRED STRATEGY IN THE DYNAMICMODEL 25
Options included in draft RTS 26
Options modelled in ASAM 26
6. APPRAISAL OF REGIONAL TRANSPORT STRATEGY 28
Introduction 28
Environment 28
Safety 29
Economy 30
Accessibility 31
Integration 31
Conclusions 32
Strategic Option Development, Testing And Appraisal
Contents
FIGURES
Figure 4.1 Total Jobs 2021 – Comparison with Reference Case 16
Figure 4.2 Percentage difference in jobs in 2021 between Reference case &preferred RTS by Dynamic Model zone 17
Figure 4.3 Job Filled 2021: Comparison with Reference Case 18
Figure 4.4 Car Miles comparison with Reference Case in 2021 21
Figure 4.5 comparison of the Average Travel distances (miles) for all modes 21
Figure 4.6 Percentage Change in Accessibility. 22
Figure 4.7 Accessibility to hospital in RTS Preferred Option Compared to theReference Case 23
TABLES
Table 4.1 Key SCENARIOs
Table 4.2 Comparison of Mode shares for Journeys into Aberdeen City
Table 4.3 Comparison of Mode shares for Journeys into Aberdeenshire
Table 5.1 Schemes Modelled in Run 27
Table 5.2 Schemes Modelled in ASAM
Table 6.1 Car miles within the Reference Case and RTS Package
Table 6.2 ASAM estimates of environmental emissions (Tonnes)
APPENDICES
A ASAM MODELLING ASSUMPTIONS
B URBAN DYNAMIC MODEL MODELLING ASSUMPTIONS FORPREFERRED PACKAGE
C URBAN DYNAMIC MODEL - SCENARIOS TESTED
D RESULTS FROM KEY MODEL RUNS
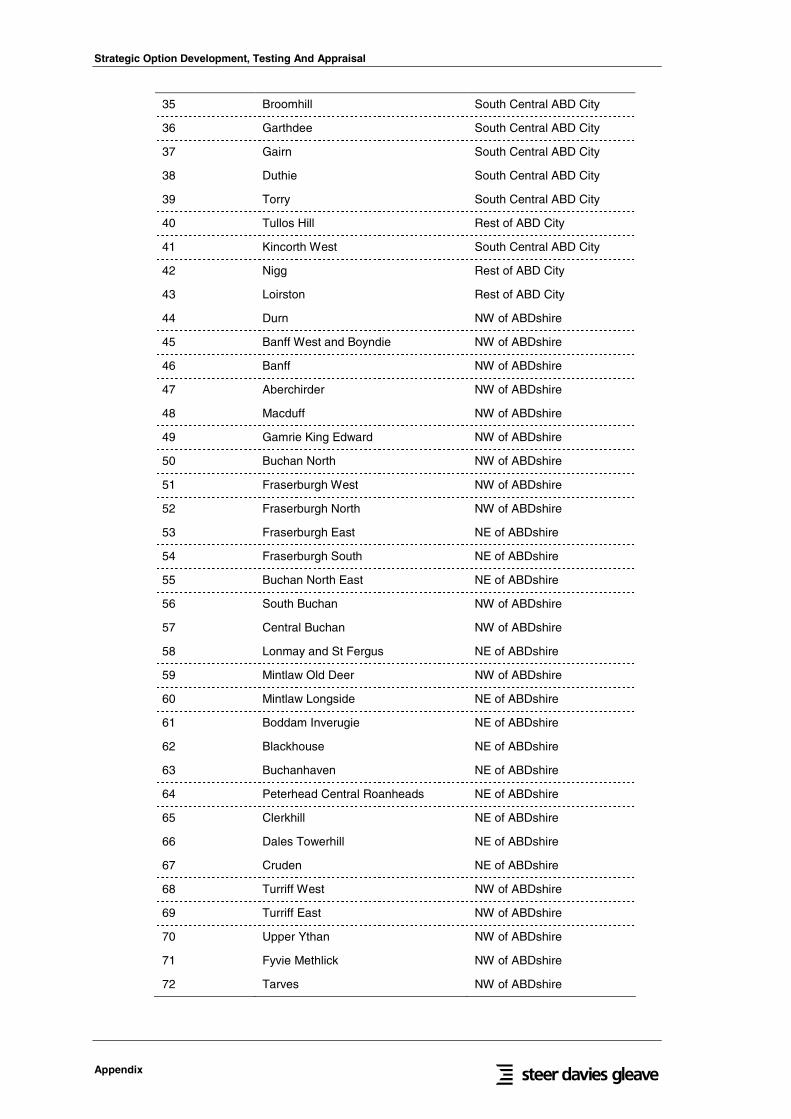
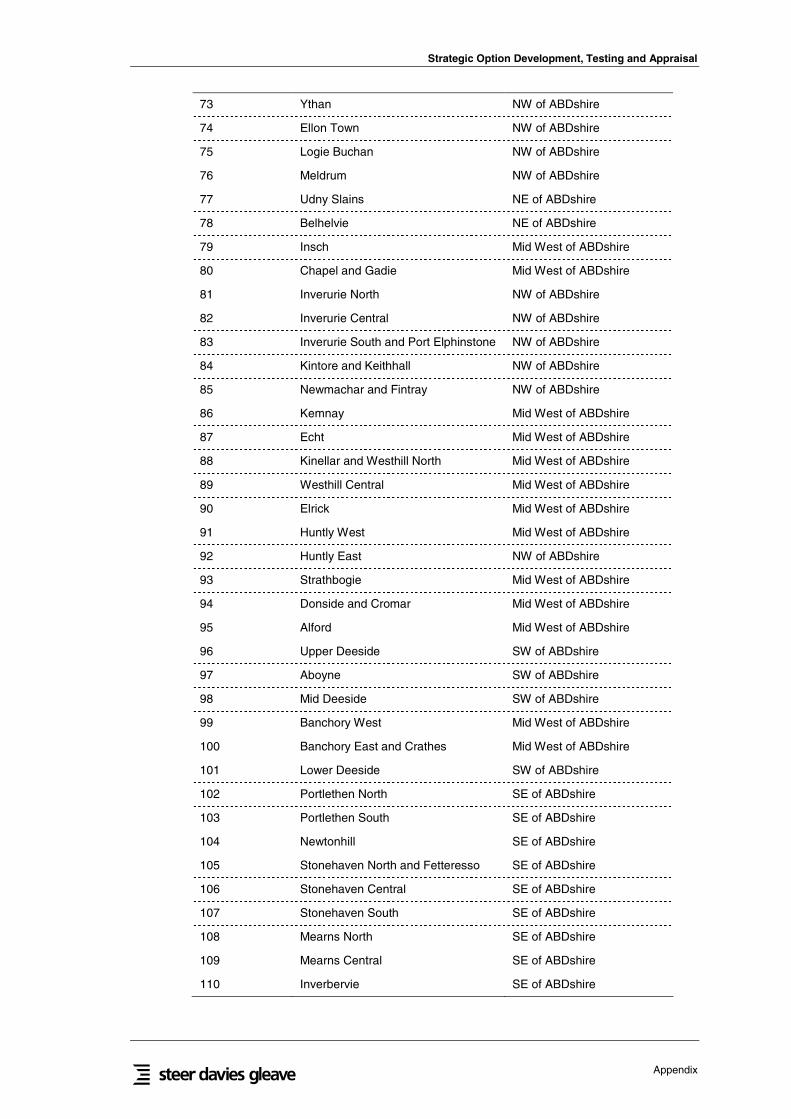
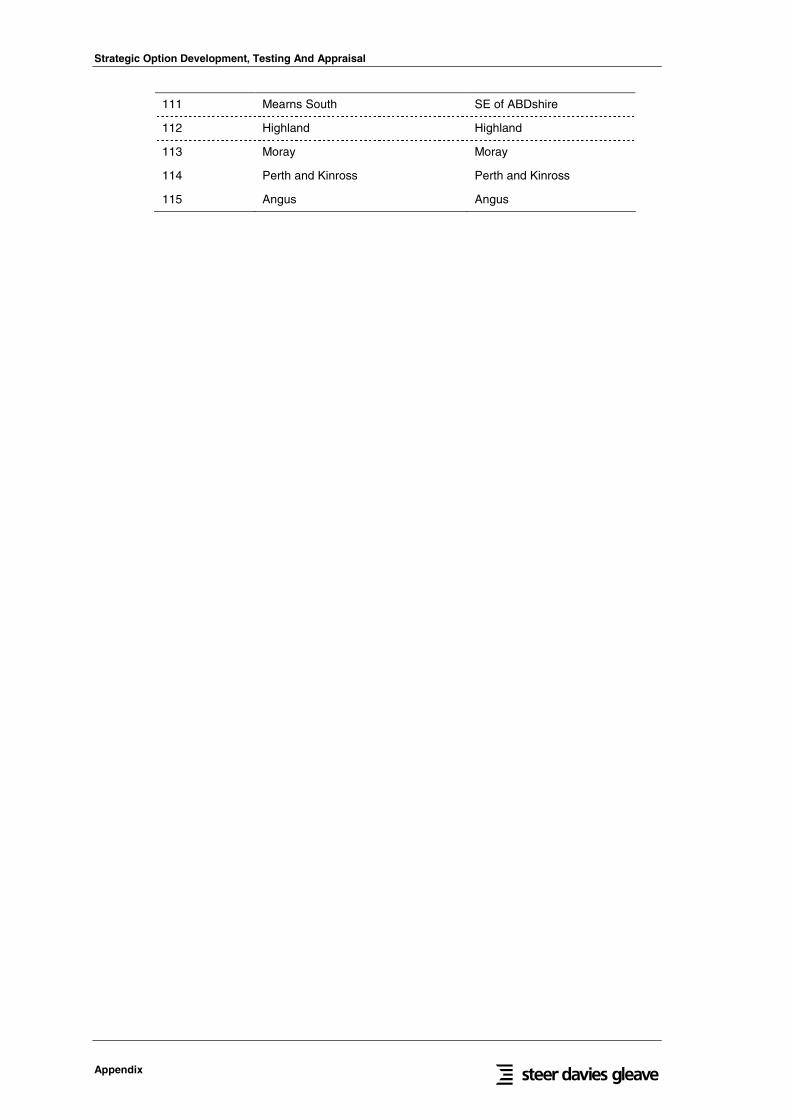
E DYNAMIC MODEL ZONE INDEX
Strategic Option Development, Testing and Appraisal
Contents
Strategic Option Development, Testing and Appraisal
1
1. INTRODUCTION
Background
1.1 Nestrans, the North East of Scotland Transport Partnership, the successor to theoriginal Nestrans voluntary partnership, is required by the Transport Act to draw up astatutory Regional Transport Strategy (RTS) for its region by 1st April 2007. The RTSprovides the opportunity both to identify those strategic interventions that will besthelp to deliver the region’s economic, social and environmental objectives; and toincrease the pace of investment in the region’s transport system.
1.2 Steer Davies Gleave were commissioned by the North East of Scotland TransportPartnership to assist in the development of the RTS. As well as strategy development,the work has involved extensive modelling using both the Aberdeen Sub-Area Model(ASAM) of the Transport Model for Scotland and an application of Steer DaviesGleave’s Urban Dynamic Model developed specifically for the North East Scotlandregion. These models have been used together in order to assess the impacts of theproposed Regional Transport Strategy (RTS) on the region. These models each havetheir own strengths and have been used together to provide the outputs necessary tomake an assessment of the RTS.
The Dynamic Model
1.3 As part of the strategy development stream of work, a model was developed - theNestrans Dynamic Model.1 The primary focus of the model was to assist in theidentification and testing of strategic interventions that will best help to deliver theregion’s economic, social and environmental objectives as identified for the RTS. Tothis end the model was used to assess the strategic impacts of the RTS options againstits objectives through the use of a number of measurable indicators. The model wasused in a workshop and subsequently in order to develop a preferred strategy with theappropriate combinations of measures and activities.
ASAM
1.4 ASAM is a multi-modal model developed from the Transport Model for Scotland(TMfS) using the TRIPS network modelling application. It was intended to evaluatetransport proposals in the Aberdeen City and Aberdeenshire area, particularly aroundthe City and its immediate environs.
1.5 Since the initial objective of ASAM was to study the impact of the Aberdeen WesternPeripheral Route (AWPR), the focus of data collection and model development is onthose movements which are within the scope of this scheme. Accordingly ASAM isparticularly useful for assessing the impacts of transport developments on thosejourneys that go into or pass through Aberdeen City. However, it is less well refinedfor other movements around Aberdeenshire that do not pass through Aberdeen.
1 The NESTRANS dynamic model is based on an application of the Urban Dynamic Model, which tests strategictransport interventions, strongly linked to land use planning and to strategies for economic development
Strategic Option Development, Testing And Appraisal
2
Structure of Report
1.6 This report provides a brief summary of the Nestrans Dynamic Model and the resultsfrom the various tests undertaken as part of the RTS development.
• Chapter 2 provides an overview of the ASAM model;
• Chapter 3 provides an overview of the Nestrans Dynamic Model;
• Chapter 4 provides the results of some strategic transport tests undertaken usingthe Nestrans Dynamic model. The results show at a high level the impact ofchanges in accessibility brought about by investment in transport at differentlevels, and how this could impact on the businesses, and social and environmentalissues;
• Chapter 5 provides further detail on the way the transport schemes were modelledin the Nestrans Dynamic Model. This chapter also sets out the basis of what wasassessed in ASAM
• Chapter 6 contains results of the assessment of the RTS.
Strategic Option Development, Testing and Appraisal
3
2. ABERDEEN SUB-AREA MODEL (ASAM)
Introduction
2.1 The Aberdeen Sub Area Model (ASAM) is a multi-modal model developed to studyoptions and carry out appraisal for transport proposals in the Aberdeen City andAberdeenshire area, particularly the Aberdeen Western Peripheral Route (AWPR),which were developed as part of the “Modern Transport System (MTS)” developed byNestrans and its constituent partners and endorsed by the Executive in 2001.
2.2 The model has been developed from the Scottish Executive/Transport Scotland’sTransport Model for Scotland (TMfS) using the TRIPS network modellingapplication.
2.3 Since the initial objective of ASAM was to study the AWPR, the focus of datacollection and model development is on those movements which are within the scopeof this scheme. Therefore the model is particularly useful for assessing the impacts oftransport developments on those journeys that go into or pass through Aberdeen Citybut is less strong for other movements around the region that do not pass throughAberdeen.
2.4 While the Dynamic Model describes the interaction of economic activity, travel andgeography over time, it contains a strategic representation of the transport network. Bycontrast, ASAM includes a much more detailed description of the highway and publictransport networks and can be used to calculate more precise estimates of the traveltimes (presented as generalised costs) between demand zones and the flows onparticular links of the network. This allows more detailed estimates to be made of thetravel benefits in terms of time savings that particular interventions may deliver.
2.5 There are though some types of intervention which are not suited to evaluation innetwork models such as ASAM. Also some of the proposed transport improvementsincluded in the RTS are in parts of the area where ASAM is less well defined sowould not be easy to represent and consequently not easy to derive good estimates ofthe effects of these schemes. It should therefore be noted that ASAM has not beenused to model all of the interventions that make up the RTS package.
2.6 ASAM represents travel demand by dividing the area into demand zones. To allowdata to be passed between the ASAM and the Dynamic Model (DM) the zone systemfor the Dynamic Model has been developed around the existing ASAM zone system.This has ensured that there is a well defined relationship between ASAM and DM.
How model outputs have been used
2.7 ASAM has been used to generate the highway and public transport travel costmatrices for the DM.
Strategic Option Development, Testing and Appraisal
5
3. THE NESTRANS DYNAMIC MODEL
Introduction
3.1 Although the Nestrans Dynamic Model has much in common with land-use andtransport interaction models, its scope and the technology underpinning it are quitedifferent. Based on Steer Davies Gleave’s Urban Dynamic Model, the model is asimulation of how North East Scotland might evolve over the next twenty years andhow policy changes are likely to impact on the characteristics and dynamics of theregion. A key feature of the model is that it allows rapid assessment of differentscenarios relating to variations in the definition of the RTS options e.g. differenttransport measures.
3.2 This chapter provides a brief overview of the model, describing the main processesthat it simulates. More detail on the mechanisms and mechanics of the UrbanDynamic Model can be found in a Technical Note contained on Steer Davies Gleave’swebsite2.
Scope of the Dynamic Model
3.3 The model combines conventional transport modelling techniques with models ofbusiness formation, population migration and land-use, to provide a view on how allof these factors work together and interact. Starting from a base year of 2001, it movesthrough simulated time in small steps, calculating at each stage how events are likelyto change.
3.4 The Dynamic Model has been developed by Steer Davies Gleave using the SystemDynamics modelling technology. This is a computer simulation technique concernedwith replicating how complex systems evolve over time. It provides the means tomodel processes that are much harder to handle in traditional equilibrium models,particularly where feedback effects are concerned, such as the effect of congestion ontravel conditions.
3.5 The model is built using a general simulation package called Vensim.3 The model is“zonal”, dividing the study area in to zones of varying size. In each zone the modelkeeps track of the population, businesses, infrastructure and the land which form thecurrent conditions in the modelled region together with transport costs, which havebeen extracted from the Aberdeen Sub-Area Model (ASAM).
3.6 The model is a simulation of how the whole area is likely to evolve over the next 20years, and shows both how transport is affected by changes and how transportinterventions can influence the area.
2 Available at http://www.steerdaviesgleave.com/pages/content/index.asp?PageID=1493 Developed by Ventana Systems in the US (see www.vensim.com)
Strategic Option Development, Testing And Appraisal
6
Scope of the Nestrans Dynamic Model
3.7 The study area covers most of the North East of Scotland incorporating the districts ofAberdeen City and Aberdeenshire as internal model zones, and adjacent regions ofHighland, Moray, Perth & Kinross and Angus as “buffer” zones.
3.8 In summary, there are:
• 111 zones covering the districts in Aberdeen City (43 zones) and Aberdeenshire(68 zones), consisting of individual Council wards used in the 2003 Councilelections. This is the core area of interest.
• 4 buffer zones, designed to cover cross boundary trips to or from the area fromthe adjacent regions, including Highland, Moray, Perth & Kinross and Angus.
3.9 Transport provides the links between zones, and in particular is the means by whichemployers gain access to employees, customers and suppliers. The model covers thethree key aspects of travel and explicitly models these:
• the decision about whether to travel or not;
• how far/where to travel to work, and
• the choice of mode.
3.10 The model can represent zone-to-zone travel using either a link-based network, ortables of generalised times or costs. This application of the model uses generalisedtimes in minutes for all the modes represented – private transport (car/motorcycle),public transport (rail and bus) and active travel modes (walk/cycle).
3.11 Generalised times (gt’s) contain all aspects of the journey expressed in minutes. Forexample, car gt’s are typically a function of time in the vehicle, operating costs (i.e.fuel) and parking charges whereas a bus gt is a function of the fare paid, time on thebus, the time spent waiting for the bus to arrive, access and egress times and anyinterchange penalty.
3.12 The generalised times for car and public transport travel are derived from the ASAMmodel (combining journey times and costs of fares/travel costs), whilst the activetravel mode times are inferred as a proportion of car times and actual propensity to usethese modes derived from Travel to Work Census data.
3.13 Mode choice is controlled using logit models which compare the utilities of thecompeting modes in the dynamic model continuously through simulated time. Itshould be noted that small changes in generalised times can have significant impactson mode choice. Therefore any transport interventions that are tested have beendesigned with the scale of the starting generalised cost in mind.
Model Dynamics
3.14 The main dynamics in the model are created via the idea of the attractiveness of eachzone for different types of activity. The model monitors each zone through time, andconsiders how attractive it is from four points of view:
a) From the point of view of developers, who build offices and other business
Strategic Option Development, Testing and Appraisal
7
premises;
b) From the point of view of house builders, who provide the housing;
c) From the point of view of businesses and employers, this includes;
� The availability of suitable premises, which are built by developers, and is afunction of:
� The availability of land;
� The current balance of supply and demand;
� Expectations of future growth4.
� The ability to recruit staff - Each business needs to recruit staff, and if jobscannot be filled this will limit the expansion of activity. The modelsimulates how people move in and out of employment over time, and knowsthe fraction of unfilled jobs at any time. High job vacancy rates will lowerattractiveness, while low rates will raise it.
� Access to customers and suppliers.
d) From the point of view of households, this includes;
� The availability of suitable housing; (which depends on house builders, whowill respond to:
� The availability of land;
� The current balance of supply and demand (i.e. vacancies); and
� Expectations of growth.
� The availability of suitable employment - Locations with high levels ofunemployment are deemed to be less attractive than those with low levels, sowhere jobs are easily found, net inward migration will tend to increase, andwhere they are not, net outward migration will tend to increase.
3.15 It is the detailed interaction between these ‘actors’ linked together through theaccessibility provided by the transport system that produces the patterns ofdevelopment and other impacts observed in the model.
Model Outputs
3.16 The Nestrans Dynamic Model provides a wealth of outputs for major “quantities”within the model. As noted elsewhere, the model is zonal with transport costs andtherefore flows on an origin-destination zone basis and many of the outputs areproduced by zone and can be reported at each time-step, for example a year, for whichthe model is run.
3.17 The role of the Nestrans Dynamic Model is to demonstrate how RTS options cancontribute to the economic and social success of the region with the following formingthe key indicators:
• Economic - How the labour market and business development in Aberdeen Cityand Aberdeenshire responds to changes in accessibility due to the development of
4 These assumptions are, in turn, supported by recent research carried out by Steer Davies Gleave for theDepartment for Transport into how transport affects business location decisions. Interviews with propertydevelopers in the north east confirmed that their main priorities are the cost of land, the rents they can achieveand the prospects for growth in rents.
Strategic Option Development, Testing And Appraisal
8
the transport system and land use strategies during the forecast period.Development of the transport system can help to unlock the potential of somesites in terms of providing better access to a workforce;
• Environmental - How the development of the transport system affects the travelto work patterns, mode shares and aggregate car miles; and
• Social Inclusion - It also looks at the social success of the region. This is setagainst a background where there are particular areas that currently havesignificant low accessibility to public facilities (e.g. university and hospital) so toimprove the social inclusions of those areas over the future years.
3.18 The incremental change of these indicators as a result of implementation of the RTSoptions can be used to interpret how well the RTS can meet its objectives over theperiod to 2021.
3.19 The model results presented in the next chapter are ones that allow comparison ofdifferent RTS options in the context of how they affect the above factors. The modelcan also provide a range of other indicators including estimates of unemploymentrates5, job vacancy rates and the number of people who are employed in differentindustries. For transport, it can also provide the travel to work trip matrix, by modeand person type.
3.20 Please note that the Nestrans Dynamic Model is strategic in nature, thus very local orsmall transport interventions are represented in a simplistic manner, if at all. Theresults provided in the remainder of this report should be considered with this in mind.The model demonstrates the type of behaviour and the scale of change that may resultfrom transport interventions. It should be considered alongside more detailed analysisusing tools such as micro-simulation or network assignment models such as ASAM.
5 The model’s unemployment rates tend to be higher than those published by ONS, for two reasons. First, ONSfigures are based on claimant counts, not all the unemployed; and second, they calculate the fraction of thepopulation of working age that is out of work, whereas the model calculates the fraction of the workforce.
Strategic Option Development, Testing and Appraisal
9
4. STRATEGIC TESTING WITH DYNAMIC MODEL AND ASAM
Introduction
4.1 This chapter sets out the basis and results from the modelling undertaken using theDynamic Model and ASAM to support the development and assessment of the RTS.
RTS Objectives
4.2 The Nestrans Regional Transport Strategy 2006-2021 Option Generation Consultationproposed six different packages of complementary measures and activities. Thesepackages aim to best meet the strategy’s objectives as outlined below.
4.3 The RTS contains four strategic objectives and twelve objectives as indicated below:
Strategic Objective 1: Economy
To enhance and exploit the north east’s competitive economic advantages, andreduce the impacts of peripherality.
i. To make the movement of goods and people within the north east and to/from thearea more efficient and reliable,
ii. To improve the range and quality of transport to/from the north east to keybusiness destinations,
iii. To improve connectivity within the north east, particularly between residentialand employment areas,
Strategic Objective 2: Accessibility, Safety and Social Inclusion
To enhance choice, accessibility and safety of transport, particularly fordisadvantaged and vulnerable members of society and those living in areaswhere transport options are limited.
iv. To enhance travel opportunities and achieve sustained cost and qualityadvantages for public transport relative to the car,
v. To reduce the number and severity of traffic related accidents and improvepersonal safety and security for all users of transport,
vi. To achieve increased use of active travel and improve air quality as part of widerstrategies to improve the health of north east residents,
Strategic Objective 3: Environment
To conserve and enhance the north east’s natural and built environment andheritage and reduce the effects of transport on climate and air quality.
vii. To reduce the proportion of journeys made by cars and especially by singleoccupant cars,
Strategic Option Development, Testing And Appraisal
10
viii. To reduce the environmental impacts of transport, in line with national targets,
ix. To reduce growth in vehicle kilometres travelled,
Strategic Objective 4: Spatial Planning
To support transport integration and a strong, vibrant and dynamic city centreand town centres across the north east.
x. To improve connectivity to and within Aberdeen City and Aberdeenshire towns,especially by public transport, walking and cycling,
xi. To encourage integration of transport and spatial planning and improveconnections between transport modes and services, and
xii. To enhance public transport opportunities and reduce barriers to use across thenorth east, especially rural areas.
Strategic Optioneering with the Dynamic Model
4.4 The six initial RTS option packages, as described in the RTS options paper, were:
• Low Cost (Low) – Measures and activities that require relatively low levels ofrevenue and capital funding. This would approximate to a continuing level ofexpenditure for transport broadly equivalent to present levels of funding.
• Medium Cost Economy (MEc) – This package would require an increased levelof expenditure on transport over the life of the strategy, to relatively mediumlevels of revenue and capital funding. Options are included that would achieveobjectives i to iii above, yielding benefits with an emphasis towards relievingcongestion, boosting the north east’s economy and infrastructure-based solutions.
• Medium Cost Accessibility and Social Inclusion (MSoc) - This package alsorequires relatively medium levels of revenue and capital funding of a scalebroadly equivalent to the other Medium Cost packages. Schemes are includedwhich would best achieve objectives iv to vi in the previous table, yieldingbenefits with an emphasis towards social inclusion such as public transportmeasures, making travel more affordable and favouring socially excluded sectorsof population or areas.
• Medium Cost Environmental (MEnv) - A third package, also requiringrelatively medium levels of revenue and capital funding similar to other MediumCost packages. Focus is on schemes that would best achieve objectives vii to ixabove, yielding benefits with an emphasis towards the environment, includingmeasures to encourage modal shift and active travel.
• Medium Cost Spatial Planning (MPlan) – a further package requiring relativelymedium levels of funding similar to other Medium Cost packages. Emphasis ison schemes which best achieve objectives x to xii above, yielding benefits forconnectivity within and between settlements in the north east, and
• High Cost (High) – A package, which combines many of the schemes within themedium cost scenarios and contains some measures and activities requiring arelatively high level of revenue and capital funding. Many of the schemes withinthis category are highly expensive and could only be considered feasible if takinga very large proportion of all transport expenditure within the north east or inconjunction with new revenue streams, but have been included to ascertain theirrelative merits and acceptability.
Strategic Option Development, Testing and Appraisal
11
4.5 All of these packages were assessed relative to a ‘Reference Case’. The ReferenceCase comprised measures and activities which already have a relatively high degree ofcommitment and are expected be part of the North East’s transport network earlywithin the strategy’s life. It was agreed that the Reference Case would include theAberdeen Western Peripheral Route (AWPR), upgrades to the road network which arecommitted and public transport schemes anticipated to be implemented before 2011.It should be noted that elements contained in the Reference case are expected to bedelivered in the early part of the life of the RTS.
4.6 In the different packages, specific measures and activities (or types of intervention)are combined and allocated. A comprehensive table was also provided in the RTSOptions report which contains the interventions and their relevant packages.
4.7 It should be noted that the model developed here is a strategic model and so not all ofthe measures and interventions listed are represented within the modelled packages.The measures with a very local impact or with minimal direct spatial impact arerecognised as contributing to the overall strategy, but are not possible to includewithin a strategic model.
Specified Runs
4.8 The six initial options were used as a basis for a workshop held on 18 September 2006with members of the Nestrans board to assess the options against the RTS objectivesand results presented demonstrating impact on a number of identified indicators. Aprocess was then followed by which changes were made to those packages, the modelre-run and the results inspected, with this process continuing as the group movedtowards a preferred option.
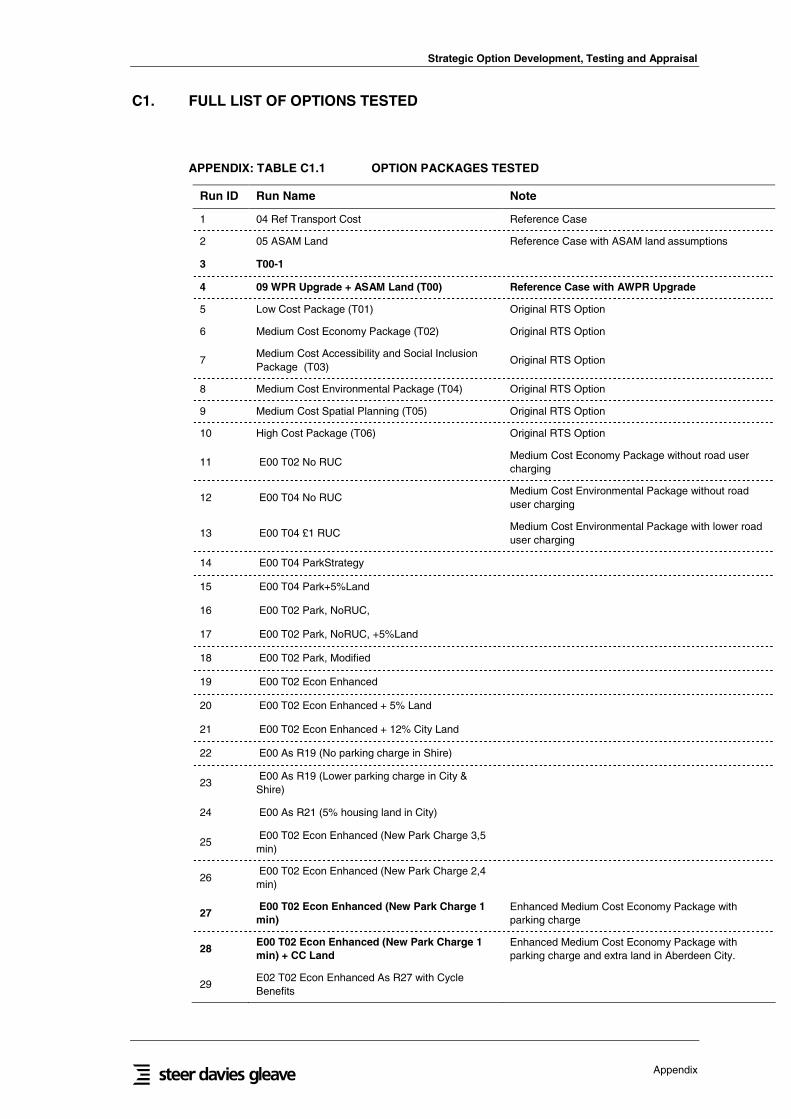
4.9 In all, over 40 options and variants were tested subsequent to the workshop; not allwere fully developed, however, as in some cases it was evident from initial results thatthe outcomes would be dominated (that is, bettered on all criteria) by one or moreother options. A full list of those that were assessed are reported in Appendix C;details of the main six options together which what emerged as a preferred packageare shown in table 4.1 overleaf.
4.10 It should be noted that all modelled options contain AWPR and use the same land useassumptions as ASAM.
Strategic Option Development, Testing And Appraisal
12
TABLE 4.1 KEY SCENARIOS
ID Run Name Additional Transport Schemes
409 WPR Upgrade +ASAM Land (T00)
5Low Cost Package(T01)
- Bus priority/ bus lanes - On key radial approaches to city: A90 (northern approach), Anderson drive, A947, A96, A93, and A90 (southern approach) andin key locations within Aberdeenshire
- Bus Partnerships - secure high quality bus services through the establishment of new partnership agreements with bus operators and PunctualityImprovement Partnerships
6Medium CostEconomy Package(T02)
- Aberdeen Airport Surface Connections - Multimodal Interchange at airport terminal. Key components include new railway link and branded express busservice between Aberdeen Airport and city centre / other key locations
- Inner city bus service – free low-emission city centre service
- Mass transit (Micro Light Tram) - Promote and support introduction of system in Aberdeen's city centre
- Pedestrian linkages between Guild Street and Union Street - Escalator
- Strategic roads (capacity improvements) - A90 dualling (Ellon to Peterhead), A96 Complete Dualling (in partnership HITRANS), Haudigan Roundabout,Bridge of Dee, Anderson Drive (dualling on specific sections), Third Don Crossing, Stonehaven/Banchory/Inveruie
- Travel plans - promote and support the development of travel plans for individuals, businesses, health care, and schools
- Demand Management - consider the appropriateness of introducing measures that will control traffic demand (including urban parking surcharges,workplace parking controls, local congestion charging)
7
Medium CostAccessibility andSocial InclusionPackage (T03)
- Aberdeen Airport Surface Connections - Multimodal Interchange at airport terminal. Key components include new railway link and branded express busservice between Aberdeen Airport and city centre / other key locations
- Inner city bus service – free low-emission city centre service
- Mass transit (Guided Bus)- Promote and support introduction of system on appropriate radial routes to avoid congestion hotspots around Aberdeen
- Bus priority/ bus lanes - On key radial approaches to city: A90 (northern approach), Anderson drive, A947, A96, A93, and A90 (southern approach) andin key locations within Aberdeenshire
- Parking Strategy for north east - Develop and implement framework for managing supply / demand for parking, including pricing and enforcement
- Travel plans - promote and support the development of travel plans for individuals, businesses, health care, and schools
- Bus Quality Contracts - secure high quality bus services through the introduction of formal contracts with bus operators that will legally bind them intoprescribed levels of bus service provision
8Medium CostEnvironmentalPackage (T04)
- Inner city bus service – free low-emission city centre service
- Mass transit (Micro Light Tram) - Promote and support introduction of system in Aberdeen's city centre
- Mass transit (Guided Bus) - Promote and support introduction of system on appropriate radial routes to avoid congestion hotspots around Aberdeen
- Bus priority/ bus lanes - On key radial approaches to city: A90 (northern approach), Anderson drive, A947, A96, A93, and A90 (southern approach) and
Strategic Option Development, Testing and Appraisal
13
in key locations within Aberdeenshire
- Parking Strategy for north east - Develop and implement framework for managing supply / demand for parking, including pricing and enforcement
- Travel plans - promote and support the development of travel plans for individuals, businesses, health care, and schools
- Bus Quality Contracts - secure high quality bus services through the introduction of formal contracts with bus operators that will legally bind them intoprescribed levels of bus service provision
- Demand Management - consider the appropriateness of introducing measures that will control traffic demand (including urban parking surcharges,workplace parking controls, local congestion charging)
9Medium Cost SpatialPlanning (T05)
- Aberdeen Airport Surface Connections - Multimodal Interchange at airport terminal. Key components include new railway link and branded express busservice between Aberdeen Airport and city centre / other key locations.
- Inner city bus service – free low-emission city centre service
- Mass transit (Micro Light Tram) - Promote and support introduction of system in Aberdeen's city centre
- Mass transit (Guided Bus)- Promote and support introduction of system on appropriate radial routes to avoid congestion hotspots around Aberdeen
- Pedestrian linkages between Guild Street and Union Street - Escalator
- Bus priority/ bus lanes - On key radial approaches to city: A90 (northern approach), Anderson drive, A947, A96, A93, and A90 (southern approach) andin key locations within Aberdeenshire
- Parking Strategy for north east - Develop and implement framework for managing supply / demand for parking, including pricing and enforcement
- Travel plans - promote and support the development of travel plans for individuals, businesses, health care, and schools
- Bus Partnerships - secure high quality bus services through the establishment of new partnership agreements with bus operators and PunctualityImprovement Partnerships
- Demand Management - consider the appropriateness of introducing measures that will control traffic demand (including urban parking surcharges,workplace parking controls, local congestion charging)
10High Cost Package(T06)
- Aberdeen Airport Surface Connections - Multimodal Interchange at airport terminal. Key components include new railway link and branded express busservice between Aberdeen Airport and city centre / other key locations.
- Aberdeen Cross Rail
- Inner city bus service – free low-emission city centre service
- Mass transit (Micro Light Tram) - Promote and support introduction of system in Aberdeen's city centre
- Mass transit (Guided Bus)- Promote and support introduction of system on appropriate radial routes to avoid congestion hotspots around Aberdeen
- Pedestrian linkages between Guild Street and Union Street - Escalator
- Rail extension Ellon - Introduce line and services
- Rail extension Peterhead - Introduce line and services
- Strategic roads (capacity improvements) - A90 dualling (Ellon to Peterhead), A96 Complete Dualling (in partnership HITRANS), Haudigan Roundabout,Bridge of Dee, Anderson Drive (dualling on specific sections), Third Don Crossing, Stonehaven/Banchory/Inveruie
- Bus priority/ bus lanes - On key radial approaches to city: A90 (northern approach), Anderson drive, A947, A96, A93, and A90 (southern approach) and
Strategic Option Development, Testing And Appraisal
14
in key locations within Aberdeenshire
- Parking Strategy for north east - Develop and implement framework for managing supply / demand for parking, including pricing and enforcement
- Travel plans - promote and support the development of travel plans for individuals, businesses, health care, and schools
- Bus Partnerships - secure high quality bus services through the establishment of new partnership agreements with bus operators and PunctualityImprovement Partnerships
- Bus Quality Contracts - secure high quality bus services through the introduction of formal contracts with bus operators that will legally bind them intoprescribed levels of bus service provision
- Demand Management - consider the appropriateness of introducing measures that will control traffic demand (including urban parking surcharges,workplace parking controls, local congestion charging)
27Run E00 T02 EconEnhanced (NewPark Charge 1 min)
- Aberdeen Airport Surface Connections - Multimodal Interchange at airport terminal. Key components include new railway link and branded express busservice between Aberdeen Airport and city centre / other key locations.
- Aberdeen Cross Rail
- Inner city bus service – free low-emission city centre service
- Mass transit (Micro Light Tram) - Promote and support introduction of system in Aberdeen's city centre
- Mass transit (Guided Bus)- Promote and support introduction of system on appropriate radial routes to avoid congestion hotspots around Aberdeen
- Pedestrian linkages between Guild Street and Union Street - Escalator
- Super Bus
- Strategic roads (capacity improvements) - A90 dualling (Ellon to Peterhead), A96 Complete Dualling (in partnership HITRANS), Haudigan Roundabout,Bridge of Dee, Anderson Drive (dualling on specific sections), Third Don Crossing, Stonehaven/Banchory/Inveruie
- Bus priority/ bus lanes - On key radial approaches to city: A90 (northern approach), Anderson drive, A947, A96, A93, and A90 (southern approach) andin key locations within Aberdeenshire
- Parking Strategy for north east - Develop and implement framework for managing supply / demand for parking, including pricing and enforcement
- Travel plans - promote and support the development of travel plans for individuals, businesses, health care, and schools
- Bus Partnerships - secure high quality bus services through the establishment of new partnership agreements with bus operators and PunctualityImprovement Partnerships
Strategic Option Development, Testing and Appraisal
15
Key Scenarios
4.11 In this section we provide results from two scenarios, these are:
• the Reference Case run referred to as T00 (Run 4), which includes the WPRtransport investment and other committed highway and public transport schemes.,and
• The preferred strategy which was developed from the Medium Cost Economypackage and is referred to as Run 27.
4.12 The preferred strategy was found to perform best against the economic, environmentaland social objectives that were developed interactively in the September 18 workshop.The economic and environmental objectives were SMART in that they specifiedquantitative targets for employment and car kilometres as a proxy for emissions.
4.13 The level of parking charge tested in run 27 was revised from that assumed in thepreviously modelled six initial options. The parking charge was modelled as a meansof modelling constraints on car travel. However the original charge, which was set ateither £0.60 or £1.20 depending on the destination of the car trip was found to be a fargreater component of the generalised time than what was deemed to be realistic.Therefore the parking charge was reduced to £0.08 for all trips into Aberdeen, or 1minute6.
4.14 Results of these model runs now follow, a fuller set of results for the six initial optionsas well as run 27, the preferred option, can be found in Appendix D. The results focuson the sustainable future position and so correspond to the year 2021 at the end of theRTS period. The impacts of the options for the following indicators are reported inturn:
• Economic
� Employment (jobs and jobs filled),
• Environmental
� Mode shares,
� Car miles,
� Average distance travelled,
• Social Inclusion
� Accessibility to public services, and
� Accessible jobs.
6 We have assumed a Value of Time (VoT) of £4.80 per hour which means that £0.08 charge is equivalent to 1minute of generalised time.
Strategic Option Development, Testing And Appraisal
16
Economic Indicators
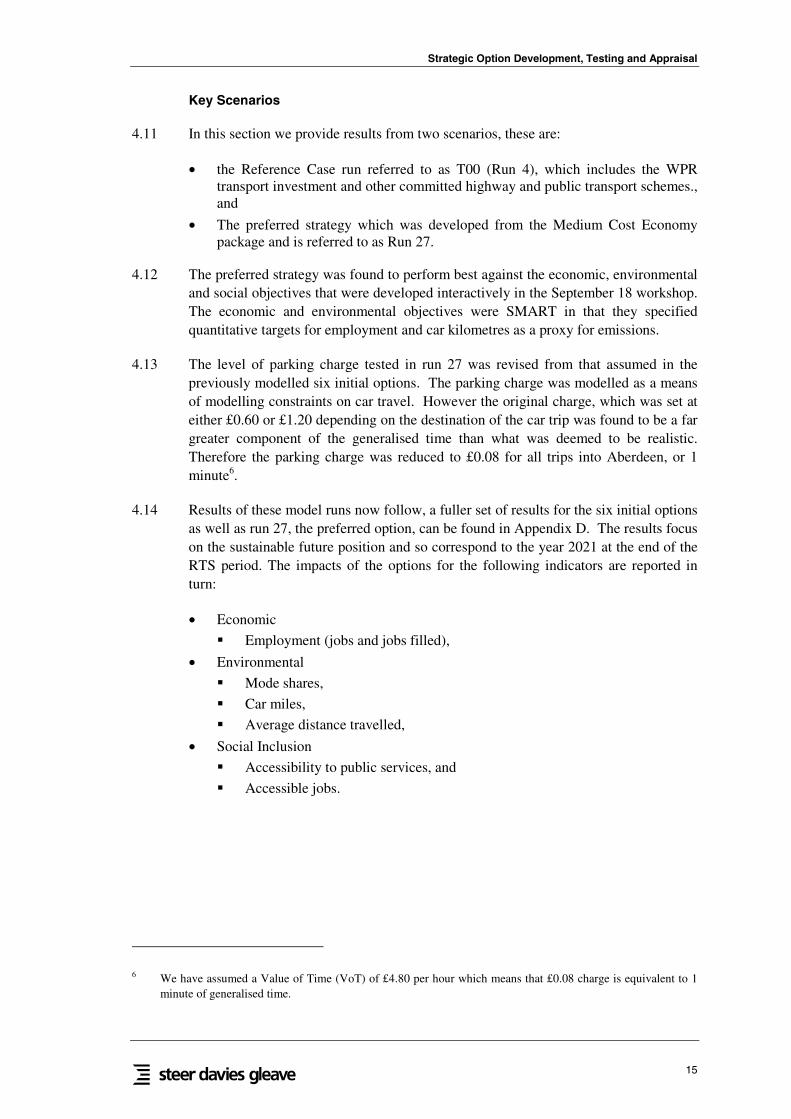
4.15 Figure 4.1 shows the job changes in the preferred option, run 27, as compared with thereference case, run 4. Run 27 shows insignificant changes in the city area, however,there is a growth of 1.4% of jobs in Aberdeenshire which is mainly in the zonesadjacent to Aberdeen City and the AWPR.
FIGURE 4.1 TOTAL JOBS 2021 – COMPARISON WITH REFERENCE CASE
Jobs 2021: Comparison of Run 27 (Preferred) with T00 (Ref)
-0.2%
1.4%
0.3%
-0.4%
-0.2%
0.0%
0.2%
0.4%
0.6%
0.8%
1.0%
1.2%
1.4%
1.6%
Aberdeen Aberdeenshire Total
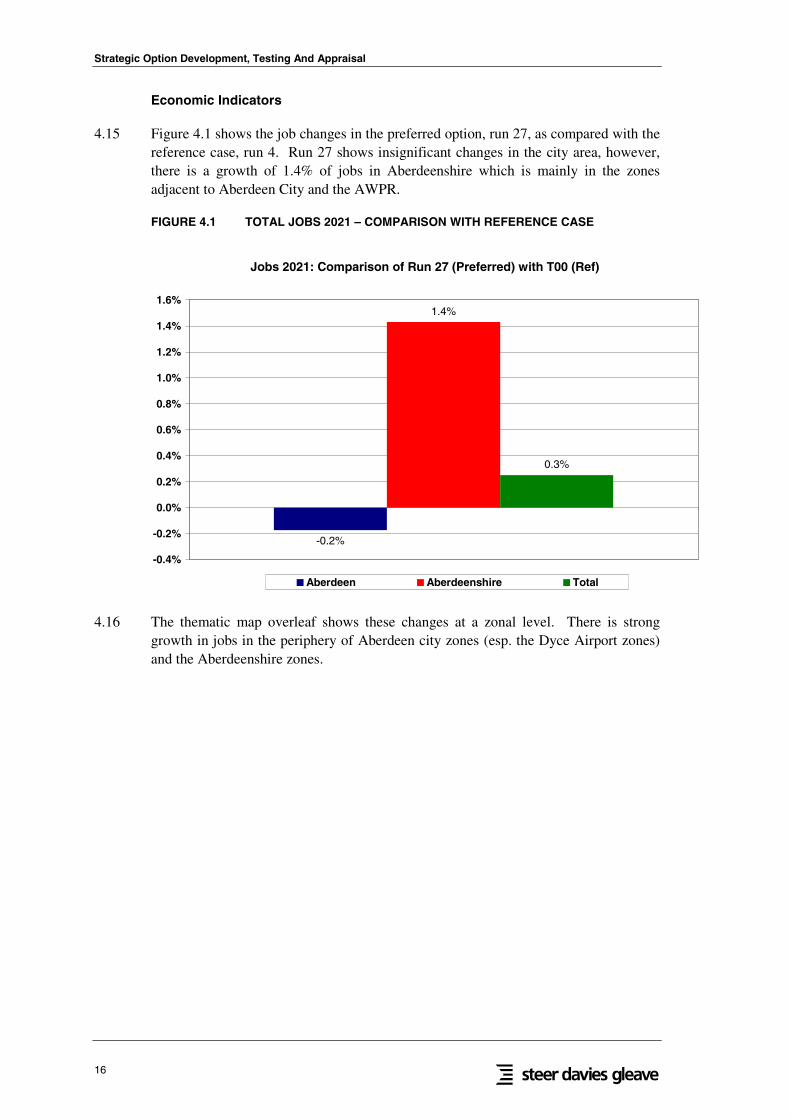
4.16 The thematic map overleaf shows these changes at a zonal level. There is stronggrowth in jobs in the periphery of Aberdeen city zones (esp. the Dyce Airport zones)and the Aberdeenshire zones.
Strategic Option Development, Testing and Appraisal
17
FIGURE 4.2 PERCENTAGE DIFFERENCE IN JOBS IN 2021 BETWEEN REFERENCECASE & PREFERRED RTS BY DYNAMIC MODEL ZONE
Strategic Option Development, Testing And Appraisal
18
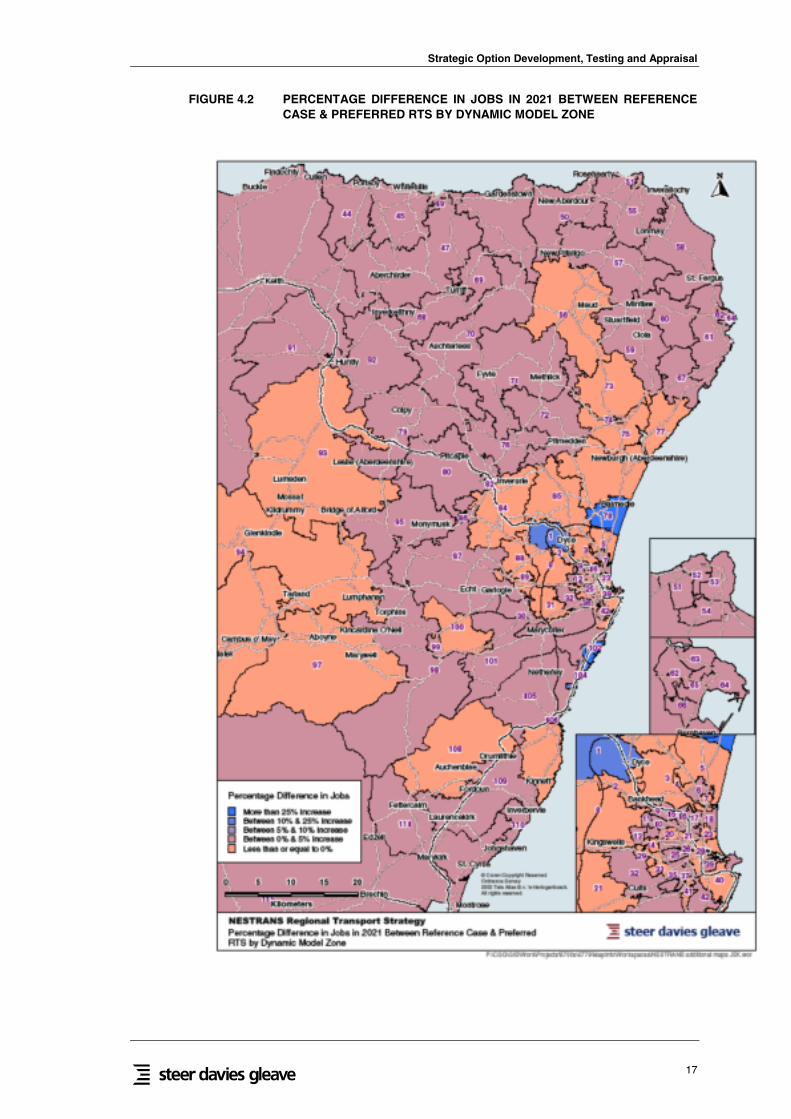
4.17 Not all jobs are filled however; some remain vacant, which could be because peoplecannot access them or the region does not have the workforce with the skills to servicethose jobs. Improvements in the transport system can act to reduce vacancy rates asimproved accessibility can bring jobs “closer” and also attract people to the region.Therefore vacancy rates can be reduced and this is a positive benefit to the region’scompetitive position.
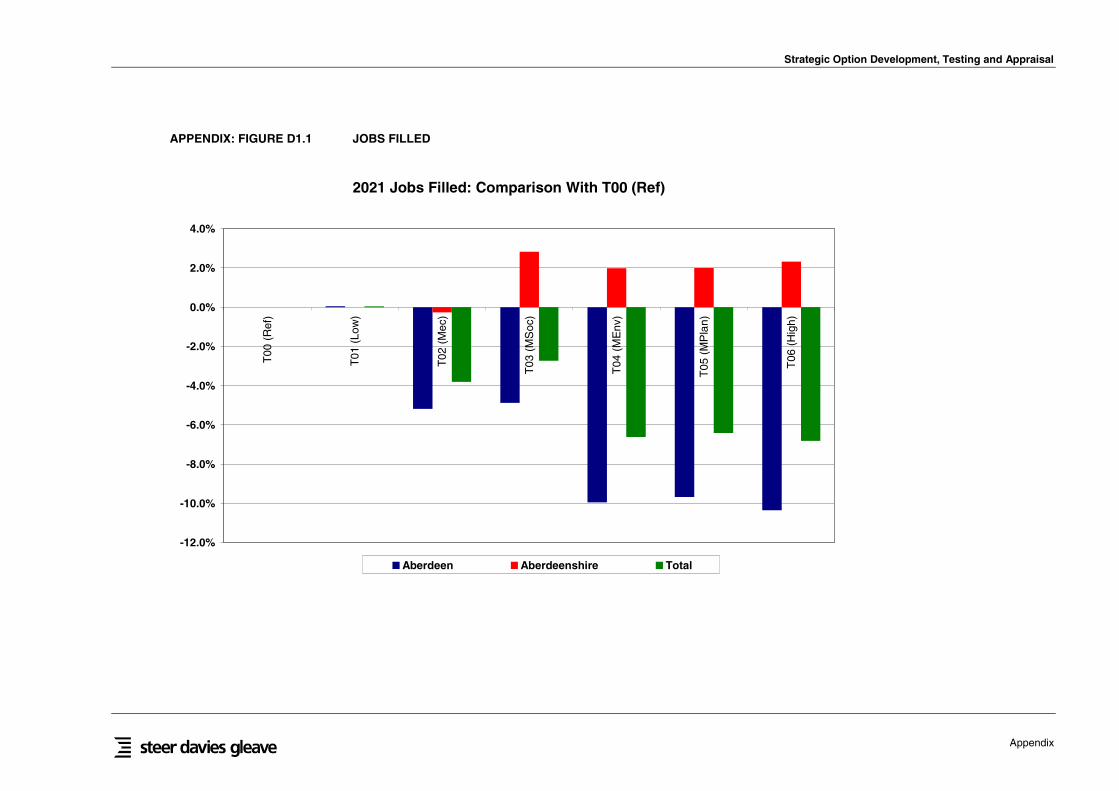
4.18 Figure 4.3 shows the job filled changes compared to the Reference Case. Runs 27 and4 both show an increase in jobs filled in the city, the county and the modelled area as awhole of approximately 1.3% showing that the RTS benefits the regional economy.
FIGURE 4.3 JOB FILLED 2021: COMPARISON WITH REFERENCE CASE
Jobs Filled: Comparison of Run 27 (Preferred) with T00 (Ref)
1.3%
1.4%1.3%
0.0%
0.2%
0.4%
0.6%
0.8%
1.0%
1.2%
1.4%
1.6%
Aberdeen Aberdeenshire Total
Environmental Indicators
4.19 In this analysis we used three indicators to assess the success of the RTS packages inmeeting the environmental objectives of the RTS; mode shares, average distancetravelled and car miles.
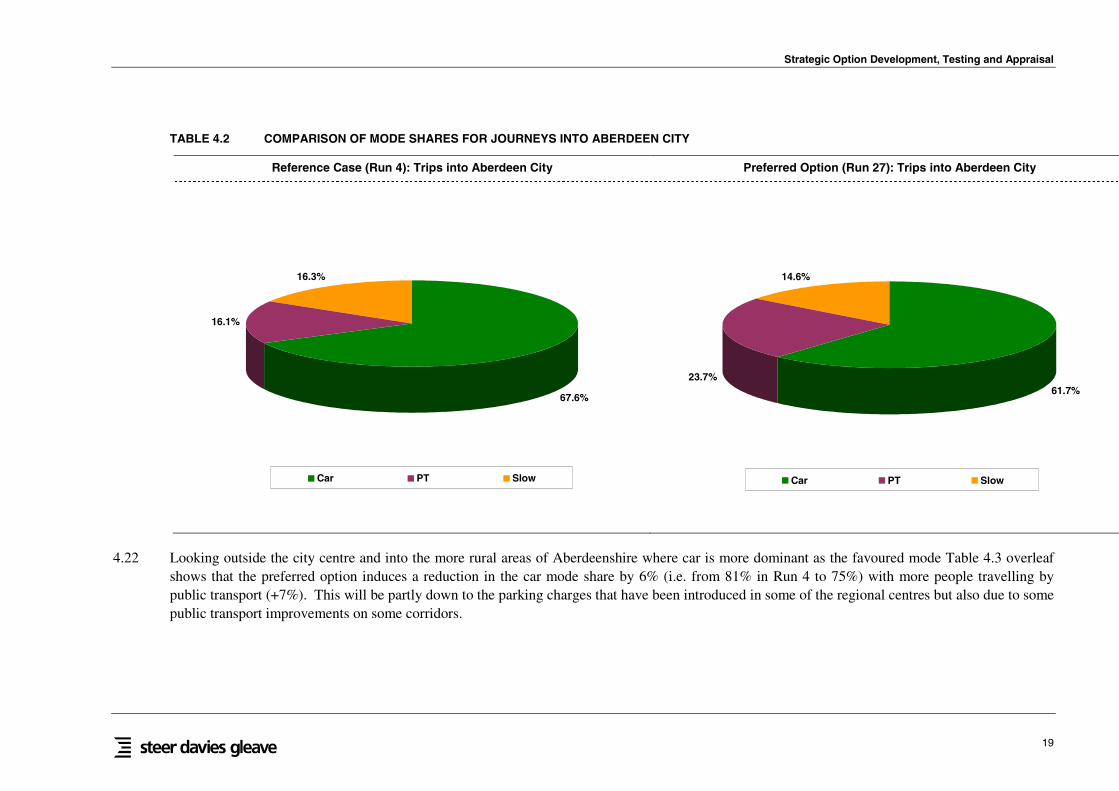
4.20 Table 4.2 shows mode shares for both the reference case and run 27 for the AberdeenCity area. The car share is reduced from 67.6% in the Reference Case (Run 4) to 62%by encouraging a shift to public transport (+7% in PT share). The non-mechanisedmode share (walk and cycle) is also reduced by around 2%, which is largely due to theimprovement in the public transport provision.
4.21 These results indicate that the RTS packages in run 27 are able to induce a transfer ofjourneys to Aberdeen city centre from car to public transport. This is due to acombination of an improvement in public transport provision and the parking chargeoperating in Aberdeen city centre which makes travel into the city centre moreexpensive.
Strategic Option Development, Testing and Appraisal
19
TABLE 4.2 COMPARISON OF MODE SHARES FOR JOURNEYS INTO ABERDEEN CITY
Reference Case (Run 4): Trips into Aberdeen City Preferred Option (Run 27): Trips into Aberdeen City
67.6%
16.1%
16.3%
Car PT Slow
61.7%23.7%
14.6%
Car PT Slow
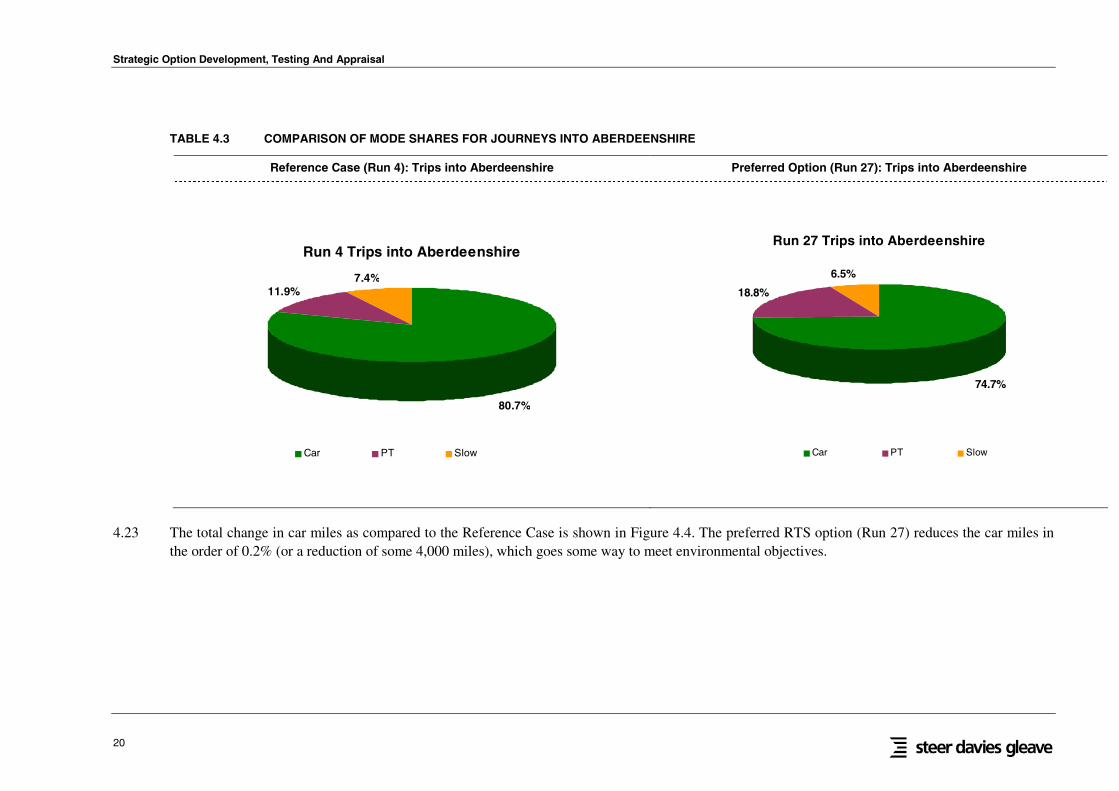
4.22 Looking outside the city centre and into the more rural areas of Aberdeenshire where car is more dominant as the favoured mode Table 4.3 overleafshows that the preferred option induces a reduction in the car mode share by 6% (i.e. from 81% in Run 4 to 75%) with more people travelling bypublic transport (+7%). This will be partly down to the parking charges that have been introduced in some of the regional centres but also due to somepublic transport improvements on some corridors.
Strategic Option Development, Testing And Appraisal
20
TABLE 4.3 COMPARISON OF MODE SHARES FOR JOURNEYS INTO ABERDEENSHIRE
Reference Case (Run 4): Trips into Aberdeenshire Preferred Option (Run 27): Trips into Aberdeenshire
Run 4 Trips into Aberdeenshire
80.7%
11.9%7.4%
Car PT Slow
Run 27 Trips into Aberdeenshire
74.7%
18.8%
6.5%
Car PT Slow
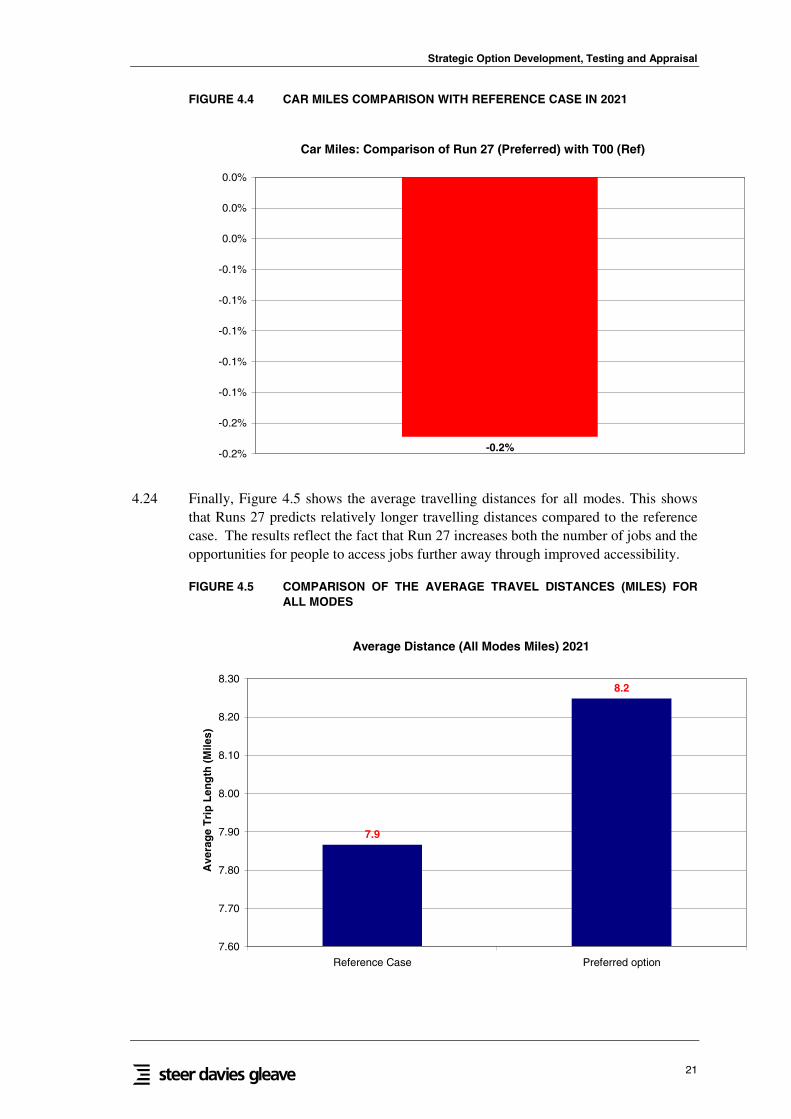
4.23 The total change in car miles as compared to the Reference Case is shown in Figure 4.4. The preferred RTS option (Run 27) reduces the car miles inthe order of 0.2% (or a reduction of some 4,000 miles), which goes some way to meet environmental objectives.
Strategic Option Development, Testing and Appraisal
21
FIGURE 4.4 CAR MILES COMPARISON WITH REFERENCE CASE IN 2021
Car Miles: Comparison of Run 27 (Preferred) with T00 (Ref)
-0.2%-0.2%
-0.2%
-0.1%
-0.1%
-0.1%
-0.1%
-0.1%
0.0%
0.0%
0.0%
4.24 Finally, Figure 4.5 shows the average travelling distances for all modes. This showsthat Runs 27 predicts relatively longer travelling distances compared to the referencecase. The results reflect the fact that Run 27 increases both the number of jobs and theopportunities for people to access jobs further away through improved accessibility.
FIGURE 4.5 COMPARISON OF THE AVERAGE TRAVEL DISTANCES (MILES) FORALL MODES
Average Distance (All Modes Miles) 2021
7.9
8.2
7.60
7.70
7.80
7.90
8.00
8.10
8.20
8.30
Reference Case Preferred option
Ave
rag
eT
rip
Len
gth
(Mile
s)
Strategic Option Development, Testing And Appraisal
22
Social Inclusion Indicators
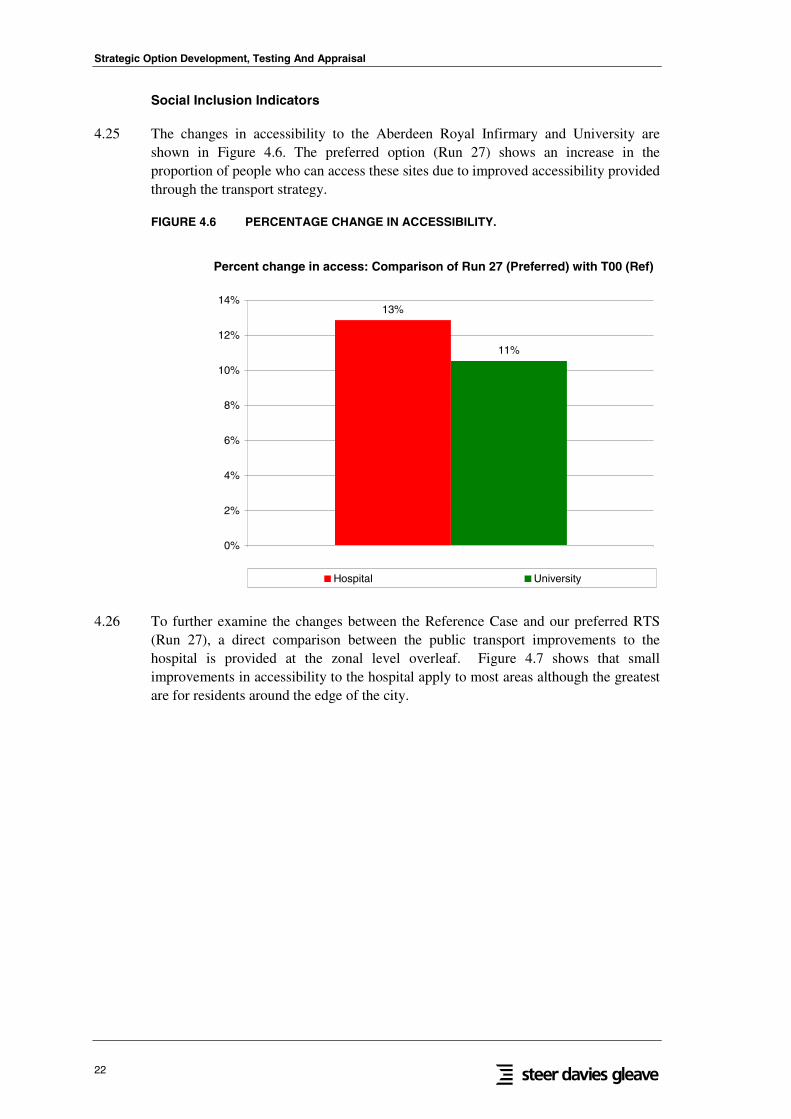
4.25 The changes in accessibility to the Aberdeen Royal Infirmary and University areshown in Figure 4.6. The preferred option (Run 27) shows an increase in theproportion of people who can access these sites due to improved accessibility providedthrough the transport strategy.
FIGURE 4.6 PERCENTAGE CHANGE IN ACCESSIBILITY.
Percent change in access: Comparison of Run 27 (Preferred) with T00 (Ref)
13%
11%
0%
2%
4%
6%
8%
10%
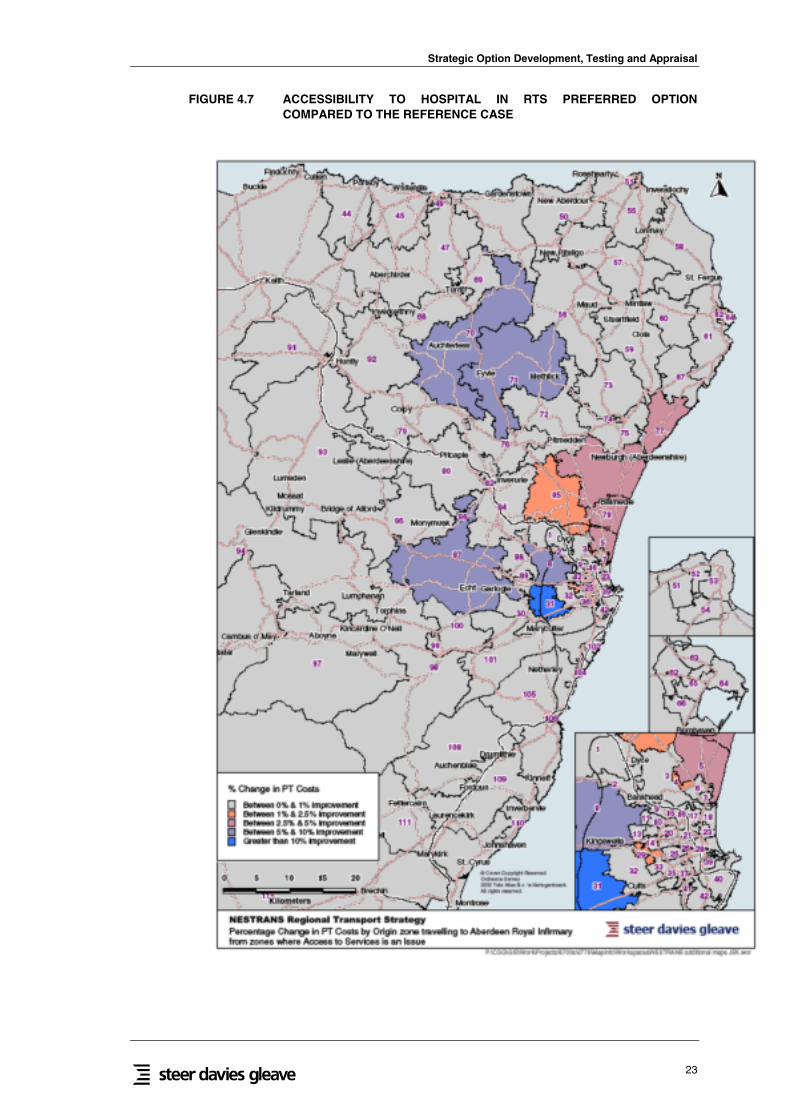
12%
14%
Hospital University
4.26 To further examine the changes between the Reference Case and our preferred RTS(Run 27), a direct comparison between the public transport improvements to thehospital is provided at the zonal level overleaf. Figure 4.7 shows that smallimprovements in accessibility to the hospital apply to most areas although the greatestare for residents around the edge of the city.
Strategic Option Development, Testing and Appraisal
23
FIGURE 4.7 ACCESSIBILITY TO HOSPITAL IN RTS PREFERRED OPTIONCOMPARED TO THE REFERENCE CASE
Strategic Option Development, Testing And Appraisal
24
Model Conclusions
4.27 The main conclusion is that from the key runs tested in the Nestrans dynamic model, itwas found that Run 27 offered the best results against the identified indicators andshould therefore be developed as the Preferred Scenario for the Regional TransportStrategy. Compared to the Reference Case (Run 4), this model run provides positivereturns against each of the key RTS objectives. The main indicators of the modelresults from Run 27, including:
• Economy: produce more jobs and jobs filled in the study area than the ReferenceCase by stimulating business activity, unlocking land for business, reducingvacancy rates and increasing the available workforce;
• Environment: reduce car use (reflected by car miles’ reduction) through theimprovement in public transport provision, selected highway improvements andcar parking policy which encourages more travel by public transport; and
• Social Inclusion: improve the accessibility to Foresterhill hospital and AberdeenUniversity for residents of the region.
Strategic Option Development, Testing and Appraisal
25
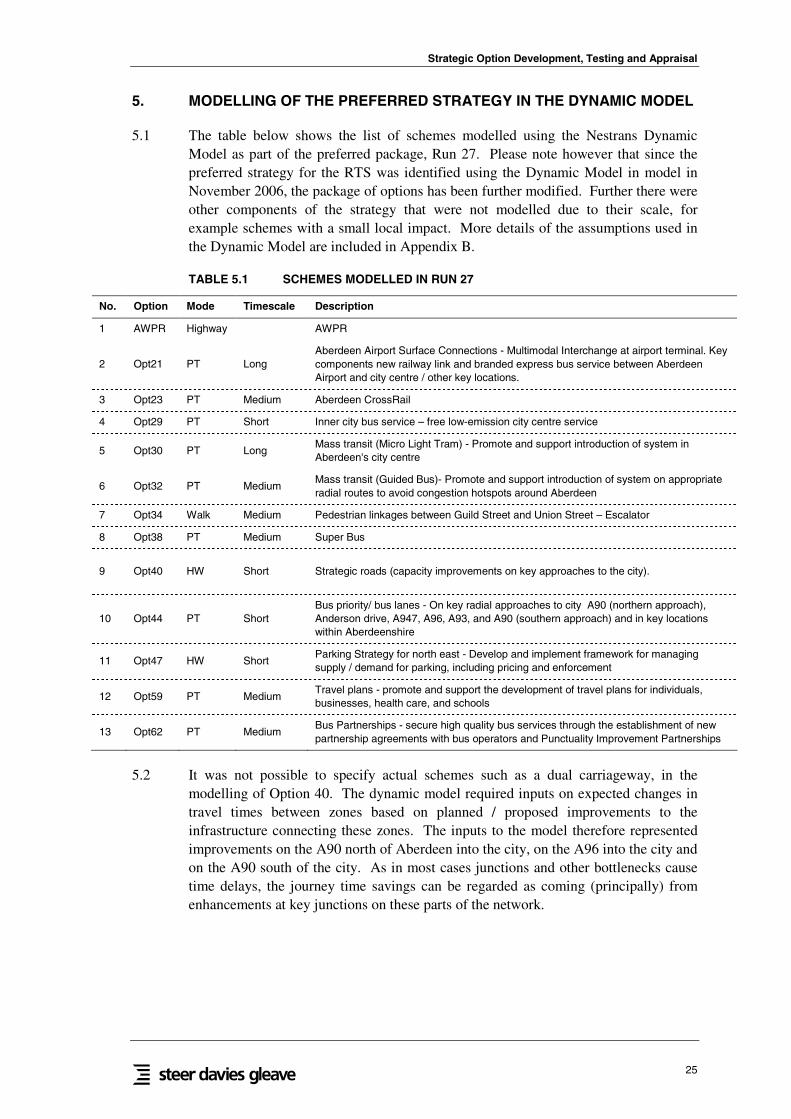
5. MODELLING OF THE PREFERRED STRATEGY IN THE DYNAMIC MODEL
5.1 The table below shows the list of schemes modelled using the Nestrans DynamicModel as part of the preferred package, Run 27. Please note however that since thepreferred strategy for the RTS was identified using the Dynamic Model in model inNovember 2006, the package of options has been further modified. Further there wereother components of the strategy that were not modelled due to their scale, forexample schemes with a small local impact. More details of the assumptions used inthe Dynamic Model are included in Appendix B.
TABLE 5.1 SCHEMES MODELLED IN RUN 27
No. Option Mode Timescale Description
1 AWPR Highway AWPR
2 Opt21 PT LongAberdeen Airport Surface Connections - Multimodal Interchange at airport terminal. Keycomponents new railway link and branded express bus service between AberdeenAirport and city centre / other key locations.
3 Opt23 PT Medium Aberdeen CrossRail
4 Opt29 PT Short Inner city bus service – free low-emission city centre service
5 Opt30 PT LongMass transit (Micro Light Tram) - Promote and support introduction of system inAberdeen's city centre
6 Opt32 PT MediumMass transit (Guided Bus)- Promote and support introduction of system on appropriateradial routes to avoid congestion hotspots around Aberdeen
7 Opt34 Walk Medium Pedestrian linkages between Guild Street and Union Street – Escalator
8 Opt38 PT Medium Super Bus
9 Opt40 HW Short Strategic roads (capacity improvements on key approaches to the city).
10 Opt44 PT ShortBus priority/ bus lanes - On key radial approaches to city A90 (northern approach),Anderson drive, A947, A96, A93, and A90 (southern approach) and in key locationswithin Aberdeenshire
11 Opt47 HW ShortParking Strategy for north east - Develop and implement framework for managingsupply / demand for parking, including pricing and enforcement
12 Opt59 PT MediumTravel plans - promote and support the development of travel plans for individuals,businesses, health care, and schools
13 Opt62 PT MediumBus Partnerships - secure high quality bus services through the establishment of newpartnership agreements with bus operators and Punctuality Improvement Partnerships
5.2 It was not possible to specify actual schemes such as a dual carriageway, in themodelling of Option 40. The dynamic model required inputs on expected changes intravel times between zones based on planned / proposed improvements to theinfrastructure connecting these zones. The inputs to the model therefore representedimprovements on the A90 north of Aberdeen into the city, on the A96 into the city andon the A90 south of the city. As in most cases junctions and other bottlenecks causetime delays, the journey time savings can be regarded as coming (principally) fromenhancements at key junctions on these parts of the network.
Strategic Option Development, Testing And Appraisal
26
Options included in draft RTS
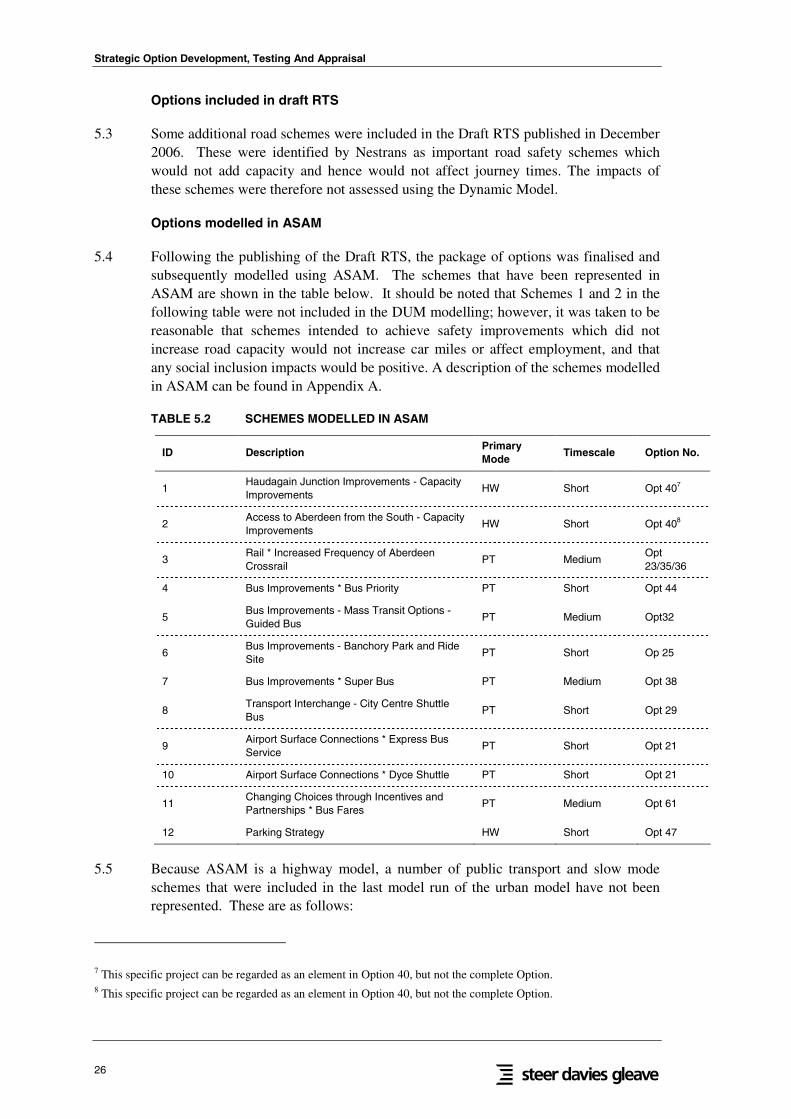
5.3 Some additional road schemes were included in the Draft RTS published in December2006. These were identified by Nestrans as important road safety schemes whichwould not add capacity and hence would not affect journey times. The impacts ofthese schemes were therefore not assessed using the Dynamic Model.
Options modelled in ASAM
5.4 Following the publishing of the Draft RTS, the package of options was finalised andsubsequently modelled using ASAM. The schemes that have been represented inASAM are shown in the table below. It should be noted that Schemes 1 and 2 in thefollowing table were not included in the DUM modelling; however, it was taken to bereasonable that schemes intended to achieve safety improvements which did notincrease road capacity would not increase car miles or affect employment, and thatany social inclusion impacts would be positive. A description of the schemes modelledin ASAM can be found in Appendix A.
11Changing Choices through Incentives andPartnerships * Bus Fares
PT Medium Opt 61
12 Parking Strategy HW Short Opt 47
5.5 Because ASAM is a highway model, a number of public transport and slow modeschemes that were included in the last model run of the urban model have not beenrepresented. These are as follows:
7 This specific project can be regarded as an element in Option 40, but not the complete Option.8 This specific project can be regarded as an element in Option 40, but not the complete Option.
Strategic Option Development, Testing and Appraisal
27
• Opt30: Mass transit (Micro Light Tram) - Promote and support introduction ofsystem in Aberdeen's city centre
• Opt59: PT Travel plans - promote and support the development of travel plans forindividuals, businesses, health care, and schools
• Opt34: Pedestrian linkages between Guild Street and Union Street – Escalator
5.6 All other schemes shown in table 5.1 have been represented in ASAM.
5.7 In addition it should be noted that the Banchory Park and Ride scheme (option 25) hadnot previously been modelled in the Dynamic Model.
5.8 The following chapter presents the results of the full assessment of the RTSincorporating the key outputs from the various models.
Strategic Option Development, Testing And Appraisal
28
6. APPRAISAL OF REGIONAL TRANSPORT STRATEGY
Introduction
6.1 The Regional Transport Strategy is an integrated package of measures which supportand complement each other. The degree of integration is such that good appraisalpractice indicates that, as far as possible, the strategy should be appraised as a whole,as its total value will (or should) exceed the value of its individual components. Thisapproach is in keeping with UK and European best practice guidance (see for examplethe Guide to Cost Benefit Analysis9 produced by the Evaluation Unit of the DGRegional of the European Commission).
6.2 As far as possible the appraisal of the regional strategy follows the appraisal guidancein STAG, and therefore
• It is objective-led and based around the Scottish Executive's five appraisalobjectives; and
• uses a multi-criteria framework approach.
6.3 However, as discussed below, it was not feasible to provide estimates of quantitativeoutcomes for the strategy as a whole due to limitations associated with the availablemodelling tools. The following uses the Scottish Executive’s 5 appraisal objectives asthe structure for reporting the appraisal outputs.
Environment
6.4 The UDM generated estimates of changes in car miles for the entire Nestrans area;from this estimates of CO2 can be made. Table 6.1 shows estimates of person milesmade as car trips and total person miles made by all modes; this is taken from theUDM analysis. This shows that while the RTS generates more mobility (which isbeneficial for the economy and for social inclusion), fewer person miles areundertaken by car due to the shift from car to public transport.
TABLE 6.1 CAR MILES WITHIN THE REFERENCE CASE AND RTS PACKAGE
YearCar miles
(thousands)All trip miles(thousands)
Reference case 2021 2,389 2,865
RTS package 2021 2,835 3,020
6.5 In addition, ASAM was used to make estimates of emissions for a range of pollutants.It should be noted that these estimates, while based on a more detailed transport modelfor the area around Aberdeen, are not estimates for the whole of the north east becauseof the geographic coverage of the ASAM model. Nonetheless, as most travel takesplace in and around Aberdeen, the results can be regarded as reasonably representativeof outcomes at the level of the region. It should be noted that this excludes aviationand shipping. Table 6.2 presents these estimates.
Strategic Option Development, Testing and Appraisal
29
6.6 These are modelled changes as a result of the interventions in the RTS and will besupplemented by improvements to engine technology, other measures by individuals,Governments etc to improve the efficiencies of vehicles and choice
TABLE 6.2 ASAM ESTIMATES OF ENVIRONMENTAL EMISSIONS (TONNES)
Reference case RTS Package
2012 2027 2012 2027
Carbonmonoxide
2,310 2,325 2,289 2,306
HydrocarbonTHC
345 344 343 342
Nitrogen oxidesNOX
2,355 1,650 2,344 1,643
ParticulatesPM10
68 49 68 49
Carbon dioxide
CO2633,198 699,404 629,633 696,030
Changes from the Reference Case
Tonnes %
2012 2027 2012 2027
Carbonmonoxide
-21 -19 -0.9% -0.8%
HydrocarbonTHC
-3 -2 -0.7% -0.7%
Nitrogen oxidesNOX
-11 -7 -0.5% -0.4%
ParticulatesPM10
-0.4 -0.3 -0.6% -0.6%
Carbon dioxide
CO2-3,565 -3,374 -0.6% -0.5%
6.7 The changes in emissions reflect a shift towards use of public transport especially forcity centre movements; park and rise usage is expected to increase in tandem with aslight reduction in car travel to central Aberdeen
Safety
6.8 The strategy will enhance the safety of travelling in the north east. This is because,compared with the Reference Case, overall car miles travelled is reduced, and accidentrates involving cars are broadly proportional to car miles.
6.9 Associated with this, the strategy achieves mode shift from car to public transport,including a shift to rail. Bus travel generally achieves lower accident rates than cartravel while rail travel has very low accident rates.
Strategic Option Development, Testing And Appraisal
30
6.10 The strategy includes specific road improvements designed to increase safety, forexample at particular junctions or on parts of routes where accident rates have beenabove average for that type of road in the north east.
6.11 Accordingly the strategy is expected to enhance safety levels across the region. Inaddition, measures to improve transport interchanges and to provide better informationon public transport journeys are expected to increase the users’ sense of personalsecurity while using the transport system in the north east.
Economy
Transport economic efficiency (TEE)
6.12 While there had been an aspiration to undertake a TEE analysis for the whole of thestrategy as an integrated package, this was not possible with the existing modellingtools. Specifically, the ASAM model was designed to examine transport measureswithin and close to Aberdeen and accordingly the demand side of the model is lessdetailed for the rest of the Nestrans area, and does not fully represent public transportdemand. The UDM used cost data from ASAM but the UDM generates its own regionwide demand outputs, which were used to generate the outputs on the environmentand on EALI’s. It was not however feasible to use the UDM demand outputs inASAM.
6.13 Accordingly, it was judged that, in the absence of adequate region-wide modellingtools, it would not be sensible to undertake this element of the STAG appraisal for thestrategy as a whole. This does not preclude undertaking TEE analysis for individualelements, although it is necessary to caveat any individual scheme appraisal with thewarning that the appraisal might under or over estimate benefits and / or costs becauseof interactions with other elements within the strategy.
Economic Activity and Location Impacts (EALIs)
6.14 The UDM does make it possible to undertake the economic activity and locationanalysis (EALI) which is the other element of the economy objective in STAG. TheUDM calculates two measures of economic activity, namely jobs and jobs filled. Theformer can be thought of as demand for labour, while jobs filled represents thesituation where demand and supply have been matched by the model.
6.15 Jobs may be generated within the model in a range of locations as these become moreattractive or competitive, but unless transport links are in place for travel to work andpeople within the working age population choose to use these links and take up jobsrather than to be economically inactive, jobs will remain unfilled. The indicator “filledjobs” therefore provides a good indication of how these processes are expected towork through within the regional economy. Economic analysis also indicates that ingeneral positive EALI results correspond broadly to levels of time savings, whichcomprise the benefits side of the TEE analysis. It is reasonable therefore to infer thatthe conventional transport economic benefits (which it was not possible to quantifydirectly) will be positive at the level of the region.
6.16 The UDM analysis shows that the RTS package will increase the total level of jobs
Strategic Option Development, Testing and Appraisal
31
filled by 1.3% over the Reference Case. In absolute numbers of jobs this amounts to2,550 additional filled jobs and in total 196,890 filled jobs with the RTS package.
Accessibility
6.17 The UDM can be used to test and quantify accessibility changes between any zones inthe model and between a group of zones and any specific zone. A limited series ofaccessibility tests was undertaken in order to examine access to centralised health careand to higher education sites. The results of the analysis were presented in Figure 4.8,which showed a 5% improvement in accessibility to health care (Aberdeen RoyalInfirmary) and a 9% improvement in accessibility to Aberdeen University. Theseimprovements are in addition to the accessibility gains shown for Reference Casecompared with the do-minimum scenario.
Integration
6.18 Integration between transport modes is one of the integration tests. Integration isperhaps best seen as a means to an end, namely faster, more reliable, more “seamless”and hence more highly valued journeys, with an emphasis on public transport andachieving greater use of public transport compared with car, which already tends to beseen to offer a high degree of integration and flexibility.
6.19 The mode shift outcomes show that in the Aberdeen City area, the strategy is expectedto reduce the car share from 67.6% in the Reference Case to 62% by encouraging ashift to public transport (+7% in PT share compared to the Reference Case). However,the slow mode share (walk and cycle) is also reduced by around 2%, which is largelydue to the improvement in the public transport provision.
6.20 The strategy is therefore expected to induce a transfer of journeys to Aberdeen citycentre from car to public transport. This is due to a combination of an improvement inpublic transport provision and the parking charge operating in Aberdeen city centrewhich makes travel into the city centre more expensive.
6.21 In the more rural areas of Aberdeenshire car is more dominant as the favoured mode;the strategy is expected to achieve a reduction in the car mode share by 6%, from 81%in the Reference Case to 75%, with more people travelling by public transport (+7%).This will be partly due to the parking charges that have been introduced in some of theregional centres but also due to some public transport improvements on somecorridors.
6.22 Integration clearly contributes to the mode share changes, but at the level of the northeast as a whole, integration appears to be less significant than other measuresincluding parking measures and increased public transport provision. However, forspecific journeys, elements of the RTS will generate worthwhile (largely local orjourney specific) integration benefits. These include interchanges between publictransport modes in the city centre, and bus – airport links which improve interchangebetween surface public transport and air services.
6.23 The other integration test is concerned with policy integration. The RTS has beendeveloped within the framework of existing transport and other policies in the north
Strategic Option Development, Testing And Appraisal
32
east and at national level and in particular the future transport policy context that willbe delivered through implementation of projects within the Modern Transport Systemstrategy. It should be noted, however, that the UDM analysis has included the use of arange of future land use planning scenarios; this was necessary because the newregional spatial strategy is being developed later than the RTS. With this proviso, theRTS can be regarded as fully “policy compliant” with other relevant policies withinthe north east.
Conclusions
6.24 The appraisal of a regional level transport strategy as a whole or in the round is highlydesirable, because in an ideal world it would enable all the interactions betweenelements of the strategy to be captured. By appraising the strategy as a whole, it can inprinciple be fine tuned to achieve specific SMART objectives (as was the case in thedevelopment of the RTS), or it could be used to maximise the outcomes for any givenlevel of investment.
6.25 In practice, what can be achieved at the strategic level is dependent on the modellingand analytical tools available. In the case of the RTS, two models were available, eachwith strengths and weaknesses, reflecting the fact that each had been developed forspecific purposes, for specific areas and to look in detail at specific modes. Because ofthis not all the elements of a STAG appraisal could be undertaken. Nevertheless, it hasbeen possible to report on the following in quantitative terms:
• Environment: analysis of CO2 and other emissions
• Economy: economic activity and location impacts (EALIs): jobs filled
• Accessibility: regional accessibility to key health and education locations
• Integration: by reference to public transport mode share.
6.26 All of these indicators show positive outcomes from the RTS compared with theReference Case.
6.27 The overall conclusion is that the RTS performs well against the SMART objectivesset by Nestrans and against four of the objectives used by the Scottish Executive /Transport Scotland in appraising projects. It is also reasonable to infer that the strategywould perform well against the transport economics (TEE) objective and against thesafety objective.
6.28 There is scope to undertake further and more detailed work to improve upon thisappraisal and in particular to produce a TEE / cost benefit analysis of the RTS packageas a whole. However, this would depend upon the development of the existingtransport, land use and economy modelling tools, which was not feasible within thetimescales for production of the RTS.
Strategic Option Development, Testing and Appraisal
33
Strategic Option Development, Testing and Appraisal
Appendix
APPENDIX A
ASAM MODELLING ASSUMPTIONS
Strategic Option Development, Testing and Appraisal
Highway Short Opt40These junction improvements follow the descriptions in the 'Haudagain STAG 1 Report'(SIAS, October 2006) and include a dual carriageway link road connecting North AndersonDrive with Auchmill Road. This includes two new signal controlled junctions with bus priority.
2Access to Aberdeenfrom the South -Capacity Improvements
Highway Medium Opt40The assessment of these potential capacity improvements assumes additional bus priorityalong the Wellington road corridor. This includes the capability of bus priority at and on theapproach to five junctions.
3Rail * IncreasedFrequency of AberdeenCrossrail
PT Medium Opt23/35/36
These improvements build on the proposed introduction of Aberdeen Crossrail phase one,and create a 15 minute train service between Inverurie and Stonehaven. New rail stationsat Newtonhill, Aberdeen North and South (ie Kittybrewster and Altens) are also includedwithin the appraisal package (assuming some park and ride capability * ie a small 30 spacecar park). The new services are assumed to stop at all stations between Stonehaven andInverurie.
4Bus Improvements * BusPriority
PT Short Opt44
A number of bus priority schemes are proposed at junctions along key radial approachesand city routes. These include the A947, A96, A93 and Anderson Drive. These modelledscheme tests assume that the junction improvement introduced will provide priority for allbuses at and on the approach to a total of 13 intersections. It also assumes that this newbus priority is additional to the existing set up, with little detrimental effect to existing roadand junction capacity.
5Bus Improvements -Mass Transit Options -Guided Bus
PT Medium Opt32
A guided bus way is proposed along two corridors into Aberdeen * from the A944 KingswellsPark and Ride Site via the city centre to the A90 Bridge of Don Park and Ride site (includinga relocated A90 Park and Ride Site to Blackdog with up to 1000 spaces). This modelled testassumes around 5 km of additional bus lane/ guideway capacity (in both directions) with buspriority at 15 junctions along the A90 and A944 corridors. The majority of buses operatingalong these routes are assumed to be able to use the new guide way.
6Bus Improvements -Banchory Park and RideSite
PT Short Op25A new 250 space car park is included at Banchory. This improves the availability of directaccess to bus and enhances existing service frequency to every 20 minutes in the morningand evening peaks.
7Bus Improvements *Super Bus
PT Medium Opt38Over the long term, improving the quality of bus services in and around will be explored,including the Super bus concept, and also developing integrated ticketing and real timeinformation systems. These interventions have been represented in ASAM3B by improving
Strategic Option Development, Testing And Appraisal
Appendix
the perception of urban and interurban bus services to that closer to rail (mode constantreduced from 1.2 to 1.1). This test assumes that the majority of bus service within Aberdeenand Aberdeenshire are improved to a 'super bus standard' with the substantial andwidespread introduction of integrated ticketing and real time information.
8Transport Interchange -City Centre Shuttle Bus
PT Short Opt29A high frequency Aberdeen city centre shuttle bus has been included to improve accessbetween the rail and bus stations and the main shopping area. This was incorporated intoASAM3B with a 10 minute (free) bus service loop around Guild Street and Schoolhill.
9Airport SurfaceConnections * ExpressBus Service
PT Short Opt20/21
To improve access to the airport a high quality branded express bus service between thecity centre and the airport is proposed. This intervention was tested with the upgrading ofthe existing First 27 service to a 20 minute frequency (from the existing hourly service) withonly one or two stops directly on route to the Airport (ie Union Street and ARI). The cost fora single journey will be £3 and the perception of quality will be regarded closer to rail (modeconstant 1.2 reduced to 1.1 * similar to the super bus concept).
10Airport SurfaceConnections * DyceShuttle
PT Short Opt20/21To improve access to Aberdeen Airport, a free shuttle bus service is proposed to Dyce railstation. This service is assumed to be high frequency with services (where possible)integrated in line with arrival and departure times of trains at Dyce.
PT Medium Opt62Close cooperation with operators is envisaged to identify possible fare incentives toencourage bus use. This has been represented in ASAM3B by a 1.25% reduction in all busfares (source: SDG Modelled Options Impact Note).
12 Parking Strategy Highway Short Opt47
Developing a parking strategy to assist the control of traffic demand has been representedby increasing highway costs by 15 minutes for vehicles travelling to Aberdeen city centre(source: SDG Modelled Options Impact Note). This represents around double the currentlong stay parking charge within the city centre.
Strategic Option Development, Testing and Appraisal
Appendix
APPENDIX B
URBAN DYNAMIC MODEL MODELLING ASSUMPTIONS FOR PREFERRED PACKAGE
Strategic Option Development, Testing and Appraisal
Appendix
B1. SCHEMES MODELLED IN URBAN MODEL PREFERRED PACKAGE
APPENDIX: TABLE B1.1 URBAN MODEL PREFERRED OPTION MODELLING ASSUMPTIONS
No. Option PrimaryMode
Timescale Description
Impact Modelled as
Change in cost/time: Needsbetter explanation of modelassumptions based onattractiveness
Movements Affected:
1 WPR Highway - WPR From ASAM As ASAM As ASAM
2 Opt21 PT Long
Aberdeen Airport SurfaceConnections - MultimodalInterchange at airport terminal.Key components new railwaylink and branded express busservice between AberdeenAirport and city centre / otherkey locations.
Reduction in in-vehicle-time toAberdeen city centre from theAirport and change in modefrom bus to LRT.
Reduce PT costs -13.7mins
(From 27 mins by bus, modeweighting 1.2 to 17 mins byLRT, mode weighting 1.1)
Full benefit to movements fromsectors South of City Centre,half benefit to urban modelzones 15-20
4 Opt29 PT ShortInner city bus service – freelow-emission city centre service
Zero Fare (assume save £1)and higher freq (x3)
Reduce intra-zonal PT costs -22.5min in Zone 28 (12.5 min(@ VoT £4.80/min) + 10minwait time reduction)
Within city centre zone only(Zone 28)
5 Opt30 PT Long
Mass transit (Micro Light Tram)- Promote and supportintroduction of system inAberdeen's city centre
Higher frequency (x3)Reduce intra-zonal PT costs -12.5min in Zone 28 (10min waittime reduction)
Within city centre zone only(Zone 28)
6 Opt32 PT Medium
Mass transit (Guided Bus)-Promote and supportintroduction of system onappropriate radial routes toavoid congestion hotspotsaround Aberdeen
Incremental benefit on option44 PLUS A944 guided bus
Reduction in PT costs 7 min(both directions) [5 min JTreduction]
To/From zones 87-90,93-95from/to City Centre zones (5min reduction from zone 8 toCity Centre)
7 Opt34 Walk Medium Pedestrian linkages betweenGuild Street and Union Street -
Reduction in ‘slow modes’ intra-zonal cost
5 min reduction in journey timeWithin city centre zone only(Zone 28)
Strategic Option Development, Testing And Appraisal
Appendix
Escalator
8 Opt38 PT Medium Super Bus
Reduction of PT costs by 2-5min for O-D pairs between CityCentre zones and Airport, CityCentre and Oldmachar, andCity Centre to Shire zones.
Between city centre zones 21-28 and zones: 1, 2, 5, 30-32,40, 42-43 51-84, 92, and 96-109
9 Opt40 Highway ShortStrategic roads (capacityimprovements): access to cityfrom north, south and west
A range of reductions inhighway costs of between 6and 12 minutes (over the basetimes) on in-scope OD pairsbased on the scope of each ofthe above schemes. Thehigher reductions areassociated with the duallingschemes.
Reduction in highway costs ofbetween 6 and 12 minutes onzone pairs affected by thecapacity improvments
Trips originating zones 57-67,74-78, 101-111 withdestinations zones 1-43, and100-111 and vice versa.
10 Opt44 PT Short
Bus priority/ bus lanes - On keyradial approaches to city A90(northern approach), Andersondrive, A947, A96, A93, and A90(southern approach) and in keylocations within Aberdeenshire
Reduction in bus times to by 2-4 min from Airport, SW & SEcity zones, and Shire toAberdeen City Centre. Noreduction in times for reversetrips i.e. going out of Aberdeen
See separate tableSelected origins to city centrezones 21-28
11 Opt47 Highway Short
Parking Strategy for north east -Develop and implementframework for managing supply/ demand for parking, includingpricing and enforcement
Parking charges - as highwaycosts for trips terminating ineach zone
Highway cost increased by 1min for trips terminating in cityand 1 min for trips terminatingin other town centres
All origin trips to city and shirezones 9-28, 33-39, 46, 48, 51-54, 62-66, 81-83, 99, 106 and107.
12 Opt59 PT Medium
Travel plans - promote andsupport the development oftravel plans for individuals,businesses, health care, andschools
Reduction of PT costsReduce the PT penalty inmodel by 80% for urban areaand 2/3 for rural area
All zone pairs
13 Opt62 PT Medium
Bus Partnerships - secure highquality bus services through theestablishment of newpartnership agreements withbus operators and PunctualityImprovement Partnerships
Reduction of PT costsReduction of PT costs by 0.5%across all movements(including intrazonal)
All zone pairs
Strategic Option Development, Testing and Appraisal
Appendix
APPENDIX: TABLE B1.2 OPT23 - CROSSRAIL MODEL ASSUMPTIONS
Station Inverurie Kintore DyceAberdeen
NorthAberdeen
AberdeenSouth
Cove Bay Portlethen Newtonhill Stonehaven
Zone Z 80,81,82 Z 84 Z 1,2 Z 15,16,17 Z 27,28,38 Z 39,40 Z 42,43 Z 102,103 Z 104 Z 105-108
Z 80,81,82 - 20% 20% 20% 20% 50% 50% 50% 50% 50%
Z 84 20% - 20% 20% 20% 50% 50% 50% 50% 50%
Z 1,2 20% 20% - 5% 5% 50% 50% 50% 50% 50%
Z 15,16,17 20% 20% 5% - 5% 40% 40% 50% 50% 50%
Z 27,28,38 20% 20% 5% 5% - 20% 20% 20% 20% 20%
Z 39,40 50% 50% 50% 40% 20% - 20% 20% 20% 20%
Z 42,43 50% 50% 50% 40% 20% 20% - 20% 20% 20%
Z 102,103 50% 50% 50% 50% 20% 20% 20% - 20% 20%
Z 104 50% 50% 50% 50% 20% 20% 20% 20% - 20%
Z 105-108 50% 50% 50% 50% 20% 20% 20% 20% 20% -
B1.1 The table above shows the modelled percentage decreases in generalised times, assumed to apply to specific zone pairs. For example, it is assumedthat public transport generalised times will be reduced by 50% between zone 104 (Newtonhill in the South East of Aberdeenshire) and AberdeenNorth station which is located between zones 15, 16 and 17 which are Hilton, Woodside and St Machar respectively in the north of the city centre.
Strategic Option Development, Testing And Appraisal
Appendix
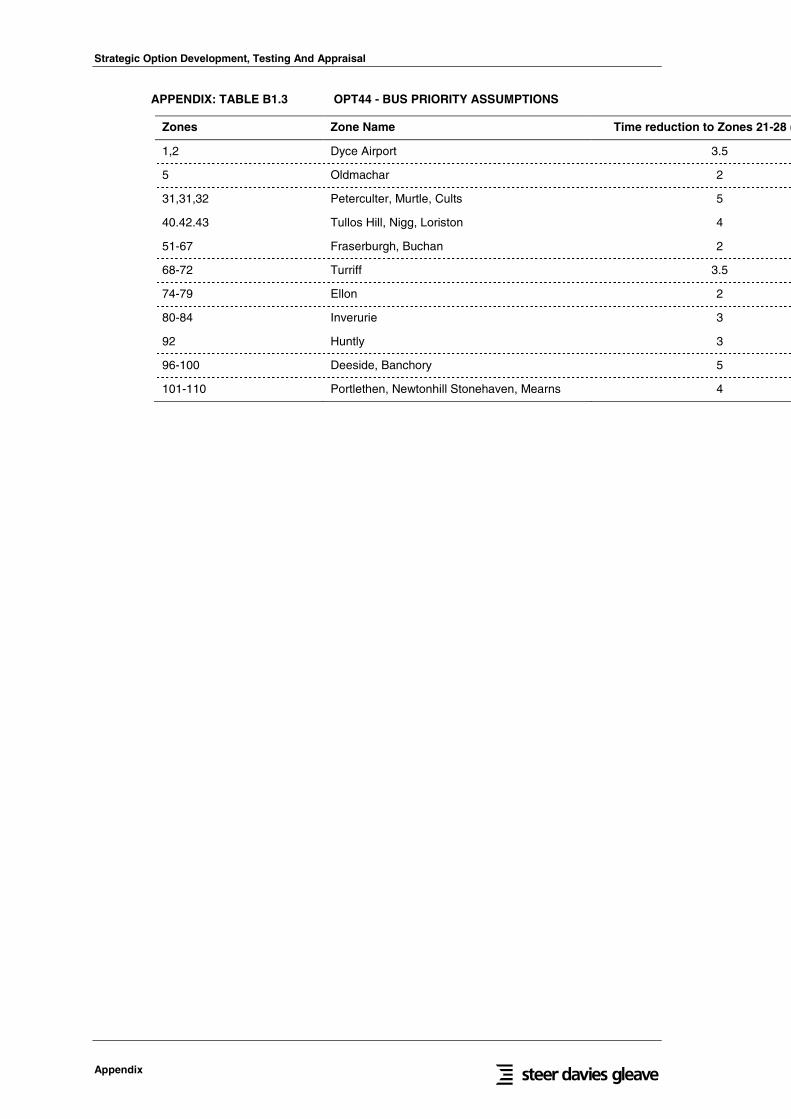
APPENDIX: TABLE B1.3 OPT44 - BUS PRIORITY ASSUMPTIONS
min)Enhanced Medium Cost Economy Package withparking charge
28E00 T02 Econ Enhanced (New Park Charge 1min) + CC Land
Enhanced Medium Cost Economy Package withparking charge and extra land in Aberdeen City.
29E02 T02 Econ Enhanced As R27 with CycleBenefits
Strategic Option Development, Testing And Appraisal
Appendix
30E02 T02 Econ Enhanced As R27 with 0.5 minCycle Benefits
31E02 T02 Econ Enhanced As R27 with 1.5/2 minCycle Benefits
32E02 T02 Econ Enhanced As R27 with High minCycle Benefits
Strategic Option Development, Testing and Appraisal
Appendix
APPENDIX D
RESULTS FROM KEY MODEL RUNS
Strategic Option Development, Testing and Appraisal
Appendix
D1. ECONOMIC INDICATORS
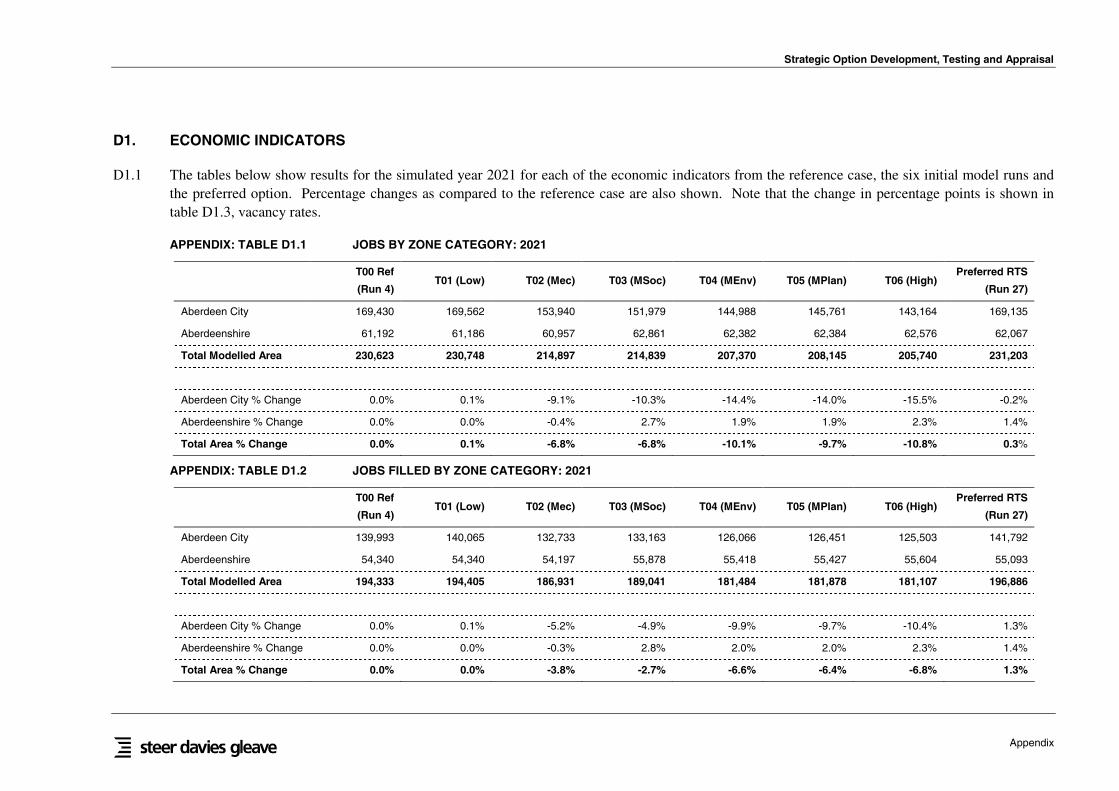
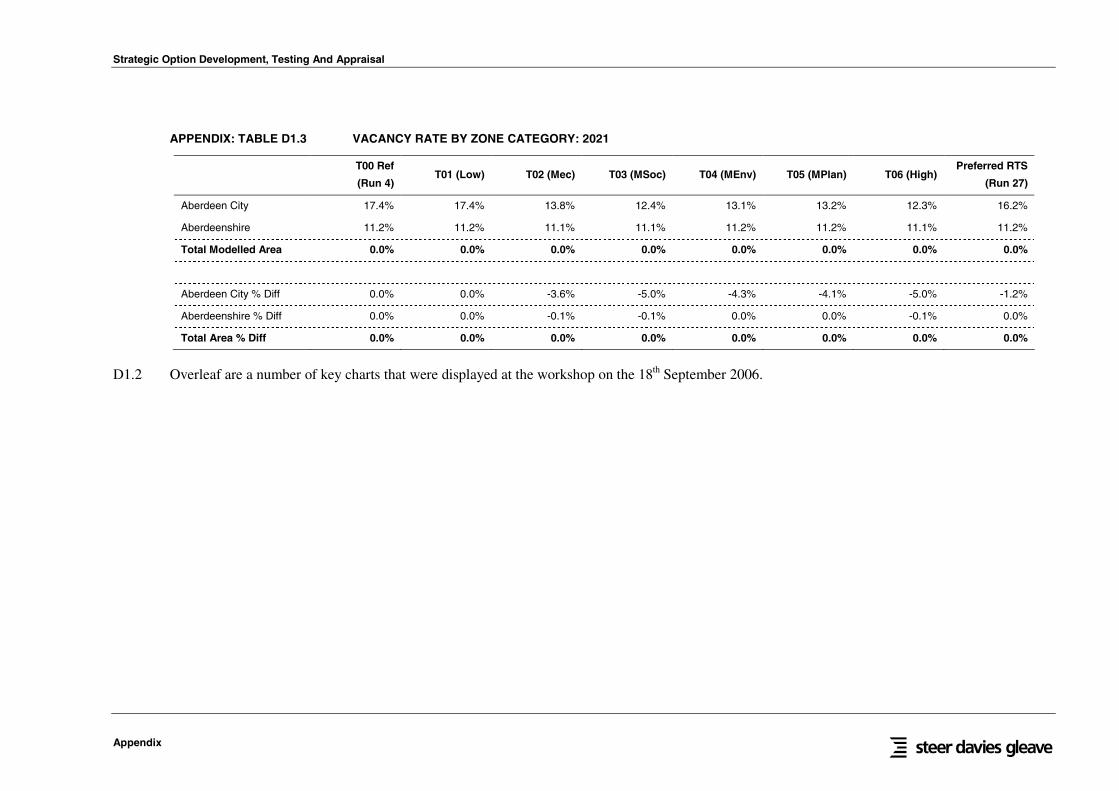
D1.1 The tables below show results for the simulated year 2021 for each of the economic indicators from the reference case, the six initial model runs andthe preferred option. Percentage changes as compared to the reference case are also shown. Note that the change in percentage points is shown intable D1.3, vacancy rates.
Total Area % Diff 0.0% 0.0% 0.0% 0.0% 0.0% 0.0% 0.0% 0.0%
D1.2 Overleaf are a number of key charts that were displayed at the workshop on the 18th September 2006.
Strategic Option Development, Testing and Appraisal
Appendix
APPENDIX: FIGURE D1.1 JOBS FILLED
2021 Jobs Filled: Comparison With T00 (Ref)
-12.0%
-10.0%
-8.0%
-6.0%
-4.0%
-2.0%
0.0%
2.0%
4.0%
T00
(Ref
)
T01
(Low
)
T02
(Mec
)
T03
(MS
oc)
T04
(ME
nv)
T05
(MP
lan)
T06
(Hig
h)
Aberdeen Aberdeenshire Total
Strategic Option Development, Testing And Appraisal
Appendix
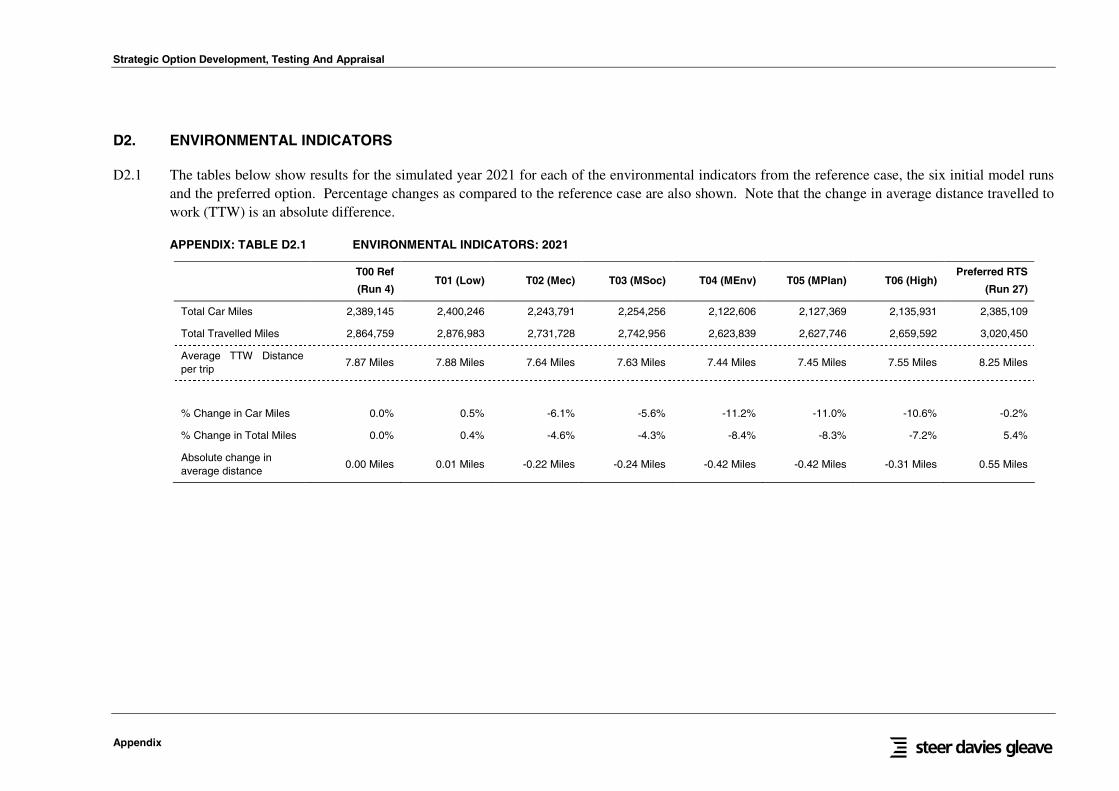
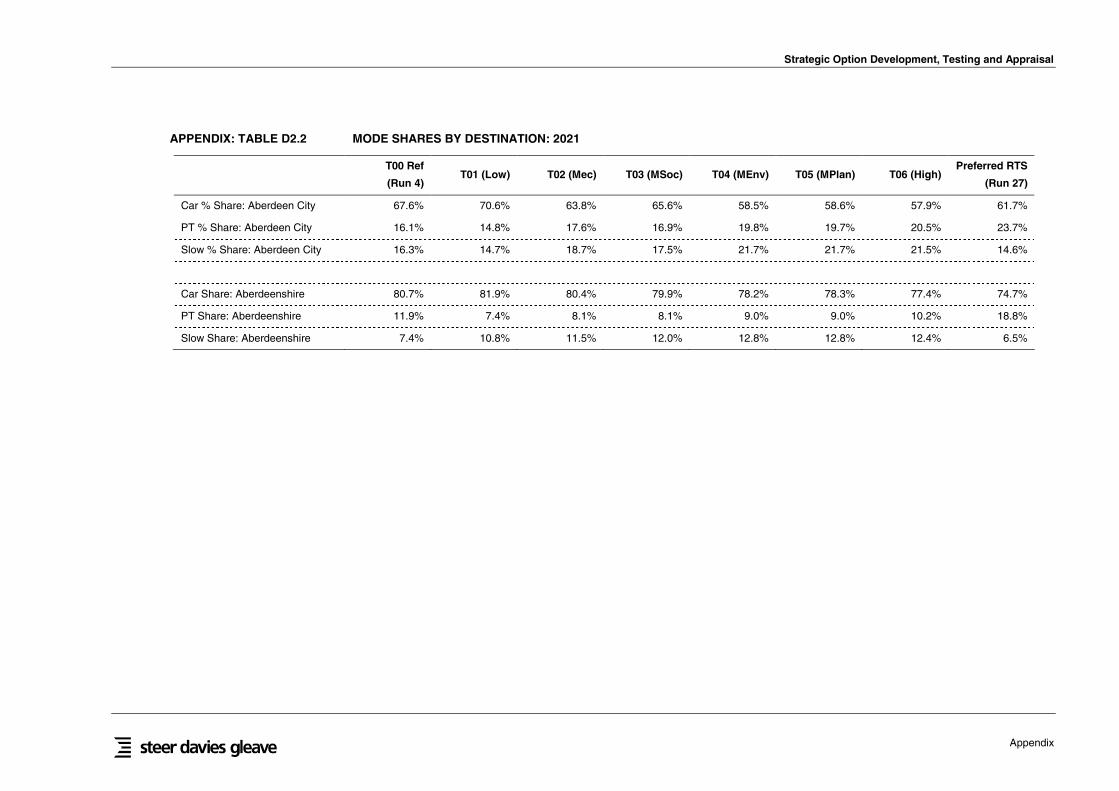
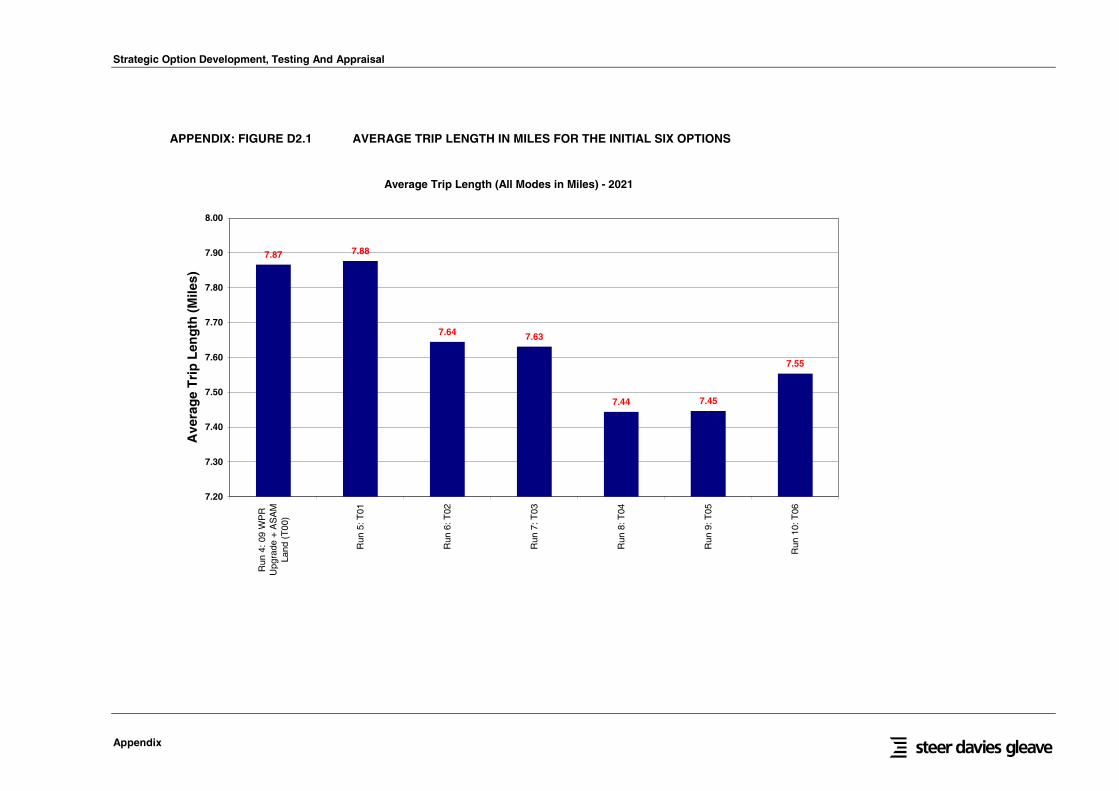
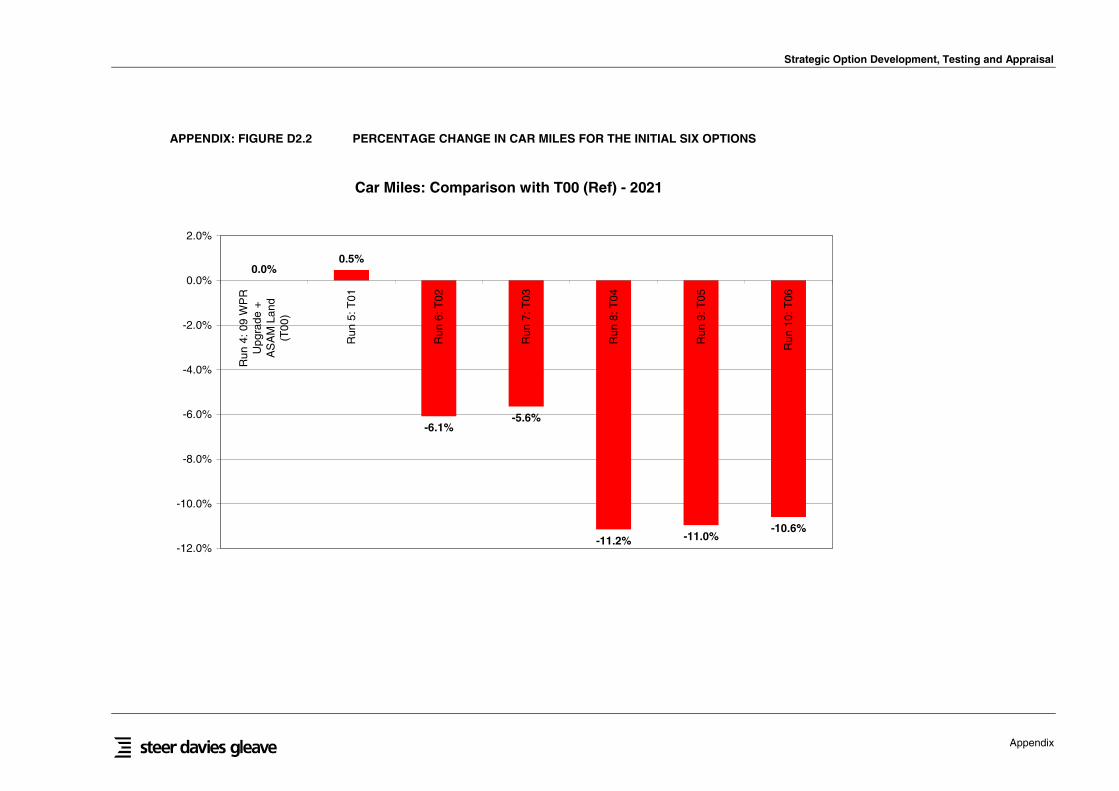
D2. ENVIRONMENTAL INDICATORS
D2.1 The tables below show results for the simulated year 2021 for each of the environmental indicators from the reference case, the six initial model runsand the preferred option. Percentage changes as compared to the reference case are also shown. Note that the change in average distance travelled towork (TTW) is an absolute difference.